· 0% 10 &% && 2 % &m : % & % &% ( * ' %'% ( " ; '% & % &0 &% && &%& & 2 % % 0 1 % % 0 # # % % ' %...
139
Morningstar ® Document Research ℠ FORM 10-K DANAHER CORP /DE/ - DHR Filed: February 21, 2018 (period: December 31, 2017) Annual report with a comprehensive overview of the company The information contained herein may not be copied, adapted or distributed and is not warranted to be accurate, complete or timely. The user assumes all risks for any damages or losses arising from any use of this information, except to the extent such damages or losses cannot be limited or excluded by applicable law. Past financial performance is no guarantee of future results.
Transcript of · 0% 10 &% && 2 % &m : % & % &% ( * ' %'% ( " ; '% & % &0 &% && &%& & 2 % % 0 1 % % 0 # # % % ' %...

Morningstar® Document Research℠
FORM 10-KDANAHER CORP /DE/ - DHR
Filed: February 21, 2018 (period: December 31, 2017)
Annual report with a comprehensive overview of the company
The information contained herein may not be copied, adapted or distributed and is not warranted to be accurate, complete or timely. The userassumes all risks for any damages or losses arising from any use of this information, except to the extent such damages or losses cannot belimited or excluded by applicable law. Past financial performance is no guarantee of future results.

UNITED STATES
SECURITIES AND EXCHANGE COMMISSIONWashington, D.C. 20549
____________________________________
FORM 10-K(Mark One)
ý ANNUAL REPORT PURSUANT TO SECTION 13 OR 15(d) OF THE SECURITIES EXCHANGE ACT OF 1934
For the fiscal year ended December 31, 2017
OR
o TRANSITION REPORT PURSUANT TO SECTION 13 OR 15(d) OF THE SECURITIES EXCHANGE ACT OF 1934
For the transition period from to
Commission File Number: 1-8089
____________________________________
DANAHER CORPORATION(Exact name of registrant as specified in its charter)
Delaware 59-1995548(State or Other Jurisdiction of
Incorporation or Organization) (I.R.S. Employer
Identification Number)
2200 Pennsylvania Ave. N.W., Suite 800W
Washington, D.C. 20037-1701(Address of Principal Executive Offices) (Zip Code)
Registrant’s telephone number, including area code: 202-828-0850Securities Registered Pursuant to Section 12(b) of the Act:
Title of Each Class Name of Each Exchange On Which Registered
Common Stock $.01 par value New York Stock Exchange€600,000,000 1.000% Senior Notes due 2019 New York Stock Exchange
€250,000,000 Floating Rate Senior Notes due 2022 New York Stock Exchange€800,000,000 1.700% Senior Notes due 2022 New York Stock Exchange€800,000,000 2.500% Senior Notes due 2025 New York Stock Exchange€600,000,000 1.200% Senior Notes due 2027 New York Stock Exchange
Securities registered pursuant to Section 12(g) of the Act:
NONE
(Title of Class)
Indicate by check mark if the registrant is a well-known seasoned issuer, as defined in Rule 405 of the Securities Act.
Yes ý No ¨
Source: DANAHER CORP /DE/, 10-K, February 21, 2018 Powered by Morningstar® Document Research℠The information contained herein may not be copied, adapted or distributed and is not warranted to be accurate, complete or timely. The user assumes all risks for any damages or losses arising from any use of this information,except to the extent such damages or losses cannot be limited or excluded by applicable law. Past financial performance is no guarantee of future results.

Indicate by check mark if the registrant is not required to file reports pursuant to Section 13 or Section 15(d) of the Act.
Yes ̈ No ý
Indicate by check mark whether the Registrant (1) has filed all reports required to be filed by Section 13 or 15(d) of the Securities Exchange Act of 1934during the preceding 12 months (or for such shorter period that the Registrant was required to file such reports) and (2) has been subject to such filingrequirements for the past 90 days. Yes ý No ¨
Indicate by check mark whether the registrant has submitted electronically and posted on its corporate Web site, if any, every Interactive Data File required tobe submitted and posted pursuant to Rule 405 of Regulation S-T during the preceding 12 months (or for such shorter period that the registrant was required tosubmit and post such files). Yes ý No ¨
Indicate by check mark if disclosure of delinquent filers pursuant to Item 405 of Regulation S-K is not contained herein, and will not be contained, to the bestof registrant’s knowledge, in definitive proxy or information statements incorporated by reference in Part III of this Form 10-K or any amendment to this Form10-K .̈
Indicate by check mark whether the registrant is a large accelerated filer, an accelerated filer, a non-accelerated filer, a smaller reporting company, or anemerging growth company. See the definitions of “large accelerated filer,” “accelerated filer,” “smaller reporting company” and “emerging growth company”in Rule 12b-2 of the Exchange Act. (Check one):
Large accelerated filer ý Accelerated filer o Non-accelerated filer o (Do not check if a smaller reporting company) Smaller reporting company o Emerging growth company o
If an emerging growth company, indicate by check mark if the registrant has elected not to use the extended transition period for complying with any new orrevised financial accounting standards provided pursuant to Section 13(a) of the Exchange Act. ¨
Indicate by check mark whether the registrant is a shell company (as defined in Rule 12b-2 of the Exchange Act)
Yes ̈ No ý
As of February 8, 2018, the number of shares of Registrant’s common stock outstanding was 697,569,470. The aggregate market value of common stock heldby non-affiliates of the Registrant on June 30, 2017 was $51.7 billion, based upon the closing price of the Registrant’s common stock as quoted on the NewYork Stock Exchange on such date.
EXHIBIT INDEX APPEARS ON PAGE 113
____________________________________DOCUMENTS INCORPORATED BY REFERENCE
Part III incorporates certain information by reference from the Registrant’s proxy statement for its 2018 annual meeting of shareholders to be filed pursuant toRegulation 14A within 120 days after Registrant’s fiscal year-end. With the exception of the sections of the 2018 Proxy Statement specifically incorporatedherein by reference, the 2018 Proxy Statement is not deemed to be filed as part of this Form 10-K.
Source: DANAHER CORP /DE/, 10-K, February 21, 2018 Powered by Morningstar® Document Research℠The information contained herein may not be copied, adapted or distributed and is not warranted to be accurate, complete or timely. The user assumes all risks for any damages or losses arising from any use of this information,except to the extent such damages or losses cannot be limited or excluded by applicable law. Past financial performance is no guarantee of future results.

TABLE OF CONTENTS
PAGE
INFORMATION RELATING TO FORWARD-LOOKING STATEMENTS 1
PART I Item 1. Business 1 Item 1A. Risk Factors 12 Item 1B. Unresolved Staff Comments 25 Item 2. Properties 25 Item 3. Legal Proceedings 26 Item 4. Mine Safety Disclosures 26 Executive Officers of the Registrant 26
PART II
Item 5. Market for Registrant’s Common Equity, Related Stockholder Matters and Issuer Purchases of Equity
Securities28
Item 6. Selected Financial Data 29 Item 7. Management’s Discussion and Analysis of Financial Condition and Results of Operations 30 Item 7A. Quantitative and Qualitative Disclosures About Market Risk 56 Item 8. Financial Statements and Supplementary Data 57 Item 9. Changes in and Disagreements with Accountants on Accounting and Financial Disclosure 110 Item 9A. Controls and Procedures 110 Item 9B. Other Information 110
PART III Item 10. Directors, Executive Officers and Corporate Governance 110 Item 11. Executive Compensation 110 Item 12. Security Ownership of Certain Beneficial Owners and Management and Related Stockholder Matters 111 Item 13. Certain Relationships and Related Transactions, and Director Independence 111 Item 14. Principal Accountant Fees and Services 111
PART IV Item 15. Exhibits and Financial Statement Schedules 112 Item 16. Form 10-K Summary 112
Source: DANAHER CORP /DE/, 10-K, February 21, 2018 Powered by Morningstar® Document Research℠The information contained herein may not be copied, adapted or distributed and is not warranted to be accurate, complete or timely. The user assumes all risks for any damages or losses arising from any use of this information,except to the extent such damages or losses cannot be limited or excluded by applicable law. Past financial performance is no guarantee of future results.

INFORMATION RELATING TO FORWARD-LOOKING STATEMENTS
Certain statements included or incorporated by reference in this Annual Report, in other documents we file with or furnish to the Securities and ExchangeCommission (“SEC”), in our press releases, webcasts, conference calls, materials delivered to shareholders and other communications, are “forward-lookingstatements” within the meaning of the U.S. federal securities laws. All statements other than historical factual information are forward-looking statements,including without limitation statements regarding: projections of revenue, expenses, profit, profit margins, tax rates, tax provisions, cash flows, pension andbenefit obligations and funding requirements, our liquidity position or other projected financial measures; management’s plans and strategies for futureoperations, including statements relating to anticipated operating performance, cost reductions, restructuring activities, new product and servicedevelopments, competitive strengths or market position, acquisitions and the integration thereof, divestitures, spin-offs, split-offs or other distributions,strategic opportunities, securities offerings, stock repurchases, dividends and executive compensation; growth, declines and other trends in markets we sellinto; new or modified laws, regulations and accounting pronouncements; regulatory approvals; outstanding claims, legal and regulatory proceedings, taxaudits and assessments and other contingent liabilities; foreign currency exchange rates and fluctuations in those rates; general economic and capital marketsconditions; the timing of any of the foregoing; assumptions underlying any of the foregoing; and any other statements that address events or developmentsthat Danaher intends or believes will or may occur in the future. Terminology such as “believe,” “anticipate,” “should,” “could,” “intend,” “will,” “plan,”“expect,” “estimate,” “project,” “target,” “may,” “possible,” “potential,” “forecast” and “positioned” and similar references to future periods are intended toidentify forward-looking statements, although not all forward-looking statements are accompanied by such words. Forward-looking statements are based onassumptions and assessments made by our management in light of their experience and perceptions of historical trends, current conditions, expected futuredevelopments and other factors they believe to be appropriate. These forward-looking statements are subject to a number of risks and uncertainties, includingbut not limited to the risks and uncertainties set forth under “Item 1A. Risk Factors” in this Annual Report.
Forward-looking statements are not guarantees of future performance and actual results may differ materially from the results, developments and businessdecisions contemplated by our forward-looking statements. Accordingly, you should not place undue reliance on any such forward-looking statements.Forward-looking statements speak only as of the date of the report, document, press release, webcast, call, materials or other communication in which they aremade. Except to the extent required by applicable law, we do not assume any obligation to update or revise any forward-looking statement, whether as aresult of new information, future events and developments or otherwise.
In this Annual Report, the terms “Danaher” or the “Company” refer to Danaher Corporation, Danaher Corporation and its consolidated subsidiaries or theconsolidated subsidiaries of Danaher Corporation, as the context requires. Unless otherwise indicated, all financial data in this Annual Report refer tocontinuing operations only.
PART I
ITEM 1. BUSINESSGeneralDanaher Corporation designs, manufactures and markets professional, medical, industrial and commercial products and services, which are typicallycharacterized by strong brand names, innovative technology and major market positions. Danaher’s research and development, manufacturing, sales,distribution, service and administrative facilities are located in more than 60 countries. Danaher’s business consists of four segments: Life Sciences;Diagnostics; Dental; and Environmental & Applied Solutions. Danaher strives to create shareholder value primarily through three strategic priorities:
• enhancing its portfolio in attractive science and technology markets through strategic capital allocation;
• strengthening its competitive advantage through consistent application of the DANAHER BUSINESS SYSTEM (“DBS”) tools; and
• consistently attracting and retaining exceptional talent.
Danaher measures its progress against these strategic priorities over the long-term based primarily on financial metrics relating to revenue growth, profitmargin expansion, cash flow and capital returns.
The Company’s businesses use a set of growth, lean and leadership tools and processes, known as the DANAHER BUSINESS SYSTEM, which are designed tocontinuously improve business performance in the critical areas of quality, delivery, cost, growth and innovation. Within the DBS framework, the Companypursues a number of ongoing strategic initiatives relating to
1
Source: DANAHER CORP /DE/, 10-K, February 21, 2018 Powered by Morningstar® Document Research℠The information contained herein may not be copied, adapted or distributed and is not warranted to be accurate, complete or timely. The user assumes all risks for any damages or losses arising from any use of this information,except to the extent such damages or losses cannot be limited or excluded by applicable law. Past financial performance is no guarantee of future results.

customer insight generation, product development and commercialization, global sourcing of materials and services, manufacturing improvement and salesand marketing impact.
To further these objectives, the Company also acquires businesses that either strategically fit within its existing business portfolio or expand its portfolio intoa new and attractive business area. Given the rapid pace of technological development and the specialized expertise typical of Danaher’s served markets,acquisitions also provide the Company access to important new technologies and domain expertise. Danaher believes there are many acquisitionopportunities available within its targeted markets. The extent to which Danaher consummates and effectively integrates appropriate acquisitions will affectits overall growth and operating results. Danaher also continually assesses the strategic fit of its existing businesses and may dispose of businesses that aredeemed not to fit with its strategic plan or are not achieving the desired return on investment.
Danaher Corporation, originally DMG, Inc., was organized in 1969 as a Massachusetts real estate investment trust. In 1978 it was reorganized as a Floridacorporation under the name Diversified Mortgage Investors, Inc. which in a second reorganization in 1980 became a subsidiary of a newly created holdingcompany named DMG, Inc. DMG, Inc. adopted the name Danaher in 1984 and was reincorporated as a Delaware corporation in 1986.
Sales in 2017 by geographic destination (geographic destination refers to the geographic area where the final sale to the Company’s unaffiliated customer ismade) were: North America, 40% (including 37% in the United States); Europe, 28%; Asia/Australia, 24% and all other regions, 8%. For additionalinformation regarding sales by geography, refer to Note 19 to the Consolidated Financial Statements included in this Annual Report.
Reportable Segments
The table below describes the percentage of total annual revenues attributable to each of the four segments over each of the last three years endedDecember 31, 2017. For additional information regarding sales, operating profit and identifiable assets by segment, refer to Note 19 to the ConsolidatedFinancial Statements included in this Annual Report.
2017 2016 2015
Life Sciences 31% 32% 23%Diagnostics 32% 30% 33%Dental 15% 16% 19%Environmental & Applied Solutions 22% 22% 25%
LIFE SCIENCESThe Company’s Life Sciences segment offers a broad range of research tools that scientists use to study the basic building blocks of life, including genes,proteins, metabolites and cells, in order to understand the causes of disease, identify new therapies and test new drugs and vaccines. The segment, through itsPall Corporation (“Pall”) business, is also a leading provider of filtration, separation and purification technologies to the biopharmaceutical, food andbeverage, medical, aerospace, microelectronics and general industrial sectors. Sales in 2017 for this segment by geographic destination were: North America,34%; Europe, 32%; Asia/Australia, 29% and all other regions, 5%.
Danaher established the life sciences business in 2005 through the acquisition of Leica Microsystems and has expanded the business through numeroussubsequent acquisitions, including the acquisitions of AB Sciex and Molecular Devices in 2010, Beckman Coulter in 2011, Pall in 2015 and Phenomenex in2016. The Life Sciences segment consists of the following businesses.
Mass Spectrometry—The mass spectrometry business is a leading global provider of high-end mass spectrometers as well as related consumablechromatography columns and sample preparation extraction products. Mass spectrometry is a technique for identifying, analyzing and quantifying elements,chemical compounds and biological molecules, individually or in complex mixtures. The mass spectrometers utilize various combinations of quadrupole,time-of-flight and ion trap technologies. The business’ mass spectrometer systems and related products are used in numerous applications such as drugdiscovery and clinical development of therapeutics as well as in basic research, clinical testing, food and beverage quality testing and environmental testing.The business’ global services network provides implementation, validation, training and maintenance to support customer installations around the world.Typical users of these mass spectrometry and related products include molecular biologists, bioanalytical chemists, toxicologists, and forensic scientists aswell as quality assurance and quality control technicians. The business also provides high-performance bioanalytical measurement systems, includingmicroplate readers, automated cellular screening products and associated reagents, and imaging software. Typical users of these products include biologistsand chemists engaged in research and drug discovery, who use these products to determine electrical or chemical activity in cell samples.
2
Source: DANAHER CORP /DE/, 10-K, February 21, 2018 Powered by Morningstar® Document Research℠The information contained herein may not be copied, adapted or distributed and is not warranted to be accurate, complete or timely. The user assumes all risks for any damages or losses arising from any use of this information,except to the extent such damages or losses cannot be limited or excluded by applicable law. Past financial performance is no guarantee of future results.
Cellular Analysis, Lab Automation and Centrifugation—The business offers workflow instruments and consumables that help researchers analyze genomic,protein and cellular information. Key product areas include sample preparation equipment such as centrifugation and capillary electrophoresisinstrumentation and consumables; liquid handling automation instruments and associated consumables; flow cytometry instrumentation and associatedantibodies and reagents; and particle characterization instrumentation. Researchers use these products to study biological function in the pursuit of basicresearch, as well as therapeutic and diagnostic development. Typical users include pharmaceutical and biotechnology companies, universities, medicalschools and research institutions and in some cases industrial manufacturers.
Filtration—Danaher entered the filtration, separation and purification technologies segment in 2015 through the acquisition of Pall. Pall is a leadingprovider of products used to remove solid, liquid and gaseous contaminants from a variety of liquids and gases, consisting primarily of filtration consumablesand to a lesser extent systems that incorporate filtration consumables and associated hardware. Pall’s core materials and technologies can be applied in manyways to solve complex fluid separation challenges, and are sold across a wide array of applications in two primary business groups:
• Life Sciences. Pall’s life sciences technologies facilitate the process of drug discovery, development, regulatory validation and production and aresold to biopharmaceutical, food and beverage and medical customers. In the biopharmaceutical area, the business sells a broad line of filtration andpurification technologies, single use bioreactors and associated accessories, hardware and engineered systems primarily to pharmaceutical andbiopharmaceutical companies for use in the development and commercialization of chemically synthesized and biologically derived drugs, plasmaand vaccines. Biotechnology drugs, plasma and biologically derived vaccines in particular are filtration and purification intensive and represent asignificant area of growth for Pall in the biopharmaceutical area. The business also serves the filtration needs of the food and beverage markets,helping customers ensure the quality and safety of their products while lowering operating costs and minimizing waste. In the medical area,hospitals use the Company’s breathing circuit and intravenous filters and water filters to help control the spread of infections.
• Industrial. Virtually all of the raw materials, process fluids and waste streams that course through industry are candidates for multiple stages offiltration, separation and purification. In addition, most of the machines used in complex production processes require filtration to protect sensitiveparts from degradation due to contamination. Pall’s industrial technologies enhance the quality and efficiency of manufacturing processes andprolong equipment life in applications such as semiconductor equipment, airplanes, oil refineries, power generation turbines, petrochemical plants,municipal water plants and mobile mining equipment. Within these end-markets, demand is driven by end-users and original equipmentmanufacturers (“OEM”) seeking to improve product performance, increase production and efficiency, reduce operating costs, extend the life of theirequipment, conserve water and meet environmental regulations.
Microscopy—The microscopy business is a leading global provider of professional microscopes designed to capture, manipulate and preserve images andenhance the user’s visualization and analysis of microscopic structures. The Company’s microscopy products include laser scanning (confocal) microscopes,compound microscopes and related equipment, surgical and other stereo microscopes, and specimen preparation products for electron microscopy. Typicalusers of these products include research, medical and surgical professionals operating in research and pathology laboratories, academic settings and surgicaltheaters.
Customers served by the Life Sciences segment select products based on a number of factors, including product quality and reliability, the product’s capacityto enhance productivity, innovation (particularly productivity and sensitivity improvements), product performance and ergonomics, access to a service andsupport network and the other factors described under “—Competition.” The life sciences business generally markets its products under the BECKMANCOULTER, LEICA MICROSYSTEMS, MOLECULAR DEVICES, PALL, PHENOMENEX and SCIEX brands. Manufacturing facilities are located in NorthAmerica, Europe, Asia and Australia. The business sells to customers through direct sales personnel and independent distributors.
DIAGNOSTICSThe Company’s Diagnostics segment offers analytical instruments, reagents, consumables, software and services that hospitals, physicians’ offices, referencelaboratories and other critical care settings use to diagnose disease and make treatment decisions. Sales in 2017 for this segment by geographic destinationwere: North America, 39%; Europe, 23%; Asia/Australia, 29% and all other regions, 9%.
Danaher established the diagnostics business in 2004 through the acquisition of Radiometer and expanded the business through numerous subsequentacquisitions, including the acquisitions of Vision Systems in 2006, Genetix in 2009, Beckman Coulter in 2011, Iris International and Aperio Technologies in2012, HemoCue in 2013, Devicor Medical Products in 2014, the clinical
3
Source: DANAHER CORP /DE/, 10-K, February 21, 2018 Powered by Morningstar® Document Research℠The information contained herein may not be copied, adapted or distributed and is not warranted to be accurate, complete or timely. The user assumes all risks for any damages or losses arising from any use of this information,except to the extent such damages or losses cannot be limited or excluded by applicable law. Past financial performance is no guarantee of future results.

microbiology business of Siemens Healthcare Diagnostics in 2015 and Cepheid in 2016. The diagnostics business consists of the clinical laboratory (orclinical lab), molecular, critical care and anatomical pathology diagnostics businesses.
Clinical Lab Diagnostics—The clinical lab business is a leading manufacturer and marketer of biomedical testing instruments, systems and relatedconsumables that are used to evaluate and analyze samples made up of body fluids, cells and other substances. The information generated is used to diagnosedisease, monitor and guide treatment and therapy, assist in managing chronic disease and assess patient status in hospital, outpatient and physicians’ officesettings. The business offers the following products:
• chemistry systems use electrochemical detection and chemical reactions with patient samples to detect and quantify substances of diagnostic interestin blood, urine and other body fluids. Commonly performed tests include glucose, cholesterol, triglycerides, electrolytes, proteins and enzymes, aswell as tests to detect urinary tract infections and kidney and bladder disease.
• immunoassay systems also detect and quantify biochemicals of diagnostic interest (such as proteins and hormones) in body fluids, particularly incircumstances where more specialized diagnosis is required. Commonly performed immunoassay tests assess thyroid function, screen and monitor forcancer and cardiac risk and provide important information in fertility and reproductive testing.
• hematology and flow cytometry products are used for cellular analysis. The business’ hematology systems use principles of physics, optics,electronics and chemistry to separate cells of diagnostic interest and then quantify and characterize them, allowing clinicians to study formedelements in blood (such as red and white blood cells and platelets). The business’ flow cytometry products rapidly sort, identify, categorize andcharacterize multiple types of cells in suspension, allowing clinicians to determine cell types and characteristics and analyze specific cellpopulations based on molecular differences which is critical to HIV and leukemia diagnosis and monitoring.
• microbiology systems are used for the identification of bacteria and antibiotic susceptibility testing (ID/AST) from human clinical samples, to detectand quantify bacteria related to microbial infections in urine, blood, and other body fluids, and to detect infections such as urinary tract infections,pneumonia and wound infections. The business’ technology enables direct testing of clinical isolates to ensure reliable detection of resistance toantibiotics.
• automation systems reduce manual operation and associated cost and errors from the pre-analytical through post-analytical stages including samplebarcoding/information tracking, centrifugation, aliquotting, storage and conveyance. These systems along with the analyzers described above arecontrolled through laboratory level software that enables laboratory managers to monitor samples, results and lab efficiency.
• molecular diagnostics products, which are derived from Danaher’s acquisition of Cepheid in 2016, including biomedical testing instruments,systems and related consumables that enable DNA-based testing for organisms and genetic-based diseases in both clinical and non-clinical markets.These products integrate and automate the complicated and time-intensive steps associated with DNA-based testing (including sample preparationand DNA amplification and detection) to allow the testing to be performed in both laboratory and non-laboratory environments with minimaltraining and infrastructure. These products also include systems which commonly test for health care-associated infections, respiratory disease,sexual health and virology.
Typical users of the segment’s clinical lab products include hospitals, physician’s offices, veterinary laboratories, reference laboratories and pharmaceuticalclinical trial laboratories.
Critical Care Diagnostics—The critical care diagnostics business is a leading worldwide provider of instruments, software and related consumables andservices that are used in both laboratory and point-of-care environments to rapidly measure critical parameters, including blood gases, electrolytes,metabolites and cardiac markers, as well as for anemia and high-sensitivity glucose testing. Typical users of these products include hospital centrallaboratories, intensive care units, hospital operating rooms, hospital emergency rooms, physician’s office laboratories and blood banks.
Anatomical Pathology Diagnostics—The anatomical pathology diagnostics business is a leader in the anatomical pathology industry, offering acomprehensive suite of instrumentation and related consumables used across the entire workflow of a pathology laboratory. The anatomical pathologydiagnostics products include chemical and immuno-staining instruments, reagents, antibodies and consumables; tissue embedding, processing and slicing(microtomes) instruments and related reagents and consumables; slide coverslipping and slide/cassette marking instruments; imaging instrumentationincluding slide scanners, microscopes, cameras; software solutions to store, share and analyze pathology images digitally and minimally invasive, vacuum-assisted breast biopsy collection instruments. Typical users of these products include pathologists, lab managers and researchers.
4
Source: DANAHER CORP /DE/, 10-K, February 21, 2018 Powered by Morningstar® Document Research℠The information contained herein may not be copied, adapted or distributed and is not warranted to be accurate, complete or timely. The user assumes all risks for any damages or losses arising from any use of this information,except to the extent such damages or losses cannot be limited or excluded by applicable law. Past financial performance is no guarantee of future results.

Customers in the diagnostics industry select products based on a number of factors, including product quality and reliability, the scope of tests that can beperformed, the accuracy and speed of the product, the product’s ability to enhance productivity, ease of use, total cost of ownership and access to a highlyqualified service and support network as well as the other factors described under “—Competition.” The diagnostics business generally markets its productsunder the APERIO, BECKMAN COULTER, CEPHEID, HEMOCUE, IRIS, LEICA BIOSYSTEMS, MAMMATOME, RADIOMETER and SURGIPATH brands.Manufacturing facilities are located in North America, Europe, Asia and Australia. The business sells to customers primarily through direct sales personneland, to a lesser extent, through independent distributors.
DENTALThe Company’s Dental segment provides products that are used to diagnose, treat and prevent disease and ailments of the teeth, gums and supporting bone,as well as to improve the aesthetics of the human smile. The Company is a leading worldwide provider of a broad range of dental consumables, equipmentand services, and is dedicated to driving technological innovations that help dental professionals improve clinical outcomes and enhance productivity. Salesin 2017 for this segment by geographic destination were: North America, 49%; Europe, 30%; Asia/Australia, 15% and all other regions, 6%.
Danaher entered the dental business in 2004 through the acquisitions of KaVo and Gendex and has enhanced its geographic coverage and product andservice breadth through subsequent acquisitions, including the acquisition of Sybron Dental Specialties in 2006, PaloDEx Group Oy in 2009 and NobelBiocare Holding AG (“Nobel Biocare”) in 2014. Today, the dental businesses develop, manufacture and market the following dental consumables and dentalequipment:
• implant systems, dental prosthetics and associated treatment planning software;
• orthodontic bracket systems and lab products;
• endodontic systems and related consumables;
• restorative materials and instruments including rotary burrs, impression materials, bonding agents and cements;
• infection prevention products;
• digital imaging systems and software and other visualization and magnification systems;
• air and electric powered handpieces and associated consumables; and
• treatment units.
Typical customers and users of these products include general dentists, dental specialists, dental hygienists, dental laboratories and other oral healthprofessionals, as well as educational, medical and governmental entities. Dental professionals choose dental products based on a number of factors includingproduct performance, innovation, the product’s capacity to enhance productivity and the other factors described under “—Competition.” The dental productsare marketed primarily under the DEXIS, iCAT, IMPLANT DIRECT, INSTRUMENTARIUM DENTAL, KAVO, KERR, NOBEL BIOCARE, ORMCO,PELTON & CRANE, PENTRON, SOREDEX, SYBRON ENDO and TOTAL CARE brands. Manufacturing facilities are located in North America, Europe, Asiaand Latin America. Sales are primarily made through independent distributors and, to a lesser extent, through direct sales personnel.
ENVIRONMENTAL & APPLIED SOLUTIONSThe Company’s Environmental & Applied Solutions segment products and services help protect important resources and keep global food and water suppliessafe. Sales in 2017 for this segment by geographic destination were: North America, 42%; Europe, 28%; Asia/Australia, 17% and all other regions, 13%. TheCompany’s Environmental & Applied Solutions segment consists of the following lines of business.
Water Quality—The Company’s water quality business provides instrumentation, services and disinfection systems to help analyze, treat and manage thequality of ultra-pure, potable, industrial, waste, ground, source and ocean water in residential, commercial, municipal, industrial and natural resourceapplications. Danaher entered the water quality sector in the late 1990’s through the acquisitions of Dr. Lange and Hach Company, and has enhanced thegeographic coverage and capabilities of its products and services through subsequent acquisitions, including the acquisition of Trojan Technologies Inc. in2004 and ChemTreat, Inc. in 2007. The water quality business designs, manufactures and markets:
• a wide range of analytical instruments, software and related consumables and services that detect and measure chemical, physical, andmicrobiological parameters in ultra-pure, potable, industrial, waste, ground, source and ocean water;
5
Source: DANAHER CORP /DE/, 10-K, February 21, 2018 Powered by Morningstar® Document Research℠The information contained herein may not be copied, adapted or distributed and is not warranted to be accurate, complete or timely. The user assumes all risks for any damages or losses arising from any use of this information,except to the extent such damages or losses cannot be limited or excluded by applicable law. Past financial performance is no guarantee of future results.

• ultraviolet disinfection systems, which disinfect billions of gallons of municipal, industrial and consumer water every day; and
• industrial water treatment solutions, including chemical treatment solutions intended to address corrosion, scaling and biological growth problemsin boiler, cooling water and industrial wastewater applications as well as associated analytical services.
Typical users of these products and services include professionals in municipal drinking water and wastewater treatment plants and industrial process waterand wastewater treatment facilities, third-party testing laboratories and environmental field operations. Customers in these industries choose suppliers basedon a number of factors including the customer’s existing supplier relationships, application expertise, product performance and ease of use, thecomprehensiveness of the supplier’s product offering, after-sales service and support and the other factors described under “—Competition.” The waterquality business provides products under a variety of brands, including CHEMTREAT, HACH, MCCROMETER and TROJAN TECHNOLOGIES.Manufacturing facilities are located in North America, Europe, Asia and Latin America. Sales are made through the business’ direct sales personnel, e-commerce, independent representatives and independent distributors.
Product Identification—The Company’s product identification business provides equipment, software, services and consumables for various color andappearance management, packaging design and quality management, printing, marking, coding and traceability applications for consumer, pharmaceuticaland industrial products. Danaher entered the product identification market through the acquisition of Videojet in 2002, and has expanded the product andgeographic coverage through various subsequent acquisitions, including the acquisitions of Willett International Limited in 2003, Linx PrintingTechnologies PLC in 2005, EskoArtwork in 2011, X-Rite in 2012, Laetus in 2015 and Advanced Vision Technology Limited (“AVT”) in 2017. The productidentification businesses innovate, design, manufacture, and market the following products and services:
• the business provides innovative color and appearance solutions through standards, software, measurement devices and related services. Thebusiness’ expertise in inspiring, virtualizing, selecting, specifying, formulating and measuring color and appearance helps users improve the qualityand relevance of their products and reduces costs.
• the business is a leading global provider of software for online collaboration, three-dimensional virtualization, workflow automation, qualityapprovals and prepress processes to manage structural design, artwork creation, color and product information for branded packaging and marketingmaterials. Its packaging solutions help consumer goods manufacturers improve their business processes, shorten time to market, and reduce costsacross internal departments and external suppliers.
• the business provides flexographic computer-to-plate imaging equipment, solutions for print process control, press control, quality assurance, anddigital finishing systems for the packaging, labels and commercial print industries. Its automation, print process and press control solutions helppackaging manufacturers reduce lead time and satisfy their customers’ demands for smaller, more frequent print jobs.
• the business provides a variety of equipment and solutions used to give products unique identities by printing date, lot and bar codes and otherinformation on primary and secondary packaging, applying high-quality alphanumeric codes, logos and graphics to a wide range of surfaces at avariety of production line speeds, angles and locations on a product or package. Its vision inspection and track-and-trace solutions also helppharmaceutical and consumer goods manufacturers safeguard the authenticity of their products through supply chains.
Typical users of these products include manufacturers of consumer goods, pharmaceuticals, paints, plastics and textiles, retailers, graphic design firms, andpackaging printers and converters. Customers in these industries choose suppliers based on a number of factors, including domain experience, speed andaccuracy, ease of connection to the internet and other software systems, equipment uptime and reliable operation without interruption, ease of maintenance,service coverage and the other factors described under “—Competition.” The product identification products are primarily marketed under the AVT, ESKO,LAETUS, LINX, MEDIABEACON, PANTONE, VIDEOJET and X-RITE brands. Manufacturing facilities are located in North America, Europe, Latin America,and Asia. Sales are generally made through the business’ direct sales personnel, independent distributors and e-commerce.
************************************
6
Source: DANAHER CORP /DE/, 10-K, February 21, 2018 Powered by Morningstar® Document Research℠The information contained herein may not be copied, adapted or distributed and is not warranted to be accurate, complete or timely. The user assumes all risks for any damages or losses arising from any use of this information,except to the extent such damages or losses cannot be limited or excluded by applicable law. Past financial performance is no guarantee of future results.

The following discussion includes information common to all of Danaher’s segments.
Materials
The Company’s manufacturing operations employ a wide variety of raw materials, including metallic-based components, electronic components, chemicals,plastics and other petroleum-based products. Prices of oil and gas also affect the Company’s costs for freight and utilities. The Company purchases rawmaterials from a large number of independent sources around the world. No single supplier is material; although for some components that require particularspecifications or regulatory or other qualifications there may be a single supplier or a limited number of suppliers that can readily provide such components.The Company utilizes a number of techniques to address potential disruption in and other risks relating to its supply chain, including in certain cases the useof safety stock, alternative materials and qualification of multiple supply sources. During 2017 the Company had no raw material shortages that had amaterial effect on the business. For a further discussion of risks related to the materials and components required for the Company’s operations, refer to “Item1A. Risk Factors.”
Intellectual Property
The Company owns numerous patents, trademarks, copyrights, trade secrets and licenses to intellectual property owned by others. Although in aggregate theCompany’s intellectual property is important to its operations, the Company does not consider any single patent, trademark, copyright, trade secret or license(or any related group of any such items) to be of material importance to any segment or to the business as a whole. From time to time the Company engages inlitigation to protect its intellectual property rights. For a discussion of risks related to the Company’s intellectual property, refer to “Item 1A. Risk Factors.”All capitalized brands and product names throughout this document are trademarks owned by, or licensed to, Danaher.
Competition
Although the Company’s businesses generally operate in highly competitive markets, the Company’s competitive position cannot be determined accuratelyin the aggregate or by segment since none of its competitors offer all of the same product and service lines or serve all of the same markets as the Companydoes. Because of the range of the products and services the Company sells and the variety of markets it serves, the Company encounters a wide variety ofcompetitors, including well-established regional competitors, competitors who are more specialized than it is in particular markets, as well as largercompanies or divisions of larger companies with substantial sales, marketing, research and financial capabilities. The Company is facing increasedcompetition in a number of its served markets as a result of the entry of new, large companies into certain markets, the entry of competitors based in low-costmanufacturing locations, and increasing consolidation in particular markets. The number of competitors varies by product and service line. Managementbelieves that the Company has a market leadership position in many of the markets it serves. Key competitive factors vary among the Company’s businessesand product and service lines, but include the specific factors noted above with respect to each particular business and typically also include price, quality,delivery speed, service and support, innovation, distribution network, breadth of product, service and software offerings and brand name recognition. For adiscussion of risks related to competition, refer to “Item 1A. Risk Factors.”
Seasonal Nature of Business
General economic conditions impact the Company’s business and financial results, and certain of its businesses experience seasonal and other trends relatedto the industries and end-markets that they serve. For example, European sales are often weaker in the summer months and medical and capital equipmentsales are often stronger in the fourth quarter. However, as a whole, the Company is not subject to material seasonality.
Working Capital
The Company maintains an adequate level of working capital to support its business needs. There are no unusual industry practices or requirements relatingto working capital items. In addition, the Company’s sales and payment terms are generally similar to those of its competitors.
7
Source: DANAHER CORP /DE/, 10-K, February 21, 2018 Powered by Morningstar® Document Research℠The information contained herein may not be copied, adapted or distributed and is not warranted to be accurate, complete or timely. The user assumes all risks for any damages or losses arising from any use of this information,except to the extent such damages or losses cannot be limited or excluded by applicable law. Past financial performance is no guarantee of future results.

Backlog
The Company defines backlog as firm orders from customers for products and services where the order will be fulfilled in the next 12 months. Backlog as ofDecember 31, 2017 and 2016 was approximately $2.7 billion and $2.3 billion, respectively. The Company expects that a large majority of the backlog as ofDecember 31, 2017 will be delivered to customers within three to four months of such date. Given the relatively short delivery periods and rapid inventoryturnover that are characteristic of most of the Company’s products and the shortening of product life cycles, the Company believes that backlog is indicativeof short-term revenue performance but not necessarily a reliable indicator of medium or long-term revenue performance.
Employee Relations
As of December 31, 2017, the Company employed approximately 67,000 persons, of whom approximately 23,000 were employed in the United States andapproximately 44,000 were employed outside of the United States. Of the United States employees, approximately 400 were hourly-rated, unionizedemployees. Outside the United States, the Company has government-mandated collective bargaining arrangements and union contracts in certain countries,particularly in Europe where many of the Company’s employees are represented by unions and/or works councils. For a discussion of risks related toemployee relations, refer to “Item 1A. Risk Factors.”
Research and Development
The following sets forth research and development (“R&D”) expenditures for the years ended December 31, by segment and in the aggregate ($ in millions):
2017 2016 2015
Life Sciences $ 295.5 $ 277.2 $ 201.3Diagnostics 471.2 367.8 351.3Dental 172.4 142.8 133.8Environmental & Applied Solutions 189.7 187.3 175.0Total $ 1,128.8 $ 975.1 $ 861.4
The Company conducts R&D activities for the purpose of developing new products, enhancing the functionality, effectiveness, ease of use and reliability ofits existing products and expanding the applications for which uses of its products are appropriate. The Company’s R&D efforts include internal initiativesand those that use licensed or acquired technology. The Company generally conducts R&D activities on a business-by-business basis, primarily in NorthAmerica, Europe and Asia, although it does conduct certain R&D activities on a centralized basis. The Company anticipates that it will continue to makesignificant expenditures for R&D as it seeks to provide a continuing flow of innovative products to maintain and improve its competitive position. For adiscussion of the risks related to the need to develop and commercialize new products and product enhancements, refer to “Item 1A. Risk Factors.” Customer-sponsored R&D was not significant in 2017, 2016 or 2015.
Government Contracts
Although the substantial majority of the Company’s revenue in 2017 was from customers other than governmental entities, each of Danaher’s segments hasagreements relating to the sale of products to government entities. As a result, the Company is subject to various statutes and regulations that apply tocompanies doing business with governments. For a discussion of risks related to government contracting requirements, refer to “Item 1A. Risk Factors.” Nomaterial portion of Danaher’s business is subject to renegotiation of profits or termination of contracts at the election of a government entity.
Regulatory Matters
The Company faces extensive government regulation both within and outside the United States relating to the development, manufacture, marketing, saleand distribution of its products and services. The following sections describe certain significant regulations that the Company is subject to. These are not theonly regulations that the Company’s businesses must comply with. For a description of the risks related to the regulations that the Company’s businesses aresubject to, refer to “Item 1A. Risk Factors.”
Environmental Laws and Regulations
For a discussion of the environmental laws and regulations that the Company’s operations, products and services are subject to and other environmentalcontingencies, refer to Note 16 to the Consolidated Financial Statements included in this Annual
8
Source: DANAHER CORP /DE/, 10-K, February 21, 2018 Powered by Morningstar® Document Research℠The information contained herein may not be copied, adapted or distributed and is not warranted to be accurate, complete or timely. The user assumes all risks for any damages or losses arising from any use of this information,except to the extent such damages or losses cannot be limited or excluded by applicable law. Past financial performance is no guarantee of future results.

Report. For a discussion of risks related to compliance with environmental and health and safety laws and risks related to past or future releases of, orexposures to, hazardous substances, refer to “Item 1A. Risk Factors.”
Medical Device and Other Health Care Regulations
Certain of the products of the Company’s subsidiaries are classified as medical devices under the United States Food, Drug, and Cosmetic Act (the “FDCA”).The FDCA requires these products, when sold in the United States, to be safe and effective for their intended use and to comply with the regulationsadministered by the United States Food and Drug Administration (“FDA”). These medical device products are also regulated by comparable agencies in othercountries where such products are sold.
The FDA’s regulatory requirements include:
• Establishment Registration. The Company’s applicable subsidiaries must register with the FDA each facility where regulated products are developedor manufactured. The FDA periodically inspects these facilities.
• Marketing Authorization. The Company’s applicable subsidiaries must obtain FDA clearance or approval to begin marketing a regulated, non-510(k)-exempted product in the United States. For some products, this clearance is obtained by submitting a 510(k) pre-market notification, whichgenerally provides data on the design and performance of the product to allow the FDA to determine substantial equivalence to a product already incommercial distribution in the United States. Other products must go through a formal pre-market approval process which includes the review ofnon-clinical laboratory studies, clinical investigations, and information on the design and manufacture of the device as well as the successfulcompletion of a pre-market approval inspection by the FDA.
• Quality Systems. The Company’s applicable subsidiaries are required to establish a quality management system that includes clearly definedprocesses and procedures for ensuring regulated products are developed, manufactured and distributed in accordance with applicable regulatoryrequirements and international standards. These subsidiaries also must establish processes and procedures for investigating and responding tocustomer complaints regarding the performance of regulated products.
• Labeling. The labeling for regulated products must contain specified information and in some cases, the FDA must review and approve the labelingand any quality assurance protocols specified in the labeling. The FDA and other federal, state and non-U.S. regulatory bodies (including the FederalTrade Commission, the Office of the Inspector General of the Department of Health and Human Services, the U.S. Department of Justice, and variousstate Attorneys General) also monitor the manner in which the Company’s subsidiaries promote and advertise their products. Although physiciansmay use their medical judgment to employ medical devices for indications other than those cleared or approved by the FDA, the FDA prohibitsmanufacturers from promoting products for such “off-label” uses.
• Imports and Exports. The FDCA establishes requirements for importing products into and exporting products from the United States. In general, anylimitations on importing and exporting products apply only to products that have not received U.S. marketing clearance or approval.
• Postmarket Reporting. After regulated products have been distributed to customers, the Company’s applicable subsidiaries may receive productcomplaints requiring them to investigate and report to the FDA certain events involving the products. These subsidiaries also must notify the FDAwhen they conduct recalls (known as field actions) involving their products.
In the European Union (“EU”), a single regulatory approval process exists, and conformity with the applicable legal requirements is represented by the CEmark. To obtain a CE mark, medical devices must meet minimum standards of performance, safety, and quality (known as the Essential Requirements), andthen, according to their classification, comply with one or more of a selection of conformity assessment routes. An organization accredited by an EU MemberState to certify whether a product meets the Essential Requirements, also known as a Notified Body, assesses the quality management systems of the device’smanufacturer and the device’s conformity to the essential and other requirements within the EU Medical Device or In Vitro Diagnostic (“IVD”) Directives.These EU Directives are being replaced by new sets of pan-EU regulations, which will reclassify medical device and IVD products and require more of thoseproducts to go through a formal Notified Body review of the product’s technical files in order to obtain CE marking in the future. Our medical devicecompanies are also subject to quality system audits by Notified Bodies for compliance and certification to the EU standards. The national regulatory agenciesof the EU countries (otherwise known as Competent Authorities), generally in the form of their ministries or departments of health, also oversee clinicalresearch for medical devices, can conduct their own compliance audits and are responsible for postmarket surveillance of products once they are placed onthe EU market. The Company’s applicable
9
Source: DANAHER CORP /DE/, 10-K, February 21, 2018 Powered by Morningstar® Document Research℠The information contained herein may not be copied, adapted or distributed and is not warranted to be accurate, complete or timely. The user assumes all risks for any damages or losses arising from any use of this information,except to the extent such damages or losses cannot be limited or excluded by applicable law. Past financial performance is no guarantee of future results.

subsidiaries are required to report device failures and injuries potentially related to product use to these authorities in a timely manner.
A number of other countries, including but not limited to Australia, Brazil, Canada, China and Japan, have also adopted or are in the process of adoptingregulations and standards for medical devices sold in those countries.
In addition to the U.S. Foreign Corrupt Practices Act, the U.K. Bribery Act and similar anti-bribery laws, the Company is also subject to various health carerelated laws regulating fraud and abuse, pricing and sales and marketing practices and the privacy and security of health information, including the UnitedStates federal regulations described below. Many states, foreign countries and supranational bodies have also adopted laws and regulations similar to, and insome cases more stringent than, the United States federal regulations discussed above and below.
• The Federal Anti-Kickback Statute prohibits persons from knowingly and willfully soliciting, offering, receiving or providing remuneration, directlyor indirectly, in exchange for or to induce either the referral of an individual, or the furnishing or arranging for a good or service, for which paymentmay be made under a federal health care program, such as Medicare or Medicaid.
• The Health Insurance Portability and Accountability Act of 1996 (“HIPAA”) prohibits knowingly and willfully (1) executing a scheme to defraudany health care benefit program, including private payors, or (2) falsifying, concealing or covering up a material fact or making any materially false,fictitious or fraudulent statement in connection with the delivery of or payment for health care benefits, items or services. In addition, HIPAA, asamended by the Health Information Technology for Economic and Clinical Health Act of 2009, also restricts the use and disclosure of patient-identifiable health information, mandates the adoption of standards relating to the privacy and security of patient-identifiable health informationand requires the reporting of certain security breaches with respect to such information.
• The Stark Law prohibits health care service providers from seeking reimbursement for providing certain services to a patient who was referred by aphysician who has certain types of direct or indirect financial relationships with the service provider.
• The False Claims Act imposes liability on any person or entity that, among other things, knowingly presents, or causes to be presented, a false orfraudulent claim for payment by a federal health care program. The qui tam provisions of the False Claims Act allow a private individual to bringactions on behalf of the federal government alleging that the defendant has submitted a false claim to the federal government, and to share in anymonetary recovery.
• The Physician Payments Sunshine Act requires manufacturers of medical devices covered under Medicare and Medicaid to record transfers of valueto physicians and teaching hospitals and to report this data to the Centers for Medicare and Medicaid Services for subsequent public disclosure.Similar reporting requirements have also been enacted on the state level, and an increasing number of countries worldwide either have adopted orare considering similar laws requiring transparency of interactions with health care professionals.
In addition:
• certain products of the Company’s subsidiaries utilize radioactive material, and the Company is subject to federal, state, local and non-U.S.regulations governing the management, storage, handling and disposal of these materials; and
• some of the in vitro diagnostic drugs-of-abuse assays and reagents of the Company’s subsidiaries contain small amounts of controlled substances,and as a result some of the Company’s facilities are inspected periodically by the United States Drug Enforcement Administration to ensure that theCompany properly handles, stores, and disposes of controlled substances in the manufacture of those products.
For a discussion of risks related to regulation by the FDA and comparable agencies of other countries, and the other regulatory regimes referenced above, referto “Item 1A. Risk Factors.”
Export/Import Compliance
The Company is required to comply with various U.S. export/import control and economic sanctions laws, including:
• the International Traffic in Arms Regulations administered by the U.S. Department of State, Directorate of Defense Trade Controls, which, amongother things, imposes license requirements on the export from the United States of defense articles and defense services listed on the U.S. MunitionsList;
10
Source: DANAHER CORP /DE/, 10-K, February 21, 2018 Powered by Morningstar® Document Research℠The information contained herein may not be copied, adapted or distributed and is not warranted to be accurate, complete or timely. The user assumes all risks for any damages or losses arising from any use of this information,except to the extent such damages or losses cannot be limited or excluded by applicable law. Past financial performance is no guarantee of future results.

• the Export Administration Regulations administered by the U.S. Department of Commerce, Bureau of Industry and Security, which, among otherthings, impose licensing requirements on the export, in-country transfer and re-export of certain dual-use goods, technology and software (which areitems that have both commercial and military, or proliferation applications);
• the regulations administered by the U.S. Department of Treasury, Office of Foreign Assets Control, which implement economic sanctions imposedagainst designated countries, governments and persons based on United States foreign policy and national security considerations; and
• the import regulatory activities of the U.S. Customs and Border Protection and other U.S. government agencies.
Other nations’ governments have implemented similar export/import control and economic sanction regulations, which may affect the Company’s operationsor transactions subject to their jurisdictions. For a discussion of risks related to export/import control and economic sanctions laws, refer to “Item 1A. RiskFactors.”
International Operations
The Company’s products and services are available worldwide, and its principal markets outside the United States are in Europe and Asia. The Company alsohas operations around the world, and this geographic diversity allows the Company to draw on the skills of a worldwide workforce, provides greater stabilityto its operations, allows the Company to drive economies of scale, provides revenue streams that may help offset economic trends that are specific toindividual economies and offers the Company an opportunity to access new markets for products. In addition, the Company believes that future growthdepends in part on its ability to continue developing products and sales models that successfully target emerging markets (also referred to in this AnnualReport as “high-growth markets”). The Company defines high-growth markets as developing markets of the world generally experiencing rapid growth ingross domestic product and infrastructure which includes Eastern Europe, the Middle East, Africa, Latin America and Asia (with the exception of Japan andAustralia).
The table below describes annual revenue derived from customers outside the United States as a percentage of total annual revenue for the years endedDecember 31, by segment and in the aggregate, based on geographic destination:
2017 2016 2015
Life Sciences 67% 68% 64%Diagnostics 63% 63% 63%Dental 55% 54% 54%Environmental & Applied Solutions 61% 61% 60%Total 63% 62% 61%
The table below describes property, plant and equipment, net, located outside the United States as of December 31, as a percentage of total property, plantand equipment, net, by segment and in the aggregate:
2017 2016 2015
Life Sciences 61% 48% 41%Diagnostics 56% 51% 54%Dental 48% 51% 57%Environmental & Applied Solutions 35% 39% 39%Total 54% 49% 48%
For additional information related to revenues and long-lived assets by country, refer to Note 19 to the Consolidated Financial Statements included in thisAnnual Report and for information regarding deferred taxes by geography, refer to Note 12 to the Consolidated Financial Statements included in this AnnualReport.
The manner in which the Company’s products and services are sold outside the United States differs by business and by region. Most of the Company’s salesin non-U.S. markets are made by its subsidiaries located outside the United States, though the Company also sells directly from the United States into non-U.S. markets through various representatives and distributors and, in some cases, directly. In countries with low sales volumes, the Company generally sellsthrough representatives and distributors.
11
Source: DANAHER CORP /DE/, 10-K, February 21, 2018 Powered by Morningstar® Document Research℠The information contained herein may not be copied, adapted or distributed and is not warranted to be accurate, complete or timely. The user assumes all risks for any damages or losses arising from any use of this information,except to the extent such damages or losses cannot be limited or excluded by applicable law. Past financial performance is no guarantee of future results.

Financial information about the Company’s international operations is contained in Note 19 to the Consolidated Financial Statements included in thisAnnual Report and information about the effects of foreign currency fluctuations on its business is set forth in “Item 7. Management’s Discussion andAnalysis of Financial Condition and Results of Operations.” For a discussion of risks related to the Company’s non-U.S. operations and foreign currencyexchange, refer to “Item 1A. Risk Factors.”
Major Customers
No customer accounted for more than 10% of consolidated sales in 2017, 2016 or 2015.
Available Information
The Company maintains an internet website at www.danaher.com. The Company makes available free of charge on the website its annual reports on Form 10-K, quarterly reports on Form 10-Q and current reports on Form 8-K and amendments to those reports, filed or furnished pursuant to Section 13(a) or 15(d) ofthe Exchange Act, as soon as reasonably practicable after filing such material with, or furnishing such material to, the SEC. Danaher’s internet site and theinformation contained on or connected to that site are not incorporated by reference into this Form 10-K.
ITEM 1A. RISK FACTORSYou should carefully consider the risks and uncertainties described below, together with the information included elsewhere in this Annual Report on Form10-K and other documents we file with the SEC. The risks and uncertainties described below are those that we have identified as material, but are not theonly risks and uncertainties facing us. Our business is also subject to general risks and uncertainties that affect many other companies, such as marketconditions, economic conditions, geopolitical events, changes in laws, regulations or accounting rules, fluctuations in interest rates, terrorism, wars orconflicts, major health concerns, natural disasters or other disruptions of expected business conditions. Additional risks and uncertainties not currentlyknown to us or that we currently believe are immaterial also may impair our business, including our results of operations, liquidity and financial condition.
Conditions in the global economy, the markets we serve and the financial markets may adversely affect our business and financial statements.
Our business is sensitive to general economic conditions. Slower global economic growth, actual or anticipated default on sovereign debt, volatility in thecurrency and credit markets, high levels of unemployment or underemployment, reduced levels of capital expenditures, changes or anticipation of potentialchanges in government fiscal, tax, trade and monetary policies, changes in capital requirements for financial institutions, government deficit reduction andbudget negotiation dynamics, sequestration, austerity measures and other challenges that affect the global economy adversely affect the Company and itsdistributors, customers and suppliers, including having the effect of:
• reducing demand for our products and services (in this Annual Report, references to products and services also includes software), limiting thefinancing available to our customers and suppliers, increasing order cancellations and resulting in longer sales cycles and slower adoption of newtechnologies;
• increasing the difficulty in collecting accounts receivable and the risk of excess and obsolete inventories;
• increasing price competition in our served markets;
• supply interruptions, which could disrupt our ability to produce our products;
• increasing the risk of impairment of goodwill and other long-lived assets, and the risk that we may not be able to fully recover the value of otherassets such as real estate and tax assets; and
• increasing the risk that counterparties to our contractual arrangements will become insolvent or otherwise unable to fulfill their contractualobligations which, in addition to increasing the risks identified above, could result in preference actions against us.
Although we have been able to access the commercial paper and other capital markets through the date of this report, there can be no assurances that suchmarkets will remain available to us or that the lenders participating in our revolving credit facility will be able to provide financing in accordance with theircontractual obligations.
12
Source: DANAHER CORP /DE/, 10-K, February 21, 2018 Powered by Morningstar® Document Research℠The information contained herein may not be copied, adapted or distributed and is not warranted to be accurate, complete or timely. The user assumes all risks for any damages or losses arising from any use of this information,except to the extent such damages or losses cannot be limited or excluded by applicable law. Past financial performance is no guarantee of future results.

If growth in the global economy or in any of the markets we serve slows for a significant period, if there is significant deterioration in the global economy orsuch markets or if improvements in the global economy do not benefit the markets we serve, our business and financial statements could be adverselyaffected.
Our growth could suffer if the markets into which we sell our products and services decline, do not grow as anticipated or experience cyclicality.
Our growth depends in part on the growth of the markets which we serve, and visibility into our markets is limited (particularly for markets into which we sellthrough distribution). Our quarterly sales and profits depend substantially on the volume and timing of orders received during the fiscal quarter, which aredifficult to forecast. Any decline or lower than expected growth in our served markets could diminish demand for our products and services, which wouldadversely affect our financial statements. Certain of our businesses operate in industries that may experience periodic, cyclical downturns. In addition, incertain of our businesses demand depends on customers’ capital spending budgets as well as government funding policies, and matters of public policy andgovernment budget dynamics as well as product and economic cycles can affect the spending decisions of these entities. Demand for our products andservices is also sensitive to changes in customer order patterns, which may be affected by announced price changes, changes in incentive programs, newproduct introductions and customer inventory levels. Any of these factors could adversely affect our growth and results of operations in any given period.
We face intense competition and if we are unable to compete effectively, we may experience decreased demand and decreased market share. Even if wecompete effectively, we may be required to reduce prices for our products and services.
Our businesses operate in industries that are intensely competitive and have been subject to increasing consolidation. Because of the range of the productsand services we sell and the variety of markets we serve, we encounter a wide variety of competitors; refer to “Item 1. Business—Competition” for additionaldetails. In order to compete effectively, we must retain longstanding relationships with major customers and continue to grow our business by establishingrelationships with new customers, continually developing new products and services to maintain and expand our brand recognition and leadership positionin various product and service categories and penetrating new markets, including high-growth markets. In addition, significant shifts in industry market sharecan occur in connection with product problems, safety alerts and publications about products, reflecting the competitive significance of product quality,product efficacy and quality systems in our industry. Our failure to compete effectively and/or pricing pressures resulting from competition may adverselyimpact our financial statements, and our expansion into new markets may result in greater-than-expected risks, liabilities and expenses.
Our growth depends in part on the timely development and commercialization, and customer acceptance, of new and enhanced products and servicesbased on technological innovation.
We generally sell our products and services in industries that are characterized by rapid technological changes, frequent new product introductions andchanging industry standards. If we do not develop innovative new and enhanced products and services on a timely basis, our offerings will become obsoleteover time and our competitive position and financial statements will suffer. Our success will depend on several factors, including our ability to:
• correctly identify customer needs and preferences and predict future needs and preferences;
• allocate our R&D funding to products and services with higher growth prospects;
• anticipate and respond to our competitors’ development of new products and services and technological innovations;
• differentiate our offerings from our competitors’ offerings and avoid commoditization;
• innovate and develop new technologies and applications, and acquire or obtain rights to third-party technologies that may have valuableapplications in our served markets;
• obtain adequate intellectual property rights with respect to key technologies before our competitors do;
• successfully commercialize new technologies in a timely manner, price them competitively and cost-effectively manufacture and deliver sufficientvolumes of new products of appropriate quality on time;
• obtain necessary regulatory approvals of appropriate scope (including with respect to medical device products by demonstrating satisfactory clinicalresults where applicable, as well as achieving third-party reimbursement); and
• stimulate customer demand for and convince customers to adopt new technologies.
If we fail to accurately predict future customer needs and preferences or fail to produce viable technologies, we may invest heavily in R&D of products andservices that do not lead to significant revenue, which would adversely affect our profitability.
13
Source: DANAHER CORP /DE/, 10-K, February 21, 2018 Powered by Morningstar® Document Research℠The information contained herein may not be copied, adapted or distributed and is not warranted to be accurate, complete or timely. The user assumes all risks for any damages or losses arising from any use of this information,except to the extent such damages or losses cannot be limited or excluded by applicable law. Past financial performance is no guarantee of future results.

Even if we successfully innovate and develop new and enhanced products and services, we may incur substantial costs in doing so, and our profitability maysuffer. In addition, promising new offerings may fail to reach the market or realize only limited commercial success because of real or perceived efficacy orsafety concerns, failure to achieve positive clinical outcomes, uncertainty over third-party reimbursement or entrenched patterns of clinical practice.Competitors may also develop after-market services and parts for our products which attract customers and adversely affect our return on investment for newproducts.
Our reputation, ability to do business and financial statements may be impaired by improper conduct by any of our employees, agents or business partners.
We cannot provide assurance that our internal controls and compliance systems will always protect us from acts committed by employees, agents or businesspartners of ours (or of businesses we acquire or partner with) that would violate U.S. and/or non-U.S. laws, including the laws governing payments togovernment officials, bribery, fraud, kickbacks and false claims, pricing, sales and marketing practices, conflicts of interest, competition, export and importcompliance, money laundering and data privacy. In particular, the U.S. Foreign Corrupt Practices Act, the U.K. Bribery Act and similar anti-bribery laws inother jurisdictions generally prohibit companies and their intermediaries from making improper payments to government officials for the purpose ofobtaining or retaining business, and we operate in many parts of the world that have experienced governmental corruption to some degree. Any suchimproper actions or allegations of such acts could damage our reputation and subject us to civil or criminal investigations in the United States and in otherjurisdictions and related shareholder lawsuits, could lead to substantial civil and criminal, monetary and nonmonetary penalties and could cause us to incursignificant legal and investigatory fees. In addition, the government may seek to hold us liable as a successor for violations committed by companies inwhich we invest or that we acquire. We also rely on our suppliers to adhere to our supplier standards of conduct, and material violations of such standards ofconduct could occur that could have a material effect on our business, reputation and financial statements.
Certain of our businesses are subject to extensive regulation by the U.S. FDA and by comparable agencies of other countries, as well as laws regulatingfraud and abuse in the health care industry and the privacy and security of health information. Failure to comply with those regulations could adverselyaffect our reputation, ability to do business and financial statements.
Certain of our products are medical devices and other products that are subject to regulation by the U.S. FDA, by other federal and state governmentalagencies, by comparable agencies of other countries and regions and by regulations governing hazardous materials and drugs-of abuse (or the manufactureand sale of products containing any such materials). We cannot guarantee that we will be able to obtain regulatory clearance (such as 510(k) clearance) orapprovals for our new products or modifications to (or additional indications or uses of) existing products within our anticipated timeframe or at all, and if wedo obtain such clearance or approval it may be time-consuming, costly and subject to restrictions. Our ability to obtain such regulatory clearances orapprovals will depend on many factors, for example our ability to obtain the necessary clinical trial results, and the process for obtaining such clearances orapprovals could change over time and may require the withdrawal of products from the market until such clearances are obtained. Even after initial regulatoryclearance or approval, if safety issues arise we may be required to amend conditions for use of a product, such as providing additional warnings on theproduct’s label or narrowing its approved intended use, which could reduce the product’s market acceptance. Failure to obtain required regulatory clearancesor approvals before marketing our products (or before implementing modifications to or promoting additional indications or uses of our products), otherviolations of these regulations, real or perceived efficacy or safety concerns or trends of adverse events with respect to our products (even after obtainingclearance for distribution) and unfavorable or inconsistent clinical data from existing or future clinical trials can lead to FDA Form 483 InspectionalObservations, warning letters, notices to customers, declining sales, loss of customers, loss of market share, recalls, seizures of adulterated or misbrandedproducts, injunctions, administrative detentions, refusals to permit importations, partial or total shutdown of production facilities or the implementation ofoperating restrictions, narrowing of permitted uses for a product, suspension or withdrawal of approvals and pre-market notification rescissions. We are alsosubject to various laws regulating fraud and abuse, pricing and sales and marketing practices in the health care industry and the privacy and security of healthinformation, including the federal regulations described in “Item 1. Business—Regulatory Matters.”
Failure to comply with applicable regulations could result in the adverse effects referenced below under “Our businesses are subject to extensive regulation;failure to comply with those regulations could adversely affect our financial statements and our business, including our reputation.” Compliance withregulations may also require us to incur significant expenses.
14
Source: DANAHER CORP /DE/, 10-K, February 21, 2018 Powered by Morningstar® Document Research℠The information contained herein may not be copied, adapted or distributed and is not warranted to be accurate, complete or timely. The user assumes all risks for any damages or losses arising from any use of this information,except to the extent such damages or losses cannot be limited or excluded by applicable law. Past financial performance is no guarantee of future results.

The health care industry and related industries that we serve have undergone, and are in the process of undergoing, significant changes in an effort toreduce costs, which could adversely affect our financial statements.
The health care industry and related industries that we serve have undergone, and are in the process of undergoing, significant changes in an effort to reducecosts, including the following:
• many of our customers, and the end-users to whom our customers supply products, rely on government funding of and reimbursement for health careproducts and services and research activities. The U.S. Patient Protection and Affordable Care Act, as amended by the Health Care and EducationAffordability Reconciliation Act (collectively, the “PPACA”), health care austerity measures in other countries and other potential health carereform changes and government austerity measures may reduce the amount of government funding or reimbursement available to customers or end-users of our products and services and/or the volume of medical procedures using our products and services. For example, the Protecting Access toMedicare Act of 2014, or PAMA, introduced a multi-year pricing program for services payable under the Clinical Laboratory Fee Schedule (“CLFS”)that is designed to bring Medicare allowable amounts in line with the amounts paid by private payers. It is unclear whether and to what extent thesenew rates will affect overall pricing and reimbursement for clinical laboratory testing services, but if our customers conclude that Medicarereimbursement for these services is inadequate, it could in turn adversely impact the prices at which we sell our products. Other countries alsocontrol the price of health care products, directly or indirectly, through reimbursement, payment, pricing or coverage limitations or throughcompulsory licensing. Global economic uncertainty or deterioration can also adversely impact government funding and reimbursement.
• the PPACA imposes on medical device manufacturers, such as Danaher, a 2.3% excise tax on U.S. sales of certain medical devices. The excise tax hasbeen suspended until the end of 2019, but the Company would be subject to the tax beginning in 2020.
• governmental and private health care providers and payors around the world are increasingly utilizing managed care for the delivery of health careservices, forming group purchasing organizations and integrated health delivery networks and pursuing consolidation to improve their purchasingleverage and using competitive bid processes to procure health care products and services.
These changes as well as other impacts from market demand, government regulations, third-party coverage and reimbursement policies and societal pressureshave increased our tax liabilities and may cause participants in the health care industry and related industries that we serve to purchase fewer of our productsand services, reduce the prices they are willing to pay for our products or services, reduce the amounts of reimbursement and funding available for ourproducts and services from governmental agencies or third-party payors, reduce the volume of medical procedures that use our products and services, affectthe acceptance rate of new technologies and products and increase our compliance and other costs. In addition, we may be unable to enter into contracts withgroup purchasing organizations and integrated health networks on terms acceptable to us, and even if we do enter into such contracts they may be on termsthat negatively affect our current or future profitability. All of the factors described above could adversely affect our business and financial statements.
Any inability to consummate acquisitions at our historical rate and at appropriate prices could negatively impact our growth rate and stock price.
Our ability to grow revenues, earnings and cash flow at or above our historic rates depends in part upon our ability to identify and successfully acquire andintegrate businesses at appropriate prices and realize anticipated synergies. We may not be able to consummate acquisitions at rates similar to the past, whichcould adversely impact our growth rate and our stock price. Promising acquisitions are difficult to identify and complete for a number of reasons, includinghigh valuations, competition among prospective buyers, the availability of affordable funding in the capital markets and the need to satisfy applicableclosing conditions and obtain antitrust and other regulatory approvals on acceptable terms. In addition, competition for acquisitions may result in higherpurchase prices. Changes in accounting or regulatory requirements or instability in the credit markets could also adversely impact our ability to consummateacquisitions.
15
Source: DANAHER CORP /DE/, 10-K, February 21, 2018 Powered by Morningstar® Document Research℠The information contained herein may not be copied, adapted or distributed and is not warranted to be accurate, complete or timely. The user assumes all risks for any damages or losses arising from any use of this information,except to the extent such damages or losses cannot be limited or excluded by applicable law. Past financial performance is no guarantee of future results.

Our acquisition of businesses, investments, joint ventures and strategic relationships could negatively impact our financial statements.
As part of our business strategy we acquire businesses, make investments and enter into joint ventures and other strategic relationships in the ordinary course,and we also from time to time complete more significant transactions; refer to “Management’s Discussion and Analysis of Financial Condition and Results ofOperations” (“MD&A”) for additional details. Acquisitions, investments, joint ventures and strategic relationships involve a number of financial, accounting,managerial, operational, legal, compliance and other risks and challenges, including the following, any of which could adversely affect our business and ourfinancial statements:
• any business, technology, service or product that we acquire or invest in could under-perform relative to our expectations and the price that we paidor not perform in accordance with our anticipated timetable, or we could fail to make any such business profitable.
• we may incur or assume significant debt in connection with our acquisitions, investments, joint ventures or strategic relationships, which could alsocause a deterioration of Danaher’s credit ratings, result in increased borrowing costs and interest expense and diminish our future access to thecapital markets.
• acquisitions, investments, joint ventures or strategic relationships could cause our financial results to differ from our own or the investmentcommunity’s expectations in any given period, or over the long-term.
• pre-closing and post-closing earnings charges could adversely impact operating results in any given period, and the impact may be substantiallydifferent from period-to-period.
• acquisitions, investments, joint ventures or strategic relationships could create demands on our management, operational resources and financial andinternal control systems that we are unable to effectively address.
• we could experience difficulty in integrating personnel, operations and financial and other controls and systems and retaining key employees andcustomers.
• we may be unable to achieve cost savings or other synergies anticipated in connection with an acquisition, investment, joint venture or strategicrelationship.
• we may assume unknown liabilities, known contingent liabilities that become realized, known liabilities that prove greater than anticipated, internalcontrol deficiencies or exposure to regulatory sanctions resulting from the acquired company’s or investee’s activities and the realization of any ofthese liabilities or deficiencies may increase our expenses, adversely affect our financial position or cause us to fail to meet our public financialreporting obligations.
• in connection with acquisitions and joint ventures, we often enter into post-closing financial arrangements such as purchase price adjustments, earn-out obligations and indemnification obligations, which may have unpredictable financial results.
• as a result of our acquisitions and investments, we have recorded significant goodwill and other assets on our balance sheet and if we are not able torealize the value of these assets, we may be required to incur impairment charges.
• we may have interests that diverge from those of our joint venture partners or other strategic partners and we may not be able to direct themanagement and operations of the joint venture or other strategic relationship in the manner we believe is most appropriate, exposing us toadditional risk.
• investing in or making loans to early-stage companies often entails a high degree of risk, and we may not achieve the strategic, technological,financial or commercial benefits we anticipate; we may lose our investment or fail to recoup our loan; or our investment may be illiquid for a greater-than-expected period of time.
The indemnification provisions of acquisition agreements by which we have acquired companies may not fully protect us and as a result we may faceunexpected liabilities.
Certain of the acquisition agreements by which we have acquired companies require the former owners to indemnify us against certain liabilities related tothe operation of the company before we acquired it. In most of these agreements, however, the liability of the former owners is limited and certain formerowners may be unable to meet their indemnification responsibilities. We cannot assure you that these indemnification provisions will protect us fully or atall, and as a result we may face unexpected liabilities that adversely affect our financial statements.
16
Source: DANAHER CORP /DE/, 10-K, February 21, 2018 Powered by Morningstar® Document Research℠The information contained herein may not be copied, adapted or distributed and is not warranted to be accurate, complete or timely. The user assumes all risks for any damages or losses arising from any use of this information,except to the extent such damages or losses cannot be limited or excluded by applicable law. Past financial performance is no guarantee of future results.

Divestitures or other dispositions could negatively impact our business, and contingent liabilities from businesses that we have sold could adversely affectour financial statements.
We continually assess the strategic fit of our existing businesses and may divest, spin-off, split-off or otherwise dispose of businesses that are deemed not tofit with our strategic plan or are not achieving the desired return on investment. For example, we split-off our communications business in 2015 and spun-offour Fortive business in 2016. Transactions such as these pose risks and challenges that could negatively impact our business and financial statements. Forexample, when we decide to sell or otherwise dispose of a business or assets, we may be unable to do so on satisfactory terms within our anticipated timeframeor at all, and even after reaching a definitive agreement to sell or dispose a business the sale is typically subject to satisfaction of pre-closing conditionswhich may not become satisfied. In addition, divestitures or other dispositions may dilute the Company’s earnings per share, have other adverse financial andaccounting impacts and distract management, and disputes may arise with buyers. In addition, we have retained responsibility for and/or have agreed toindemnify buyers against some known and unknown contingent liabilities related to a number of businesses we have sold or disposed. The resolution ofthese contingencies has not had a material effect on our financial statements but we cannot be certain that this favorable pattern will continue.
We could incur significant liability if the 2016 spin-off of Fortive Corporation (“Fortive”) or the 2015 split-off of our communications business isdetermined to be a taxable transaction.
In July 2015, the Company consummated the split-off of the majority of its former communications business to Danaher shareholders who elected toexchange Danaher shares for ownership interests in the communications business, and the subsequent merger of the communications business with asubsidiary of NetScout. Danaher shareholders who participated in the exchange offer tendered 26 million shares of Danaher common stock (approximately$2.3 billion on the date of tender) and received 62.5 million shares of NetScout common stock which represented approximately 60% of the shares ofNetScout common stock outstanding following the combination.
On July 2, 2016, Danaher completed the separation (the “Separation”) of its former Test & Measurement segment, Industrial Technologies segment(excluding the product identification businesses) and retail/commercial petroleum business by distributing to Danaher stockholders on a pro rata basis all ofthe issued and outstanding common stock of Fortive, the entity Danaher incorporated to hold such businesses. To effect the Separation, Danaher distributedto its stockholders one share of Fortive common stock for every two shares of Danaher common stock outstanding as of June 15, 2016, the record date for thedistribution.
We have received opinions from outside tax counsel to the effect that each of the Fortive Separation in 2016 and the split-off of our communications businessin 2015 qualifies as a transaction that is described in Sections 355(a) and 368(a)(1)(D) of the Internal Revenue Code. These opinions rely on certain facts,assumptions, representations and undertakings regarding the past and future conduct of the companies’ respective businesses and other matters. If any ofthese facts, assumptions, representations or undertakings are incorrect or not satisfied, our stockholders and we may not be able to rely on the respectiveopinion of tax counsel and could be subject to significant tax liabilities. Notwithstanding the opinion of tax counsel we have received, the Internal RevenueService (“IRS”) could determine on audit that either or both separations are taxable if it determines that any of these facts, assumptions, representations orundertakings are not correct or have been violated or if it disagrees with the conclusions in the respective opinion. If either transaction is determined to betaxable for U.S. federal income tax purposes, our stockholders that are subject to U.S. federal income tax and we could incur significant U.S. federal incometax liabilities.
Potential indemnification liabilities pursuant to the 2016 spin-off of Fortive and the 2015 split-off of our communications business could materially andadversely affect our business and financial statements.
We entered into a separation and distribution agreement and related agreements with Fortive to govern the Separation and the relationship between the twocompanies going forward. We entered into similar agreements with NetScout Systems, Inc. in connection with the split-off of our communications business.These agreements provide for specific indemnity and liability obligations of each party and could lead to disputes between us. If we are required toindemnify the other parties under the circumstances set forth in these agreements, we may be subject to substantial liabilities. In addition, with respect to theliabilities for which the other parties have agreed to indemnify us under these agreements, there can be no assurance that the indemnity rights we have againstsuch other parties will be sufficient to protect us against the full amount of the liabilities, or that such other parties will be able to fully satisfy itsindemnification obligations. It is also possible that a court could disregard the allocation of assets and liabilities agreed to between Danaher and such otherparties and require Danaher to assume responsibility for obligations allocated to such other parties. Each of these risks could negatively affect our businessand financial statements.
17
Source: DANAHER CORP /DE/, 10-K, February 21, 2018 Powered by Morningstar® Document Research℠The information contained herein may not be copied, adapted or distributed and is not warranted to be accurate, complete or timely. The user assumes all risks for any damages or losses arising from any use of this information,except to the extent such damages or losses cannot be limited or excluded by applicable law. Past financial performance is no guarantee of future results.

A significant disruption in, or breach in security of, our information technology systems or violation of data privacy laws could adversely affect ourbusiness, reputation and financial statements.
We rely on information technology systems, some of which are managed by third-parties, to process, transmit and store electronic information (includingsensitive data such as confidential business information and personally identifiable data relating to employees, customers, other business partners andpatients), and to manage or support a variety of critical business processes and activities (such as receiving and fulfilling orders, billing, collecting andmaking payments, shipping products, providing services and support to customers and fulfilling contractual obligations). In addition, some of our remotemonitoring products and services incorporate software and information technology that may house personal data and some products or software we sell tocustomers may connect to our systems for maintenance or other purposes. These systems, products and services may be damaged, disrupted or shut down dueto attacks by computer hackers, computer viruses, ransomware, human error or malfeasance, power outages, hardware failures, telecommunication or utilityfailures, catastrophes or other unforeseen events, and in any such circumstances our system redundancy and other disaster recovery planning may beineffective or inadequate. Attacks may also target hardware, software and information installed, stored or transmitted in our products after such products havebeen purchased and incorporated into third-party products, facilities or infrastructure. Security breaches of systems provided or enabled by us, regardless ofwhether the breach is attributable to a vulnerability in our products or services, could result in the misappropriation, destruction or unauthorized disclosure ofconfidential information or personal data belonging to us or to our employees, partners, customers or suppliers. Like most multinational corporations, ourinformation technology systems have been subject to computer viruses, malicious codes, unauthorized access and other cyber-attacks and we expect thesophistication and frequency of such attacks to continue to increase. Unauthorized tampering, adulteration or interference with our products may alsoadversely affect product functionality and result in loss of data, risk to patient safety and product recalls or field actions. Any of the attacks, breaches or otherdisruptions or damage described above could interrupt our operations or the operations of our customers and partners, delay production and shipments, resultin theft of our and our customers’ intellectual property and trade secrets, damage customer and business partner relationships and our reputation or result indefective products or services, legal claims and proceedings, liability and penalties under privacy laws and increased costs for security and remediation, eachof which could adversely affect our business, reputation and financial statements.
If we are unable to maintain reliable information technology systems and appropriate controls with respect to global data privacy and security requirementsand prevent data breaches, we may suffer regulatory consequences in addition to business consequences. As a global organization, we are subject to dataprivacy and security laws, regulations, and customer-imposed controls in numerous jurisdictions as a result of having access to and processing confidential,personal and/or sensitive data in the course of our business. For example, in the United States, HIPAA privacy and security rules require certain of ouroperations to maintain controls to protect the availability and confidentiality of patient health information, individual states regulate data breach andsecurity requirements and multiple governmental bodies assert authority over aspects of the protection of personal privacy. European laws require us to havean approved legal mechanism to transfer personal data out of Europe, and the new EU General Data Protection Regulation, which takes effect in May 2018,will impose significantly stricter requirements in how we collect and process personal data. Several countries, such as China and Russia, have passed lawsthat require personal data relating to their citizens to be maintained on local servers and impose additional data transfer restrictions. Government enforcementactions can be costly and interrupt the regular operation of our business, and data breaches or violations of data privacy laws can result in fines, reputationaldamage and civil lawsuits, any of which may adversely affect our business, reputation and financial statements.
Our operations, products and services expose us to the risk of environmental, health and safety liabilities, costs and violations that could adversely affectour business, reputation and financial statements.
Our operations, products and services are subject to environmental laws and regulations, which impose limitations on the discharge of pollutants into theenvironment, establish standards for the use, generation, treatment, storage and disposal of hazardous and nonhazardous wastes and impose end-of-lifedisposal and take-back programs. We must also comply with various health and safety regulations in the United States and abroad in connection with ouroperations. We cannot assure you that our environmental, health and safety compliance program (or the compliance programs of businesses we acquire) havebeen or will at all times be effective. Failure to comply with any of these laws could result in civil and criminal, monetary and nonmonetary penalties anddamage to our reputation. In addition, we cannot provide assurance that our costs of complying with current or future environmental protection and healthand safety laws will not exceed our estimates or adversely affect our financial statements.
In addition, we may incur costs related to remedial efforts or alleged environmental damage associated with past or current waste disposal practices or otherhazardous materials handling practices. We are also from time to time party to personal injury, property damage or other claims brought by private partiesalleging injury or damage due to the presence of or exposure to hazardous substances. We may also become subject to additional remedial, compliance orpersonal injury costs due to future
18
Source: DANAHER CORP /DE/, 10-K, February 21, 2018 Powered by Morningstar® Document Research℠The information contained herein may not be copied, adapted or distributed and is not warranted to be accurate, complete or timely. The user assumes all risks for any damages or losses arising from any use of this information,except to the extent such damages or losses cannot be limited or excluded by applicable law. Past financial performance is no guarantee of future results.

events such as changes in existing laws or regulations, changes in agency direction or enforcement policies, developments in remediation technologies,changes in the conduct of our operations and changes in accounting rules. For additional information regarding these risks, refer to Note 16 to theConsolidated Financial Statements included in this Annual Report. We cannot assure you that our liabilities arising from past or future releases of, orexposures to, hazardous substances will not exceed our estimates or adversely affect our reputation and financial statements or that we will not be subject toadditional claims for personal injury or remediation in the future based on our past, present or future business activities. However, based on the informationwe currently have we do not believe that it is reasonably possible that any amounts we may be required to pay in connection with environmental matters inexcess of our reserves as of December 31, 2017 will have a material effect on our financial statements.
Our businesses are subject to extensive regulation; failure to comply with those regulations could adversely affect our financial statements and ourbusiness, including our reputation.
In addition to the environmental, health, safety, health care, medical device, anticorruption, data privacy and other regulations noted elsewhere in thisAnnual Report, our businesses are subject to extensive regulation by U.S. and non-U.S. governmental and self-regulatory entities at the supranational, federal,state, local and other jurisdictional levels, including the following:
• we are required to comply with various import laws and export control and economic sanctions laws, which may affect our transactions with certaincustomers, business partners and other persons and dealings between our employees and between our subsidiaries. In certain circumstances, exportcontrol and economic sanctions regulations may prohibit the export of certain products, services and technologies. In other circumstances, we maybe required to obtain an export license before exporting the controlled item. Compliance with the various import laws that apply to our businessescan restrict our access to, and increase the cost of obtaining, certain products and at times can interrupt our supply of imported inventory.
• we also have agreements to sell products and services to government entities and are subject to various statutes and regulations that apply tocompanies doing business with government entities. The laws governing government contracts differ from the laws governing private contracts. Forexample, many government contracts contain pricing and other terms and conditions that are not applicable to private contracts. Our agreementswith government entities may be subject to termination, reduction or modification at the convenience of the government or in the event of changesin government requirements, reductions in federal spending and other factors, and we may underestimate our costs of performing under the contract. In certain cases, a governmental entity may require us to pay back amounts it has paid to us. Government contracts that have been awarded to usfollowing a bid process could become the subject of a bid protest by a losing bidder, which could result in loss of the contract. We are also subject toinvestigation and audit for compliance with the requirements governing government contracts.
These are not the only regulations that our businesses must comply with. The regulations we are subject to have tended to become more stringent over timeand may be inconsistent across jurisdictions. We, our representatives and the industries in which we operate may at times be under review and/orinvestigation by regulatory authorities. Failure to comply (or any alleged or perceived failure to comply) with the regulations referenced above or any otherregulations could result in civil and criminal, monetary and nonmonetary penalties, and any such failure or alleged failure (or becoming subject to aregulatory enforcement investigation) could also damage our reputation, disrupt our business, limit our ability to manufacture, import, export and sellproducts and services, result in loss of customers and disbarment from selling to certain federal agencies and cause us to incur significant legal andinvestigatory fees. Compliance with these and other regulations may also affect our returns on investment, require us to incur significant expenses or modifyour business model or impair our flexibility in modifying product, marketing, pricing or other strategies for growing our business. Our products andoperations are also often subject to the rules of industrial standards bodies such as the International Standards Organization, and failure to comply with theserules could result in withdrawal of certifications needed to sell our products and services and otherwise adversely impact our business and financialstatements. For additional information regarding these risks, refer to “Item 1. Business—Regulatory Matters.”
Our restructuring actions could have long-term adverse effects on our business.
In recent years, we have implemented significant restructuring activities across our businesses to adjust our cost structure, and we may engage in similarrestructuring activities in the future. These restructuring activities and our regular ongoing cost reduction activities (including in connection with theintegration of acquired businesses) reduce our available talent, assets and other resources and could slow improvements in our products and services,adversely affect our ability to respond to customers, limit our ability to increase production quickly if demand for our products increases and trigger adversepublic attention. In addition, delays in implementing planned restructuring activities or other productivity improvements, unexpected costs or
19
Source: DANAHER CORP /DE/, 10-K, February 21, 2018 Powered by Morningstar® Document Research℠The information contained herein may not be copied, adapted or distributed and is not warranted to be accurate, complete or timely. The user assumes all risks for any damages or losses arising from any use of this information,except to the extent such damages or losses cannot be limited or excluded by applicable law. Past financial performance is no guarantee of future results.

failure to meet targeted improvements may diminish the operational or financial benefits we expect to realize from such actions. Any of the circumstancesdescribed above could adversely impact our business and financial statements.
We may be required to recognize impairment charges for our goodwill and other intangible assets.
As of December 31, 2017, the net carrying value of our goodwill and other intangible assets totaled approximately $36.8 billion. In accordance withgenerally accepted accounting principles, we periodically assess these assets to determine if they are impaired. Significant negative industry or economictrends, disruptions to our business, inability to effectively integrate acquired businesses, unexpected significant changes or planned changes in use of ourassets, changes in the structure of our business, divestitures, market capitalization declines, or increases in associated discount rates may impair our goodwilland other intangible assets. Any charges relating to such impairments would adversely affect our results of operations in the periods recognized.
Foreign currency exchange rates may adversely affect our financial statements.
Sales and purchases in currencies other than the U.S. dollar expose us to fluctuations in foreign currencies relative to the U.S. dollar and may adversely affectour financial statements. Increased strength of the U.S. dollar increases the effective price of our products sold in U.S. dollars into other countries, which mayrequire us to lower our prices or adversely affect sales to the extent we do not increase local currency prices. Decreased strength of the U.S. dollar couldadversely affect the cost of materials, products and services we purchase overseas. Sales and expenses of our non-U.S. businesses are also translated into U.S.dollars for reporting purposes and the strengthening or weakening of the U.S. dollar could result in unfavorable translation effects. In addition, certain of ourbusinesses may invoice customers in a currency other than the business’ functional currency, and movements in the invoiced currency relative to thefunctional currency could also result in unfavorable translation effects. The Company also faces exchange rate risk from its investments in subsidiaries ownedand operated in foreign countries.
Changes in our tax rates or exposure to additional income tax liabilities or assessments could affect our profitability. In addition, audits by tax authoritiescould result in additional tax payments for prior periods.
We are subject to income taxes in the U.S. and in various non-U.S. jurisdictions. On December 22, 2017, the Tax Cuts and Jobs Act (“TCJA”) was enacted. The TCJA significantly revises the U.S. federal corporate income tax law by, among other things, lowering the corporate income tax rate to 21% (beginningin 2018), implementing a territorial tax system, and imposing a one-time tax on unremitted cumulative non-U.S. earnings of foreign subsidiaries (“TransitionTax”). The U.S. Treasury Department and IRS have not yet issued regulations with respect to the TCJA.
Due to the potential for changes to tax laws and regulations or changes to the interpretation thereof (including regulations and interpretations pertaining tothe TCJA), the ambiguity of tax laws and regulations, the subjectivity of factual interpretations, the complexity of our intercompany arrangements,uncertainties regarding the geographic mix of earnings in any particular period, and other factors, our estimates of effective tax rate and income tax assets andliabilities may be incorrect and our financial statements could be adversely affected; please refer to MD&A for a discussion of additional factors that mayadversely affect our effective tax rate and decrease our profitability in any period. For example, our estimate of the net one-time charge we have incurredrelated to the TCJA could differ materially from our actual liability, due to, among other things, further refinement of our calculations, changes ininterpretations and assumptions that we have made, additional guidance that may be issued by the U.S. Treasury Department and IRS, and actions we maytake as a result of the TCJA. The impact of the factors referenced in the first sentence of this paragraph may be substantially different from period-to-period.
In addition, the amount of income taxes we pay is subject to ongoing audits by U.S. federal, state and local tax authorities and by non-U.S. tax authorities,such as the audits described in MD&A and the Company’s financial statements. If audits result in payments or assessments different from our reserves, ourfuture results may include unfavorable adjustments to our tax liabilities and our financial statements could be adversely affected. Any further significantchanges to the tax system in the United States or in other jurisdictions (including changes in the taxation of international income as further described below)could adversely affect our financial statements.
Changes in tax law relating to multinational corporations could adversely affect our tax position.
The U.S. Congress, government agencies in non-U.S. jurisdictions where we and our affiliates do business, and the Organisation for Economic Co-operationand Development (“OECD”) have recently focused on issues related to the taxation of multinational corporations. One example is in the area of “base erosionand profit shifting,” where profits are claimed to be earned for tax purposes in low-tax jurisdictions, or payments are made between affiliates from ajurisdiction with high tax rates to a jurisdiction with lower tax rates. The OECD has released several components of its comprehensive plan to create anagreed set of international rules for addressing base erosion and profit shifting. As a result, the tax laws in the United States
20
Source: DANAHER CORP /DE/, 10-K, February 21, 2018 Powered by Morningstar® Document Research℠The information contained herein may not be copied, adapted or distributed and is not warranted to be accurate, complete or timely. The user assumes all risks for any damages or losses arising from any use of this information,except to the extent such damages or losses cannot be limited or excluded by applicable law. Past financial performance is no guarantee of future results.
and other countries in which we do business could change on a prospective or retroactive basis, and any such changes could adversely affect our business andfinancial statements.
We are subject to a variety of litigation and other legal and regulatory proceedings in the course of our business that could adversely affect our businessand financial statements.
We are subject to a variety of litigation and other legal and regulatory proceedings incidental to our business (or the business operations of previously ownedentities), including claims or counterclaims for damages arising out of the use of products or services and claims relating to intellectual property matters,employment matters, tax matters, commercial disputes, competition and sales and trading practices, environmental matters, personal injury, insurancecoverage and acquisition or divestiture-related matters, as well as regulatory investigations or enforcement. We may also become subject to lawsuits as aresult of past or future acquisitions or as a result of liabilities retained from, or representations, warranties or indemnities provided in connection with,divested businesses. The types of claims made in lawsuits include claims for compensatory damages, punitive and consequential damages (and in some cases,treble damages) and/or injunctive relief. The defense of these lawsuits may divert our management’s attention, we may incur significant expenses indefending these lawsuits, and we may be required to pay damage awards or settlements or become subject to equitable remedies that could adversely affectour operations and financial statements. Moreover, any insurance or indemnification rights that we may have may be insufficient or unavailable to protect usagainst such losses. In addition, developments in proceedings in any given period may require us to adjust the loss contingency estimates that we haverecorded in our financial statements, record estimates for liabilities or assets previously not susceptible of reasonable estimates or pay cash settlements orjudgments. Any of these developments could adversely affect our financial statements in any particular period. We cannot assure you that our liabilities inconnection with litigation and other legal and regulatory proceedings will not exceed our estimates or adversely affect our financial statements and business.However, based on our experience, current information and applicable law, we do not believe that it is reasonably possible that any amounts we may berequired to pay in connection with litigation and other legal and regulatory proceedings in excess of our reserves as of December 31, 2017 will have amaterial effect on our financial statements.
If we do not or cannot adequately protect our intellectual property, or if third-parties infringe our intellectual property rights, we may suffer competitiveinjury or expend significant resources enforcing our rights.
We own numerous patents, trademarks, copyrights, trade secrets and other intellectual property and licenses to intellectual property owned by others, whichin aggregate are important to our business. The intellectual property rights that we obtain, however, may not be sufficiently broad or otherwise may notprovide us a significant competitive advantage, and patents may not be issued for pending or future patent applications owned by or licensed to us. Inaddition, the steps that we and our licensors have taken to maintain and protect our intellectual property may not prevent it from being challenged,invalidated, circumvented, designed-around or becoming subject to compulsory licensing, particularly in countries where intellectual property rights are nothighly developed or protected. In some circumstances, enforcement may not be available to us because an infringer has a dominant intellectual propertyposition or for other business reasons, or countries may require compulsory licensing of our intellectual property. We also rely on nondisclosure andnoncompetition agreements with employees, consultants and other parties to protect, in part, trade secrets and other proprietary rights. There can be noassurance that these agreements will adequately protect our trade secrets and other proprietary rights and will not be breached, that we will have adequateremedies for any breach, that others will not independently develop substantially equivalent proprietary information or that third-parties will not otherwisegain access to our trade secrets or other proprietary rights. Our failure to obtain or maintain intellectual property rights that convey competitive advantage,adequately protect our intellectual property or detect or prevent circumvention or unauthorized use of such property and the cost of enforcing our intellectualproperty rights could adversely impact our business, including our competitive position, and financial statements.
Third-parties may claim that we are infringing or misappropriating their intellectual property rights and we could suffer significant litigation expenses,losses or licensing expenses or be prevented from selling products or services.
From time to time, we receive notices from third-parties alleging intellectual property infringement or misappropriation. Any dispute or litigation regardingintellectual property could be costly and time-consuming due to the complexity of many of our technologies and the uncertainty of intellectual propertylitigation. Our intellectual property portfolio may not be useful in asserting a counterclaim, or negotiating a license, in response to a claim of infringement ormisappropriation. In addition, as a result of such claims of infringement or misappropriation, we could lose our rights to critical technology, be unable tolicense critical technology or sell critical products and services, be required to pay substantial damages or license fees with respect to the infringed rights orbe required to redesign our products at substantial cost, any of which could adversely impact our business, including our competitive position, and financialstatements. Even if we successfully defend against claims of infringement or misappropriation, we may incur significant costs and diversion of managementattention and resources, which could adversely affect our business and financial statements.
21
Source: DANAHER CORP /DE/, 10-K, February 21, 2018 Powered by Morningstar® Document Research℠The information contained herein may not be copied, adapted or distributed and is not warranted to be accurate, complete or timely. The user assumes all risks for any damages or losses arising from any use of this information,except to the extent such damages or losses cannot be limited or excluded by applicable law. Past financial performance is no guarantee of future results.
The U.S. government has certain rights to use and disclose some of the intellectual property that we license and could exclusively license it to a third-partyif we fail to achieve practical application of the intellectual property.
Certain technology licensed by us under agreements with third-party licensors may be subject to government rights. Government rights in inventionsconceived or reduced to practice under a government-funded program may include a nonexclusive, royalty-free worldwide license to practice or havepracticed such inventions for any governmental purpose. In addition, the U.S. government has the right to require us or our licensors (as applicable) to grantlicenses which would be exclusive under any of such inventions to a third-party if they determine that: (1) adequate steps have not been taken tocommercialize such inventions in a particular field of use; (2) such action is necessary to meet public health or safety needs; or (3) such action is necessary tomeet requirements for public use under federal regulations. Further, the government rights include the right to use and disclose, without limitation, technicaldata relating to licensed technology that was developed in whole or in part at government expense.
Defects and unanticipated use or inadequate disclosure with respect to our products or services (including software), or allegations thereof, couldadversely affect our business, reputation and financial statements.
Manufacturing or design defects or “bugs” in, unanticipated use of, safety or quality issues (or the perception of such issues) with respect to, “off label” useof, or inadequate disclosure of risks relating to the use of products and services that we make or sell (including items that we source from third-parties) canlead to personal injury, death, property damage, loss of profits or other liability. These events could lead to recalls or safety alerts, result in the removal of aproduct or service from the market and result in product liability or similar claims being brought against us. Recalls, removals and product liability andsimilar claims (regardless of their validity or ultimate outcome) can result in significant costs, as well as negative publicity and damage to our reputation thatcould reduce demand for our products and services. Our business can also be affected by studies of the utilization, safety and efficacy of medical deviceproducts and components that are conducted by industry participants, government agencies and others. Any of the above can result in the discontinuation ofmarketing of such products in one or more countries, and may give rise to claims for damages from persons who believe they have been injured as a result ofproduct issues.
The manufacture of many of our products is a highly exacting and complex process, and if we directly or indirectly encounter problems manufacturingproducts, our reputation, business and financial statements could suffer.
The manufacture of many of our products is a highly exacting and complex process, due in part to strict regulatory requirements. Problems may arise duringmanufacturing for a variety of reasons, including equipment malfunction, failure to follow specific protocols and procedures, problems with raw materials,natural disasters and environmental factors, and if not discovered before the product is released to market could result in recalls and product liabilityexposure. Because of the time required to approve and license certain regulated manufacturing facilities and other stringent regulations of the FDA andsimilar agencies regarding the manufacture of certain of our products, an alternative manufacturer may not be available on a timely basis to replace suchproduction capacity. Any of these manufacturing problems could result in significant costs, liability and lost revenue, as well as negative publicity anddamage to our reputation that could reduce demand for our products.
Our indebtedness may limit our operations and our use of our cash flow, and any failure to comply with the covenants that apply to our indebtedness couldadversely affect our liquidity and financial statements.
As of December 31, 2017, we had approximately $10.5 billion in outstanding indebtedness. In addition, as of December 31, 2017, we had the ability to incuran additional $1.6 billion of indebtedness in direct borrowings or under the outstanding commercial paper facility based on the amounts available under theCompany’s $4.0 billion credit facility which were not being used to backstop outstanding commercial paper balances. Our debt level and related debt serviceobligations can have negative consequences, including (1) requiring us to dedicate significant cash flow from operations to the payment of principal andinterest on our debt, which reduces the funds we have available for other purposes such as acquisitions and capital investment; (2) reducing our flexibility inplanning for or reacting to changes in our business and market conditions; and (3) exposing us to interest rate risk since a portion of our debt obligations areat variable rates. We may incur significantly more debt in the future, particularly to finance acquisitions, and there can be no assurance that our cost offunding will not substantially increase.
Our current revolving credit facility and long-term debt obligations also impose certain restrictions on us; for more information refer to MD&A. If we breachany of these restrictions and do not obtain a waiver from the lenders, subject to applicable cure periods the outstanding indebtedness (and any otherindebtedness with cross-default provisions) could be declared immediately due and payable, which would adversely affect our liquidity and financialstatements. In addition, any failure to maintain the credit ratings assigned to us by independent rating agencies would adversely affect our cost of funds andcould adversely affect our liquidity and access to the capital markets. If we add new debt, the risks described above could increase.
22
Source: DANAHER CORP /DE/, 10-K, February 21, 2018 Powered by Morningstar® Document Research℠The information contained herein may not be copied, adapted or distributed and is not warranted to be accurate, complete or timely. The user assumes all risks for any damages or losses arising from any use of this information,except to the extent such damages or losses cannot be limited or excluded by applicable law. Past financial performance is no guarantee of future results.

Adverse changes in our relationships with, or the financial condition, performance, purchasing patterns or inventory levels of, key distributors and otherchannel partners could adversely affect our financial statements.
Certain of our businesses sell a significant amount of their products to or through key distributors and other channel partners that have valuable relationshipswith customers and end-users. Some of these distributors and other partners also sell our competitors’ products or compete with us directly, and if they favorcompeting products for any reason they may fail to market our products effectively. Adverse changes in our relationships with these distributors and otherpartners, reduction or discontinuation of their purchases from us or adverse developments in their financial condition, performance or purchasing patterns,could adversely affect our business and financial statements. The levels of inventory maintained by our distributors and other channel partners, and changesin those levels, can also significantly impact our results of operations in any given period. In addition, the consolidation of distributors and customers incertain of our served industries could adversely impact our business and financial statements.
Certain of our businesses rely on relationships with collaborative partners and other third-parties for development, supply and marketing of certainproducts and potential products, and such collaborative partners or other third-parties could fail to perform sufficiently.
We believe that for certain of our businesses, success in penetrating target markets depends in part on their ability to develop and maintain collaborativerelationships with other companies. Relying on collaborative relationships is risky because, among other things, our collaborative partners may (1) notdevote sufficient resources to the success of our collaborations; (2) fail to obtain regulatory approvals necessary to continue the collaborations in a timelymanner; (3) be acquired by other companies and terminate our collaborative partnership or become insolvent; (4) compete with us; (5) disagree with us onkey details of the collaborative relationship; (6) have insufficient capital resources; and (7) decline to renew existing collaborations on acceptable terms.Because these and other factors may be beyond our control, the development or commercialization of our products involved in collaborative partnershipsmay be delayed or otherwise adversely affected. If we or any of our collaborative partners terminate a collaborative arrangement, we may be required todevote additional resources to product development and commercialization or we may need to cancel some development programs, which could adverselyaffect our business and financial statements.
Our financial results are subject to fluctuations in the cost and availability of commodities that we use in our operations.
As discussed in “Item 1. Business—Materials,” our manufacturing and other operations employ a wide variety of components, raw materials and othercommodities. Prices for and availability of these components, raw materials and other commodities have fluctuated significantly in the past. Any sustainedinterruption in the supply of these items could adversely affect our business. In addition, due to the highly competitive nature of the industries that we serve,the cost-containment efforts of our customers and the terms of certain contracts we are party to, if commodity prices rise we may be unable to pass along costincreases through higher prices. If we are unable to fully recover higher commodity costs through price increases or offset these increases through costreductions, or if there is a time delay between the increase in costs and our ability to recover or offset these costs, our margins and profitability could declineand our financial statements could be adversely affected.
If we cannot adjust our manufacturing capacity or the purchases required for our manufacturing activities to reflect changes in market conditions andcustomer demand, our profitability may suffer. In addition, our reliance upon sole or limited sources of supply for certain materials, components andservices could cause production interruptions, delays and inefficiencies.
We purchase materials, components and equipment from third-parties for use in our manufacturing operations. Our income could be adversely impacted if weare unable to adjust our purchases to reflect changes in customer demand and market fluctuations, including those caused by seasonality or cyclicality.During a market upturn, suppliers may extend lead times, limit supplies or increase prices. If we cannot purchase sufficient products at competitive prices andquality and on a timely enough basis to meet increasing demand, we may not be able to satisfy market demand, product shipments may be delayed, our costsmay increase or we may breach our contractual commitments and incur liabilities. Conversely, in order to secure supplies for the production of products, wesometimes enter into noncancelable purchase commitments with vendors, which could impact our ability to adjust our inventory to reflect declining marketdemands. If demand for our products is less than we expect, we may experience additional excess and obsolete inventories and be forced to incur additionalcharges and our profitability may suffer.
In addition, some of our businesses purchase certain requirements from sole or limited source suppliers for reasons of quality assurance, regulatoryrequirements, cost effectiveness, availability or uniqueness of design. If these or other suppliers encounter financial, operating or other difficulties or if ourrelationship with them changes, we might not be able to quickly establish or qualify replacement sources of supply. The supply chains for our businessescould also be disrupted by supplier capacity constraints, bankruptcy or exiting of the business for other reasons, decreased availability of key raw materials or
23
Source: DANAHER CORP /DE/, 10-K, February 21, 2018 Powered by Morningstar® Document Research℠The information contained herein may not be copied, adapted or distributed and is not warranted to be accurate, complete or timely. The user assumes all risks for any damages or losses arising from any use of this information,except to the extent such damages or losses cannot be limited or excluded by applicable law. Past financial performance is no guarantee of future results.

commodities and external events such as natural disasters, pandemic health issues, war, terrorist actions, governmental actions and legislative or regulatorychanges. Any of these factors could result in production interruptions, delays, extended lead times and inefficiencies.
Because we cannot always immediately adapt our production capacity and related cost structures to changing market conditions, our manufacturing capacitymay at times exceed or fall short of our production requirements. Any or all of these problems could result in the loss of customers, provide an opportunity forcompeting products to gain market acceptance and otherwise adversely affect our financial statements.
Changes in governmental regulations may reduce demand for our products or services or increase our expenses.
We compete in markets in which we and our customers must comply with supranational, federal, state, local and other jurisdictional regulations, such asregulations governing health and safety, the environment, food and drugs, privacy and electronic communications. We develop, configure and market ourproducts and services to meet customer needs created by these regulations. These regulations are complex, change frequently, have tended to become morestringent over time and may be inconsistent across jurisdictions. Any significant change in any of these regulations (or in the interpretation or applicationthereof) could reduce demand for, increase our costs of producing or delay the introduction of new or modified products and services, or could restrict ourexisting activities, products and services. For example, a number of our products and services are marketed to the pharmaceutical and related industries foruse in discovering and developing drugs and therapies. Changes in the U.S. FDA’s regulation of the drug discovery and development process could have anadverse effect on the demand for these products and services. In addition, in certain of our markets our growth depends in part upon the introduction of newregulations. In these markets, the delay or failure of governmental and other entities to adopt or enforce new regulations, the adoption of new regulationswhich our products and services are not positioned to address or the repeal of existing regulations, could adversely affect demand. In addition, regulatorydeadlines may result in substantially different levels of demand for our products and services from period-to-period.
Work stoppages, union and works council campaigns and other labor disputes could adversely impact our productivity and results of operations.
We have a number of U.S. collective bargaining units and various non-U.S. collective labor arrangements. We are subject to potential work stoppages, unionand works council campaigns and other labor disputes, any of which could adversely impact our financial statements and business, including ourproductivity and reputation.
International economic, political, legal, compliance and business factors could negatively affect our financial statements.
In 2017, approximately 63% of our sales were derived from customers outside the United States. In addition, many of our manufacturing operations, suppliersand employees are located outside the United States. Since our growth strategy depends in part on our ability to further penetrate markets outside the UnitedStates and increase the localization of our products and services, we expect to continue to increase our sales and presence outside the United States,particularly in the high-growth markets. Our international business (and particularly our business in high-growth markets) is subject to risks that arecustomarily encountered in non-U.S. operations, including:
• interruption in the transportation of materials to us and finished goods to our customers;
• differences in terms of sale, including payment terms;
• local product preferences and product requirements;
• changes in a country’s or region’s political or economic conditions, such as the devaluation of particular currencies;
• trade protection measures, embargoes and import or export restrictions and requirements;
• unexpected changes in laws or regulatory requirements, including changes in tax laws;
• capital controls and limitations on ownership and on repatriation of earnings and cash;
• the potential for nationalization of enterprises;
• changes in medical reimbursement policies and programs;
• limitations on legal rights and our ability to enforce such rights;
• difficulty in staffing and managing widespread operations;
24
Source: DANAHER CORP /DE/, 10-K, February 21, 2018 Powered by Morningstar® Document Research℠The information contained herein may not be copied, adapted or distributed and is not warranted to be accurate, complete or timely. The user assumes all risks for any damages or losses arising from any use of this information,except to the extent such damages or losses cannot be limited or excluded by applicable law. Past financial performance is no guarantee of future results.

• differing labor regulations;
• difficulties in implementing restructuring actions on a timely or comprehensive basis; and
• differing protection of intellectual property.
Any of these risks could negatively affect our financial statements and business, including our growth rate.
Significant developments stemming from the current U.S. administration or the United Kingdom’s referendum on membership in the EU could have anadverse effect on us.
Changes, potential changes or uncertainties in U.S. social, political, regulatory and economic conditions or laws and policies governing the health caresystem and drug prices, foreign trade, manufacturing, and development and investment in the territories and countries where we or our customers operate,stemming from the current U.S. administration, could adversely affect our business and financial statements. For example, the current U.S. administration hascalled for substantial changes to trade agreements, such as the North American Free Trade Agreement (“NAFTA”), has increased tariffs on certain goodsimported into the United States and has raised the possibility of imposing significant, additional tariff increases.
Additionally, on June 23, 2016, the United Kingdom held a referendum and voted in favor of leaving the EU. This referendum has caused and may continueto cause political and economic uncertainty, including significant volatility in global stock markets and currency exchange rate fluctuations. Although it isunknown what the full terms of the United Kingdom’s future relationship with the EU will be, it is possible that there will be greater restrictions on importsand exports between the United Kingdom and other countries, including the United States, and increased regulatory complexities. Any of these factors couldadversely affect customer demand, our relationships with customers and suppliers and our business and financial statements.
If we suffer loss to our facilities, supply chains, distribution systems or information technology systems due to catastrophe or other events, our operationscould be seriously harmed.
Our facilities, supply chains, distribution systems and information technology systems are subject to catastrophic loss due to fire, flood, earthquake,hurricane, public health crisis, war, terrorism or other natural or man-made disasters. If any of these facilities, supply chains or systems were to experience acatastrophic loss, it could disrupt our operations, delay production and shipments, result in defective products or services, damage customer relationships andour reputation and result in legal exposure and large repair or replacement expenses. The third-party insurance coverage that we maintain will vary from timeto time in both type and amount depending on cost, availability and our decisions regarding risk retention, and may be unavailable or insufficient to protectus against such losses.
Our defined benefit pension plans are subject to financial market risks that could adversely affect our financial statements.
The performance of the financial markets and interest rates impact our defined benefit pension plan expenses and funding obligations. Significant changes inmarket interest rates, decreases in the fair value of plan assets, investment losses on plan assets and changes in discount rates may increase our fundingobligations and adversely impact our financial statements. In addition, upward pressure on the cost of providing health care coverage to current employeesand retirees may increase our future funding obligations and adversely affect our financial statements.
ITEM 1B. UNRESOLVED STAFF COMMENTSNot applicable.
ITEM 2. PROPERTIESDanaher’s corporate headquarters are located in Washington, D.C. in a facility that the Company leases. As of December 31, 2017, the Company had facilitiesin over 60 countries, including approximately 248 significant manufacturing and distribution facilities. 111 of these facilities are located in the United Statesin over 25 states and 137 are located outside the United States in over 31 other countries, primarily in Europe and to a lesser extent in Asia, the rest of NorthAmerica, South America and Australia. These facilities cover approximately 22 million square feet, of which approximately 11 million square feet are ownedand approximately 11 million square feet are leased. Particularly outside the United States, facilities often serve more than one business segment and may beused for multiple purposes, such as administration, sales, manufacturing, warehousing and/or distribution. The number of significant manufacturing anddistribution facilities by business segment is:
• Life Sciences, 76;
• Diagnostics, 77;
25
Source: DANAHER CORP /DE/, 10-K, February 21, 2018 Powered by Morningstar® Document Research℠The information contained herein may not be copied, adapted or distributed and is not warranted to be accurate, complete or timely. The user assumes all risks for any damages or losses arising from any use of this information,except to the extent such damages or losses cannot be limited or excluded by applicable law. Past financial performance is no guarantee of future results.

• Dental, 43; and
• Environmental & Applied Solutions, 52.
The Company considers its facilities suitable and adequate for the purposes for which they are used and does not anticipate difficulty in renewing existingleases as they expire or in finding alternative facilities. The Company believes its properties and equipment have been well-maintained. Refer to Note 15 tothe Consolidated Financial Statements included in this Annual Report for additional information with respect to the Company’s lease commitments.
ITEM 3. LEGAL PROCEEDINGSIn September 2016, the U.S. Environmental Protection Agency (“EPA”) issued a Notice of Violation to the Richmond, Illinois facility of Leica BiosystemsRichmond, Inc. (“Leica Biosystems”), an indirect subsidiary of the Company, alleging that the facility violated certain provisions of the Clean Air Act andrelated regulations pertaining to permitting requirements, emissions limitations and the installation and use of proper controls. In December 2017, LeicaBiosystems and the EPA reached an agreement in principle on an agency administrative settlement whereby all of Leica Biosystems’ alleged violationswould be settled for a payment of approximately $175,000 and certain injunctive relief. The parties expect to reflect the terms of the agreement in principlein an administrative order to be negotiated. The Company does not believe that the final resolution of this matter will have a material adverse effect on theCompany’s results of operations, cash flow or financial condition.
For additional information regarding legal proceedings, refer to the section titled “Legal Proceedings” in MD&A.
ITEM 4. MINE SAFETY DISCLOSURESNot applicable.
EXECUTIVE OFFICERS OF THE REGISTRANTSet forth below are the names, ages, positions and experience of Danaher’s executive officers as of February 8, 2018. All of Danaher’s executive officers holdoffice at the pleasure of Danaher’s Board of Directors. Unless otherwise stated, the positions indicated are Danaher positions.
Name Age Position Officer Since
Steven M. Rales 66 Chairman of the Board 1984Mitchell P. Rales 61 Chairman of the Executive Committee 1984Thomas P. Joyce, Jr. 57 Chief Executive Officer and President 2002Daniel L. Comas 54 Executive Vice President and Chief Financial Officer 1996Rainer M. Blair 53 Executive Vice President 2014William K. Daniel II 53 Executive Vice President 2006Joakim Weidemanis 48 Executive Vice President 2017Brian W. Ellis 51 Senior Vice President – General Counsel 2016William H. King 50 Senior Vice President – Strategic Development 2005Angela S. Lalor 52 Senior Vice President – Human Resources 2012Robert S. Lutz 60 Senior Vice President – Chief Accounting Officer 2002Daniel A. Raskas 51 Senior Vice President – Corporate Development 2004
Steven M. Rales is a co-founder of Danaher and has served on Danaher’s Board of Directors since 1983, serving as Danaher’s Chairman of the Board since1984. He was also CEO of the Company from 1984 to 1990. Mr. Rales is also a member of the board of directors of Fortive Corporation, and is a brother ofMitchell P. Rales.
Mitchell P. Rales is a co-founder of Danaher and has served on Danaher’s Board of Directors since 1983, serving as Chairman of the Executive Committee ofDanaher since 1984. He was also President of the Company from 1984 to 1990. Mr. Rales is also a member of the board of directors of Colfax Corporationand of Fortive Corporation, and is a brother of Steven M. Rales.
Thomas P. Joyce, Jr. has served on Danaher’s Board of Directors and as Danaher’s President and Chief Executive Officer since September 2014 after serving asExecutive Vice President – CEO Designate from April 2014 to September 2014 and as Executive Vice President from 2006 to April 2014.
26
Source: DANAHER CORP /DE/, 10-K, February 21, 2018 Powered by Morningstar® Document Research℠The information contained herein may not be copied, adapted or distributed and is not warranted to be accurate, complete or timely. The user assumes all risks for any damages or losses arising from any use of this information,except to the extent such damages or losses cannot be limited or excluded by applicable law. Past financial performance is no guarantee of future results.

Daniel L. Comas has served as Executive Vice President and Chief Financial Officer since 2005.
Rainer M. Blair has served as Executive Vice President since January 2017 after serving as Vice President – Group Executive from March 2014 until January2017 and as President of Danaher’s Sciex business from January 2011 to March 2014.
William K. Daniel II has served as Executive Vice President since 2008.
Joakim Weidemanis has served as Executive Vice President since December 2017 after serving as Vice President – Group Executive from March 2014 untilDecember 2017 and as Group President – Marking and Coding from January 2013 to March 2014.
Brian W. Ellis has served as Senior Vice President – General Counsel since joining Danaher in January 2016. Prior to joining Danaher, Mr. Ellis served forover five years in progressively more responsible positions in the legal department of Medtronic, Inc., a medical device company, including most recently asVice President and General Counsel of Medtronic’s Restorative Therapies Group.
William H. King has served as Senior Vice President – Strategic Development since May 2014 after serving as Vice President – Strategic Development from2005 to May 2014.
Angela S. Lalor has served as Senior Vice President – Human Resources since joining Danaher in April 2012.
Robert S. Lutz has served as Senior Vice President – Chief Accounting Officer since February 2010.
Daniel A. Raskas has served as Senior Vice President – Corporate Development since February 2010.
27
Source: DANAHER CORP /DE/, 10-K, February 21, 2018 Powered by Morningstar® Document Research℠The information contained herein may not be copied, adapted or distributed and is not warranted to be accurate, complete or timely. The user assumes all risks for any damages or losses arising from any use of this information,except to the extent such damages or losses cannot be limited or excluded by applicable law. Past financial performance is no guarantee of future results.

Table of Contents
PART II
ITEM 5. MARKET FOR THE REGISTRANT’S COMMON EQUITY, RELATED STOCKHOLDER MATTERS AND ISSUER PURCHASES OFEQUITY SECURITIESOur common stock is traded on the New York Stock Exchange under the symbol DHR. As of February 8, 2018, there were approximately 2,500 holders ofrecord of Danaher’s common stock. The high and low common stock prices per share as reported on the New York Stock Exchange, and the dividendsdeclared per share, in each case for the periods described below, were as follows:
2017 2016 (d) High Low Dividends Per Share High Low Dividends Per Share First quarter $ 88.01 $ 78.22 $ 0.14 (a) $ 95.89 $ 81.25 $ 0.16 (b) Second quarter 87.00 81.36 0.14 102.79 92.45 0.16 Third quarter 88.62 78.97 0.14 82.64 76.15 0.125 (c) Fourth quarter 95.16 83.81 0.14 81.30 75.71 0.125
(a) The Company increased its quarterly dividend rate in the first quarter of 2017 to $0.14 per share.(b) The Company increased its quarterly dividend rate in the first quarter of 2016 to $0.16 per share.(c) Subsequent to the Separation of Fortive, the Company reduced its quarterly dividend rate to $0.125 per share.(d) The stock prices in the above table on or prior to July 2, 2016, the date of the Fortive Separation, have not been adjusted for the Separation.
Our payment of dividends in the future will be determined by Danaher’s Board of Directors and will depend on business conditions, Danaher’s earnings andother factors Danaher’s Board deems relevant. For a description of the distribution of the issued and outstanding common stock of Fortive pursuant to theSeparation, refer to Note 3 to the Consolidated Financial Statements included in this Annual Report.
Issuer Purchases of Equity Securities
On July 16, 2013, the Company’s Board of Directors approved a repurchase program (the “Repurchase Program”) authorizing the repurchase of up to 20million shares of the Company’s common stock from time to time on the open market or in privately negotiated transactions. There is no expiration date forthe Repurchase Program, and the timing and amount of any shares repurchased under the program will be determined by the Company’s management basedon its evaluation of market conditions and other factors. The Repurchase Program may be suspended or discontinued at any time. Any repurchased shares willbe available for use in connection with the Company’s equity compensation plans (or any successor plan) and for other corporate purposes. As ofDecember 31, 2017, 20 million shares remained available for repurchase pursuant to the Repurchase Program. The Company expects to fund any future stockrepurchases using the Company’s available cash balances or proceeds from the issuance of debt.
Except in connection with the disposition of the Company’s communications business to NetScout Systems, Inc. (“NetScout”) in 2015, neither the Companynor any “affiliated purchaser” repurchased any shares of Company common stock during 2017, 2016 or 2015. Refer to Note 3 to the Consolidated FinancialStatements included in this Annual Report for a discussion of the 26 million shares of Danaher common stock tendered to and repurchased by the Companyin connection with the disposition of the Company’s communications business to NetScout.
Recent Issuances of Unregistered Securities
During the fourth quarter of 2017, holders of certain of the Company’s Liquid Yield Option Notes due 2021 (“LYONs”) converted such LYONs into anaggregate of one thousand shares of Danaher common stock, par value $0.01 per share. In each case, the shares of common stock were issued solely toexisting security holders upon conversion of the LYONs pursuant to the exemption from registration provided under Section 3(a)(9) of the Securities Act of1933, as amended.
28
Source: DANAHER CORP /DE/, 10-K, February 21, 2018 Powered by Morningstar® Document Research℠The information contained herein may not be copied, adapted or distributed and is not warranted to be accurate, complete or timely. The user assumes all risks for any damages or losses arising from any use of this information,except to the extent such damages or losses cannot be limited or excluded by applicable law. Past financial performance is no guarantee of future results.
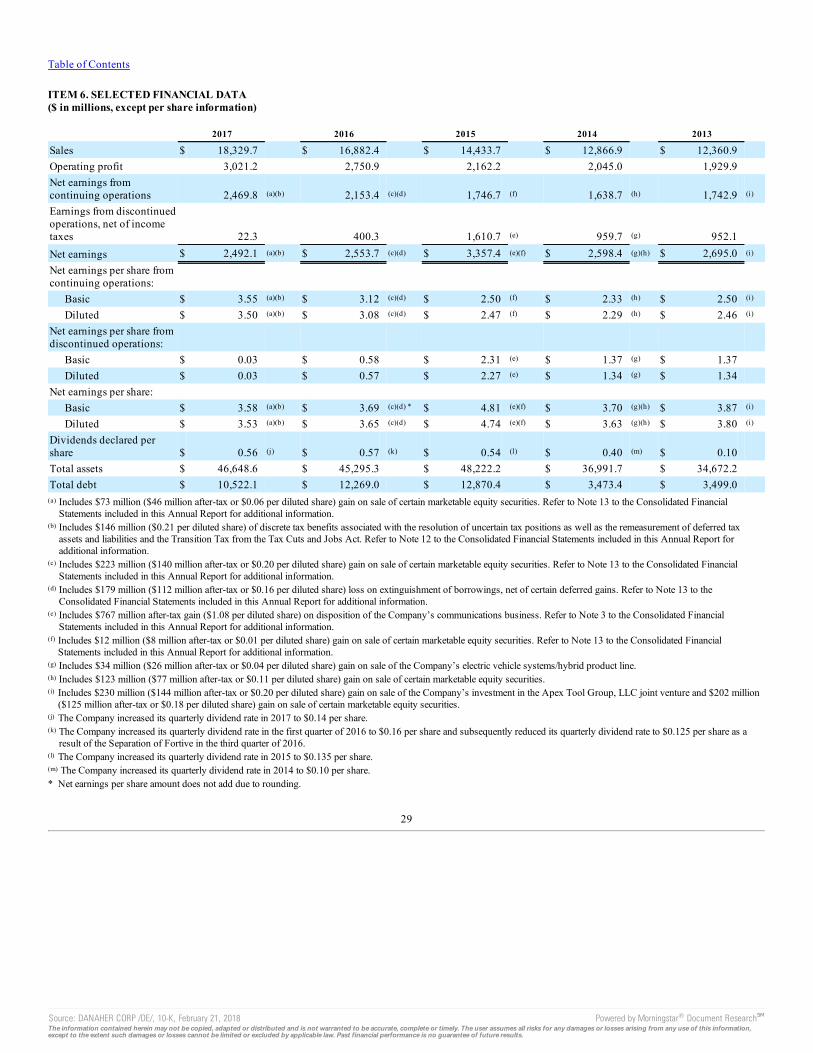
Table of Contents
ITEM 6. SELECTED FINANCIAL DATA($ in millions, except per share information)
2017 2016 2015 2014 2013 Sales $ 18,329.7 $ 16,882.4 $ 14,433.7 $ 12,866.9 $ 12,360.9 Operating profit 3,021.2 2,750.9 2,162.2 2,045.0 1,929.9 Net earnings fromcontinuing operations 2,469.8 (a)(b) 2,153.4 (c)(d) 1,746.7 (f) 1,638.7 (h) 1,742.9 (i) Earnings from discontinuedoperations, net of incometaxes 22.3 400.3 1,610.7 (e) 959.7 (g) 952.1 Net earnings $ 2,492.1 (a)(b) $ 2,553.7 (c)(d) $ 3,357.4 (e)(f) $ 2,598.4 (g)(h) $ 2,695.0 (i) Net earnings per share fromcontinuing operations:
Basic $ 3.55 (a)(b) $ 3.12 (c)(d) $ 2.50 (f) $ 2.33 (h) $ 2.50 (i) Diluted $ 3.50 (a)(b) $ 3.08 (c)(d) $ 2.47 (f) $ 2.29 (h) $ 2.46 (i)
Net earnings per share fromdiscontinued operations:
Basic $ 0.03 $ 0.58 $ 2.31 (e) $ 1.37 (g) $ 1.37 Diluted $ 0.03 $ 0.57 $ 2.27 (e) $ 1.34 (g) $ 1.34
Net earnings per share: Basic $ 3.58 (a)(b) $ 3.69 (c)(d) * $ 4.81 (e)(f) $ 3.70 (g)(h) $ 3.87 (i) Diluted $ 3.53 (a)(b) $ 3.65 (c)(d) $ 4.74 (e)(f) $ 3.63 (g)(h) $ 3.80 (i)
Dividends declared pershare $ 0.56 (j) $ 0.57 (k) $ 0.54 (l) $ 0.40 (m) $ 0.10 Total assets $ 46,648.6 $ 45,295.3 $ 48,222.2 $ 36,991.7 $ 34,672.2 Total debt $ 10,522.1 $ 12,269.0 $ 12,870.4 $ 3,473.4 $ 3,499.0
(a) Includes $73 million ($46 million after-tax or $0.06 per diluted share) gain on sale of certain marketable equity securities. Refer to Note 13 to the Consolidated FinancialStatements included in this Annual Report for additional information.
(b) Includes $146 million ($0.21 per diluted share) of discrete tax benefits associated with the resolution of uncertain tax positions as well as the remeasurement of deferred taxassets and liabilities and the Transition Tax from the Tax Cuts and Jobs Act. Refer to Note 12 to the Consolidated Financial Statements included in this Annual Report foradditional information.
(c) Includes $223 million ($140 million after-tax or $0.20 per diluted share) gain on sale of certain marketable equity securities. Refer to Note 13 to the Consolidated FinancialStatements included in this Annual Report for additional information.
(d) Includes $179 million ($112 million after-tax or $0.16 per diluted share) loss on extinguishment of borrowings, net of certain deferred gains. Refer to Note 13 to theConsolidated Financial Statements included in this Annual Report for additional information.
(e) Includes $767 million after-tax gain ($1.08 per diluted share) on disposition of the Company’s communications business. Refer to Note 3 to the Consolidated FinancialStatements included in this Annual Report for additional information.
(f) Includes $12 million ($8 million after-tax or $0.01 per diluted share) gain on sale of certain marketable equity securities. Refer to Note 13 to the Consolidated FinancialStatements included in this Annual Report for additional information.
(g) Includes $34 million ($26 million after-tax or $0.04 per diluted share) gain on sale of the Company’s electric vehicle systems/hybrid product line.(h) Includes $123 million ($77 million after-tax or $0.11 per diluted share) gain on sale of certain marketable equity securities.(i) Includes $230 million ($144 million after-tax or $0.20 per diluted share) gain on sale of the Company’s investment in the Apex Tool Group, LLC joint venture and $202 million
($125 million after-tax or $0.18 per diluted share) gain on sale of certain marketable equity securities.(j) The Company increased its quarterly dividend rate in 2017 to $0.14 per share.(k) The Company increased its quarterly dividend rate in the first quarter of 2016 to $0.16 per share and subsequently reduced its quarterly dividend rate to $0.125 per share as a
result of the Separation of Fortive in the third quarter of 2016.(l) The Company increased its quarterly dividend rate in 2015 to $0.135 per share.(m) The Company increased its quarterly dividend rate in 2014 to $0.10 per share.* Net earnings per share amount does not add due to rounding.
29
Source: DANAHER CORP /DE/, 10-K, February 21, 2018 Powered by Morningstar® Document Research℠The information contained herein may not be copied, adapted or distributed and is not warranted to be accurate, complete or timely. The user assumes all risks for any damages or losses arising from any use of this information,except to the extent such damages or losses cannot be limited or excluded by applicable law. Past financial performance is no guarantee of future results.

Table of Contents
ITEM 7. MANAGEMENT’S DISCUSSION AND ANALYSIS OF FINANCIAL CONDITION AND RESULTS OF OPERATIONSManagement’s Discussion and Analysis of Financial Condition and Results of Operations (“MD&A”) is designed to provide a reader of Danaher’s financialstatements with a narrative from the perspective of Company management. The Company’s MD&A is divided into five sections:
• Overview
• Results of Operations
• Liquidity and Capital Resources
• Critical Accounting Estimates
• New Accounting Standards
This discussion and analysis should be read along with Danaher’s audited financial statements and related Notes thereto as of December 31, 2017 and 2016and for each of the three years in the period ended December 31, 2017 included in this Annual Report.
OVERVIEWGeneral
Refer to “Item 1. Business—General” for a discussion of Danaher’s strategic objectives and methodologies for delivering long-term shareholder value.Danaher is a multinational business with global operations. During 2017, approximately 63% of Danaher’s sales were derived from customers outside theUnited States. As a diversified, global business, Danaher’s operations are affected by worldwide, regional and industry-specific economic and politicalfactors. Danaher’s geographic and industry diversity, as well as the range of its products, software and services, help limit the impact of any one industry orthe economy of any single country on its consolidated operating results. Given the broad range of products manufactured, software and services provided andgeographies served, management does not use any indices other than general economic trends to predict the overall outlook for the Company. TheCompany’s individual businesses monitor key competitors and customers, including to the extent possible their sales, to gauge relative performance and theoutlook for the future.
As a result of the Company’s geographic and industry diversity, the Company faces a variety of opportunities and challenges, including rapid technologicaldevelopment (particularly with respect to computing, automation, artificial intelligence, mobile connectivity, communications and digitization) in most ofthe Company’s served markets, the expansion and evolution of opportunities in high-growth markets, trends and costs associated with a global labor force,consolidation of the Company’s competitors and increasing regulation. The Company operates in a highly competitive business environment in mostmarkets, and the Company’s long-term growth and profitability will depend in particular on its ability to expand its business in high-growth geographies andhigh-growth market segments, identify, consummate and integrate appropriate acquisitions, develop innovative and differentiated new products and serviceswith higher gross profit margins, expand and improve the effectiveness of the Company’s sales force, continue to reduce costs and improve operatingefficiency and quality, and effectively address the demands of an increasingly regulated global environment. The Company is making significantinvestments, organically and through acquisitions, to address the rapid pace of technological change in its served markets and to globalize its manufacturing,research and development and customer-facing resources (particularly in high-growth markets) in order to be responsive to the Company’s customersthroughout the world and improve the efficiency of the Company’s operations.
Business Performance
Consolidated sales for the year ended December 31, 2017 increased 8.5% as compared to 2016. While differences exist among the Company’s businesses, onan overall basis, demand for the Company’s products and services increased on a year-over-year basis in 2017 as compared to 2016. This demand, togetherwith the Company’s continued investments in sales growth initiatives and the other business-specific factors discussed below, contributed to year-over-yearcore sales growth of 3.5% (for the definition of “core sales,” refer to “—Results of Operations” below). Geographically, both high-growth and developedmarkets contributed to year-over-year core sales growth during 2017. The Company defines high-growth markets as developing markets of the worldexperiencing rapid growth in gross domestic product and infrastructure which includes Eastern Europe, the Middle East, Africa, Latin America and Asia (withthe exception of Japan and Australia). Core sales growth rates in high-growth markets grew at a high-single digit rate in 2017 as compared to 2016 led bystrength in China, India, Eastern Europe and Latin America, partially offset by weakness in the Middle East. High-growth markets represented
30
Source: DANAHER CORP /DE/, 10-K, February 21, 2018 Powered by Morningstar® Document Research℠The information contained herein may not be copied, adapted or distributed and is not warranted to be accurate, complete or timely. The user assumes all risks for any damages or losses arising from any use of this information,except to the extent such damages or losses cannot be limited or excluded by applicable law. Past financial performance is no guarantee of future results.

Table of Contents
approximately 30% of the Company’s total sales in 2017. Core sales in developed markets grew at a low-single digit rate in 2017 as compared to 2016 andwere driven by North America and Western Europe.
The Company’s income from continuing operations for the year-ended December 31, 2017 totaled approximately $2.5 billion, or $3.50 per diluted share,compared to approximately $2.2 billion, or $3.08 per diluted share for the year ended December 31, 2016.
During 2017, the Company made the strategic decision to discontinue a molecular diagnostic product line in its Diagnostics segment. As a result, theCompany recorded $76 million of pretax restructuring, impairment and other related charges ($51 million after-tax or $0.07 per diluted share). These chargesincluded $49 million of noncash charges for the impairment of certain technology-related intangible assets as well as related inventory and property, plantand equipment with no further use. In addition, the Company incurred $27 million of cash restructuring costs primarily related to employee severance andrelated charges. Substantially all restructuring activities related to this discontinued product line were completed in 2017.
Acquisitions
During 2017, the Company acquired ten businesses for total consideration of $386 million in cash, net of cash acquired. The businesses acquiredcomplement existing units of the Company’s Life Sciences, Dental and Environmental & Applied Solutions segments. The aggregate annual sales of theseten businesses at the time of their respective acquisitions, in each case based on the company’s revenues for its last completed fiscal year prior to theacquisition, were $160 million.
For a discussion of the Company’s 2016 and 2015 acquisition and disposition activity, refer to “Liquidity and Capital Resources—Investing Activities”.
Fortive Separation
On July 2, 2016, Danaher completed the Separation of its former Test & Measurement segment, Industrial Technologies segment (excluding the productidentification businesses) and retail/commercial petroleum business by distributing to Danaher stockholders on a pro rata basis all of the issued andoutstanding common stock of Fortive, the entity Danaher incorporated to hold such businesses. To effect the Separation, Danaher distributed to itsstockholders one share of Fortive common stock for every two shares of Danaher common stock outstanding as of June 15, 2016, the record date for thedistribution.
During the second quarter of 2016, the Company received net cash distributions of approximately $3.0 billion from Fortive as consideration for theCompany’s contribution of assets to Fortive in connection with the Separation (“Fortive Distribution”). Danaher used a portion of the cash distributionproceeds to repay the $500 million aggregate principal amount of 2.3% senior unsecured notes that matured in June 2016 and to redeem approximately $1.9billion in aggregate principal amount of outstanding indebtedness in August 2016 (consisting of the Company’s 5.625% senior unsecured notes due 2018,5.4% senior unsecured notes due 2019 and 3.9% senior unsecured notes due 2021 (collectively the “Redeemed Notes”)). Danaher also paid an aggregate of$188 million in make-whole premiums in connection with the August 2016 redemptions, plus accrued and unpaid interest. The Company used the balance ofthe Fortive Distribution to fund certain of the Company’s regular, quarterly cash dividends to shareholders.
The accounting requirements for reporting the Separation of Fortive as a discontinued operation were met when the Separation was completed. Accordingly,the accompanying Consolidated Financial Statements for all periods presented reflect this business as a discontinued operation. The Company allocated aportion of the consolidated interest expense and income to discontinued operations based on the ratio of the discontinued business’ net assets to theCompany’s consolidated net assets. Fortive had revenues of approximately $3.0 billion in 2016 prior to the Separation and approximately $6.2 billion in2015.
As a result of the Separation, the Company incurred $48 million in Separation-related costs during the year ended December 31, 2016 which are included inearnings from discontinued operations, net of income taxes in the accompanying Consolidated Statement of Earnings. These Separation costs primarily relateto professional fees associated with preparation of regulatory filings and Separation activities within finance, tax, legal and information system functions aswell as certain investment banking fees incurred upon the Separation.
In 2017, Danaher recorded a $22 million income tax benefit related to the release of previously provided reserves associated with uncertain tax positions oncertain Danaher tax returns which were jointly filed with Fortive entities. These reserves were released due to the expiration of statutes of limitations for thosereturns. All Fortive entity-related balances were included in the income tax benefit related to discontinued operations.
31
Source: DANAHER CORP /DE/, 10-K, February 21, 2018 Powered by Morningstar® Document Research℠The information contained herein may not be copied, adapted or distributed and is not warranted to be accurate, complete or timely. The user assumes all risks for any damages or losses arising from any use of this information,except to the extent such damages or losses cannot be limited or excluded by applicable law. Past financial performance is no guarantee of future results.
Table of Contents
Sale of Investments
The Company received $138 million of cash proceeds and recorded $22 million in short-term other receivables from the sale of certain marketable equitysecurities during 2017. The Company recorded a pretax gain related to this sale of $73 million ($46 million after-tax or $0.06 per diluted share).
For a discussion of the Company’s 2016 and 2015 sales of investments activity, refer to “Liquidity and Capital Resources—Investing Activities”.
U.S. Tax Cuts and Jobs Act
On December 22, 2017, the TCJA was enacted, which substantially changes the U.S. tax system, including lowering the corporate tax rate from 35% to 21%(beginning in 2018), and affected the Company in a number of ways. As a result of the TCJA, the Company recognized a provisional tax liability ofapproximately $1.2 billion in 2017 for the Transition Tax, which is payable over a period of eight years. The Company also remeasured U.S. deferred taxassets and liabilities based on the income tax rates at which the deferred tax assets and liabilities are expected to reverse in the future (generally 21%),resulting in an income tax benefit of approximately $1.2 billion. After considering the effect of the TCJA, the Company expects its 2018 effective tax rate tobe in the range of 20% to 21%. The Company does not expect the Transition Tax to significantly impact the Company’s cash flows from operations due tothe payment period of eight years and the Company’s ability to use available credits to reduce the required payments. For further discussion of the TCJA,refer to “—Income Taxes.”
RESULTS OF OPERATIONSIn this report, references to the non-GAAP measure of core sales (also referred to as core revenues or sales from existing businesses) refer to sales fromcontinuing operations calculated according to generally accepted accounting principles in the United States (“GAAP”) but excluding:
• sales from acquired businesses; and• the impact of currency translation.
References to sales or operating profit attributable to acquisitions or acquired businesses refer to sales or operating profit, as applicable, from acquiredbusinesses recorded prior to the first anniversary of the acquisition less the amount of sales and operating profit, as applicable, attributable to divestedproduct lines not considered discontinued operations. The portion of revenue attributable to currency translation is calculated as the difference between:
• the period-to-period change in revenue (excluding sales from acquired businesses); and• the period-to-period change in revenue (excluding sales from acquired businesses) after applying current period foreign exchange rates to the prior
year period.Core sales growth should be considered in addition to, and not as a replacement for or superior to, sales, and may not be comparable to similarly titledmeasures reported by other companies. Management believes that reporting the non-GAAP financial measure of core sales growth provides usefulinformation to investors by helping identify underlying growth trends in Danaher’s business and facilitating comparisons of Danaher’s revenue performancewith its performance in prior and future periods and to Danaher’s peers. Management also uses core sales growth to measure the Company’s operating andfinancial performance. The Company excludes the effect of currency translation from core sales because currency translation is not under management’scontrol, is subject to volatility and can obscure underlying business trends, and excludes the effect of acquisitions and divestiture-related items because thenature, size, timing and number of acquisitions and divestitures can vary dramatically from period-to-period and between the Company and its peers and canalso obscure underlying business trends and make comparisons of long-term performance difficult.Throughout this discussion, references to sales volume refer to the impact of both price and unit sales and references to productivity improvements generallyrefer to improved cost efficiencies resulting from the ongoing application of DBS.
32
Source: DANAHER CORP /DE/, 10-K, February 21, 2018 Powered by Morningstar® Document Research℠The information contained herein may not be copied, adapted or distributed and is not warranted to be accurate, complete or timely. The user assumes all risks for any damages or losses arising from any use of this information,except to the extent such damages or losses cannot be limited or excluded by applicable law. Past financial performance is no guarantee of future results.

Table of Contents
Revenue Performance
2017 vs. 2016 2016 vs. 2015
Total sales growth (GAAP) 8.5 % 17.0 %Less the impact of:
Acquisitions and other (4.5)% (15.0)%Currency exchange rates (0.5)% 1.0 %
Core revenue growth (non-GAAP) 3.5 % 3.0 %
Core sales grew on a year-over-year basis in both 2017 and 2016. Sales from acquired businesses increased on a year-over-year basis in both years primarilydue to the acquisitions of Cepheid in the fourth quarter of 2016 and Pall in the third quarter of 2015. Currency translation increased reported sales on a year-over-year basis in 2017 primarily due to the U.S. dollar weakening against the euro, partially offset by the U.S. dollar strengthening against the Japanese yenand Chinese renminbi. Currency translation reduced reported sales on a year-over-year basis in 2016 as the U.S. dollar was, on average, stronger against othermajor currencies.
Operating profit margins were 16.5% for the year ended December 31, 2017 as compared to 16.3% in 2016. The following factors impacted year-over-yearoperating profit margin comparisons.
2017 vs. 2016 operating profit margin comparisons were favorably impacted by:
• Higher 2017 sales volumes from existing businesses and incremental year-over-year cost savings associated with the continuing productivityimprovement initiatives taken in 2017 and 2016, net of incremental year-over-year costs associated with various product development, sales andmarketing growth investments - 70 basis points
• Acquisition-related charges in 2016 - 50 basis points
2017 vs. 2016 operating profit margin comparisons were unfavorably impacted by:
• Restructuring, impairment and other related charges related to discontinuing a product line in the second quarter of 2017 related to the Diagnosticsegment - 40 basis points
• Trade name impairments and related productivity improvement initiatives in the fourth quarter of 2017 related to the Dental segment - 5 basis points
• Third quarter 2016 gain on resolution of acquisition-related matters less the impact of fourth quarter 2017 net gain on resolution of acquisition-related matters - 5 basis points
• The incremental net dilutive effect in 2017 of acquired businesses - 50 basis points
Operating profit margins were 16.3% for the year ended December 31, 2016 as compared to 15.0% in 2015. The following factors impacted year-over-yearoperating profit margin comparisons.
2016 vs. 2015 operating profit margin comparisons were favorably impacted by:
• Higher 2016 sales volumes from existing businesses and incremental year-over-year cost savings associated with the continuing productivityimprovement initiatives taken in 2016 and 2015, net of incremental year-over-year costs associated with various product development, sales andmarketing growth investments and the effect of a stronger U.S. dollar in 2016 - 115 basis points
• Acquisition-related charges in 2015 associated with the acquisition of Pall, including transaction costs deemed significant (the Company deemsacquisition-related transaction costs incurred in a given period to be significant, generally relating to the Company’s larger acquisitions, if itdetermines that such costs exceed the range of acquisition-related transaction costs typical for the Company in a given period), change in controlpayments, and fair value adjustments to acquired inventory and deferred revenue, net of the positive impact of freezing pension benefits - 90 basispoints
• Acquisition-related charges in the first quarter of 2015 associated with the acquisition of Nobel Biocare, primarily related to fair value adjustmentsto acquired inventory - 15 basis points
• 2016 gains on resolution of acquisition-related matters - 10 basis points
33
Source: DANAHER CORP /DE/, 10-K, February 21, 2018 Powered by Morningstar® Document Research℠The information contained herein may not be copied, adapted or distributed and is not warranted to be accurate, complete or timely. The user assumes all risks for any damages or losses arising from any use of this information,except to the extent such damages or losses cannot be limited or excluded by applicable law. Past financial performance is no guarantee of future results.

Table of Contents
2016 vs. 2015 operating profit margin comparisons were unfavorably impacted by:
• Acquisition-related charges in 2016 associated primarily with the acquisition of Cepheid, including transaction costs deemed significant, change incontrol and restructuring payments, and fair value adjustments to acquired inventory and deferred revenue - 50 basis points
• The incremental net dilutive effect in 2016 of acquired businesses - 50 basis points
Business Segments
Sales by business segment for the years ended December 31 are as follows ($ in millions):
2017 2016 2015
Life Sciences $ 5,710.1 $ 5,365.9 $ 3,314.6Diagnostics 5,839.9 5,038.3 4,832.5Dental 2,810.9 2,785.4 2,736.8Environmental & Applied Solutions 3,968.8 3,692.8 3,549.8Total $ 18,329.7 $ 16,882.4 $ 14,433.7
LIFE SCIENCESThe Company’s Life Sciences segment offers a broad range of research tools that scientists use to study the basic building blocks of life, including genes,proteins, metabolites and cells, in order to understand the causes of disease, identify new therapies and test new drugs and vaccines. The segment, through itsPall business, is also a leading provider of filtration, separation and purification technologies to the biopharmaceutical, food and beverage, medical,aerospace, microelectronics and general industrial sectors.
Life Sciences Selected Financial Data
For the Year Ended December 31
($ in millions) 2017 2016 2015
Sales $ 5,710.1 $ 5,365.9 $ 3,314.6Operating profit 1,004.3 818.9 329.2Depreciation 119.0 126.8 77.3Amortization 308.9 299.4 132.8Operating profit as a % of sales 17.6% 15.3% 9.9%Depreciation as a % of sales 2.1% 2.4% 2.3%Amortization as a % of sales 5.4% 5.6% 4.0%
Revenue Performance
2017 vs. 2016 2016 vs. 2015
Total sales growth (GAAP) 6.5 % 62.0 %Less the impact of:
Acquisitions and other (2.0)% (59.0)%Currency exchange rates (0.5)% 0.5 %
Core revenue growth (non-GAAP) 4.0 % 3.5 %
2017 Compared to 2016
During the first quarter of 2017, a product line was transferred from the Life Sciences segment to the Environmental & Applied Solutions segment. While thischange is not material to segment results in total, the resulting change in sales growth has been included in the “Acquisitions and other” line in the tableabove.
34
Source: DANAHER CORP /DE/, 10-K, February 21, 2018 Powered by Morningstar® Document Research℠The information contained herein may not be copied, adapted or distributed and is not warranted to be accurate, complete or timely. The user assumes all risks for any damages or losses arising from any use of this information,except to the extent such damages or losses cannot be limited or excluded by applicable law. Past financial performance is no guarantee of future results.
Table of Contents
Price increases in the segment contributed 0.5% to revenue growth on a year-over-year basis during 2017 as compared with 2016 and are reflected as acomponent of the change in core revenue growth.
Core sales of the business’ broad range of mass spectrometers continued to grow on a year-over-year basis led by strong sales growth in the pharmaceuticalmarket across Asia and North America as well as sales growth in the food and forensics markets across all major regions. This growth was partially offset bycontinuing declines in demand in the clinical market in North America. Core sales of microscopy products increased on a year-over-year basis with growth indemand across most end-markets particularly in Western Europe and the high-growth markets. Year-over-year sales for the business’ flow cytometry andparticle counting products grew in 2017, primarily due to new product introductions and were led by increases in sales in North America, Western Europe andChina. Core sales for filtration, separation and purification technologies grew on a year-over-year basis led by continued growth in biopharmaceuticals andmicroelectronics, partially offset by declines in the process, industrial and medical products particularly in the first half of 2017. Geographically, core sales infiltration, separation and purification technologies were primarily led by growth in North America and Asia, partially offset by declines in the Middle Eastlargely due to a major project in 2016 which did not repeat in 2017.
Operating profit margins increased 230 basis points during 2017 as compared to 2016. The following factors impacted year-over-year operating profit margincomparisons.
2017 vs. 2016 operating profit margin comparisons were favorably impacted by:
• Higher 2017 sales volumes from existing businesses and incremental year-over-year cost savings associated with the continuing productivityimprovement initiatives taken in 2017 and 2016, net of incremental year-over-year costs associated with various new product development, salesand marketing growth investments and the effect of year-over-year changes in currency exchange rates - 205 basis points
• Acquisition-related charges in 2016, including transaction costs deemed significant, change in control and restructuring payments, and fair valueadjustments to acquired inventory and deferred revenue - 10 basis points
• The incremental net accretive effect in 2017 of acquired businesses and intersegment product line transfers - 20 basis points
2017 vs. 2016 operating profit margin comparisons were unfavorably impacted by:
• Fourth quarter 2017 loss on resolution of acquisition-related matters - 5 basis points
2016 Compared to 2015
Price increases in the segment did not have a significant impact on sales growth on a year-over-year basis during 2016 as compared with 2015.
Core sales of the business’ broad range of mass spectrometers continued to grow on a year-over-year basis led by strong core sales growth in thepharmaceutical market in China and India as well as the services businesses. This growth was partially offset by declines in the overall market in Japan andsoftness in demand in the clinical end-market in North America. Core sales of microscopy products were essentially flat on a year-over-year basis with growthin demand in North America and China offset by declines in Japan. Year-over-year demand for the business’ flow cytometry and particle counting productsgrew in 2016, led by increases in demand in North America, Western Europe and China.
The acquisition of Pall in August 2015 contributed the majority of the increase in sales from acquisitions. During the year ended December 31, 2016, Pall’srevenues grew on a year-over-year basis compared to the business’ 2015 results, led by continued growth in the life sciences business primarily due todemand for biopharmaceutical solutions including single-use technologies, partially offset by soft demand in the industrial business as a result of overallmarket weakness.
Operating profit margins increased 540 basis points during 2016 as compared to 2015. The following factors impacted year-over-year operating profit margincomparisons.
2016 vs. 2015 operating profit margin comparisons were favorably impacted by:
• Higher 2016 sales volumes from existing businesses and incremental year-over-year cost savings associated with the continuing productivityimprovement initiatives taken in 2016 and 2015, net of incremental year-over-year costs associated with various product development, sales andmarketing growth investments and the effect of a stronger U.S. dollar in 2016 - 175 basis points
35
Source: DANAHER CORP /DE/, 10-K, February 21, 2018 Powered by Morningstar® Document Research℠The information contained herein may not be copied, adapted or distributed and is not warranted to be accurate, complete or timely. The user assumes all risks for any damages or losses arising from any use of this information,except to the extent such damages or losses cannot be limited or excluded by applicable law. Past financial performance is no guarantee of future results.

Table of Contents
• Acquisition-related charges in 2015 associated with the acquisition of Pall, including transaction costs deemed significant, change in controlpayments, and fair value adjustments to acquired inventory and deferred revenue, net of the positive impact of freezing pension benefits - 390 basispoints
2016 vs. 2015 operating profit margin comparisons were unfavorably impacted by:
• Acquisition-related charges in 2016, including transaction costs deemed significant, change in control and restructuring payments, and fair valueadjustments to acquired inventory and deferred revenue - 10 basis points
• The incremental net dilutive effect in 2016 of acquired businesses (including Pall) - 15 basis points
Depreciation and amortization expense increased during 2016 as compared to 2015 due primarily to the impact of recently acquired businesses, particularlyPall, and the resulting increase in depreciable and amortizable assets.
DIAGNOSTICSThe Company’s Diagnostics segment offers analytical instruments, reagents, consumables, software and services that hospitals, physicians’ offices, referencelaboratories and other critical care settings use to diagnose disease and make treatment decisions.
Diagnostics Selected Financial Data
For the Year Ended December 31
($ in millions) 2017 2016 2015
Sales $ 5,839.9 $ 5,038.3 $ 4,832.5Operating profit 871.6 786.4 746.2Depreciation 368.1 332.1 314.9Amortization 213.4 149.4 134.8Operating profit as a % of sales 14.9% 15.6% 15.4%Depreciation as a % of sales 6.3% 6.6% 6.5%Amortization as a % of sales 3.7% 3.0% 2.8%
Revenue Performance
2017 vs. 2016 2016 vs. 2015
Total sales growth (GAAP) 16.0 % 4.5 %Less the impact of:
Acquisitions and other (12.0)% (3.0)%Currency exchange rates — % 1.0 %
Core revenue growth (non-GAAP) 4.0 % 2.5 %
2017 Compared to 2016
Price increases in the segment contributed 0.5% to sales growth on a year-over-year basis during 2017 as compared with 2016 and are reflected as acomponent of the change in core revenue growth.
Core sales in the clinical lab business increased on a year-over-year basis. Geographically, continued strong demand in high-growth markets for the clinicallab business was partially offset by declines in Western Europe and Japan. Increased demand in the immunoassay product line drove the majority of thegrowth for the year in the clinical lab business. Growth in the acute care diagnostic business was driven by continued strong consumable sales in 2017 acrossmost major geographies. Increased demand for advanced staining and core histology instruments and related consumables across most major geographiesdrove the majority of the year-over-year core sales growth in the pathology diagnostics business.
The acquisition of Cepheid in November 2016 contributed the majority of the increase in sales from acquisitions. During 2017, Cepheid’s revenuescompared to the business’ 2016 results grew on a year-over-year basis in most major geographies and product lines. As Cepheid is integrated into theCompany, a process that will continue over the next several years, the Company has realized and expects to realize cost savings and other business processimprovements through the application of DBS.
36
Source: DANAHER CORP /DE/, 10-K, February 21, 2018 Powered by Morningstar® Document Research℠The information contained herein may not be copied, adapted or distributed and is not warranted to be accurate, complete or timely. The user assumes all risks for any damages or losses arising from any use of this information,except to the extent such damages or losses cannot be limited or excluded by applicable law. Past financial performance is no guarantee of future results.

Table of Contents
During 2017, the Company made the strategic decision to discontinue a molecular diagnostic product line in its Diagnostics segment. As a result, theCompany recorded $76 million of pretax restructuring, impairment and other related charges ($51 million after-tax or $0.07 per diluted share). These chargesincluded $49 million of noncash charges for the impairment of certain technology-related intangible assets as well as related inventory and property, plantand equipment with no further use. In addition, the Company incurred $27 million of cash restructuring costs primarily related to employee severance andrelated charges. Substantially all restructuring activities related to this discontinued product line were completed in 2017.
Operating profit margins declined 70 basis points during 2017 as compared to 2016. The following factors impacted year-over-year operating profit margincomparisons.
2017 vs. 2016 operating profit margin comparisons were favorably impacted by:
• Higher 2017 sales volumes from existing businesses and incremental year-over-year cost savings associated with the continuing productivityimprovement initiatives taken in 2017 and 2016, net of incremental year-over-year costs associated with various new product development, salesand marketing growth investments and the effect of year-over-year changes in currency exchange rates - 35 basis points
• Acquisition-related charges in 2016 associated with the acquisition of Cepheid, including transaction costs deemed significant, change in controland restructuring payments, and fair value adjustments to acquired inventory and deferred revenue - 150 basis points
• 2017 gain on resolution of acquisition-related matters - 25 basis points
2017 vs. 2016 operating profit margin comparisons were unfavorably impacted by:
• Restructuring, impairment and other related charges related to discontinuing a product line in 2017 - 130 basis points
• The incremental net dilutive effect in 2017 of acquired businesses - 150 basis points
Depreciation and amortization increased during 2017 as compared with 2016 primarily due to the impact of recently acquired businesses, primarily Cepheid,and the resulting increase in depreciable and amortizable assets.
2016 Compared to 2015
Price increases in the segment contributed 0.5% to sales growth on a year-over-year basis during 2016 as compared with 2015 and are reflected as acomponent of the change in core revenue growth.
Geographically, demand in the clinical lab business increased on a year-over-year basis led by continuing strong demand in high-growth markets,particularly China, partially offset by declines in North America. Increased demand in the immunoassay products drove the majority of growth for the year inthe clinical business. Continued strong consumable sales in 2016 particularly in China, Western Europe, North America and Japan drove the majority of theyear-over-year sales growth in the acute care diagnostic business. Increased demand for advanced staining consumables, particularly in North America andChina, and core histology instruments across most major geographies, but particularly in China, drove the majority of the year-over-year sales growth in thepathology diagnostics business.
Operating profit margins increased 20 basis points during 2016 as compared to 2015. The following factors impacted year-over-year operating profit margincomparisons.
2016 vs. 2015 operating profit margin comparisons were favorably impacted by:
• Higher 2016 sales volumes from existing businesses and incremental year-over-year cost savings associated with the continuing productivityimprovement initiatives taken in 2016 and 2015, net of incremental year-over-year costs associated with various product development, sales andmarketing growth investments and the effect of a stronger U.S. dollar in 2016 - 200 basis points
2016 vs. 2015 operating profit margin comparisons were unfavorably impacted by:
• Acquisition-related charges in 2016 associated with the acquisition of Cepheid, including transaction costs deemed significant, change in controland restructuring payments, and fair value adjustments to acquired inventory and deferred revenue - 150 basis points
• The incremental net dilutive effect in 2016 of acquired businesses - 30 basis points
37
Source: DANAHER CORP /DE/, 10-K, February 21, 2018 Powered by Morningstar® Document Research℠The information contained herein may not be copied, adapted or distributed and is not warranted to be accurate, complete or timely. The user assumes all risks for any damages or losses arising from any use of this information,except to the extent such damages or losses cannot be limited or excluded by applicable law. Past financial performance is no guarantee of future results.

Table of Contents
Amortization increased during 2016 as compared with 2015 primarily due to the impact of recently acquired businesses including Cepheid and the resultingincrease in amortizable assets.
DENTALThe Company’s Dental segment provides products that are used to diagnose, treat and prevent disease and ailments of the teeth, gums and supporting bone,as well as to improve the aesthetics of the human smile. The Company is a leading worldwide provider of a broad range of dental consumables, equipmentand services, and is dedicated to driving technological innovations that help dental professionals improve clinical outcomes and enhance productivity.
Dental Selected Financial Data
For the Year Ended December 31
($ in millions) 2017 2016 2015
Sales $ 2,810.9 $ 2,785.4 $ 2,736.8Operating profit 400.7 419.4 370.4Depreciation 39.7 43.8 50.0Amortization 81.7 83.4 82.0Operating profit as a % of sales 14.3% 15.1% 13.5%Depreciation as a % of sales 1.4% 1.6% 1.8%Amortization as a % of sales 2.9% 3.0% 3.0%
Revenue Performance
2017 vs. 2016 2016 vs. 2015
Total sales growth (GAAP) 1.0 % 2.0 %Less the impact of:
Acquisitions and other — % (0.5)%Currency exchange rates (1.0)% 0.5 %
Core revenue growth (non-GAAP) — % 2.0 %
2017 Compared to 2016
Price increases in the segment did not have a significant impact on sales growth on a year-over-year basis during 2017 as compared with 2016.
Geographically, year-over-year core revenue growth was strong in China, Russia and other high-growth markets, offset by lower demand in the United Statesand Western Europe. Strong year-over-year growth continued during 2017 for the specialty consumables business, which consists of implant solutions andorthodontic products. Core sales growth for the specialty consumables business was led by high-growth markets and North America. Dental equipment coresales were essentially flat during 2017, as increased demand in high-growth markets was offset by weaker demand in the United States and Western Europe,particularly later in the year for North America due to the realignment of dental equipment distributors and manufacturers. Demand was lower for traditionaldental consumable product lines in North America and Western Europe reflecting inventory destocking by several distribution partners. While the impact ofinventory destocking in the consumables business began to lessen late in 2017, the recent realignment of distributors and manufacturers in the dentalindustry, primarily in North America, may have a continued negative impact on revenues in the near-term.
Operating profit margins declined 80 basis points during 2017 as compared to 2016. The following factors unfavorably impacted year-over-year operatingprofit margin comparisons:
• Incremental year-over-year costs associated with various new product development, sales and marketing growth investments, the effect of year-over-year changes in currency exchange rates and unfavorable product mix due to lower sales of dental consumables in 2017, net of incremental year-over-year cost savings associated with the continuing productivity improvement initiatives taken in 2017 and 2016 - 35 basis points
• Trade name impairments and related productivity improvement initiatives in 2017 - 35 basis points
38
Source: DANAHER CORP /DE/, 10-K, February 21, 2018 Powered by Morningstar® Document Research℠The information contained herein may not be copied, adapted or distributed and is not warranted to be accurate, complete or timely. The user assumes all risks for any damages or losses arising from any use of this information,except to the extent such damages or losses cannot be limited or excluded by applicable law. Past financial performance is no guarantee of future results.
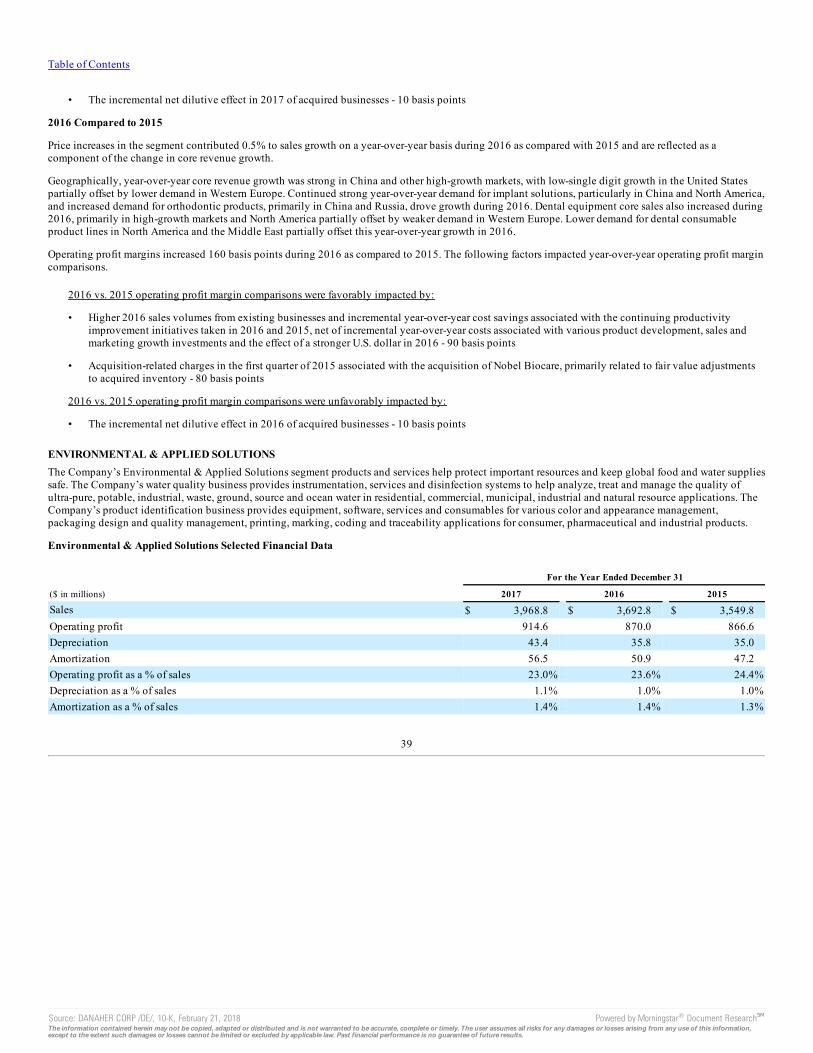
Table of Contents
• The incremental net dilutive effect in 2017 of acquired businesses - 10 basis points
2016 Compared to 2015
Price increases in the segment contributed 0.5% to sales growth on a year-over-year basis during 2016 as compared with 2015 and are reflected as acomponent of the change in core revenue growth.
Geographically, year-over-year core revenue growth was strong in China and other high-growth markets, with low-single digit growth in the United Statespartially offset by lower demand in Western Europe. Continued strong year-over-year demand for implant solutions, particularly in China and North America,and increased demand for orthodontic products, primarily in China and Russia, drove growth during 2016. Dental equipment core sales also increased during2016, primarily in high-growth markets and North America partially offset by weaker demand in Western Europe. Lower demand for dental consumableproduct lines in North America and the Middle East partially offset this year-over-year growth in 2016.
Operating profit margins increased 160 basis points during 2016 as compared to 2015. The following factors impacted year-over-year operating profit margincomparisons.
2016 vs. 2015 operating profit margin comparisons were favorably impacted by:
• Higher 2016 sales volumes from existing businesses and incremental year-over-year cost savings associated with the continuing productivityimprovement initiatives taken in 2016 and 2015, net of incremental year-over-year costs associated with various product development, sales andmarketing growth investments and the effect of a stronger U.S. dollar in 2016 - 90 basis points
• Acquisition-related charges in the first quarter of 2015 associated with the acquisition of Nobel Biocare, primarily related to fair value adjustmentsto acquired inventory - 80 basis points
2016 vs. 2015 operating profit margin comparisons were unfavorably impacted by:
• The incremental net dilutive effect in 2016 of acquired businesses - 10 basis points
ENVIRONMENTAL & APPLIED SOLUTIONSThe Company’s Environmental & Applied Solutions segment products and services help protect important resources and keep global food and water suppliessafe. The Company’s water quality business provides instrumentation, services and disinfection systems to help analyze, treat and manage the quality ofultra-pure, potable, industrial, waste, ground, source and ocean water in residential, commercial, municipal, industrial and natural resource applications. TheCompany’s product identification business provides equipment, software, services and consumables for various color and appearance management,packaging design and quality management, printing, marking, coding and traceability applications for consumer, pharmaceutical and industrial products.
Environmental & Applied Solutions Selected Financial Data
For the Year Ended December 31
($ in millions) 2017 2016 2015
Sales $ 3,968.8 $ 3,692.8 $ 3,549.8Operating profit 914.6 870.0 866.6Depreciation 43.4 35.8 35.0Amortization 56.5 50.9 47.2Operating profit as a % of sales 23.0% 23.6% 24.4%Depreciation as a % of sales 1.1% 1.0% 1.0%Amortization as a % of sales 1.4% 1.4% 1.3%
39
Source: DANAHER CORP /DE/, 10-K, February 21, 2018 Powered by Morningstar® Document Research℠The information contained herein may not be copied, adapted or distributed and is not warranted to be accurate, complete or timely. The user assumes all risks for any damages or losses arising from any use of this information,except to the extent such damages or losses cannot be limited or excluded by applicable law. Past financial performance is no guarantee of future results.

Table of Contents
Revenue Performance
2017 vs. 2016 2016 vs. 2015
Total sales growth (GAAP) 7.5 % 4.0 %Less the impact of:
Acquisitions and other (3.0)% (2.5)%Currency exchange rates (0.5)% 1.5 %
Core revenue growth (non-GAAP) 4.0 % 3.0 %
2017 Compared to 2016
During the first quarter of 2017, a product line was transferred from the Life Sciences segment to the Environmental & Applied Solutions segment. While thischange is not material to segment results in total, the resulting change in sales growth has been included in the “Acquisitions and other” line in the tableabove.
Price increases in the segment contributed 1.0% to sales growth on a year-over-year basis during 2017 as compared with 2016 and are reflected as acomponent of the change in core revenue growth.
Core sales in the segment’s water quality businesses grew at a low-single digit rate during 2017 as compared with 2016. Year-over-year core sales in theanalytical instrumentation product line grew, as increased demand in the industrial and municipal end-markets was partially offset by lower demand in theenvironmental end-markets. Geographically, year-over-year core revenue growth in the analytical instrumentation product line was driven by increaseddemand in China, Western Europe and North America, partially offset by lower demand in the Middle East and Latin America. Year-over-year core revenuegrowth in the business’ chemical treatment solutions product line was due primarily to an expansion of the customer base in the United States, driven byhigher demand in food, steel and oil and gas-related end-markets. Core sales in the business’ ultraviolet water disinfection product line grew on a year-over-year basis due primarily to higher demand in municipal and industrial end-markets in North America, Western Europe and Asia.
Core sales in the segment’s product identification businesses grew at a mid-single digit rate during 2017 as compared with 2016. Continued strong year-over-year demand for marking and coding equipment and related consumables in most major geographies, led by North America and Western Europe, drove themajority of the core revenue growth. Demand for the business’ packaging and color solutions also increased year-over-year. Geographically, core revenuegrowth for packaging and color solutions was led by North America, Western Europe and Asia.
Operating profit margins declined 60 basis points during 2017 as compared to 2016. The following factors impacted year-over-year operating profit margincomparisons.
2017 vs. 2016 operating profit margin comparisons were favorably impacted by:
• Higher 2017 sales volumes, incremental year-over-year cost savings associated with the continuing productivity improvement initiatives taken in2017 and 2016, improved pricing and the effect of year-over-year changes in currency exchange rates, net of incremental year-over-year costsassociated with various new product development and sales and marketing growth investments - 5 basis points
2017 vs. 2016 operating profit margin comparisons were unfavorably impacted by:
• The incremental net dilutive effect in 2017 of acquired businesses - 65 basis points
2016 Compared to 2015
Price increases in the segment contributed 1.0% to sales growth on a year-over-year basis during 2016 as compared with 2015 and are reflected as acomponent of the change in core revenue growth.
Core sales in the segment’s water quality businesses grew at a low-single digit rate during 2016 as compared with 2015. Year-over-year core sales in theanalytical instrumentation product line grew, as increases in sales to the U.S. municipal end-market and Western Europe were partially offset by lowerdemand in Eastern Europe and China. Year-over-year core revenue growth in the business’ chemical treatment solutions product line was due primarily to anexpansion of the customer base in the United States. Chemical treatment solutions saw an improvement in commodity oriented end-markets in Latin Americain the fourth quarter of 2016 after declining growth in the earlier portion of 2016. Core sales in the business’ ultraviolet water disinfection
40
Source: DANAHER CORP /DE/, 10-K, February 21, 2018 Powered by Morningstar® Document Research℠The information contained herein may not be copied, adapted or distributed and is not warranted to be accurate, complete or timely. The user assumes all risks for any damages or losses arising from any use of this information,except to the extent such damages or losses cannot be limited or excluded by applicable law. Past financial performance is no guarantee of future results.

Table of Contents
product line grew on a year-over-year basis due primarily to higher demand in municipal and industrial end-markets in Western Europe, China and Australia.
Core sales in the segment’s product identification businesses grew at a mid-single digit rate during 2016 as compared with 2015. Continued strong year-over-year demand for marking and coding equipment and related consumables in most major geographies, led by North America, Western Europe and LatinAmerica, drove the majority of the core revenue growth. Demand for the business’ packaging and color solutions was flat year-over-year, as core revenuegrowth in the second half of the year was offset by weakness in the first half of the year. Geographically, increased demand in the high-growth markets wasoffset by weaker demand in North America and Europe.
Operating profit margins declined 80 basis points during 2016 as compared to 2015. The following factors unfavorably impacted year-over-year operatingprofit margin comparisons.
• The incremental net dilutive effect in 2016 of acquired businesses - 75 basis points
• Incremental year-over-year costs associated with various product development, sales and marketing growth investments and the effect of a strongerU.S. dollar in 2016, net of higher 2016 sales volumes from existing businesses and incremental year-over-year cost savings associated with thecontinuing productivity improvement initiatives taken in 2016 and 2015 - 5 basis points
COST OF SALES AND GROSS PROFIT
For the Year Ended December 31
($ in millions) 2017 2016 2015
Sales $ 18,329.7 $ 16,882.4 $ 14,433.7Cost of sales (8,137.2) (7,547.8) (6,662.6)Gross profit $ 10,192.5 $ 9,334.6 $ 7,771.1Gross profit margin 55.6% 55.3% 53.8%
The year-over-year increase in cost of sales during 2017 as compared with 2016 is due primarily to the impact of higher year-over-year sales volumes,including sales from recently acquired businesses and the impact of restructuring, impairment and other related charges associated with the Company’sstrategic decision to discontinue a product line in its Diagnostics segment. This increase in cost of sales was partially offset by year-over-year cost savings atrecently acquired businesses, incremental year-over-year cost savings associated with the continued productivity improvement actions taken in 2017 and2016, and the year-over-year decrease in acquisition-related charges associated with fair value adjustments to acquired inventory which decreased cost ofsales by $21 million during 2017 as compared to 2016.
The year-over-year increase in cost of sales during 2016 as compared with 2015, is due primarily to the impact of higher year-over-year sales volumes,including sales from recently acquired businesses. This increase in cost of sales was partially offset by year-over-year cost savings at recently acquiredbusinesses, particularly Pall, incremental year-over-year cost savings associated with the continued productivity improvement actions taken in 2016 and2015, and the year-over-year decrease in acquisition-related charges associated with fair value adjustments to acquired inventory which decreased cost ofsales by $85 million during 2016 as compared to 2015.
The year-over-year increase in gross profit margins during 2017 as compared with 2016 is due primarily to the favorable impact of higher year-over-year salesvolumes and incremental year-over-year cost savings associated with the continuing productivity improvements taken in 2017 and 2016. In addition, theacquisition-related charges associated with fair value adjustments to acquired inventory and deferred revenue were higher in 2016 than 2017, whichimproved gross profit margins by 10 basis points during 2017 as compared with 2016.
The year-over-year increase in gross profit margins during 2016 as compared with 2015 is due primarily to the favorable impact of higher year-over-year salesvolumes, incremental year-over-year cost savings associated with the continuing productivity improvements taken in 2016 and 2015 and improved grossprofit margins on a year-over-year basis at recently acquired businesses, particularly Pall. In addition, the acquisition-related charges associated with fairvalue adjustments to acquired inventory and deferred revenue were higher in 2015 than 2016, which improved gross profit margins by 50 basis points during2016 as compared with 2015.
41
Source: DANAHER CORP /DE/, 10-K, February 21, 2018 Powered by Morningstar® Document Research℠The information contained herein may not be copied, adapted or distributed and is not warranted to be accurate, complete or timely. The user assumes all risks for any damages or losses arising from any use of this information,except to the extent such damages or losses cannot be limited or excluded by applicable law. Past financial performance is no guarantee of future results.
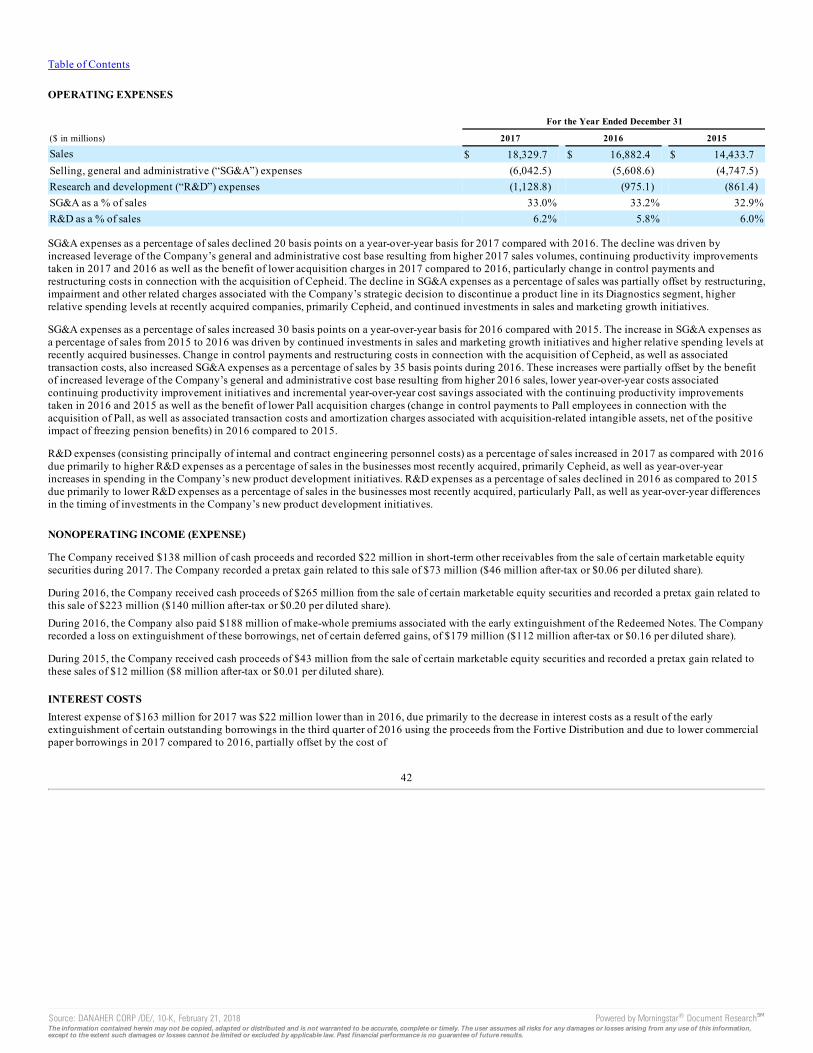
Table of Contents
OPERATING EXPENSES
For the Year Ended December 31
($ in millions) 2017 2016 2015
Sales $ 18,329.7 $ 16,882.4 $ 14,433.7Selling, general and administrative (“SG&A”) expenses (6,042.5) (5,608.6) (4,747.5)Research and development (“R&D”) expenses (1,128.8) (975.1) (861.4)SG&A as a % of sales 33.0% 33.2% 32.9%R&D as a % of sales 6.2% 5.8% 6.0%
SG&A expenses as a percentage of sales declined 20 basis points on a year-over-year basis for 2017 compared with 2016. The decline was driven byincreased leverage of the Company’s general and administrative cost base resulting from higher 2017 sales volumes, continuing productivity improvementstaken in 2017 and 2016 as well as the benefit of lower acquisition charges in 2017 compared to 2016, particularly change in control payments andrestructuring costs in connection with the acquisition of Cepheid. The decline in SG&A expenses as a percentage of sales was partially offset by restructuring,impairment and other related charges associated with the Company’s strategic decision to discontinue a product line in its Diagnostics segment, higherrelative spending levels at recently acquired companies, primarily Cepheid, and continued investments in sales and marketing growth initiatives.
SG&A expenses as a percentage of sales increased 30 basis points on a year-over-year basis for 2016 compared with 2015. The increase in SG&A expenses asa percentage of sales from 2015 to 2016 was driven by continued investments in sales and marketing growth initiatives and higher relative spending levels atrecently acquired businesses. Change in control payments and restructuring costs in connection with the acquisition of Cepheid, as well as associatedtransaction costs, also increased SG&A expenses as a percentage of sales by 35 basis points during 2016. These increases were partially offset by the benefitof increased leverage of the Company’s general and administrative cost base resulting from higher 2016 sales, lower year-over-year costs associatedcontinuing productivity improvement initiatives and incremental year-over-year cost savings associated with the continuing productivity improvementstaken in 2016 and 2015 as well as the benefit of lower Pall acquisition charges (change in control payments to Pall employees in connection with theacquisition of Pall, as well as associated transaction costs and amortization charges associated with acquisition-related intangible assets, net of the positiveimpact of freezing pension benefits) in 2016 compared to 2015.
R&D expenses (consisting principally of internal and contract engineering personnel costs) as a percentage of sales increased in 2017 as compared with 2016due primarily to higher R&D expenses as a percentage of sales in the businesses most recently acquired, primarily Cepheid, as well as year-over-yearincreases in spending in the Company’s new product development initiatives. R&D expenses as a percentage of sales declined in 2016 as compared to 2015due primarily to lower R&D expenses as a percentage of sales in the businesses most recently acquired, particularly Pall, as well as year-over-year differencesin the timing of investments in the Company’s new product development initiatives.
NONOPERATING INCOME (EXPENSE)
The Company received $138 million of cash proceeds and recorded $22 million in short-term other receivables from the sale of certain marketable equitysecurities during 2017. The Company recorded a pretax gain related to this sale of $73 million ($46 million after-tax or $0.06 per diluted share).
During 2016, the Company received cash proceeds of $265 million from the sale of certain marketable equity securities and recorded a pretax gain related tothis sale of $223 million ($140 million after-tax or $0.20 per diluted share).During 2016, the Company also paid $188 million of make-whole premiums associated with the early extinguishment of the Redeemed Notes. The Companyrecorded a loss on extinguishment of these borrowings, net of certain deferred gains, of $179 million ($112 million after-tax or $0.16 per diluted share).
During 2015, the Company received cash proceeds of $43 million from the sale of certain marketable equity securities and recorded a pretax gain related tothese sales of $12 million ($8 million after-tax or $0.01 per diluted share).
INTEREST COSTSInterest expense of $163 million for 2017 was $22 million lower than in 2016, due primarily to the decrease in interest costs as a result of the earlyextinguishment of certain outstanding borrowings in the third quarter of 2016 using the proceeds from the Fortive Distribution and due to lower commercialpaper borrowings in 2017 compared to 2016, partially offset by the cost of
42
Source: DANAHER CORP /DE/, 10-K, February 21, 2018 Powered by Morningstar® Document Research℠The information contained herein may not be copied, adapted or distributed and is not warranted to be accurate, complete or timely. The user assumes all risks for any damages or losses arising from any use of this information,except to the extent such damages or losses cannot be limited or excluded by applicable law. Past financial performance is no guarantee of future results.

Table of Contents
additional long-term debt refinancing relating to the acquisition of Cepheid. For a further description of the Company’s debt as of December 31, 2017 refer toNote 9 to the Consolidated Financial Statements. Interest expense of $184 million in 2016 was $45 million higher than the 2015 interest expense of $140million due primarily to the higher interest costs associated with the debt issued in the second half of 2015 in connection with the 2015 acquisition of Pall,partially offset by decreases in interest costs as a result of the early extinguishment of the Redeemed Notes in the third quarter of 2016 using the proceedsfrom the Fortive Distribution.
INCOME TAXESGeneralIncome tax expense and deferred tax assets and liabilities reflect management’s assessment of future taxes expected to be paid on items reflected in theCompany’s Consolidated Financial Statements. The Company records the tax effect of discrete items and items that are reported net of their tax effects in theperiod in which they occur.
The Company’s effective tax rate can be affected by changes in the mix of earnings in countries with different statutory tax rates (including as a result ofbusiness acquisitions and dispositions), changes in the valuation of deferred tax assets and liabilities, accruals related to contingent tax liabilities and period-to-period changes in such accruals, the results of audits and examinations of previously filed tax returns (as discussed below), the expiration of statutes oflimitations, the implementation of tax planning strategies, tax rulings, court decisions, settlements with tax authorities and changes in tax laws andregulations, including the TCJA and legislative policy changes that may result from the OECD’s initiative on Base Erosion and Profit Shifting. For adescription of the tax treatment of earnings that are planned to be reinvested indefinitely outside the United States, refer to “—Liquidity and CapitalResources – Cash and Cash Requirements” below.
The amount of income taxes the Company pays is subject to ongoing audits by federal, state and foreign tax authorities, which often result in proposedassessments. Management performs a comprehensive review of its global tax positions on a quarterly basis. Based on these reviews, the results of discussionsand resolutions of matters with certain tax authorities, tax rulings and court decisions and the expiration of statutes of limitations, reserves for contingent taxliabilities are accrued or adjusted as necessary. For a discussion of risks related to these and other tax matters, refer to “Item 1A. Risk Factors”.
On December 22, 2017, the TCJA was enacted, substantially changing the U.S. tax system and affecting the Company in a number of ways. Notably, theTCJA:
• establishes a flat corporate income tax rate of 21.0% on U.S. earnings;
• imposes a one-time tax on unremitted cumulative non-U.S. earnings of foreign subsidiaries, which we refer to in this Annual Report as the TransitionTax;
• imposes a new minimum tax on certain non-U.S. earnings, irrespective of the territorial system of taxation, and generally allows for the repatriationof future earnings of foreign subsidiaries without incurring additional U.S. taxes by transitioning to a territorial system of taxation;
• subjects certain payments made by a U.S. company to a related foreign company to certain minimum taxes (Base Erosion Anti-Abuse Tax);
• eliminates certain prior tax incentives for manufacturing in the United States and creates an incentive for U.S. companies to sell, lease or licensegoods and services abroad by allowing for a reduction in taxes owed on earnings related to such sales;
• allows the cost of investments in certain depreciable assets acquired and placed in service after September 27, 2017 to be immediately expensed;and
• reduces deductions with respect to certain compensation paid to specified executive officers.
While the changes from the TCJA are generally effective beginning in 2018, U.S. GAAP accounting for income taxes requires the effect of a change in taxlaws or rates to be recognized in income from continuing operations for the period that includes the enactment date. Due to the complexities involved inaccounting for the enactment of the TCJA, the SEC Staff Accounting Bulletin No. 118 (“SAB No. 118”) allowed the Company to record provisional amountsin earnings for the year ended December 31, 2017. Where reasonable estimates can be made, the provisional accounting should be based on such estimates.When no reasonable estimate can be made, the provisional accounting may be based on the tax law in effect before the TCJA. The Company is required tocomplete its tax accounting for the TCJA within a one year period when it has obtained, prepared, and analyzed the information to complete the income taxaccounting.
43
Source: DANAHER CORP /DE/, 10-K, February 21, 2018 Powered by Morningstar® Document Research℠The information contained herein may not be copied, adapted or distributed and is not warranted to be accurate, complete or timely. The user assumes all risks for any damages or losses arising from any use of this information,except to the extent such damages or losses cannot be limited or excluded by applicable law. Past financial performance is no guarantee of future results.

Table of Contents
The Company has not completed its accounting for the tax effects of enactment of the TCJA; however, as described below, the Company has made reasonableestimates of the effects of the TCJA on its Consolidated Financial Statements which are included as a component of income tax expense from continuingoperations:
• Deferred tax assets and liabilities: U.S. deferred tax assets and liabilities were remeasured based on the rates at which they are expected to reverse inthe future, which is generally 21.0%, resulting in an income tax benefit of approximately $1.2 billion. The Company will continue to analyzecertain aspects of the TCJA which could potentially affect the tax basis of the reported amounts. Additionally, the Company’s U.S. tax returns for2017 will be filed during the fourth quarter of 2018 and any changes to the tax positions for temporary differences compared to the estimates usedwill result in an adjustment of the estimated tax benefit recorded as of December 31, 2017.
• Transition Tax effects: The Transition Tax is based on the Company’s total post-1986 earnings and profits that were previously deferred from U.S.income taxes. The Company recorded a provisional amount for the Transition Tax expense resulting in an increase in income tax expense ofapproximately $1.2 billion. The Company will continue to evaluate the TCJA and any future guidance from the U.S. Treasury Department and IRSin the determination of the Transition Tax which could result in adjustment of the estimate recorded as of December 31, 2017.
• Indefinite reinvestment: As of December 31, 2017, the Company held $593 million of cash and approximately $656 million of cash equivalents (asdefined by the TCJA, including trade accounts receivable net of trade accounts payable balances and certain accrued expenses) outside the UnitedStates. While repatriation of some cash held outside the United States may be restricted by local laws, most of the Company’s foreign cash could berepatriated to the United States. Following enactment of the TCJA and the associated Transition Tax, in general, repatriation of cash to the UnitedStates can be completed with no incremental U.S. tax; however, repatriation of cash could subject the Company to non-U.S. jurisdictional taxes ondistributions. The cash that the Company’s non-U.S. subsidiaries hold for indefinite reinvestment is generally used to finance foreign operations andinvestments, including acquisitions. The income taxes applicable to such earnings are not readily determinable or practicable. The Companycontinues to evaluate the impact of the TCJA on its election to indefinitely reinvest certain of its non-U.S. earnings.
The Company will continue to analyze the effects of the TCJA on its Consolidated Financial Statements and operations. Additional impacts from theenactment of the TCJA will be recorded as they are identified during the measurement period as provided for in SAB No. 118, which extends up to one yearfrom the enactment date.
Year-Over-Year Changes in the Tax Provision and Effective Tax Rate
The Company’s effective tax rate related to continuing operations for the years ended December 31, 2017, 2016 and 2015 was 16.0%, 17.5% and 14.4%,respectively.
The Company’s effective tax rate for each of 2017, 2016 and 2015 differs from the U.S. federal statutory rate of 35.0% due principally to the Company’searnings outside the United States that are indefinitely reinvested and taxed at rates lower than the U.S. federal statutory rate. In addition:
• The effective tax rate of 16.0% in 2017 includes 500 basis points of net tax benefits related to the revaluation of net U.S. deferred tax liabilities from35.0% to 21.0% due to the TCJA and release of reserves upon statute of limitation expiration, partially offset by income tax expense related to theTransition Tax on foreign earnings due to the TCJA and changes in estimates associated with prior period uncertain tax positions.
• The effective tax rate of 17.5% in 2016 includes 350 basis points of net tax benefits from permanent foreign exchange losses and the release ofreserves upon the expiration of statutes of limitation and audit settlements, partially offset by income tax expense related to repatriation of earningsand legal entity realignments associated with the Separation and changes in estimates associated with prior period uncertain tax positions.
• The effective tax rate of 14.4% in 2015 includes 290 basis points of net tax benefits from permanent foreign exchange losses, releases of valuationallowances related to foreign operating losses and the release of reserves upon the expiration of statutes of limitation, partially offset by changes inestimates associated with prior period uncertain tax positions.
The Company conducts business globally, and files numerous consolidated and separate income tax returns in the U.S. federal, state and foreign jurisdictions.The countries in which the Company has a material presence that have had significantly lower statutory tax rates than the United States include China,Denmark, Germany, Singapore, Switzerland and the United Kingdom. The Company’s ability to obtain a tax benefit from lower statutory tax rates outside ofthe United States depends on its levels of taxable income in these foreign countries and the amount of foreign earnings which are indefinitely reinvested inthose
44
Source: DANAHER CORP /DE/, 10-K, February 21, 2018 Powered by Morningstar® Document Research℠The information contained herein may not be copied, adapted or distributed and is not warranted to be accurate, complete or timely. The user assumes all risks for any damages or losses arising from any use of this information,except to the extent such damages or losses cannot be limited or excluded by applicable law. Past financial performance is no guarantee of future results.

Table of Contents
countries. The Company believes that a change in the statutory tax rate of any individual foreign country would not have a material effect on the Company’sConsolidated Financial Statements given the geographic dispersion of the Company’s taxable income.
The Company and its subsidiaries are routinely examined by various domestic and international taxing authorities. The IRS has completed substantially allof the examinations of the Company’s federal income tax returns through 2011 and is currently examining certain of the Company’s federal income taxreturns for 2012 through 2015. In addition, the Company has subsidiaries in Austria, Belgium, Canada, China, Denmark, Finland, France, Germany, HongKong, India, Italy, Japan, New Zealand, Sweden, Switzerland, the United Kingdom and various other countries, states and provinces that are currently underaudit for years ranging from 2004 through 2015.
Tax authorities in Denmark have raised significant issues related to interest accrued by certain of the Company’s subsidiaries. On December 10, 2013, theCompany received assessments from the Danish tax authority (“SKAT”) totaling approximately DKK 1.5 billion (approximately $245 million based onexchange rates as of December 31, 2017) including interest through December 31, 2017, imposing withholding tax relating to interest accrued in Denmark onborrowings from certain of the Company’s subsidiaries for the years 2004-2009. The Company is currently in discussions with SKAT and anticipatesreceiving an assessment for years 2010-2012 totaling approximately DKK 895 million (approximately $144 million based on exchange rates as ofDecember 31, 2017) including interest through December 31, 2017. Management believes the positions the Company has taken in Denmark are inaccordance with the relevant tax laws and is vigorously defending its positions. The Company appealed these assessments with the National Tax Tribunal in2014 and intends on pursuing this matter through the European Court of Justice should this appeal be unsuccessful. The ultimate resolution of this matter isuncertain, could take many years, and could result in a material adverse impact to the Company’s financial statements, including its effective tax rate.
After considering the effect of the TCJA, the Company expects its 2018 effective tax rate to be in the range of 20% to 21%. Any future legislative changes inthe United States including regulations related to the TCJA or potential tax reform in other jurisdictions, could cause the Company’s effective tax rate todiffer from this estimate. Refer to Note 12 to the Consolidated Financial Statements for additional information related to income taxes.
DISCONTINUED OPERATIONSAs further discussed in Note 3 to the Consolidated Financial Statements, discontinued operations includes the results of the Fortive businesses which weredisposed of during the third quarter of 2016 as well as the results of the Company’s former communications business which was disposed of during the thirdquarter of 2015. All periods presented have been restated to reflect the Fortive and communications businesses within discontinued operations.
In 2017, Danaher recorded a $22 million income tax benefit related to the release of previously provided reserves associated with uncertain tax positions oncertain Danaher tax returns which were jointly filed with Fortive entities. These reserves were released due to the expiration of statutes of limitations for thosereturns. All Fortive entity-related balances were included in the income tax benefit related to discontinued operations.
In 2016, earnings from discontinued operations, net of income taxes, were $400 million and reflected the operating results of the Fortive businesses prior tothe Separation. In 2015, earnings from discontinued operations, net of income taxes, were approximately $1.6 billion and reflected the operations of both theFortive and communications businesses as well as the gain on the sale of the communications business in 2015.
COMPREHENSIVE INCOMEComprehensive income increased by approximately $1.7 billion in 2017 as compared to 2016, primarily due to increased earnings from continuingoperations, an increased gain from foreign currency translation adjustments compared to 2016, pension and postretirement plan benefit adjustments and thedecrease in the unrealized gains (losses) on available-for-sale securities from the sale of certain marketable equity securities, partially offset by lower netearnings attributable to discontinued operations in 2017 compared to 2016. The Company recorded a foreign currency translation gain of $976 million for2017 compared to a translation loss of $517 million for 2016. The Company recorded a pension and postretirement plan benefit gain of $71 million for 2017compared to a loss of $58 million for 2016.
Comprehensive income decreased by $617 million in 2016 as compared to 2015, primarily due to the impact of decreases in net earnings attributable todiscontinued operations, foreign currency translation adjustments resulting from the strengthening of the U.S. dollar compared to most major currenciesduring the year but at a lower rate than in the prior year, and pension and postretirement plan benefit adjustments. The Company recorded a foreign currencytranslation loss of $517 million for 2016
45
Source: DANAHER CORP /DE/, 10-K, February 21, 2018 Powered by Morningstar® Document Research℠The information contained herein may not be copied, adapted or distributed and is not warranted to be accurate, complete or timely. The user assumes all risks for any damages or losses arising from any use of this information,except to the extent such damages or losses cannot be limited or excluded by applicable law. Past financial performance is no guarantee of future results.

Table of Contents
compared to a translation loss of $976 million for 2015. The Company recorded a pension and postretirement plan benefit loss of $58 million in 2016compared to a gain of $81 million in 2015.
INFLATION
The effect of inflation on the Company’s revenues and net earnings was not significant in any of the years ended December 31, 2017, 2016 or 2015.
FINANCIAL INSTRUMENTS AND RISK MANAGEMENTThe Company is exposed to market risk from changes in interest rates, foreign currency exchange rates, equity prices and commodity prices as well as creditrisk, each of which could impact its Consolidated Financial Statements. The Company generally addresses its exposure to these risks through its normaloperating and financing activities. In addition, the Company’s broad-based business activities help to reduce the impact that volatility in any particular areaor related areas may have on its operating profit as a whole.
Interest Rate Risk
The Company manages interest cost using a mixture of fixed-rate and variable-rate debt. A change in interest rates on long-term debt impacts the fair value ofthe Company’s fixed-rate long-term debt but not the Company’s earnings or cash flow because the interest on such debt is fixed. Generally, the fair marketvalue of fixed-rate debt will increase as interest rates fall and decrease as interest rates rise. As of December 31, 2017, an increase of 100 basis points ininterest rates would have decreased the fair value of the Company’s fixed-rate long-term debt (excluding the LYONs, which have not been included in thiscalculation as the value of this convertible debt is primarily derived from the value of its underlying common stock) by $470 million.
As of December 31, 2017, the Company’s variable-rate debt obligations consisted primarily of U.S. dollar and euro-based commercial paper borrowings (referto Note 9 to the Consolidated Financial Statements for information regarding the Company’s outstanding commercial paper balances as of December 31,2017). As a result, the Company’s primary interest rate exposure results from changes in short-term interest rates. As these shorter duration obligations mature,the Company may issue additional short-term commercial paper obligations to refinance all or part of these borrowings. In 2017, the average annual interestrate associated with outstanding commercial paper borrowings was approximately 6 basis points. A hypothetical increase of this average to 18 basis pointswould have increased the Company’s annual interest expense by $4 million. The hypothetical increase used is the actual amount by which the Company’scommercial paper interest rates fluctuated during 2017.
Currency Exchange Rate Risk
The Company faces transactional exchange rate risk from transactions with customers in countries outside the United States and from intercompanytransactions between affiliates. Transactional exchange rate risk arises from the purchase and sale of goods and services in currencies other than Danaher’sfunctional currency or the functional currency of its applicable subsidiary. The Company also faces translational exchange rate risk related to the translationof financial statements of its foreign operations into U.S. dollars, Danaher’s functional currency. Costs incurred and sales recorded by subsidiaries operatingoutside of the United States are translated into U.S. dollars using exchange rates effective during the respective period. As a result, the Company is exposed tomovements in the exchange rates of various currencies against the U.S. dollar. In particular, the Company has more sales in European currencies than it hasexpenses in those currencies. Therefore, when European currencies strengthen or weaken against the U.S. dollar, operating profits are increased or decreased,respectively. The effect of a change in currency exchange rates on the Company’s net investment in international subsidiaries is reflected in the accumulatedother comprehensive income (loss) component of stockholders’ equity.
Currency exchange rates positively impacted 2017 reported sales by 0.5% on a year-over-year basis as the U.S. dollar weakened against the euro, partiallyoffset by the effect of the U.S. dollar strengthening against the Japanese yen and Chinese renminbi. If the exchange rates in effect as of December 31, 2017were to prevail throughout 2018, currency exchange rates would positively impact 2018 estimated sales by approximately 2.0% relative to the Company’sperformance in 2017. Strengthening of the U.S. dollar against other major currencies would adversely impact the Company’s sales and results of operationson an overall basis. Any weakening of the U.S. dollar against other major currencies would positively impact the Company’s sales and results of operations.
The Company has generally accepted the exposure to exchange rate movements without using derivative financial instruments to manage this risk. Bothpositive and negative movements in currency exchange rates against the U.S. dollar will therefore continue to affect the reported amount of sales and netearnings in the Company’s Consolidated Financial Statements. In
46
Source: DANAHER CORP /DE/, 10-K, February 21, 2018 Powered by Morningstar® Document Research℠The information contained herein may not be copied, adapted or distributed and is not warranted to be accurate, complete or timely. The user assumes all risks for any damages or losses arising from any use of this information,except to the extent such damages or losses cannot be limited or excluded by applicable law. Past financial performance is no guarantee of future results.

Table of Contents
addition, the Company has assets and liabilities held in foreign currencies. The Company’s foreign currency-denominated debt partially hedges its netinvestments in foreign operations against adverse movements in exchange rates. A 10% depreciation in major currencies relative to the U.S. dollar as ofDecember 31, 2017 would have reduced foreign currency-denominated net assets and stockholders’ equity by $880 million.
Equity Price Risk
The Company’s available-for-sale investment portfolio has in the past included publicly traded equity securities that are sensitive to fluctuations in marketprice. However, during 2017 the Company sold substantially all of its available-for-sale equity securities.
Commodity Price Risk
For a discussion of risks relating to commodity prices, refer to “Item 1A. Risk Factors.”
Credit Risk
The Company is exposed to potential credit losses in the event of nonperformance by counterparties to its financial instruments. Financial instruments thatpotentially subject the Company to credit risk consist of cash and temporary investments, receivables from customers and derivatives. The Company placescash and temporary investments with various high-quality financial institutions throughout the world and exposure is limited at any one institution.Although the Company typically does not obtain collateral or other security to secure these obligations, it does regularly monitor the third-party depositoryinstitutions that hold its cash and cash equivalents. The Company’s emphasis is primarily on safety and liquidity of principal and secondarily on maximizingyield on those funds.
In addition, concentrations of credit risk arising from receivables from customers are limited due to the diversity of the Company’s customers. TheCompany’s businesses perform credit evaluations of their customers’ financial conditions as appropriate and also obtain collateral or other security whenappropriate.
The Company enters into derivative transactions infrequently and such transactions are generally insignificant to the Company’s financial condition andresults of operations. These transactions are typically entered into with high-quality financial institutions and exposure at any one institution is limited.
LIQUIDITY AND CAPITAL RESOURCESManagement assesses the Company’s liquidity in terms of its ability to generate cash to fund its operating, investing and financing requirements. TheCompany continues to generate substantial cash from operating activities and believes that its operating cash flow and other sources of liquidity will besufficient to allow it to continue investing in existing businesses, consummating strategic acquisitions, paying interest and servicing debt and managing itscapital structure on a short and long-term basis.
47
Source: DANAHER CORP /DE/, 10-K, February 21, 2018 Powered by Morningstar® Document Research℠The information contained herein may not be copied, adapted or distributed and is not warranted to be accurate, complete or timely. The user assumes all risks for any damages or losses arising from any use of this information,except to the extent such damages or losses cannot be limited or excluded by applicable law. Past financial performance is no guarantee of future results.

Table of Contents
Following is an overview of the Company’s cash flows and liquidity for the years ended December 31:
Overview of Cash Flows and Liquidity
($ in millions) 2017 2016 2015
Total operating cash flows provided by continuing operations $ 3,477.8 $ 3,087.5 $ 2,832.2
Cash paid for acquisitions $ (385.8) $ (4,880.1) $ (14,247.8)Payments for additions to property, plant and equipment (619.6) (589.6) (512.9)Proceeds from sales of property, plant and equipment 32.6 9.8 60.4Payments for purchases of investments — — (87.1)Proceeds from sales of investments 137.9 264.8 43.0All other investing activities (8.5) 21.9 5.9Total investing cash used in discontinued operations — (69.8) (212.5)Net cash used in investing activities $ (843.4) $ (5,243.0) $ (14,951.0)
Proceeds from the issuance of common stock $ 68.8 $ 164.5 $ 249.0Payment of dividends (378.3) (399.8) (354.1)Payment for purchase of noncontrolling interest (64.4) — —Make-whole premiums to redeem borrowings prior to maturity — (188.1) —Net (repayments of) proceeds from borrowings (maturities of 90 days or less) (3,778.5) 2,218.1 3,511.2Proceeds from borrowings (maturities longer than 90 days) 1,782.1 3,240.9 5,682.9Repayments of borrowings (maturities longer than 90 days) (668.4) (2,480.6) (35.5)All other financing activities (59.8) (27.0) (3.3)Cash distributions to Fortive, net — (485.3) —Net cash (used in) provided by financing activities $ (3,098.5) $ 2,042.7 $ 9,050.2
• Operating cash flows from continuing operations increased $390 million, or approximately 13%, during 2017 as compared to 2016, due primarily tohigher earnings which also included higher noncash charges for depreciation and amortization. The increase was partially offset by (1) the gain onsale of marketable equity securities in 2017, reduced by the net impact in 2016 of the gain from the sale of marketable equity securities and the losson early extinguishment of borrowings; and (2) the increase in cash flows used for trade accounts receivable, inventories and accounts payable.
• Net cash used in investing activities during 2017 consisted primarily of cash paid for acquisitions and additions to property, plant and equipment.The Company acquired ten businesses during 2017 for total consideration (including assumed debt and net of cash acquired) of approximately $386million. Payments for additions to property, plant and equipment increased $30 million in 2017 compared to 2016 and include investments in otheroperating assets, particularly new facilities and operating assets at newly acquired businesses. These uses of cash were partially offset by proceedsfrom sales of investments, which includes cash proceeds of $138 million from the sale of certain marketable equity securities.
• The Company used cash generated from operations as well as the proceeds from the long-term borrowings noted below to reduce net outstandingborrowings with maturities of 90 days or less, primarily commercial paper borrowings, by approximately $3.8 billion.
• During 2017, the Company issued approximately $1.8 billion of euro, Japanese yen and Swiss franc-denominated long-term indebtedness (based onapplicable exchange rates as of the pricing dates of the respective notes; refer to Note 9 of the accompanying Consolidated Financial Statements)and used the proceeds to repay commercial paper borrowings as well as the €500 million of senior unsecured bonds and the CHF 100 million ofsenior unsecured bonds that matured in 2017.
• As of December 31, 2017, the Company held $630 million of cash and cash equivalents.
48
Source: DANAHER CORP /DE/, 10-K, February 21, 2018 Powered by Morningstar® Document Research℠The information contained herein may not be copied, adapted or distributed and is not warranted to be accurate, complete or timely. The user assumes all risks for any damages or losses arising from any use of this information,except to the extent such damages or losses cannot be limited or excluded by applicable law. Past financial performance is no guarantee of future results.

Table of Contents
Operating Activities
Cash flows from operating activities can fluctuate significantly from period-to-period as working capital needs and the timing of payments for income taxes,restructuring activities, pension funding and other items impact reported cash flows.
Operating cash flows from continuing operations were approximately $3.5 billion for 2017, an increase of $390 million, or approximately 13%, as comparedto 2016. The year-over-year change in operating cash flows from 2016 to 2017 was primarily attributable to the following factors:
• 2017 operating cash flows benefited from higher net earnings in 2017 as compared to 2016. The increase was partially offset by the gain on sale ofmarketable equity securities in 2017, reduced by the net impact in 2016 of the gain from the sale of marketable equity securities and the loss onearly extinguishment of borrowings. The cash flow impacts of the gains from the sale of marketable equity securities is reflected in the investingactivities section of the accompanying Consolidated Statements of Cash Flows, and the cash flow impact of the loss on early extinguishment ofborrowings is reflected in the financing activities section of the accompanying Consolidated Statement of Cash Flows, and therefore, do notcontribute to operating cash flows.
• The aggregate of trade accounts receivable, inventories and trade accounts payable used $243 million in operating cash flows during 2017,compared to $96 million of operating cash flows used in 2016. The amount of cash flow generated from or used by the aggregate of trade accountsreceivable, inventories and trade accounts payable depends upon how effectively the Company manages the cash conversion cycle, whicheffectively represents the number of days that elapse from the day it pays for the purchase of raw materials and components to the collection of cashfrom its customers and can be significantly impacted by the timing of collections and payments in a period.
• The aggregate of prepaid expenses and other assets, deferred income taxes and accrued expenses and other liabilities used $110 million in operatingcash flows during 2017, compared to $196 million used in 2016. The timing of cash payments for income taxes and various employee relatedliabilities drove the majority of this change.
• Net earnings from continuing operations for 2017 reflected an increase of $110 million of depreciation and amortization expense as compared to2016. Amortization expense primarily relates to the amortization of intangible assets acquired in connection with business acquisitions.Depreciation expense relates to both the Company’s manufacturing and operating facilities as well as instrumentation leased to customers underoperating-type lease arrangements. Depreciation and amortization are noncash expenses that decrease earnings without a corresponding impact tooperating cash flows.
Operating cash flows from continuing operations were approximately $3.1 billion for 2016, an increase of $255 million, or 9% as compared to 2015. Thisincrease was primarily attributable to the increase in net earnings from continuing operations in 2016 as compared to 2015.
Investing Activities
Cash flows relating to investing activities consist primarily of cash used for acquisitions and capital expenditures, including instruments leased to customers,cash used for investments and cash proceeds from divestitures of businesses or assets.
Net cash used in investing activities was $843 million during 2017 compared to approximately $5.2 billion and approximately $15.0 billion of net cash usedin 2016 and 2015, respectively.
Acquisitions, Divestitures and Sale of Investments
2017 Acquisitions and Sale of Investments
For a discussion of the Company’s 2017 acquisitions and sale of investments, refer to “—Overview.”
2016 Acquisitions, Divestitures and Sale of Investments
For a discussion of the Company’s 2016 Separation of its former Test & Measurement segment, Industrial Technologies segment (excluding the productidentification businesses) and retail/commercial petroleum business, refer to “—Overview.”
On November 4, 2016, Copper Merger Sub, Inc., a California corporation and an indirect, wholly-owned subsidiary of the Company acquired all of theoutstanding shares of common stock of Cepheid, a California corporation, for $53.00 per share in cash, for a total purchase price of approximately $4.0billion, net of assumed debt and acquired cash (the “Cepheid
49
Source: DANAHER CORP /DE/, 10-K, February 21, 2018 Powered by Morningstar® Document Research℠The information contained herein may not be copied, adapted or distributed and is not warranted to be accurate, complete or timely. The user assumes all risks for any damages or losses arising from any use of this information,except to the extent such damages or losses cannot be limited or excluded by applicable law. Past financial performance is no guarantee of future results.

Table of Contents
Acquisition”). Cepheid is now part of the Company’s Diagnostics segment. Cepheid generated revenues of $539 million in 2015. The Company initiallyfinanced the Cepheid acquisition price with available cash and proceeds from the issuance of U.S. dollar and euro-denominated commercial paper.
In addition to the Cepheid Acquisition, during 2016 the Company acquired seven businesses for total consideration of $882 million in cash, net of cashacquired. The businesses acquired complement existing units of each of the Company’s four segments. The aggregate annual sales of these seven businessesat the time of their respective acquisitions, in each case based on the company’s revenues for its last completed fiscal year prior to the acquisition, were $237million.
During 2016, the Company received cash proceeds of $265 million from the sale of certain marketable equity securities and recorded a pretax gain related tothis sale of $223 million ($140 million after-tax or $0.20 per diluted share).
2015 Acquisitions, Divestitures and Sale of Investments
On August 31, 2015, Pentagon Merger Sub, Inc., a New York corporation and an indirect, wholly-owned subsidiary of the Company, acquired all of theoutstanding shares of common stock of Pall, a New York corporation, for $127.20 per share in cash, for a total purchase price of approximately $13.6 billion,net of assumed debt of $417 million and acquired cash of approximately $1.2 billion (the “Pall Acquisition”). Pall is part of the Company’s Life Sciencessegment. In its fiscal year ended July 31, 2015, Pall generated consolidated revenues of approximately $2.8 billion.
The Company initially financed the approximately $13.6 billion acquisition price of Pall with approximately $2.5 billion of available cash, approximately$8.1 billion of net proceeds from the issuance and sale of U.S. dollar and euro-denominated commercial paper and €2.7 billion (approximately $3.0 billionbased on currency exchange rates as of the date of issuance) of net proceeds from the issuance and sale of euro-denominated senior unsecured notes.
In addition to the Pall Acquisition, during 2015 the Company acquired nine businesses for total consideration of approximately $670 million in cash, net ofcash acquired. The businesses acquired complement existing units of each of the Company’s four segments. The aggregate annual sales of these ninebusinesses at the time of their respective acquisitions, in each case based on the company’s revenues for its last completed fiscal year prior to the acquisition,were approximately $355 million.
In July 2015, the Company consummated the split-off of the majority of its former communications business to Danaher shareholders who elected toexchange Danaher shares for ownership interests in the communications business, and the subsequent merger of the communications business with asubsidiary of NetScout. Danaher shareholders who participated in the exchange offer tendered 26 million shares of Danaher common stock (approximately$2.3 billion on the date of tender) and received 62.5 million shares of NetScout common stock which represented approximately 60% of the shares ofNetScout common stock outstanding following the combination.
The accounting requirements for reporting the disposition of the communications business as a discontinued operation were met when the split-off andmerger were completed. Accordingly, the accompanying Consolidated Financial Statements for all periods presented reflect this business as discontinuedoperations. The Company allocated a portion of the consolidated interest expense to discontinued operations based on the ratio of the discontinued business’net assets to the Company’s consolidated net assets. The Company recorded an aggregate after-tax gain on the disposition of this business of $767 million, or$1.08 per diluted share, in its 2015 results in connection with the closing of this transaction representing the value of the 26 million shares of Companycommon stock tendered for the communications business in excess of the carrying value of the business’ net assets. This gain was included in the results ofdiscontinued operations for the year ended December 31, 2015. The communications business had revenues of $346 million in 2015 prior to the disposition.
During 2015, the Company received cash proceeds of $43 million from the sale of certain marketable equity securities and recorded a pretax gain related tothese sales of $12 million ($8 million after-tax or $0.01 per diluted share).
Capital Expenditures
Capital expenditures are made primarily for increasing capacity, replacing equipment, supporting new product development, improving informationtechnology systems and the manufacture of instruments that are used in operating-type lease arrangements that certain of the Company’s businesses enterinto with customers. Capital expenditures totaled $620 million in 2017, $590 million in 2016 and $513 million in 2015. The increase in capital spending in2017 was due to increased investments in other operating assets, particularly new facilities, and operating assets at newly acquired businesses. The increase incapital spending in 2016 was due to increased investments in machinery and equipment, including operating assets at newly acquired businesses such asPall, and to a lesser extent, increases in equipment leased to customers. In 2018, the Company expects capital spending to be approximately $700 million,though actual expenditures will ultimately depend on business conditions.
50
Source: DANAHER CORP /DE/, 10-K, February 21, 2018 Powered by Morningstar® Document Research℠The information contained herein may not be copied, adapted or distributed and is not warranted to be accurate, complete or timely. The user assumes all risks for any damages or losses arising from any use of this information,except to the extent such damages or losses cannot be limited or excluded by applicable law. Past financial performance is no guarantee of future results.

Table of Contents
Financing Activities
Cash flows from financing activities consist primarily of cash flows associated with the issuance and repayments of commercial paper and other debt,issuances and repurchases of common stock, excess tax benefits from stock-based compensation, and payments of cash dividends to shareholders. Financingactivities used cash of approximately $3.1 billion during 2017 compared to approximately $2.0 billion of cash provided during 2016. The year-over-yearincrease in cash used in financing activities was due primarily to higher net repayments of commercial paper borrowings in 2017 as compared to 2016 (as theCompany increased its commercial paper borrowings in 2016 for the Cepheid acquisition) as well as lower proceeds from the issuance of debt in 2017 ascompared to 2016. These impacts were partially offset by lower repayments of long-term debt in 2017 as compared to the comparable period of 2016 as theCompany used a portion of the proceeds from the Fortive Distribution to repay outstanding long-term indebtedness in August 2016.
Financing activities provided cash of approximately $2.0 billion during 2016 compared to approximately $9.1 billion of cash provided during 2015. Cashprovided by financing activities in 2016 primarily relates to approximately $3.4 billion of net proceeds received from the issuance of the Fortive Debt inJune 2016 and the net issuance of outstanding borrowings with maturities of 90 days or less, primarily commercial paper borrowings, of approximately $2.2billion, and the issuance of approximately ¥29.9 billion aggregate principal amount (approximately $262 million based on the currency exchange rate as ofthe date of the issuance) of 0.352% senior unsecured notes. These issuances were partially offset by the repayment of the $500 million aggregate principalamount of 2.3% senior unsecured notes that matured in June 2016, the repayment of approximately $1.9 billion in aggregate principal amount of outstandingindebtedness in August 2016 (consisting of the Redeemed Notes), the repayment of the CHF 120 million ($124 million) aggregate principal amount of the4.0% senior unsecured notes due in October 2016 and $485 million of cash distributed to Fortive in connection with the Separation.
Total debt was approximately $10.5 billion and $12.3 billion as of December 31, 2017 and 2016, respectively. The Company had the ability to incur anadditional $1.6 billion of indebtedness in direct borrowings or under the outstanding commercial paper facility based on the amounts available under theCompany’s $4.0 billion credit facility which were not being used to backstop outstanding commercial paper balances as of December 31, 2017. Refer to Note9 to the Consolidated Financial Statements for information regarding the Company’s financing activities and indebtedness, including the Company’soutstanding debt as of December 31, 2017, and the Company’s commercial paper program and related credit facility.
Shelf Registration Statement
The Company has filed a “well-known seasoned issuer” shelf registration statement on Form S-3 with the SEC that registers an indeterminate amount of debtsecurities, common stock, preferred stock, warrants, depositary shares, purchase contracts and units for future issuance. The Company utilized this shelfregistration statement for the offering and sale of the U.S. dollar and euro-denominated senior unsecured notes issued in 2015 and 2017. The Companyexpects to use net proceeds realized by the Company from future securities sales off this shelf registration statement for general corporate purposes, includingwithout limitation repayment or refinancing of debt or other corporate obligations, acquisitions, capital expenditures, share repurchases and dividends and/orworking capital.
Stock Repurchase Program
Please see “Issuer Purchases of Equity Securities” in Item 5 of Part II of this Annual Report for a description of the Company’s stock repurchase program.
Dividends
The Company declared a regular quarterly dividend of $0.14 per share that was paid on January 26, 2018 to holders of record on December 29, 2017.Aggregate cash payments for dividends during 2017 were $378 million. Dividend payments were lower in 2017 as compared to 2016 as the Companydecreased the per share amount of its quarterly dividend in the third quarter of 2016 as a result of the Fortive Separation.
For a description of the dividend of Fortive shares in July 2016, refer to Note 3 to the Consolidated Financial Statements.
Cash and Cash Requirements
As of December 31, 2017, the Company held $630 million of cash and cash equivalents that were invested in highly liquid investment-grade debtinstruments with a maturity of 90 days or less with an approximate weighted average annual interest rate of 0.9%. Of this amount, $37 million was heldwithin the United States and $593 million was held outside of the United States. The Company will continue to have cash requirements to support workingcapital needs, capital expenditures and acquisitions,
51
Source: DANAHER CORP /DE/, 10-K, February 21, 2018 Powered by Morningstar® Document Research℠The information contained herein may not be copied, adapted or distributed and is not warranted to be accurate, complete or timely. The user assumes all risks for any damages or losses arising from any use of this information,except to the extent such damages or losses cannot be limited or excluded by applicable law. Past financial performance is no guarantee of future results.

Table of Contents
pay interest and service debt, pay taxes and any related interest or penalties, fund its restructuring activities and pension plans as required, pay dividends toshareholders, repurchase shares of the Company’s common stock and support other business needs. The Company generally intends to use available cash andinternally generated funds to meet these cash requirements, but in the event that additional liquidity is required, particularly in connection with acquisitions,the Company may also borrow under its commercial paper programs or credit facility, enter into new credit facilities and either borrow directly thereunder oruse such credit facilities to backstop additional borrowing capacity under its commercial paper programs and/or access the capital markets. The Companyalso may from time to time access the capital markets to take advantage of favorable interest rate environments or other market conditions.
While repatriation of some cash held outside the United States may be restricted by local laws, most of the Company’s foreign cash could be repatriated to theUnited States. Following enactment of the TCJA and the associated Transition Tax, in general, repatriation of cash to the United States can be completed withno incremental U.S. tax; however, repatriation of cash could subject the Company to non-U.S. jurisdictional taxes on distributions. The cash that theCompany’s non-U.S. subsidiaries hold for indefinite reinvestment is generally used to finance foreign operations and investments, including acquisitions.The income taxes applicable to such earnings are not readily determinable or practicable. The Company continues to evaluate the impact of the TCJA on itselection to indefinitely reinvest certain of its non-U.S. earnings. As of December 31, 2017, management believes that it has sufficient liquidity to satisfy itscash needs, including its cash needs in the United States.
During 2017, the Company contributed $53 million to its U.S. defined benefit pension plans and $45 million to its non-U.S. defined benefit pension plans.During 2018, the Company’s cash contribution requirements for its U.S. and its non-U.S. defined benefit pension plans are expected to be approximately $30million and $50 million, respectively. The ultimate amounts to be contributed depend upon, among other things, legal requirements, underlying assetreturns, the plan’s funded status, the anticipated tax deductibility of the contribution, local practices, market conditions, interest rates and other factors.
Contractual ObligationsThe following table sets forth, by period due or year of expected expiration, as applicable, a summary of the Company’s contractual obligations as ofDecember 31, 2017 under (1) debt obligations, (2) leases, (3) purchase obligations and (4) other long-term liabilities reflected on the Company’sConsolidated Balance Sheet The amounts presented in the “Other long-term liabilities” line in the table below include $670 million of noncurrent grossunrecognized tax benefits and related interest (and do not include $66 million of current gross unrecognized tax benefits which are included in the “Accruedexpenses and other liabilities” line on the Consolidated Balance Sheet). However, the timing of the long-term portion of these liabilities is uncertain, andtherefore, they have been included in the “More Than 5 Years” column in the table below. Refer to Note 12 to the Consolidated Financial Statements foradditional information on unrecognized tax benefits. Certain of the Company’s acquisitions also involve the potential payment of contingent consideration.The table below does not reflect any such obligations, as the timing and amounts of any such payments are uncertain. Refer to “—Off-Balance SheetArrangements” for a discussion of other contractual obligations that are not reflected in the table below.
($ in millions) Total Less ThanOne Year 1-3 Years 4-5 Years
More Than5 Years
Debt and leases: Debt obligations (a)(b) $ 10,503.8 $ 190.1 $ 4,534.3 $ 1,590.1 $ 4,189.3Capital lease obligations (b) 18.3 4.6 0.8 0.9 12.0
Total debt and leases 10,522.1 194.7 4,535.1 1,591.0 4,201.3Interest payments on debt and capital lease obligations(c) 1,277.8 150.2 252.7 183.4 691.5Operating lease obligations (d) 797.4 199.4 297.5 178.7 121.8Other: Purchase obligations (e) 610.2 533.2 62.4 9.4 5.2Other long-term liabilities reflected on the Company’sConsolidated Balance Sheet (f) 5,161.1 — 625.0 448.3 4,087.8Total $ 18,368.6 $ 1,077.5 $ 5,772.7 $ 2,410.8 $ 9,107.6
(a) As described in Note 9 to the Consolidated Financial Statements.(b) Amounts do not include interest payments. Interest on debt and capital lease obligations is reflected in a separate line in the table.(c) Interest payments on debt are projected for future periods using the interest rates in effect as of December 31, 2017. Certain of these projected interest payments may differ in the
future based on changes in market interest rates.
52
Source: DANAHER CORP /DE/, 10-K, February 21, 2018 Powered by Morningstar® Document Research℠The information contained herein may not be copied, adapted or distributed and is not warranted to be accurate, complete or timely. The user assumes all risks for any damages or losses arising from any use of this information,except to the extent such damages or losses cannot be limited or excluded by applicable law. Past financial performance is no guarantee of future results.

Table of Contents
(d) As described in Note 15 to the Consolidated Financial Statements, certain leases require the Company to pay real estate taxes, insurance, maintenance and other operatingexpenses associated with the leased premises. These future costs are not included in the table above.
(e) Consist of agreements to purchase goods or services that are enforceable and legally binding on the Company and that specify all significant terms, including fixed or minimumquantities to be purchased, fixed, minimum or variable price provisions and the approximate timing of the transaction.
(f) Primarily consist of obligations under product service and warranty policies and allowances, performance and operating cost guarantees, estimated environmental remediationcosts, self-insurance and litigation claims, postretirement benefits, pension obligations, deferred tax liabilities and deferred compensation obligations. The timing of cash flowsassociated with these obligations is based upon management’s estimates over the terms of these arrangements and is largely based upon historical experience.
Off-Balance Sheet Arrangements
Guarantees and Related Instruments
The following table sets forth, by period due or year of expected expiration, as applicable, a summary of guarantees and related instruments of the Companyas of December 31, 2017.
Amount of Commitment Expiration per Period
($ in millions) Total Less ThanOne Year 1-3 Years 4-5 Years
More Than5 Years
Guarantees and related instruments $ 611.2 $ 506.9 $ 57.4 $ 24.8 $ 22.1
Guarantees and related instruments consist primarily of outstanding standby letters of credit, bank guarantees and performance and bid bonds. These havebeen provided in connection with certain arrangements with vendors, customers, insurance providers, financing counterparties and governmental entities tosecure the Company’s obligations and/or performance requirements related to specific transactions.
Other Off-Balance Sheet Arrangements
The Company has from time to time divested certain of its businesses and assets. In connection with these divestitures, the Company often providesrepresentations, warranties and/or indemnities to cover various risks and unknown liabilities, such as claims for damages arising out of the use of products orrelating to intellectual property matters, commercial disputes, environmental matters or tax matters. In particular, in connection with the 2016 FortiveSeparation and the 2015 split-off of the Company’s communications business, Danaher entered into separation and distribution and related agreementspursuant to which Danaher agreed to indemnify the other parties against certain damages and expenses that might occur in the future. These indemnificationobligations cover a variety of liabilities, including, but not limited to, employee, tax and environmental matters. The Company has not included any suchitems in the contractual obligations table above because they relate to unknown conditions and the Company cannot estimate the potential liabilities fromsuch matters, but the Company does not believe it is reasonably possible that any such liability will have a material effect on the Company’s financialstatements. In addition, as a result of these divestitures, as well as restructuring activities, certain properties leased by the Company have been sublet to third-parties. In the event any of these third-parties vacate any of these premises, the Company would be legally obligated under master lease arrangements. TheCompany believes that the financial risk of default by such sub-lessors is individually and in the aggregate not material to the Company’s ConsolidatedFinancial Statements.
In the normal course of business, the Company periodically enters into agreements that require it to indemnify customers, suppliers or other business partnersfor specific risks, such as claims for injury or property damage arising out of the Company’s products or services or claims alleging that Company products orservices infringe third-party intellectual property. The Company has not included any such indemnification provisions in the contractual obligations tableabove. Historically, the Company has not experienced significant losses on these types of indemnification obligations.
The Company’s Restated Certificate of Incorporation requires it to indemnify to the full extent authorized or permitted by law any person made, or threatenedto be made a party to any action or proceeding by reason of his or her service as a director or officer of the Company, or by reason of serving at the request ofthe Company as a director or officer of any other entity, subject to limited exceptions. Danaher’s Amended and Restated By-laws provide for similarindemnification rights. In addition, Danaher has executed with each director and executive officer of Danaher Corporation an indemnification agreementwhich provides for substantially similar indemnification rights and under which Danaher has agreed to pay expenses in advance of the final disposition ofany such indemnifiable proceeding. While the Company maintains insurance for this type of liability, a significant deductible applies to this coverage andany such liability could exceed the amount of the insurance coverage.
53
Source: DANAHER CORP /DE/, 10-K, February 21, 2018 Powered by Morningstar® Document Research℠The information contained herein may not be copied, adapted or distributed and is not warranted to be accurate, complete or timely. The user assumes all risks for any damages or losses arising from any use of this information,except to the extent such damages or losses cannot be limited or excluded by applicable law. Past financial performance is no guarantee of future results.

Table of Contents
Legal Proceedings
Refer to “Item 3. Legal Proceedings” and Note 16 to the Consolidated Financial Statements for information regarding legal proceedings and contingencies,and for a discussion of risks related to legal proceedings and contingencies, refer to “Item 1A. Risk Factors.”
CRITICAL ACCOUNTING ESTIMATESManagement’s discussion and analysis of the Company’s financial condition and results of operations is based upon the Company’s Consolidated FinancialStatements, which have been prepared in accordance with accounting principles generally accepted in the United States. The preparation of these financialstatements requires management to make estimates and judgments that affect the reported amounts of assets, liabilities, revenues and expenses, and relateddisclosure of contingent assets and liabilities. The Company bases these estimates and judgments on historical experience, the current economic environmentand on various other assumptions that are believed to be reasonable under the circumstances. Actual results may differ materially from these estimates andjudgments.
The Company believes the following accounting estimates are most critical to an understanding of its financial statements. Estimates are considered to becritical if they meet both of the following criteria: (1) the estimate requires assumptions about material matters that are uncertain at the time the estimate ismade, and (2) material changes in the estimate are reasonably likely from period-to-period. For a detailed discussion on the application of these and otheraccounting estimates, refer to Note 1 to the Consolidated Financial Statements.
Acquired Intangibles—The Company’s business acquisitions typically result in the recognition of goodwill, in-process R&D and other intangible assets,which affect the amount of future period amortization expense and possible impairment charges that the Company may incur. Refer to Notes 1, 2 and 6 to theConsolidated Financial Statements for a description of the Company’s policies relating to goodwill, acquired intangibles and acquisitions.
In performing its goodwill impairment testing, the Company estimates the fair value of its reporting units primarily using a market-based approach. Inevaluating the estimates derived by the market-based approach, management makes judgments about the relevance and reliability of the multiples byconsidering factors unique to its reporting units, including operating results, business plans, economic projections, anticipated future cash flows, andtransactions and marketplace data as well as judgments about the comparability of the market proxies selected. In certain circumstances the Company alsoestimates fair value utilizing a discounted cash flow analysis (i.e., an income approach) in order to validate the results of the market approach. The discountedcash flow model requires judgmental assumptions about projected revenue growth, future operating margins, discount rates and terminal values. There areinherent uncertainties related to these assumptions and management’s judgment in applying them to the analysis of goodwill impairment.
As of December 31, 2017, the Company had eight reporting units for goodwill impairment testing. Reporting units resulting from recent acquisitionsgenerally present the highest risk of impairment. Management believes the impairment risk associated with these reporting units decreases as these businessesare integrated into the Company and better positioned for potential future earnings growth. The Company’s annual goodwill impairment analysis in 2017indicated that in all instances, the fair values of the Company’s reporting units exceeded their carrying values and consequently did not result in animpairment charge. The excess of the estimated fair value over carrying value (expressed as a percentage of carrying value for the respective reporting unit)for each of the Company’s reporting units as of the annual testing date ranged from approximately 50% to approximately 600%. In order to evaluate thesensitivity of the fair value calculations used in the goodwill impairment test, the Company applied a hypothetical 10% decrease to the fair values of eachreporting unit and compared those hypothetical values to the reporting unit carrying values. Based on this hypothetical 10% decrease, the excess of theestimated fair value over carrying value (expressed as a percentage of carrying value for the respective reporting unit) for each of the Company’s reportingunits ranged from approximately 35% to approximately 530%.
The Company reviews identified intangible assets for impairment whenever events or changes in circumstances indicate that the related carrying amountsmay not be recoverable. The Company also tests intangible assets with indefinite lives at least annually for impairment. Determining whether an impairmentloss occurred requires a comparison of the carrying amount to the sum of undiscounted cash flows expected to be generated by the asset. These analysesrequire management to make judgments and estimates about future revenues, expenses, market conditions and discount rates related to these assets.
If actual results are not consistent with management’s estimates and assumptions, goodwill and other intangible assets may be overstated and a charge wouldneed to be taken against net earnings which would adversely affect the Company’s Consolidated Financial Statements. Historically, the Company’s estimatesof goodwill and intangible assets have been materially correct.
54
Source: DANAHER CORP /DE/, 10-K, February 21, 2018 Powered by Morningstar® Document Research℠The information contained herein may not be copied, adapted or distributed and is not warranted to be accurate, complete or timely. The user assumes all risks for any damages or losses arising from any use of this information,except to the extent such damages or losses cannot be limited or excluded by applicable law. Past financial performance is no guarantee of future results.

Table of Contents
Contingent Liabilities—As discussed in “Item 3. Legal Proceedings” and Note 16 to the Consolidated Financial Statements, the Company is, from time totime, subject to a variety of litigation and similar contingent liabilities incidental to its business (or the business operations of previously owned entities).The Company recognizes a liability for any contingency that is known or probable of occurrence and reasonably estimable. These assessments requirejudgments concerning matters such as litigation developments and outcomes, the anticipated outcome of negotiations, the number of future claims and thecost of both pending and future claims. In addition, because most contingencies are resolved over long periods of time, liabilities may change in the futuredue to various factors, including those discussed in Note 16 to the Consolidated Financial Statements. If the reserves established by the Company withrespect to these contingent liabilities are inadequate, the Company would be required to incur an expense equal to the amount of the loss incurred in excessof the reserves, which would adversely affect the Company’s financial statements.
Revenue Recognition—The Company derives revenues from the sale of products and services. Refer to Note 1 to the Consolidated Financial Statements for adescription of the Company’s revenue recognition policies.
Although most of the Company’s sales agreements contain standard terms and conditions, certain agreements contain multiple elements or nonstandard termsand conditions. As a result, judgment is sometimes required to determine the appropriate accounting, including whether the deliverables specified in theseagreements should be treated as separate units of accounting for revenue recognition purposes, and, if so, how the consideration should be allocated amongthe elements and when to recognize revenue for each element. The Company allocates revenue to each element in the contractual arrangement based on theselling price hierarchy that, in some instances, may require the Company to estimate the selling price of certain deliverables that are not sold separately orwhere third-party evidence of pricing is not observable. The Company’s estimate of selling price impacts the amount and timing of revenue recognized inmultiple element arrangements. The Company also enters into lease arrangements with customers, which requires the Company to determine whether thearrangements are operating or sales-type leases. Certain of the Company’s lease contracts are customized for larger customers and often result in complexterms and conditions that typically require significant judgment in applying the lease accounting criteria.
On January 1, 2018, the Company adopted Accounting Standards Update (“ASU”) No. 2014-09, Revenue from Contracts with Customers (Topic 606), whichsupersedes nearly all existing revenue recognition guidance. Refer to ‘New Accounting Standards’ in Note 1 to the Consolidated Financial Statements foradditional information on the Company’s adoption of this ASU.
If the Company’s judgments regarding revenue recognition prove incorrect, the Company’s reported revenues in particular periods may be incorrect.Historically, the Company’s estimates of revenue have been materially correct.
Pension and Other Postretirement Benefits—For a description of the Company’s pension and other postretirement benefit accounting practices, refer to Notes10 and 11 to the Consolidated Financial Statements. Calculations of the amount of pension and other postretirement benefit costs and obligations depend onthe assumptions used in the actuarial valuations, including assumptions regarding discount rates, expected return on plan assets, rates of salary increases,health care cost trend rates, mortality rates, and other factors. If the assumptions used in calculating pension and other postretirement benefits costs andobligations are incorrect or if the factors underlying the assumptions change (as a result of differences in actual experience, changes in key economicindicators or other factors) the Company’s Consolidated Financial Statements could be materially affected. A 50 basis point reduction in the discount ratesused for the plans would have increased the U.S. net obligation by $146 million ($111 million on an after-tax basis) and the non-U.S. net obligation by $142million ($107 million on an after-tax basis) from the amounts recorded in the Consolidated Financial Statements as of December 31, 2017. A 50 basis pointincrease in the discount rates used for the plans would have decreased the U.S. net obligation by $134 million ($102 million on an after-tax basis) and thenon-U.S. net obligation by $137 million ($104 million on an after-tax basis) from the amounts recorded in the Consolidated Financial Statements as ofDecember 31, 2017.
For 2017, the estimated long-term rate of return for the U.S. plans is 7.0%, and the Company intends to continue to use an assumption of 7.0% for 2018. Theestimated long-term rate of return for the non-U.S. plans was determined on a plan-by-plan basis based on the nature of the plan assets and ranged from 1.0%to 5.8%. If the expected long-term rate of return on plan assets for 2017 was reduced by 50 basis points, pension expense for the U.S. and non-U.S. plans for2017 would have increased $9 million ($6 million on an after-tax basis) and $5 million ($4 million on an after-tax basis), respectively.
For a discussion of the Company’s 2017 and anticipated 2018 defined benefit pension plan contributions, refer to “—Liquidity and Capital Resources –Cash and Cash Requirements”.
Income Taxes—For a description of the Company’s income tax accounting policies, refer to Notes 1 and 12 to the Consolidated Financial Statements. TheCompany establishes valuation allowances for its deferred tax assets if it is more likely than not that some or all of the deferred tax asset will not be realized.This requires management to make judgments and estimates regarding: (1) the timing and amount of the reversal of taxable temporary differences,(2) expected future taxable income, and
55
Source: DANAHER CORP /DE/, 10-K, February 21, 2018 Powered by Morningstar® Document Research℠The information contained herein may not be copied, adapted or distributed and is not warranted to be accurate, complete or timely. The user assumes all risks for any damages or losses arising from any use of this information,except to the extent such damages or losses cannot be limited or excluded by applicable law. Past financial performance is no guarantee of future results.

Table of Contents
(3) the impact of tax planning strategies. Future changes to tax rates would also impact the amounts of deferred tax assets and liabilities and could have anadverse impact on the Company’s Consolidated Financial Statements.
The Company provides for unrecognized tax benefits when, based upon the technical merits, it is “more likely than not” that an uncertain tax position willnot be sustained upon examination. Judgment is required in evaluating tax positions and determining income tax provisions. The Company re-evaluates thetechnical merits of its tax positions and may recognize an uncertain tax benefit in certain circumstances, including when: (1) a tax audit is completed; (2)applicable tax laws change, including a tax case ruling or legislative guidance; or (3) the applicable statute of limitations expires.
On December 22, 2017, the TCJA was enacted, which substantially changes the U.S. tax system, including lowering the corporate tax rate from 35% to 21%(beginning in 2018), and affected the Company in a number of ways. Under U.S. GAAP, the Company is required to account for tax legislation when thelegislation is enacted. Accordingly, the Company has reflected the provisional estimate of changes from the TCJA in the Consolidated Financial Statementsas of December 31, 2017 based upon the Company’s analysis of the legislation using available information. Certain assumptions related to the impact of theTCJA will require continued monitoring and further analysis including the amount of foreign cash and undistributed earnings subject to the Transition Tax,the amount of available credits to reduce required payments of the Transition Tax and the impact of estimated temporary differences between book andtaxable income in 2017 or prior periods under audit by the IRS. Although the Company believes that its estimates and judgments are reasonable, actualresults may differ materially from these estimates. The Company will continue to refine these estimates throughout 2018 and record any required adjustmentsas they are determined as permitted by SAB No. 118. The U.S. Treasury Department and the IRS have not yet issued regulations implementing the new taxlaw, and these regulations could result in changes to the Company’s estimates. Some or all of these judgments are also subject to review by the IRS. If the IRSwere to successfully challenge the Company’s right to realize some or all of the tax benefit the Company has recorded, based on current interpretation of thelaw regarding certain items, or if the amount of the Transition Tax or other tax liabilities are understated, it could have a material adverse effect on theCompany’s financial statements.
In addition, certain of the Company’s tax returns are currently under review by tax authorities including in Denmark (refer to “—Results of Operations –Income Taxes” and Note 12 to the Consolidated Financial Statements). Management believes the positions taken in these returns are in accordance with therelevant tax laws. However, the outcome of these audits is uncertain and could result in the Company being required to record charges for prior year taxobligations which could have a material adverse impact to the Company’s Consolidated Financial Statements, including its effective tax rate.
An increase of 1.0% in the Company’s 2017 nominal tax rate would have resulted in an additional income tax provision for continuing operations for theyear ended December 31, 2017 of $29 million.
NEW ACCOUNTING STANDARDSFor a discussion of the new accounting standards impacting the Company, refer to Note 1 to the Consolidated Financial Statements.
ITEM 7A. QUANTITATIVE AND QUALITATIVE DISCLOSURES ABOUT MARKET RISKThe information required by this item is included under “Item 7. Management’s Discussion and Analysis of Financial Condition and Results of Operations.”
56
Source: DANAHER CORP /DE/, 10-K, February 21, 2018 Powered by Morningstar® Document Research℠The information contained herein may not be copied, adapted or distributed and is not warranted to be accurate, complete or timely. The user assumes all risks for any damages or losses arising from any use of this information,except to the extent such damages or losses cannot be limited or excluded by applicable law. Past financial performance is no guarantee of future results.

Table of Contents
ITEM 8. FINANCIAL STATEMENTS AND SUPPLEMENTARY DATA
Report of Management on Danaher Corporation’s Internal Control Over Financial Reporting
The management of the Company is responsible for establishing and maintaining adequate internal control over financial reporting for the Company.Internal control over financial reporting is defined in Rules 13a-15(f) and 15d-15(f) promulgated under the Securities Exchange Act of 1934.
The Company’s management assessed the effectiveness of the Company’s internal control over financial reporting as of December 31, 2017. In making thisassessment, the Company’s management used the criteria set forth by the Committee of Sponsoring Organizations of the Treadway Commission (“COSO”) in“Internal Control-Integrated Framework” (2013 framework). Based on this assessment, management concluded that, as of December 31, 2017, the Company’sinternal control over financial reporting is effective.
The Company’s independent registered public accounting firm has issued an audit report on the effectiveness of the Company’s internal control overfinancial reporting. This report dated February 20, 2018 appears on page 58 of this Form 10-K.
57
Source: DANAHER CORP /DE/, 10-K, February 21, 2018 Powered by Morningstar® Document Research℠The information contained herein may not be copied, adapted or distributed and is not warranted to be accurate, complete or timely. The user assumes all risks for any damages or losses arising from any use of this information,except to the extent such damages or losses cannot be limited or excluded by applicable law. Past financial performance is no guarantee of future results.

Table of Contents
Report of Independent Registered Public Accounting Firm
To the Stockholders and the Board of Directors of Danaher Corporation
Opinion on Internal Control over Financial Reporting
We have audited Danaher Corporation and subsidiaries’ internal control over financial reporting as of December 31, 2017, based on criteria established inInternal Control-Integrated Framework issued by the Committee of Sponsoring Organizations of the Treadway Commission (2013 framework) (the COSOcriteria). In our opinion, Danaher Corporation and subsidiaries (the Company) maintained, in all material respects, effective internal control over financialreporting as of December 31, 2017, based on the COSO criteria.
We also have audited, in accordance with the standards of the Public Company Accounting Oversight Board (United States) (PCAOB), the consolidatedbalance sheets of the Company as of December 31, 2017 and 2016, and the related consolidated statements of earnings, comprehensive income, stockholders'equity and cash flows for each of the three years in the period ended December 31, 2017, and the related notes and financial statement schedule listed in theIndex at Item 15(a) and our report dated February 20, 2018 expressed an unqualified opinion thereon.
Basis for Opinion
The Company’s management is responsible for maintaining effective internal control over financial reporting and for its assessment of the effectiveness ofinternal control over financial reporting included in the accompanying Report of Management on Danaher Corporation’s Internal Control Over FinancialReporting. Our responsibility is to express an opinion on the Company’s internal control over financial reporting based on our audit. We are a publicaccounting firm registered with the PCAOB and are required to be independent with respect to the Company in accordance with the U.S. federal securitieslaws and the applicable rules and regulations of the Securities and Exchange Commission and the PCAOB.
We conducted our audit in accordance with the standards of the PCAOB. Those standards require that we plan and perform the audit to obtain reasonableassurance about whether effective internal control over financial reporting was maintained in all material respects.
Our audit included obtaining an understanding of internal control over financial reporting, assessing the risk that a material weakness exists, testing andevaluating the design and operating effectiveness of internal control based on the assessed risk, and performing such other procedures as we considerednecessary in the circumstances. We believe that our audit provides a reasonable basis for our opinion.
Definition and Limitations of Internal Control Over Financial Reporting
A company’s internal control over financial reporting is a process designed to provide reasonable assurance regarding the reliability of financial reportingand the preparation of financial statements for external purposes in accordance with generally accepted accounting principles. A company’s internal controlover financial reporting includes those policies and procedures that (1) pertain to the maintenance of records that, in reasonable detail, accurately and fairlyreflect the transactions and dispositions of the assets of the company; (2) provide reasonable assurance that transactions are recorded as necessary to permitpreparation of financial statements in accordance with generally accepted accounting principles, and that receipts and expenditures of the company are beingmade only in accordance with authorizations of management and directors of the company; and (3) provide reasonable assurance regarding prevention ortimely detection of unauthorized acquisition, use, or disposition of the company’s assets that could have a material effect on the financial statements.
Because of its inherent limitations, internal control over financial reporting may not prevent or detect misstatements. Also, projections of any evaluation ofeffectiveness to future periods are subject to the risk that controls may become inadequate because of changes in conditions, or that the degree of compliancewith the policies or procedures may deteriorate.
/s/ Ernst & Young LLP
Tysons, VirginiaFebruary 20, 2018
58
Source: DANAHER CORP /DE/, 10-K, February 21, 2018 Powered by Morningstar® Document Research℠The information contained herein may not be copied, adapted or distributed and is not warranted to be accurate, complete or timely. The user assumes all risks for any damages or losses arising from any use of this information,except to the extent such damages or losses cannot be limited or excluded by applicable law. Past financial performance is no guarantee of future results.

Table of Contents
Report of Independent Registered Public Accounting Firm
To the Stockholders and the Board of Directors of Danaher Corporation
Opinion on Financial Statements
We have audited the accompanying consolidated balance sheets of Danaher Corporation and subsidiaries (the Company) as of December 31, 2017 and 2016,and the related consolidated statements of earnings, comprehensive income, stockholders' equity and cash flows for each of the three years in the periodended December 31, 2017, and the related notes and financial statement schedule listed in the Index at Item 15(a) (collectively referred to as the“consolidated financial statements”). In our opinion, the consolidated financial statements present fairly, in all material respects, the financial position of theCompany at December 31, 2017 and 2016, and the results of its operations and its cash flows for each of the three years in the period ended December 31,2017, in conformity with U.S. generally accepted accounting principles.
We also have audited, in accordance with the standards of the Public Company Accounting Oversight Board (United States) (PCAOB), the Company’sinternal control over financial reporting as of December 31, 2017, based on criteria established in Internal Control-Integrated Framework issued by theCommittee of Sponsoring Organizations of the Treadway Commission (2013 framework), and our report dated February 20, 2018 expressed an unqualifiedopinion thereon.
Basis for Opinion
These financial statements are the responsibility of the Company’s management. Our responsibility is to express an opinion on the Company’s financialstatements based on our audits. We are a public accounting firm registered with the PCAOB and are required to be independent with respect to the Companyin accordance with the U.S. federal securities laws and the applicable rules and regulations of the Securities and Exchange Commission and the PCAOB.
We conducted our audits in accordance with the standards of the PCAOB. Those standards require that we plan and perform the audit to obtain reasonableassurance about whether the financial statements are free of material misstatement, whether due to error or fraud. Our audits included performing proceduresto assess the risks of material misstatement of the financial statements, whether due to error or fraud, and performing procedures that respond to those risks.Such procedures included examining, on a test basis, evidence regarding the amounts and disclosures in the financial statements. Our audits also includedevaluating the accounting principles used and significant estimates made by management, as well as evaluating the overall presentation of the financialstatements. We believe that our audits provide a reasonable basis for our opinion.
/s/ Ernst & Young LLP
We have served as the Company’s auditor since 2002.
Tysons, VirginiaFebruary 20, 2018
59
Source: DANAHER CORP /DE/, 10-K, February 21, 2018 Powered by Morningstar® Document Research℠The information contained herein may not be copied, adapted or distributed and is not warranted to be accurate, complete or timely. The user assumes all risks for any damages or losses arising from any use of this information,except to the extent such damages or losses cannot be limited or excluded by applicable law. Past financial performance is no guarantee of future results.

Table of Contents
DANAHER CORPORATION AND SUBSIDIARIESCONSOLIDATED BALANCE SHEETS
($ and shares in millions, except per share amount)
As of December 31
2017 2016
ASSETS Current assets:
Cash and equivalents $ 630.3 $ 963.7Trade accounts receivable, less allowance for doubtful accounts of $116.1 and $102.4, respectively 3,521.8 3,186.1Inventories 1,840.8 1,709.4Prepaid expenses and other current assets 857.1 805.9
Total current assets 6,850.0 6,665.1Property, plant and equipment, net 2,454.6 2,354.0Other assets 538.3 631.3Goodwill 25,138.6 23,826.9Other intangible assets, net 11,667.1 11,818.0Total assets $ 46,648.6 $ 45,295.3LIABILITIES AND STOCKHOLDERS’ EQUITY Current liabilities:
Notes payable and current portion of long-term debt $ 194.7 $ 2,594.8Trade accounts payable 1,509.9 1,485.0Accrued expenses and other liabilities 3,087.7 2,794.2
Total current liabilities 4,792.3 6,874.0Other long-term liabilities 5,161.1 5,670.3Long-term debt 10,327.4 9,674.2Stockholders’ equity:
Common stock - $0.01 par value, 2.0 billion shares authorized; 812.5 and 807.7 issued; 696.6 and 692.2outstanding, respectively 8.1 8.1Additional paid-in capital 5,538.2 5,312.9Retained earnings 22,806.1 20,703.5Accumulated other comprehensive income (loss) (1,994.2) (3,021.7)
Total Danaher stockholders’ equity 26,358.2 23,002.8Noncontrolling interests 9.6 74.0Total stockholders’ equity 26,367.8 23,076.8Total liabilities and stockholders’ equity $ 46,648.6 $ 45,295.3
See the accompanying Notes to the Consolidated Financial Statements.
60
Source: DANAHER CORP /DE/, 10-K, February 21, 2018 Powered by Morningstar® Document Research℠The information contained herein may not be copied, adapted or distributed and is not warranted to be accurate, complete or timely. The user assumes all risks for any damages or losses arising from any use of this information,except to the extent such damages or losses cannot be limited or excluded by applicable law. Past financial performance is no guarantee of future results.

Table of Contents
DANAHER CORPORATION AND SUBSIDIARIESCONSOLIDATED STATEMENTS OF EARNINGS($ and shares in millions, except per share amounts)
Year Ended December 31
2017 2016 2015
Sales $ 18,329.7 $ 16,882.4 $ 14,433.7Cost of sales (8,137.2) (7,547.8) (6,662.6)Gross profit 10,192.5 9,334.6 7,771.1Operating costs:
Selling, general and administrative expenses (6,042.5) (5,608.6) (4,747.5)Research and development expenses (1,128.8) (975.1) (861.4)
Operating profit 3,021.2 2,750.9 2,162.2Nonoperating income (expense):
Other income 72.8 223.4 12.4Loss on early extinguishment of borrowings — (178.8) —Interest expense (162.7) (184.4) (139.8)Interest income 7.5 0.2 4.6
Earnings from continuing operations before income taxes 2,938.8 2,611.3 2,039.4Income taxes (469.0) (457.9) (292.7)Net earnings from continuing operations 2,469.8 2,153.4 1,746.7Earnings from discontinued operations, net of income taxes 22.3 400.3 1,610.7Net earnings $ 2,492.1 $ 2,553.7 $ 3,357.4Net earnings per share from continuing operations:
Basic $ 3.55 $ 3.12 $ 2.50Diluted $ 3.50 $ 3.08 $ 2.47
Net earnings per share from discontinued operations: Basic $ 0.03 $ 0.58 $ 2.31Diluted $ 0.03 $ 0.57 $ 2.27
Net earnings per share: Basic $ 3.58 $ 3.69 * $ 4.81Diluted $ 3.53 $ 3.65 $ 4.74
Average common stock and common equivalent shares outstanding: Basic 695.8 691.2 698.1Diluted 706.1 699.8 708.5
* Net earnings per share amount does not add due to rounding.
See the accompanying Notes to the Consolidated Financial Statements.
61
Source: DANAHER CORP /DE/, 10-K, February 21, 2018 Powered by Morningstar® Document Research℠The information contained herein may not be copied, adapted or distributed and is not warranted to be accurate, complete or timely. The user assumes all risks for any damages or losses arising from any use of this information,except to the extent such damages or losses cannot be limited or excluded by applicable law. Past financial performance is no guarantee of future results.

Table of Contents
DANAHER CORPORATION AND SUBSIDIARIESCONSOLIDATED STATEMENTS OF COMPREHENSIVE INCOME
($ in millions)
Year Ended December 31
2017 2016 2015
Net earnings $ 2,492.1 $ 2,553.7 $ 3,357.4Other comprehensive income (loss), net of income taxes:
Foreign currency translation adjustments 976.1 (517.3) (975.6)Pension and postretirement plan benefit adjustments 71.0 (58.2) 80.5Unrealized (loss) gain on available-for-sale securities (19.6) (114.8) 17.6
Total other comprehensive income (loss), net of income taxes 1,027.5 (690.3) (877.5)Comprehensive income $ 3,519.6 $ 1,863.4 $ 2,479.9
See the accompanying Notes to the Consolidated Financial Statements.
62
Source: DANAHER CORP /DE/, 10-K, February 21, 2018 Powered by Morningstar® Document Research℠The information contained herein may not be copied, adapted or distributed and is not warranted to be accurate, complete or timely. The user assumes all risks for any damages or losses arising from any use of this information,except to the extent such damages or losses cannot be limited or excluded by applicable law. Past financial performance is no guarantee of future results.

Table of Contents
DANAHER CORPORATION AND SUBSIDIARIESCONSOLIDATED STATEMENTS OF STOCKHOLDERS’ EQUITY
($ and shares in millions)
Common Stock Additional Paid-
in Capital RetainedEarnings
Accumulated OtherComprehensiveIncome (Loss)
NoncontrollingInterestsShares Amount
Balance, January 1, 2015 792.5 $ 7.9 $ 4,480.9 $ 20,323.0 $ (1,433.7) $ 71.7Net earnings for the year — — — 3,357.4 — —Other comprehensive income (loss) — — — — (877.5) —Dividends declared — — — (376.4) — —Common stock-based award activity 7.8 0.1 443.9 — — —Common stock issued in connection withLYONs’ conversions 1.3 — 56.4 — — —Shares redeemed through the distribution of thecommunications business (26.0 shares held asTreasury shares) — — — (2,291.7) — —Change in noncontrolling interests — — — — — 2.0
Balance, December 31, 2015 801.6 8.0 4,981.2 21,012.3 (2,311.2) 73.7Net earnings for the year — — — 2,553.7 — —Other comprehensive income (loss) — — — — (690.3) —Dividends declared — — — (393.6) — —Common stock-based award activity 5.8 0.1 322.6 — — —Common stock issued in connection withLYONs’ conversions 0.3 — 9.1 — — —Distribution of Fortive Corporation — — — (2,468.9) (20.2) —Change in noncontrolling interests — — — — — 0.3
Balance, December 31, 2016 807.7 8.1 5,312.9 20,703.5 (3,021.7) 74.0Net earnings for the year — — — 2,492.1 — —Other comprehensive income (loss) — — — — 1,027.5 —Dividends declared — — — (389.5) — —Common stock-based award activity 4.8 — 214.1 — — —Common stock issued in connection withLYONs’ conversions — — 12.4 — — —Change in noncontrolling interests — — (1.2) — — (64.4)
Balance, December 31, 2017 812.5 $ 8.1 $ 5,538.2 $ 22,806.1 $ (1,994.2) $ 9.6
See the accompanying Notes to the Consolidated Financial Statements.
63
Source: DANAHER CORP /DE/, 10-K, February 21, 2018 Powered by Morningstar® Document Research℠The information contained herein may not be copied, adapted or distributed and is not warranted to be accurate, complete or timely. The user assumes all risks for any damages or losses arising from any use of this information,except to the extent such damages or losses cannot be limited or excluded by applicable law. Past financial performance is no guarantee of future results.
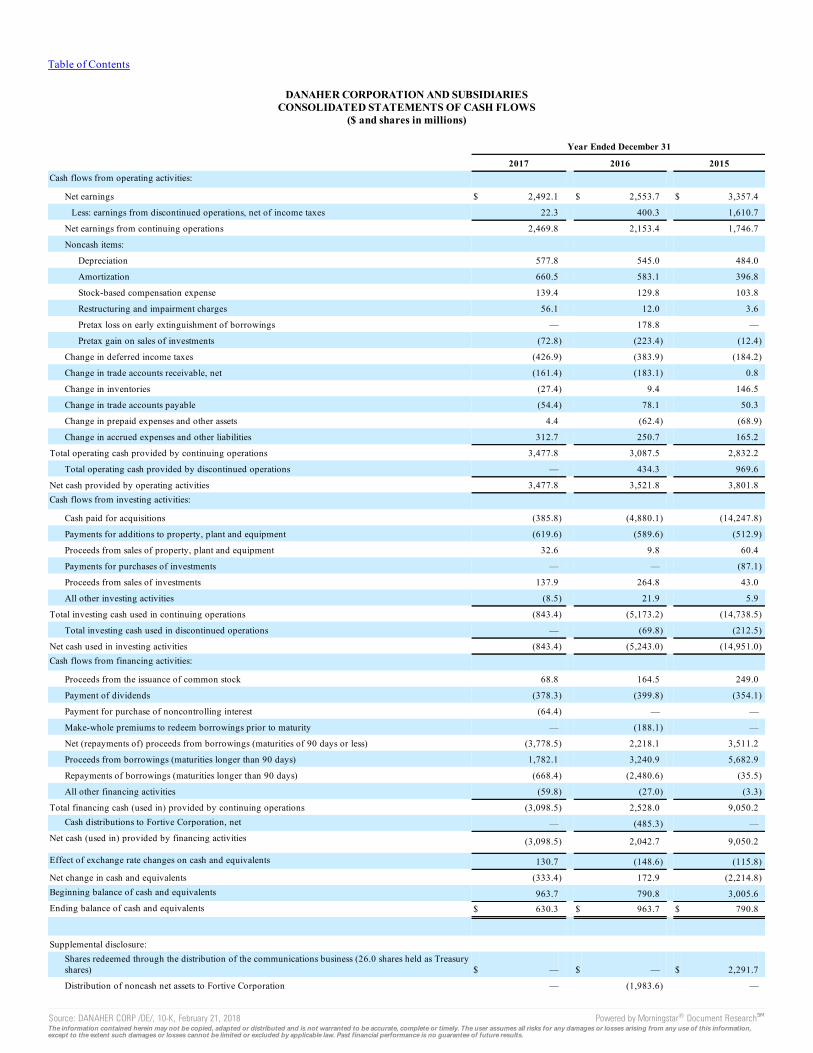
Table of Contents
DANAHER CORPORATION AND SUBSIDIARIESCONSOLIDATED STATEMENTS OF CASH FLOWS
($ and shares in millions)
Year Ended December 31
2017 2016 2015Cash flows from operating activities:
Net earnings $ 2,492.1 $ 2,553.7 $ 3,357.4
Less: earnings from discontinued operations, net of income taxes 22.3 400.3 1,610.7
Net earnings from continuing operations 2,469.8 2,153.4 1,746.7
Noncash items: Depreciation 577.8 545.0 484.0
Amortization 660.5 583.1 396.8
Stock-based compensation expense 139.4 129.8 103.8
Restructuring and impairment charges 56.1 12.0 3.6
Pretax loss on early extinguishment of borrowings — 178.8 —
Pretax gain on sales of investments (72.8) (223.4) (12.4)
Change in deferred income taxes (426.9) (383.9) (184.2)
Change in trade accounts receivable, net (161.4) (183.1) 0.8
Change in inventories (27.4) 9.4 146.5
Change in trade accounts payable (54.4) 78.1 50.3
Change in prepaid expenses and other assets 4.4 (62.4) (68.9)
Change in accrued expenses and other liabilities 312.7 250.7 165.2
Total operating cash provided by continuing operations 3,477.8 3,087.5 2,832.2
Total operating cash provided by discontinued operations — 434.3 969.6
Net cash provided by operating activities 3,477.8 3,521.8 3,801.8Cash flows from investing activities:
Cash paid for acquisitions (385.8) (4,880.1) (14,247.8)
Payments for additions to property, plant and equipment (619.6) (589.6) (512.9)
Proceeds from sales of property, plant and equipment 32.6 9.8 60.4
Payments for purchases of investments — — (87.1)
Proceeds from sales of investments 137.9 264.8 43.0
All other investing activities (8.5) 21.9 5.9
Total investing cash used in continuing operations (843.4) (5,173.2) (14,738.5)
Total investing cash used in discontinued operations — (69.8) (212.5)
Net cash used in investing activities (843.4) (5,243.0) (14,951.0)Cash flows from financing activities:
Proceeds from the issuance of common stock 68.8 164.5 249.0
Payment of dividends (378.3) (399.8) (354.1)
Payment for purchase of noncontrolling interest (64.4) — —
Make-whole premiums to redeem borrowings prior to maturity — (188.1) —
Net (repayments of) proceeds from borrowings (maturities of 90 days or less) (3,778.5) 2,218.1 3,511.2
Proceeds from borrowings (maturities longer than 90 days) 1,782.1 3,240.9 5,682.9
Repayments of borrowings (maturities longer than 90 days) (668.4) (2,480.6) (35.5)
All other financing activities (59.8) (27.0) (3.3)
Total financing cash (used in) provided by continuing operations (3,098.5) 2,528.0 9,050.2Cash distributions to Fortive Corporation, net — (485.3) —
Net cash (used in) provided by financing activities (3,098.5) 2,042.7 9,050.2
Effect of exchange rate changes on cash and equivalents 130.7 (148.6) (115.8)
Net change in cash and equivalents (333.4) 172.9 (2,214.8)Beginning balance of cash and equivalents 963.7 790.8 3,005.6Ending balance of cash and equivalents $ 630.3 $ 963.7 $ 790.8
Supplemental disclosure:
Shares redeemed through the distribution of the communications business (26.0 shares held as Treasuryshares) $ — $ — $ 2,291.7
Distribution of noncash net assets to Fortive Corporation — (1,983.6) —
Source: DANAHER CORP /DE/, 10-K, February 21, 2018 Powered by Morningstar® Document Research℠The information contained herein may not be copied, adapted or distributed and is not warranted to be accurate, complete or timely. The user assumes all risks for any damages or losses arising from any use of this information,except to the extent such damages or losses cannot be limited or excluded by applicable law. Past financial performance is no guarantee of future results.

See the accompanying Notes to the Consolidated Financial Statements.
64
Source: DANAHER CORP /DE/, 10-K, February 21, 2018 Powered by Morningstar® Document Research℠The information contained herein may not be copied, adapted or distributed and is not warranted to be accurate, complete or timely. The user assumes all risks for any damages or losses arising from any use of this information,except to the extent such damages or losses cannot be limited or excluded by applicable law. Past financial performance is no guarantee of future results.

Table of Contents
DANAHER CORPORATION AND SUBSIDIARIESNOTES TO CONSOLIDATED FINANCIAL STATEMENTS
NOTE 1. BUSINESS AND SUMMARY OF SIGNIFICANT ACCOUNTING POLICIESBusiness—Danaher Corporation (“Danaher” or the “Company”) designs, manufactures and markets professional, medical, industrial and commercial productsand services, which are typically characterized by strong brand names, innovative technology and major market positions. The Company operates in fourbusiness segments: Life Sciences; Diagnostics; Dental; and Environmental & Applied Solutions.
The Company’s Life Sciences segment offers a broad range of research tools that scientists use to study the basic building blocks of life, including genes,proteins, metabolites and cells, in order to understand the causes of disease, identify new therapies and test new drugs and vaccines. The segment, through itsPall Corporation (“Pall”) business, is also a leading provider of filtration, separation and purification technologies to the biopharmaceutical, food andbeverage, medical, aerospace, microelectronics and general industrial sectors.
The Company’s Diagnostics segment offers analytical instruments, reagents, consumables, software and services that hospitals, physicians’ offices, referencelaboratories and other critical care settings use to diagnose disease and make treatment decisions.
The Company’s Dental segment provides products that are used to diagnose, treat and prevent disease and ailments of the teeth, gums and supporting bone,as well as to improve the aesthetics of the human smile. The Company is a leading worldwide provider of a broad range of dental consumables, equipmentand services, and is dedicated to driving technological innovations that help dental professionals improve clinical outcomes and enhance productivity.
The Company’s Environmental & Applied Solutions segment products and services help protect important resources and keep global food and water suppliessafe. The Company’s water quality business provides instrumentation, services and disinfection systems to help analyze, treat and manage the quality ofultra-pure, potable, industrial, waste, ground, source and ocean water in residential, commercial, municipal, industrial and natural resource applications. TheCompany’s product identification business provides equipment, software, services and consumables for various color and appearance management,packaging design and quality management, printing, marking, coding and traceability applications for consumer, pharmaceutical and industrial products.
Refer to Notes 2 and 3 for a discussion of significant acquisitions and discontinued operations.
Accounting Principles—The accompanying financial statements have been prepared in accordance with accounting principles generally accepted in theUnited States (“GAAP”). The Consolidated Financial Statements include the accounts of the Company and its subsidiaries. All intercompany balances andtransactions have been eliminated upon consolidation. The Consolidated Financial Statements also reflect the impact of noncontrolling interests.Noncontrolling interests do not have a significant impact on the Company’s consolidated results of operations, therefore earnings and earnings per shareattributable to noncontrolling interests are not presented separately in the Company’s Consolidated Statements of Earnings. Earnings attributable tononcontrolling interests have been reflected in selling, general and administrative expenses and were insignificant in all periods presented.
Use of Estimates—The preparation of these financial statements in conformity with accounting principles generally accepted in the United States requiresmanagement to make estimates and judgments that affect the reported amounts of assets, liabilities, revenues and expenses, and related disclosure ofcontingent assets and liabilities. The Company bases these estimates on historical experience, the current economic environment and on various otherassumptions that are believed to be reasonable under the circumstances. However, uncertainties associated with these estimates exist and actual results maydiffer materially from these estimates.
Cash and Equivalents—The Company considers all highly liquid investments with a maturity of three months or less at the date of purchase to be cashequivalents.
Accounts Receivable and Allowances for Doubtful Accounts—All trade accounts, contract and finance receivables are reported on the accompanyingConsolidated Balance Sheets adjusted for any write-offs and net of allowances for doubtful accounts. The allowances for doubtful accounts representmanagement’s best estimate of the credit losses expected from the Company’s trade accounts, contract and finance receivable portfolios. Determination of theallowances requires management to exercise judgment about the timing, frequency and severity of credit losses that could materially affect the provision forcredit losses and, therefore, net earnings. The Company regularly performs detailed reviews of its portfolios to determine if an impairment has occurred andevaluates the collectability of receivables based on a combination of various financial and qualitative factors that may affect customers’ ability to pay,including customers’ financial condition, collateral, debt-servicing ability, past
65
Source: DANAHER CORP /DE/, 10-K, February 21, 2018 Powered by Morningstar® Document Research℠The information contained herein may not be copied, adapted or distributed and is not warranted to be accurate, complete or timely. The user assumes all risks for any damages or losses arising from any use of this information,except to the extent such damages or losses cannot be limited or excluded by applicable law. Past financial performance is no guarantee of future results.

Table of Contents
payment experience and credit bureau information. In circumstances where the Company is aware of a specific customer’s inability to meet its financialobligations, a specific reserve is recorded against amounts due to reduce the recognized receivable to the amount reasonably expected to be collected.Additions to the allowances for doubtful accounts are charged to current period earnings, amounts determined to be uncollectible are charged directly againstthe allowances, while amounts recovered on previously written-off accounts increase the allowances. If the financial condition of the Company’s customerswere to deteriorate, resulting in an impairment of their ability to make payments, additional reserves would be required. The Company does not believe thataccounts receivable represent significant concentrations of credit risk because of the diversified portfolio of individual customers and geographical areas.The Company recorded $33 million, $33 million and $25 million of expense associated with doubtful accounts for the years ended December 31, 2017, 2016and 2015, respectively.
Included in the Company’s trade accounts receivable and other long-term assets as of December 31, 2017 and 2016 are $213 million and $191 million of netaggregate financing receivables, respectively. All financing receivables are evaluated for impairment based on individual customer credit profiles.
Inventory Valuation—Inventories include the costs of material, labor and overhead. Domestic inventories are stated at the lower of cost or market primarilyusing the first-in, first-out (“FIFO”) method with certain businesses applying the last-in, first-out method (“LIFO”) to value inventory. Inventories heldoutside the United States are stated at the lower of cost or market primarily using the FIFO method.
Property, Plant and Equipment—Property, plant and equipment are carried at cost. The provision for depreciation has been computed principally by thestraight-line method based on the estimated useful lives of the depreciable assets as follows:
Category Useful Life
Buildings 30 yearsLeased assets and leasehold improvements
Amortized over the lesser of the economic life of the asset or the term of the
leaseMachinery and equipment 3 – 10 yearsCustomer-leased instruments 5 – 7 years
Estimated useful lives are periodically reviewed and, when appropriate, changes to estimates are made prospectively.
Investments—Investments over which the Company has a significant influence but not a controlling interest, are accounted for using the equity method ofaccounting. Equity investments are recorded at the amount of the Company’s initial investment and adjusted each period for the Company’s share of theinvestee’s income or loss and dividends paid. All equity investments are periodically reviewed to determine if declines in fair value below cost basis areother-than-temporary. Significant and sustained decreases in quoted market prices or a series of historic and projected operating losses by investees are strongindicators of other-than-temporary declines. If the decline in fair value is determined to be other-than-temporary, an impairment loss is recorded and theinvestment is written down to a new carrying value.
Other Assets—Other assets principally include noncurrent financing receivables, noncurrent deferred tax assets and other investments.
Fair Value of Financial Instruments—The Company’s financial instruments consist primarily of cash and cash equivalents, trade accounts receivable,available-for-sale securities, nonqualified deferred compensation plans, obligations under trade accounts payable and short and long-term debt. Due to theirshort-term nature, the carrying values for cash and cash equivalents, trade accounts receivable and trade accounts payable approximate fair value. Refer toNote 7 for the fair values of the Company’s available-for-sale securities and other obligations.
Goodwill and Other Intangible Assets—Goodwill and other intangible assets result from the Company’s acquisition of existing businesses. In accordancewith accounting standards related to business combinations, goodwill is not amortized, however, certain definite-lived identifiable intangible assets,primarily customer relationships and acquired technology, are amortized over their estimated useful lives. Intangible assets with indefinite lives are notamortized. In-process research and development (“IPR&D”) is initially capitalized at fair value and when the IPR&D project is complete, the asset isconsidered a finite-lived intangible asset and amortized over its estimated useful life. If an IPR&D project is abandoned, an impairment loss equal to thevalue of the intangible asset is recorded in the period of abandonment. The Company reviews identified intangible assets for impairment whenever events orchanges in circumstances indicate that the related carrying amounts may not be recoverable. The Company also tests intangible assets with indefinite lives atleast annually for impairment. Refer to Notes 2 and 6 for additional information about the Company’s goodwill and other intangible assets.
66
Source: DANAHER CORP /DE/, 10-K, February 21, 2018 Powered by Morningstar® Document Research℠The information contained herein may not be copied, adapted or distributed and is not warranted to be accurate, complete or timely. The user assumes all risks for any damages or losses arising from any use of this information,except to the extent such damages or losses cannot be limited or excluded by applicable law. Past financial performance is no guarantee of future results.

Table of Contents
Revenue Recognition—As described above, the Company derives revenues primarily from the sale of Life Sciences, Diagnostics, Dental and Environmental& Applied Solutions products and services. For revenue related to a product or service to qualify for recognition, there must be persuasive evidence of anarrangement with a customer, delivery must have occurred or the services must have been rendered, the price to the customer must be fixed and determinableand collectability of the associated fee must be reasonably assured. The Company’s principal terms of sale are FOB Shipping Point, or equivalent, and, assuch, the Company primarily records revenue for product sales upon shipment. Sales arrangements entered with delivery terms that are not FOB ShippingPoint are not recognized upon shipment and the delivery criteria for revenue recognition is evaluated based on the associated shipping terms and customerobligations. If any significant obligation to the customer with respect to a sales transaction remains to be fulfilled following shipment (typically installationor acceptance by the customer), revenue recognition is deferred until such obligations have been fulfilled. Returns for products sold are estimated andrecorded as a reduction of revenue at the time of sale. Customer allowances and rebates, consisting primarily of volume discounts and other short-termincentive programs, are recorded as a reduction of revenue at the time of sale because these allowances reflect a reduction in the purchase price. Productreturns, customer allowances and rebates are estimated based on historical experience and known trends. Revenue related to separately priced extendedwarranty and product maintenance agreements is deferred when appropriate and recognized as revenue over the term of the agreement.
Certain of the Company’s revenues relate to operating-type lease (“OTL”) arrangements. Instrument lease revenue for OTL agreements is recognized on astraight-line basis over the life of the lease, and the costs of customer-leased instruments are recorded within property, plant and equipment in theaccompanying Consolidated Balance Sheets and depreciated over the instrument’s estimated useful life. The depreciation expense is reflected in cost of salesin the accompanying Consolidated Statements of Earnings. The OTLs are generally not cancellable until after the first two years. Certain of the Company’slease contracts are customized for larger customers and often result in complex terms and conditions that typically require significant judgment in applyingthe criteria used to evaluate whether the arrangement should be considered an OTL or a sales-type lease. A sales-type lease would result in earlier recognitionof instrument revenue as compared to an OTL.
Revenues for contractual arrangements consisting of multiple elements (i.e., deliverables) are recognized for the separate elements when the product orservices that are part of the multiple element arrangement have value on a stand-alone basis and, in arrangements that include a general right of refundrelative to the delivered element, performance of the undelivered element is considered probable and substantially in the Company’s control. Certaincustomer arrangements include multiple elements, typically hardware, installation, training, consulting, services and/or post contract support (“PCS”).Generally, these elements are delivered within the same reporting period, except PCS or other services, for which revenue is recognized over the serviceperiod. The Company allocates revenue to each element in the arrangement using the selling price hierarchy and based on each element’s relative sellingprice. The selling price for a deliverable is based on its vendor-specific objective evidence (“VSOE”) if available, third-party evidence (“TPE”) if VSOE is notavailable, or estimated selling price (“ESP”) if neither VSOE or TPE is available. The Company considers relevant internal and external market factors incases where the Company is required to estimate selling prices. Allocation of the consideration is determined at the inception of the arrangements.
On January 1, 2018, the Company adopted Accounting Standards Update (“ASU”) No. 2014-09, Revenue from Contracts with Customers (Topic 606), whichsupersedes nearly all existing revenue recognition guidance.
Shipping and Handling—Shipping and handling costs are included as a component of cost of sales. Revenue derived from shipping and handling costsbilled to customers is included in sales.
Advertising—Advertising costs are expensed as incurred.
Research and Development—The Company conducts research and development activities for the purpose of developing new products, enhancing thefunctionality, effectiveness, ease of use and reliability of the Company’s existing products and expanding the applications for which uses of the Company’sproducts are appropriate. Research and development costs are expensed as incurred.
Income Taxes—The Company’s income tax expense represents the tax liability for the current year, the tax benefit or expense for the net change in deferredtax liabilities and assets during the year, as well as reserves for unrecognized tax benefits and return to provision adjustments. Deferred tax liabilities andassets are determined based on the difference between the financial statement and tax basis of assets and liabilities using enacted rates expected to be in effectduring the year in which the differences reverse. Deferred tax assets generally represent items that can be used as a tax deduction or credit in the Company’stax return in future years for which the tax benefit has already been reflected on the Company’s Consolidated Statements of Earnings. The Companyestablishes valuation allowances for its deferred tax assets if it is more likely than not that some or all of the deferred tax asset will not be realized. Deferredtax liabilities generally represent items that have already been taken as a deduction on the Company’s tax return but have not yet been recognized as anexpense in the Company’s Consolidated Statements of Earnings. The effect on deferred tax assets and liabilities due to a change in tax rates is recognized
67
Source: DANAHER CORP /DE/, 10-K, February 21, 2018 Powered by Morningstar® Document Research℠The information contained herein may not be copied, adapted or distributed and is not warranted to be accurate, complete or timely. The user assumes all risks for any damages or losses arising from any use of this information,except to the extent such damages or losses cannot be limited or excluded by applicable law. Past financial performance is no guarantee of future results.

Table of Contents
in income tax expense in the period that includes the enactment date. The Company provides for unrecognized tax benefits when, based upon the technicalmerits, it is “more likely than not” that an uncertain tax position will not be sustained upon examination. Judgment is required in evaluating tax positionsand determining income tax provisions. The Company re-evaluates the technical merits of its tax positions and may recognize an uncertain tax benefit incertain circumstances, including when: (1) a tax audit is completed; (2) applicable tax laws change, including a tax case ruling or legislative guidance; or(3) the applicable statute of limitations expires. The Company recognizes potential accrued interest and penalties associated with unrecognized tax positionsin income tax expense. Refer to Note 12 for additional information and discussion of the impact of the enactment of the Tax Cuts and Jobs Act (“TCJA”) inthe United States.
Productivity Improvement and Restructuring—The Company periodically initiates productivity improvement and restructuring activities to appropriatelyposition the Company’s cost base relative to prevailing economic conditions and associated customer demand as well as in connection with certainacquisitions. Costs associated with productivity improvement and restructuring actions can include one-time termination benefits and related charges inaddition to facility closure, contract termination and other related activities. The Company records the cost of the productivity improvement andrestructuring activities when the associated liability is incurred. Refer to Note 14 for additional information.
Foreign Currency Translation—Exchange rate adjustments resulting from foreign currency transactions are recognized in net earnings, whereas effectsresulting from the translation of financial statements are reflected as a component of accumulated other comprehensive income (loss) within stockholders’equity. Assets and liabilities of subsidiaries operating outside the United States with a functional currency other than U.S. dollars are translated into U.S.dollars using year-end exchange rates and income statement accounts are translated at weighted average rates. Net foreign currency transaction gains or losseswere not material in any of the years presented.
Derivative Financial Instruments—The Company is neither a dealer nor a trader in derivative instruments. The Company has generally accepted the exposureto exchange rate movements without using derivative instruments to manage this risk, although the Company’s foreign currency-denominated debt partiallyhedges its net investments in foreign operations against adverse movements in exchange rates. The Company will periodically enter into foreign currencyforward contracts not exceeding 12 months to mitigate a portion of its foreign currency exchange risk and forward starting swaps to mitigate interest rate riskrelated to the Company’s debt. When utilized, the derivative instruments are recorded on the Consolidated Balance Sheets as either an asset or liabilitymeasured at fair value. To the extent the foreign currency forward contract or forward starting swap qualifies as an effective hedge, changes in fair value arerecognized in accumulated other comprehensive income (loss) in stockholders’ equity. The Company’s use of foreign currency forward contracts and forwardstarting swaps during 2017, 2016 and 2015 and as of the years then ended was not significant.
68
Source: DANAHER CORP /DE/, 10-K, February 21, 2018 Powered by Morningstar® Document Research℠The information contained herein may not be copied, adapted or distributed and is not warranted to be accurate, complete or timely. The user assumes all risks for any damages or losses arising from any use of this information,except to the extent such damages or losses cannot be limited or excluded by applicable law. Past financial performance is no guarantee of future results.

Table of Contents
Accumulated Other Comprehensive Income (Loss)—Foreign currency translation adjustments are generally not adjusted for income taxes as they relate toindefinite investments in non-U.S. subsidiaries. The changes in accumulated other comprehensive income (loss) by component are summarized below ($ inmillions):
Foreign CurrencyTranslationAdjustments
Pension &Postretirement
Plan BenefitAdjustments
Unrealized Gain(Loss) on
Available-For-Sale Securities Total
Balance, January 1, 2015 $ (821.8) $ (727.8) $ 115.9 $ (1,433.7)Other comprehensive income (loss) before reclassifications:
(Decrease) increase (975.6) 69.8 40.7 (865.1)Income tax impact — (12.3) (15.3) (27.6)
Other comprehensive income (loss) before reclassifications, net of incometaxes (975.6) 57.5 25.4 (892.7)Amounts reclassified from accumulated other comprehensive income (loss):
Increase (decrease) — 33.5 (a) (12.4) (b) 21.1Income tax impact — (10.5) 4.6 (5.9)
Amounts reclassified from accumulated other comprehensive income (loss),net of income taxes — 23.0 (7.8) 15.2Net current period other comprehensive income (loss), net of income taxes (975.6) 80.5 17.6 (877.5)Balance, December 31, 2015 (1,797.4) (647.3) 133.5 (2,311.2)Other comprehensive income (loss) before reclassifications:
(Decrease) increase (517.3) (115.4) 39.6 (593.1)Income tax impact — 38.9 (14.8) 24.1
Other comprehensive income (loss) before reclassifications, net of incometaxes (517.3) (76.5) 24.8 (569.0)Amounts reclassified from accumulated other comprehensive income (loss):
Increase (decrease) — 28.0 (a) (223.4) (b) (195.4)Income tax impact — (9.7) 83.8 74.1
Amounts reclassified from accumulated other comprehensive income (loss),net of income taxes — 18.3 (139.6) (121.3)Net current period other comprehensive income (loss), net of income taxes (517.3) (58.2) (114.8) (690.3)Distribution of Fortive Corporation (83.5) 63.3 (c) — (20.2)Balance, December 31, 2016 (2,398.2) (642.2) 18.7 (3,021.7)Other comprehensive income (loss) before reclassifications:
Increase 976.1 62.4 41.7 1,080.2Income tax impact — (13.4) (15.7) (29.1)
Other comprehensive income (loss) before reclassifications, net of incometaxes 976.1 49.0 26.0 1,051.1Amounts reclassified from accumulated other comprehensive income (loss):
Increase (decrease) — 28.7 (a) (72.8) (b) (44.1)Income tax impact — (6.7) 27.2 20.5
Amounts reclassified from accumulated other comprehensive income (loss),net of income taxes — 22.0 (45.6) (23.6)Net current period other comprehensive income (loss), net of income taxes 976.1 71.0 (19.6) 1,027.5Balance, December 31, 2017 $ (1,422.1) $ (571.2) $ (0.9) $ (1,994.2)
(a) This accumulated other comprehensive income (loss) component is included in the computation of net periodic pension and postretirement cost (refer to Notes 10 and 11 foradditional details).
(b) Included in other income in the accompanying Consolidated Statements of Earnings (refer to Note 13 for additional details).(c) This accumulated other comprehensive income (loss) component included an income tax impact of $21 million.
69
Source: DANAHER CORP /DE/, 10-K, February 21, 2018 Powered by Morningstar® Document Research℠The information contained herein may not be copied, adapted or distributed and is not warranted to be accurate, complete or timely. The user assumes all risks for any damages or losses arising from any use of this information,except to the extent such damages or losses cannot be limited or excluded by applicable law. Past financial performance is no guarantee of future results.

Table of Contents
Accounting for Stock-Based Compensation—The Company accounts for stock-based compensation by measuring the cost of employee services received inexchange for all equity awards granted, including stock options, restricted stock units (“RSUs”) and performance stock units (“PSUs”), based on the fair valueof the award as of the grant date. Equity-based compensation expense is recognized net of an estimated forfeiture rate on a straight-line basis over therequisite service period of the award, except that in the case of RSUs, compensation expense is recognized using an accelerated attribution method. Refer toNote 17 for additional information on the stock-based compensation plans in which certain employees of the Company participate.
Pension and Postretirement Benefit Plans—The Company measures its pension and postretirement plans’ assets and its obligations that determine therespective plan’s funded status as of the end of the Company’s fiscal year, and recognizes an asset for a plan’s overfunded status or a liability for a plan’sunderfunded status in its balance sheet. Changes in the funded status of the plans are recognized in the year in which the changes occur and reported incomprehensive income (loss). Refer to Notes 10 and 11 for additional information on the Company’s pension and postretirement plans including a discussionof the actuarial assumptions, the Company’s policy for recognizing the associated gains and losses and the method used to estimate service and interest costcomponents.
New Accounting Standards—In February 2018, the Financial Accounting Standards Board (“FASB”) issued ASU No. 2018-02, Income Statement-ReportingComprehensive Income (Topic 220) Reclassification of Certain Tax Effects from Accumulated Other Comprehensive Income, to address a specificconsequence of the TCJA by allowing a reclassification from accumulated other comprehensive income to retained earnings for stranded tax effects resultingfrom the TCJA’s reduction of the U.S. federal corporate income tax rate. The ASU is effective for all entities for annual periods beginning after December 15,2018, with early adoption permitted, and is to be applied either in the period of adoption or retrospectively to each period in which the effect of the change inthe U.S. federal corporate income tax rate in the TCJA is recognized. Management has not yet completed its assessment of the impact of the ASU on theCompany’s Consolidated Financial Statements.
In May 2017, the FASB issued ASU No. 2017-09, Compensation—Stock Compensation (Topic 718): Scope of Modification Accounting, which providedclarity on which changes to the terms or conditions of share-based payment awards require an entity to apply the modification accounting provisionsrequired in Topic 718. The standard is effective for all entities for annual periods beginning after December 15, 2017, with early adoption permitted,including adoption in any interim period for which financial statements have not yet been issued. The Company does not expect the adoption of this ASUwill have a material impact on its Consolidated Financial Statements.
In March 2017, the FASB issued ASU No. 2017-07, Compensation—Retirement Benefits (Topic 715): Improving the Presentation of Net Periodic PensionCost and Net Periodic Postretirement Benefit Cost, which requires employers to disaggregate the service cost component from other components of netperiodic benefit costs and to disclose the amounts of net periodic benefit costs that are included in each income statement line item. The standard requiresemployers to report the service cost component in the same line item as other compensation costs and to report the other components of net periodic benefitcosts (which include interest costs, expected return on plan assets, amortization of prior service cost or credits and actuarial gains and losses) separately andoutside a subtotal of operating income. The income statement guidance requires application on a retrospective basis. The ASU is effective for public entitiesfor annual periods beginning after December 15, 2017, including interim periods, with early adoption permitted. Had this standard been adopted in priorperiods, reported operating profit would have been $31 million and $16 million lower and other income would have been $31 million and $16 millionhigher than reflected in the Consolidated Statements of Earnings for the years ended December 31, 2017 and 2016, respectively. Other than the presentationof the components of pension expense in the income statement, the adoption of this ASU will not have a material impact on the Company’s ConsolidatedFinancial Statements.
In June 2016, the FASB issued ASU No. 2016-13, Financial Instruments—Credit Losses (Topic 326): Measurement of Credit Losses on FinancialInstruments, which amends the impairment model by requiring entities to use a forward-looking approach based on expected losses rather than incurredlosses to estimate credit losses on certain types of financial instruments, including trade receivables. This may result in the earlier recognition of allowancesfor losses. The ASU is effective for public entities for fiscal years beginning after December 15, 2019, with early adoption permitted. Management has not yetcompleted its assessment of the impact of the new standard on the Company’s Consolidated Financial Statements. Currently, the Company believes that themost notable impact of this ASU will relate to its processes around the assessment of the adequacy of its allowance for doubtful accounts on trade accountsreceivable and the recognition of credit losses.
In March 2016, the FASB issued ASU No. 2016-09, Compensation—Stock Compensation (Topic 718), which simplifies several aspects of the accounting forshare-based payment transactions, including the income tax consequences, classification of awards as either equity or liabilities, classification of certainitems on the statement of cash flows and accounting for forfeitures. The Company adopted this standard effective January 1, 2017. The ASU requires that thedifference between the actual tax benefit realized upon exercise or vesting, as applicable, and the tax benefit recorded based on the fair value of the stockaward at the time of grant (the “excess tax benefits”) be reflected as a reduction of the current period provision for
70
Source: DANAHER CORP /DE/, 10-K, February 21, 2018 Powered by Morningstar® Document Research℠The information contained herein may not be copied, adapted or distributed and is not warranted to be accurate, complete or timely. The user assumes all risks for any damages or losses arising from any use of this information,except to the extent such damages or losses cannot be limited or excluded by applicable law. Past financial performance is no guarantee of future results.

Table of Contents
income taxes with any shortfall recorded as an increase in the tax provision rather than as a component of changes to additional paid-in capital. The ASU alsorequires the excess tax benefit realized be reflected as operating cash flow rather than a financing cash flow. For the year ended December 31, 2017, theprovision for income taxes from continuing operations was reduced and operating cash flow from continuing operations was increased by $55 millionreflecting the impact of adopting this standard. Had this ASU been adopted at January 1, 2016, the provision for income taxes from continuing operationswould have been reduced and operating cash flow from continuing operations would have been increased by $30 million from the amounts reported for theyear ended December 31, 2016. The actual benefit to be realized in future periods is inherently uncertain and will vary based on the price of the Company’scommon stock as well as the timing of and relative value realized for future share-based transactions.
In February 2016, the FASB issued ASU No. 2016-02, Leases (Topic 842), which requires lessees to recognize a right-of-use asset and a lease liability for allleases with terms greater than 12 months. The standard also requires disclosures by lessees and lessors about the amount, timing and uncertainty of cash flowsarising from leases. The accounting applied by a lessor is largely unchanged from that applied under the current standard. The standard must be adoptedusing a modified retrospective transition approach and provides for certain practical expedients. The ASU is effective for public entities for fiscal yearsbeginning after December 15, 2018, with early adoption permitted. In September 2017 and January 2018, the FASB issued ASU No. 2017-13, RevenueRecognition (Topic 605), Revenue from Contracts with Customers (Topic 606), Leases (Topic 840), and Leases (Topic 842), and ASU No. 2018-01, Leases(Topic 842), Land Easement Practical Expedient for Transition to Topic 842, which provided additional implementation guidance on the previously issuedASU. Management has not yet completed its assessment of the impact of the new standard on the Company’s Consolidated Financial Statements. TheCompany is in the early stages of implementation and currently believes that the most notable impact to its financial statements upon the adoption of thisASU will be the recognition of a material right-of-use asset and lease liability for its real estate and equipment leases.
In January 2016, the FASB issued ASU No. 2016-01, Recognition and Measurement of Financial Assets and Financial Liabilities. The ASU amendsguidance on the classification and measurement of financial instruments, including significant revisions in accounting related to the classification andmeasurement of investments in equity securities and presentation of certain fair value changes for financial liabilities when the fair value option is elected.The ASU requires equity securities to be measured at fair value with changes in fair value recognized through net earnings and amends certain disclosurerequirements associated with the fair value of financial instruments. In the period of adoption, the Company is required to reclassify the unrealizedgains/losses on equity securities within accumulated other comprehensive income (loss) to retained earnings. The ASU is effective for the Company onJanuary 1, 2018 and the adoption will not have a material effect on the Company’s Consolidated Financial Statements.
In May 2014, the FASB issued ASU No. 2014-09, Revenue from Contracts with Customers (Topic 606), which supersedes nearly all existing revenuerecognition guidance. The core principle of the ASU is that revenue should be recognized to depict the transfer of promised goods or services to customers inan amount that reflects the consideration to which the entity expects to be entitled in exchange for those goods or services. In July 2015, the FASB deferredthe effective date of the standard by one year which results in the new standard being effective for the Company at the beginning of its first quarter of fiscalyear 2018. In addition, during March, April, May and December 2016 and September and November 2017, the FASB issued ASU No. 2016-08, Revenue fromContracts with Customers (Topic 606): Principal versus Agent Considerations (Reporting Revenue Gross versus Net), ASU No. 2016-10, Revenue fromContracts with Customers (Topic 606): Identifying Performance Obligations and Licensing, ASU No. 2016-12, Revenue from Contracts with Customers(Topic 606): Narrow-Scope Improvements and Practical Expedients, ASU No. 2016-20, Technical Corrections and Improvements to Topic 606, Revenuefrom Contracts with Customers, ASU No. 2017-13, Revenue Recognition (Topic 605), Revenue from Contracts with Customers (Topic 606), Leases (Topic840), and Leases (Topic 842), and ASU No. 2017-14, Income Statement—Reporting Comprehensive Income (Topic 220), Revenue Recognition (Topic 605),and Revenue from Contracts with Customers (Topic 606) respectively, which clarified the guidance on certain items such as reporting revenue as a principalversus agent, identifying performance obligations, accounting for intellectual property licenses, assessing collectability, presentation of sales taxes,impairment testing for contract costs, disclosure of performance obligations, and provided additional implementation guidance. On January 1, 2018, theCompany will adopt the ASU using the modified retrospective method for all contracts. The cumulative impact to beginning retained earnings fromadopting the new revenue standard is expected to be a charge of less than $5 million. The impact to beginning retained earnings is primarily driven by thedeferral of revenue for unfulfilled performance obligations, partially offset by the capitalization of certain costs to obtain a contract, primarily sales-relatedcommissions, where the amortization period for the related asset is greater than one year. The Company expects the impact of the new standard on theamount and timing of revenue recognized in 2018 to be insignificant. The ASU also requires additional disclosures about the nature, amount, timing anduncertainty of revenue and cash flows from customer contracts, including judgments and changes in judgments and assets recognized from costs incurred toobtain or fulfill a contract. The Company is in the process of finalizing changes to its business processes, systems and controls to support recognition anddisclosure under the new revenue standard.
71
Source: DANAHER CORP /DE/, 10-K, February 21, 2018 Powered by Morningstar® Document Research℠The information contained herein may not be copied, adapted or distributed and is not warranted to be accurate, complete or timely. The user assumes all risks for any damages or losses arising from any use of this information,except to the extent such damages or losses cannot be limited or excluded by applicable law. Past financial performance is no guarantee of future results.
Table of Contents
NOTE 2. ACQUISITIONSThe Company continually evaluates potential acquisitions that either strategically fit with the Company’s existing portfolio or expand the Company’sportfolio into a new and attractive business area. The Company has completed a number of acquisitions that have been accounted for as purchases and haveresulted in the recognition of goodwill in the Company’s Consolidated Financial Statements. This goodwill arises because the purchase prices for thesebusinesses reflect a number of factors including the future earnings and cash flow potential of these businesses, the multiple to earnings, cash flow and otherfactors at which similar businesses have been purchased by other acquirers, the competitive nature of the processes by which the Company acquired thebusinesses, the avoidance of the time and costs which would be required (and the associated risks that would be encountered) to enhance the Company’sexisting product offerings to key target markets and enter into new and profitable businesses, and the complementary strategic fit and resulting synergiesthese businesses bring to existing operations.
The Company makes an initial allocation of the purchase price at the date of acquisition based upon its understanding of the fair value of the acquired assetsand assumed liabilities. The Company obtains this information during due diligence and through other sources. In the months after closing, as the Companyobtains additional information about these assets and liabilities, including through tangible and intangible asset appraisals, and learns more about the newlyacquired business, it is able to refine the estimates of fair value and more accurately allocate the purchase price. Only items identified as of the acquisitiondate are considered for subsequent adjustment. The Company is continuing to evaluate certain pre-acquisition contingencies associated with certain of its2017 acquisitions and is also in the process of obtaining valuations of certain property, plant and equipment, acquired intangible assets and certainacquisition-related liabilities in connection with these acquisitions. The Company will make appropriate adjustments to the purchase price allocation prior tocompletion of the measurement period, as required.
The following briefly describes the Company’s acquisition activity for the three years ended December 31, 2017.
During 2017, the Company acquired ten businesses for total consideration of $386 million in cash, net of cash acquired. The businesses acquiredcomplement existing units of the Life Sciences, Dental and Environmental & Applied Solutions segments. The aggregate annual sales of these ten businessesat the time of their respective acquisitions, in each case based on the Company’s revenues for its last completed fiscal year prior to the acquisition, were $160million. The Company preliminarily recorded an aggregate of $268 million of goodwill related to these acquisitions.
On November 4, 2016, Copper Merger Sub, Inc., a California corporation and an indirect, wholly-owned subsidiary of the Company acquired all of theoutstanding shares of common stock of Cepheid, a California corporation, for $53.00 per share in cash, for a total purchase price of approximately $4.0billion, net of assumed debt and acquired cash (the “Cepheid Acquisition”). Cepheid is a leading global molecular diagnostics company that develops,manufactures and markets accurate and easy to use molecular systems and tests and is now part of the Company’s Diagnostics segment. Cepheid generatedrevenues of $539 million in 2015.
The Company initially financed the Cepheid acquisition price with available cash and proceeds from the issuance of U.S. dollar and euro-denominatedcommercial paper. The Company recorded approximately $2.6 billion of goodwill related to the Cepheid Acquisition. As Cepheid is integrated into theCompany, a process that will continue over the next several years, the Company expects to realize significant cost synergies through the application of DBSand the combined purchasing power of the Company and Cepheid.
In addition to the Cepheid Acquisition, during 2016 the Company acquired seven businesses for total consideration of $882 million in cash, net of cashacquired. The businesses acquired complement existing units of each of the Company’s four segments. The aggregate annual sales of these seven businessesat the time of their respective acquisitions, in each case based on the company’s revenues for its last completed fiscal year prior to the acquisition, were $237million. The Company recorded an aggregate of $478 million of goodwill related to these acquisitions.
On August 31, 2015, Pentagon Merger Sub, Inc., a New York corporation and an indirect, wholly-owned subsidiary of the Company, acquired all of theoutstanding shares of common stock of Pall, a New York corporation, for $127.20 per share in cash, for a total purchase price of approximately $13.6 billion,net of assumed debt of $417 million and acquired cash of approximately $1.2 billion (the “Pall Acquisition”). Pall is a leading global provider of filtration,separation and purification solutions that remove contaminants or separate substances from a variety of solids, liquids and gases, and is part of theCompany’s Life Sciences segment. In its fiscal year ended July 31, 2015, Pall generated consolidated revenues of approximately $2.8 billion. Pall servescustomers in the biopharmaceutical, food and beverage and medical markets as well as the process technologies, aerospace and microelectronics markets. TheCompany recorded approximately $9.6 billion of goodwill related to the Pall Acquisition.
72
Source: DANAHER CORP /DE/, 10-K, February 21, 2018 Powered by Morningstar® Document Research℠The information contained herein may not be copied, adapted or distributed and is not warranted to be accurate, complete or timely. The user assumes all risks for any damages or losses arising from any use of this information,except to the extent such damages or losses cannot be limited or excluded by applicable law. Past financial performance is no guarantee of future results.

Table of Contents
The Company financed the approximately $13.6 billion acquisition price of Pall with approximately $2.5 billion of available cash, approximately $8.1billion of net proceeds from the issuance and sale of U.S. dollar and euro-denominated commercial paper and €2.7 billion (approximately $3.0 billion basedon currency exchange rates as of the date of issuance) of net proceeds from the issuance and sale of euro-denominated senior unsecured notes. Subsequent tothe Pall Acquisition, the Company used the approximately $2.0 billion of net proceeds from the issuance of U.S. dollar-denominated senior unsecured notesand the approximately CHF 758 million ($739 million based on currency exchange rates as of date of issuance) of net proceeds, including the relatedpremium, from the issuance and sale of Swiss franc-denominated senior unsecured bonds to repay a portion of the commercial paper issued to finance the PallAcquisition and repay the CHF 100 million aggregate principal amount of the 0.0% senior unsecured bonds due in 2017.
In addition to the Pall Acquisition, during 2015 the Company acquired nine businesses for total consideration of approximately $670 million in cash, net ofcash acquired. The businesses acquired complement existing units of each of the Company’s four segments. The aggregate annual sales of these ninebusinesses at the time of their respective acquisitions, in each case based on the company’s revenues for its last completed fiscal year prior to the acquisition,were approximately $355 million. The Company recorded an aggregate of $285 million of goodwill related to these acquisitions.
The following summarizes the estimated fair values of the assets acquired and liabilities assumed at the date of acquisition ($ in millions):
2017 2016 2015
Trade accounts receivable $ 21.6 $ 97.8 $ 590.4Inventories 21.3 204.8 521.9Property, plant and equipment 9.1 161.8 740.0Goodwill 267.6 3,061.8 9,841.0Other intangible assets, primarily customer relationships, trade names and technology 155.1 1,867.0 5,045.3In-process research and development — 65.0 —Trade accounts payable (9.9) (50.7) (182.0)Other assets and liabilities, net (75.0) (518.0) (1,844.5)Assumed debt — (1.0) (417.0)Attributable to noncontrolling interest (4.0) — —Net assets acquired 385.8 4,888.5 14,295.1
Less: noncash consideration — (8.4) (47.3)Net cash consideration $ 385.8 $ 4,880.1 $ 14,247.8
73
Source: DANAHER CORP /DE/, 10-K, February 21, 2018 Powered by Morningstar® Document Research℠The information contained herein may not be copied, adapted or distributed and is not warranted to be accurate, complete or timely. The user assumes all risks for any damages or losses arising from any use of this information,except to the extent such damages or losses cannot be limited or excluded by applicable law. Past financial performance is no guarantee of future results.

Table of Contents
The following summarizes the estimated fair values of the assets acquired and liabilities assumed at the date of acquisition for the individually significantacquisition in 2016 discussed above, and all of the other 2016 acquisitions as a group ($ in millions):
Cepheid Others Total
Trade accounts receivable $ 61.4 $ 36.4 $ 97.8Inventories 165.8 39.0 204.8Property, plant and equipment 144.5 17.3 161.8Goodwill 2,584.0 477.8 3,061.8Other intangible assets, primarily customer relationships, trade names and technology 1,480.0 387.0 1,867.0In-process research and development 65.0 — 65.0Trade accounts payable (41.2) (9.5) (50.7)Other assets and liabilities, net (452.4) (65.6) (518.0)Assumed debt (1.0) — (1.0)Net assets acquired 4,006.1 882.4 4,888.5
Less: noncash consideration (8.4) — (8.4)Net cash consideration $ 3,997.7 $ 882.4 $ 4,880.1
The following summarizes the estimated fair values of the assets acquired and liabilities assumed at the date of acquisition for the individually significantacquisition in 2015 discussed above, and all of the other 2015 acquisitions as a group ($ in millions):
Pall Others Total
Trade accounts receivable $ 509.7 $ 80.7 $ 590.4Inventories 475.5 46.4 521.9Property, plant and equipment 713.4 26.6 740.0Goodwill 9,556.2 284.8 9,841.0Other intangible assets, primarily customer relationships, trade names and technology 4,798.0 247.3 5,045.3Trade accounts payable (155.8) (26.2) (182.0)Other assets and liabilities, net (1,855.2) 10.7 (1,844.5)Assumed debt (416.9) (0.1) (417.0)Net assets acquired 13,624.9 670.2 14,295.1
Less: noncash consideration (47.3) — (47.3)Net cash consideration $ 13,577.6 $ 670.2 $ 14,247.8
During 2016, primarily in connection with the Cepheid Acquisition, the Company incurred $61 million of pretax transaction-related costs, primarily bankingfees, legal fees, amounts paid to other third-party advisers and change in control costs. In addition, the Company’s earnings for 2016 reflect the impact ofadditional pretax charges of $23 million associated with fair value adjustments to acquired inventory and deferred revenue primarily related to the CepheidAcquisition.
During 2015, in connection with the Pall Acquisition, the Company incurred $47 million of pretax transaction-related costs, primarily banking fees, legalfees, amounts paid to other third-party advisers and change in control costs as well as $11 million of a pretax curtailment gain resulting from the Companyfreezing and discontinuing all future accruals to the Pall pension plan, which necessitated a remeasurement of the plan obligations. In addition, theCompany’s earnings for 2015 reflect the impact of additional pretax charges of $91 million associated with fair value adjustments to acquired inventory anddeferred revenue related to the Pall Acquisition and $20 million associated with fair value adjustments to acquired inventory related to the 2014 acquisitionof Nobel Biocare Holding AG.
Transaction-related costs and acquisition-related fair value adjustments attributable to other acquisitions were not material for the years ended December 31,2017, 2016, and 2015.
74
Source: DANAHER CORP /DE/, 10-K, February 21, 2018 Powered by Morningstar® Document Research℠The information contained herein may not be copied, adapted or distributed and is not warranted to be accurate, complete or timely. The user assumes all risks for any damages or losses arising from any use of this information,except to the extent such damages or losses cannot be limited or excluded by applicable law. Past financial performance is no guarantee of future results.

Table of Contents
Acquisition of Noncontrolling Interest
In the first quarter of 2017, Danaher acquired the remaining noncontrolling interest associated with one of its prior business combinations for considerationof $64 million. Danaher recorded the increase in ownership interests as a transaction within stockholders’ equity. As a result of thistransaction, noncontrolling interests were reduced by $63 million reflecting the carrying value of the interest with the $1 million difference charged toadditional paid-in capital.
Pro Forma Financial Information (Unaudited)
The unaudited pro forma information for the periods set forth below gives effect to the 2017 and 2016 acquisitions as if they had occurred as of January 1,2016. The pro forma information is presented for informational purposes only and is not necessarily indicative of the results of operations that actually wouldhave been achieved had the acquisitions been consummated as of that time ($ in millions except per share amounts):
2017 2016
Sales $ 18,433.8 $ 17,660.4Net earnings from continuing operations 2,467.8 2,072.7Diluted net earnings per share from continuing operations 3.50 2.96
The 2016 unaudited pro forma revenue and earnings set forth above include the impact of the $23 million of fair value adjustments to acquired inventory anddeferred revenue, primarily related to the Cepheid Acquisition.
In addition, the acquisition-related transaction costs and change in control payments of approximately $61 million in 2016 associated with the CepheidAcquisition were excluded from pro forma earnings in 2016.
NOTE 3. DISCONTINUED OPERATIONSFortive Corporation SeparationOn July 2, 2016 (the “Distribution Date”), Danaher completed the separation (the “Separation”) of its former Test & Measurement segment, IndustrialTechnologies segment (excluding the product identification businesses) and retail/commercial petroleum business by distributing to Danaher stockholderson a pro rata basis all of the issued and outstanding common stock of Fortive Corporation (“Fortive”), the entity Danaher incorporated to hold suchbusinesses. To effect the Separation, Danaher distributed to its stockholders one share of Fortive common stock for every two shares of Danaher commonstock outstanding as of June 15, 2016, the record date for the distribution. Fractional shares of Fortive common stock that otherwise would have beendistributed were aggregated and sold into the public market and the proceeds distributed to Danaher stockholders.
In preparation for the Separation, in June 2016 Fortive issued approximately $3.4 billion in debt securities (refer to Note 9). The proceeds from theseborrowings were used to fund the approximately $3.0 billion net cash distributions Fortive made to Danaher prior to the Distribution Date (“FortiveDistribution”). Danaher used a portion of the cash distribution proceeds to repay the $500 million aggregate principal amount of 2.3% senior unsecured notesthat matured in June 2016 and to redeem approximately $1.9 billion in aggregate principal amount of outstanding indebtedness in August 2016 (consistingof the Company’s 5.625% senior unsecured notes due 2018, 5.4% senior unsecured notes due 2019 and 3.9% senior unsecured notes due 2021, collectivelythe “Redeemed Notes”). Danaher also paid an aggregate of $188 million in make-whole premiums in connection with the August 2016 redemptions, plusaccrued and unpaid interest. The Company used the balance of the Fortive Distribution to fund certain of the Company’s regular, quarterly cash dividends toshareholders.
The accounting requirements for reporting the Separation of Fortive as a discontinued operation were met when the Separation was completed. Accordingly,the accompanying Consolidated Financial Statements for all periods presented reflect this business as a discontinued operation. The Company allocated aportion of the consolidated interest expense and income to discontinued operations based on the ratio of the discontinued business’ net assets to theCompany’s consolidated net assets. Fortive had revenues of approximately $3.0 billion in 2016 prior to the Separation and approximately $6.2 billion in2015.
As a result of the Separation, the Company incurred $48 million in Separation-related costs during the year ended December 31, 2016 which are included inearnings from discontinued operations, net of income taxes in the accompanying Consolidated Statement of Earnings. These Separation costs primarily relateto professional fees associated with preparation of regulatory filings and Separation activities within finance, tax, legal and information system functions aswell as certain investment banking fees incurred upon the Separation.
75
Source: DANAHER CORP /DE/, 10-K, February 21, 2018 Powered by Morningstar® Document Research℠The information contained herein may not be copied, adapted or distributed and is not warranted to be accurate, complete or timely. The user assumes all risks for any damages or losses arising from any use of this information,except to the extent such damages or losses cannot be limited or excluded by applicable law. Past financial performance is no guarantee of future results.

Table of Contents
In connection with the Separation, Danaher and Fortive entered into various agreements to effect the Separation and provide a framework for theirrelationship after the Separation, including a transition services agreement, an employee matters agreement, a tax matters agreement, an intellectual propertymatters agreement and a Danaher Business System (“DBS”) license agreement. These agreements provide for the allocation between Danaher and Fortive ofassets, employees, liabilities and obligations (including investments, property and employee benefits and tax-related assets and liabilities) attributable toperiods prior to, at and after Fortive’s separation from Danaher and govern certain relationships between Danaher and Fortive after the Separation. In addition,Danaher is also party to various commercial agreements with Fortive entities. The amount billed for transition services provided under the above agreementsas well as sales and purchases to and from Fortive were not material to the Company’s results of operations for the years ended December 31, 2017 and 2016.
In 2017, Danaher recorded a $22 million income tax benefit related to the release of previously provided reserves associated with uncertain tax positions oncertain Danaher tax returns which were jointly filed with Fortive entities. These reserves were released due to the expiration of statutes of limitations for thosereturns. All Fortive entity-related balances were included in the income tax benefit related to discontinued operations.
Communications Business Split-off
In July 2015, the Company consummated the split-off of the majority of its former communications business to Danaher shareholders who elected toexchange Danaher shares for ownership interests in the communications business, and the subsequent merger of the communications business with asubsidiary of NetScout Systems, Inc. (“NetScout”). Danaher shareholders who participated in the exchange offer tendered 26 million shares of Danahercommon stock (approximately $2.3 billion on the date of tender) and received 62.5 million shares of NetScout common stock which representedapproximately 60% of the shares of NetScout common stock outstanding following the combination.
The accounting requirements for reporting the disposition of the communications business as a discontinued operation were met when the split-off andmerger were completed. Accordingly, the accompanying Consolidated Financial Statements for all periods presented reflect this business as discontinuedoperations. The Company allocated a portion of the consolidated interest expense to discontinued operations based on the ratio of the discontinued business’net assets to the Company’s consolidated net assets. The Company recorded an aggregate after-tax gain on the disposition of this business of $767 million(including $6 million in related income tax benefits), or $1.08 per diluted share, in its 2015 results in connection with the closing of this transactionrepresenting the value of the 26 million shares of Company common stock tendered for the communications business in excess of the carrying value of thebusiness’ net assets. The communications business had revenues of $346 million in 2015 prior to the disposition.
The key components of income from both the Fortive and communications businesses from discontinued operations for the years ended December 31 were asfollows ($ in millions):
2017 2016 2015
Sales $ — $ 3,029.8 $ 6,524.5Cost of sales — (1,566.4) (3,285.1)Selling, general and administrative expenses — (696.0) (1,458.9)Research and development expenses — (190.4) (457.6)Interest expense — (19.7) (24.8)Interest income — — 0.7Income from discontinued operations before income taxes — 557.3 1,298.8Gain on disposition of discontinued operations before income taxes — — 760.5Earnings from discontinued operations before income taxes — 557.3 2,059.3Income taxes 22.3 (157.0) (448.6)Earnings from discontinued operations, net of income taxes $ 22.3 $ 400.3 $ 1,610.7
76
Source: DANAHER CORP /DE/, 10-K, February 21, 2018 Powered by Morningstar® Document Research℠The information contained herein may not be copied, adapted or distributed and is not warranted to be accurate, complete or timely. The user assumes all risks for any damages or losses arising from any use of this information,except to the extent such damages or losses cannot be limited or excluded by applicable law. Past financial performance is no guarantee of future results.

Table of Contents
NOTE 4. INVENTORIESThe classes of inventory as of December 31 are summarized as follows ($ in millions):
2017 2016
Finished goods $ 982.5 $ 884.4Work in process 309.7 299.4Raw materials 548.6 525.6Total $ 1,840.8 $ 1,709.4
As of December 31, 2017 and 2016, the difference between inventories valued at LIFO and the value of that same inventory if the FIFO method had beenused was not significant. The liquidation of LIFO inventory did not have a significant impact on the Company’s results of operations in any period presented.
NOTE 5. PROPERTY, PLANT AND EQUIPMENTThe classes of property, plant and equipment as of December 31 are summarized as follows ($ in millions):
2017 2016
Land and improvements $ 155.6 $ 150.5Buildings 1,009.5 880.9Machinery and equipment 2,239.5 1,953.9Customer-leased instruments 1,569.4 1,332.0Gross property, plant and equipment 4,974.0 4,317.3
Less: accumulated depreciation (2,519.4) (1,963.3)Property, plant and equipment, net $ 2,454.6 $ 2,354.0
NOTE 6. GOODWILL AND OTHER INTANGIBLE ASSETSAs discussed in Note 2, goodwill arises from the purchase price for acquired businesses exceeding the fair value of tangible and intangible assets acquiredless assumed liabilities and noncontrolling interests. Management assesses the goodwill of each of its reporting units for impairment at least annually at thebeginning of the fourth quarter and as “triggering” events occur that indicate that it is more likely than not that an impairment exists. The Company electedto bypass the optional qualitative goodwill assessment allowed by applicable accounting standards and performed a quantitative impairment test for allreporting units as this was determined to be the most effective method to assess for impairment across a large spectrum of reporting units.
The Company estimates the fair value of its reporting units primarily using a market approach, based on current trading multiples of earnings before interest,taxes, depreciation and amortization (“EBITDA”) for companies operating in businesses similar to each of the Company’s reporting units, in addition torecent available market sale transactions of comparable businesses. In certain circumstances the Company also estimates fair value utilizing a discountedcash flow analysis (i.e., an income approach) in order to validate the results of the market approach. If the estimated fair value of the reporting unit is less thanits carrying value, the Company must perform additional analysis to determine if the reporting unit’s goodwill has been impaired.
As of December 31, 2017, the Company had eight reporting units for goodwill impairment testing. As of the date of the 2017 annual impairment test, thecarrying value of the goodwill included in each individual reporting unit ranged from $509 million to approximately $12.2 billion. No goodwill impairmentcharges were recorded for the years ended December 31, 2017, 2016 and 2015 and no “triggering” events have occurred subsequent to the performance of the2017 annual impairment test. The factors used by management in its impairment analysis are inherently subject to uncertainty. If actual results are notconsistent with management’s estimates and assumptions, goodwill and other intangible assets may be overstated and a charge would need to be takenagainst net earnings.
77
Source: DANAHER CORP /DE/, 10-K, February 21, 2018 Powered by Morningstar® Document Research℠The information contained herein may not be copied, adapted or distributed and is not warranted to be accurate, complete or timely. The user assumes all risks for any damages or losses arising from any use of this information,except to the extent such damages or losses cannot be limited or excluded by applicable law. Past financial performance is no guarantee of future results.

Table of Contents
The following is a rollforward of the Company’s goodwill by segment ($ in millions):
Life
Sciences Diagnostics Dental Environmental &Applied Solutions Total
Balance, January 1, 2016 $ 11,308.5 $ 4,387.4 $ 3,236.1 $ 2,082.9 $ 21,014.9Attributable to 2016 acquisitions 438.6 2,590.5 4.2 28.5 3,061.8Adjustments due to finalization of purchaseprice allocations 89.7 (a) (2.2) — 5.1 92.6Foreign currency translation and other (226.5) (72.7) (24.7) (18.5) (342.4)
Balance, December 31, 2016 11,610.3 6,903.0 3,215.6 2,098.0 23,826.9Attributable to 2017 acquisitions 95.5 2.8 169.3 267.6Adjustments due to finalization of purchaseprice allocations (19.1) (39.6) (b) 8.8 — (49.9)Foreign currency translation and other 648.8 216.1 142.8 86.3 1,094.0
Balance, December 31, 2017 $ 12,335.5 $ 7,079.5 $ 3,370.0 $ 2,353.6 $ 25,138.6(a) This adjustment is primarily related to finalization of the Pall purchase price allocations.(b) This adjustment is primarily related to finalization of the Cepheid purchase price allocations.
Finite-lived intangible assets are amortized over their legal or estimated useful life. The following summarizes the gross carrying value and accumulatedamortization for each major category of intangible asset as of December 31 ($ in millions):
2017 2016
GrossCarryingAmount
AccumulatedAmortization
GrossCarryingAmount
AccumulatedAmortization
Finite-lived intangibles: Patents and technology $ 2,363.5 $ (783.7) $ 2,211.3 $ (618.5)Customer relationships and other intangibles 7,354.9 (2,217.6) 6,990.9 (1,627.1)
Total finite-lived intangibles 9,718.4 (3,001.3) 9,202.2 (2,245.6)Indefinite-lived intangibles:
Trademarks and trade names 4,950.0 — 4,861.4 —Total intangibles $ 14,668.4 $ (3,001.3) $ 14,063.6 $ (2,245.6)
During 2017, the Company acquired finite-lived intangible assets, consisting primarily of customer relationships, with a weighted average life of nine years.Refer to Note 2 for additional information on the intangible assets acquired.
Total intangible amortization expense in 2017, 2016 and 2015 was $661 million, $583 million and $397 million, respectively. Based on the intangibleassets recorded as of December 31, 2017, amortization expense is estimated to be $682 million during 2018, $675 million during 2019, $669 million during2020, $656 million during 2021 and $637 million during 2022.
NOTE 7. FAIR VALUE MEASUREMENTSAccounting standards define fair value based on an exit price model, establish a framework for measuring fair value where the Company’s assets andliabilities are required to be carried at fair value and provide for certain disclosures related to the valuation methods used within a valuation hierarchy asestablished within the accounting standards. This hierarchy prioritizes the inputs into three broad levels as follows. Level 1 inputs are quoted prices(unadjusted) in active markets for identical assets or liabilities. Level 2 inputs are quoted prices for similar assets and liabilities in active markets, quotedprices for identical or similar assets in markets that are not active, or other observable characteristics for the asset or liability, including interest rates, yieldcurves and credit risks, or inputs that are derived principally from, or corroborated by, observable market data through correlation. Level 3 inputs areunobservable inputs based on the Company’s assumptions. A financial asset or liability’s classification within the hierarchy is determined based on thelowest level input that is significant to the fair value measurement in its entirety.
78
Source: DANAHER CORP /DE/, 10-K, February 21, 2018 Powered by Morningstar® Document Research℠The information contained herein may not be copied, adapted or distributed and is not warranted to be accurate, complete or timely. The user assumes all risks for any damages or losses arising from any use of this information,except to the extent such damages or losses cannot be limited or excluded by applicable law. Past financial performance is no guarantee of future results.

Table of Contents
A summary of financial assets and liabilities that are measured at fair value on a recurring basis were as follows ($ in millions):
Quoted Prices inActive Market
(Level 1)
Significant OtherObservable Inputs
(Level 2)
SignificantUnobservable
Inputs (Level 3) Total
December 31, 2017: Assets:
Available-for-sale securities $ — $ 45.4 $ — $ 45.4Liabilities:
Deferred compensation plans — 62.9 — 62.9December 31, 2016:
Assets: Available-for-sale securities $ 117.8 $ 52.3 $ — $ 170.1
Liabilities: Deferred compensation plans — 52.2 — 52.2
Available-for-sale securities, which are included in other long-term assets in the accompanying Consolidated Balance Sheets, are either measured at fair valueusing quoted market prices in an active market or if they are not traded on an active market are valued at quoted prices reported by investment brokers anddealers based on the underlying terms of the security and comparison to similar securities traded on an active market. As of December 31, 2017, available-for-sale securities primarily include U.S. Treasury Notes and corporate debt securities, which are valued based on the terms of the instruments in comparison withsimilar terms on the active market.
The Company has established nonqualified deferred compensation programs that permit officers, directors and certain management employees to defer aportion of their compensation, on a pretax basis, until after their termination of employment (or board service, as applicable). All amounts deferred under suchplans are unfunded, unsecured obligations of the Company and are presented as a component of the Company’s compensation and benefits accrual includedin other long-term liabilities in the accompanying Consolidated Balance Sheets (refer to Note 8). Participants may choose among alternative earnings ratesfor the amounts they defer, which are primarily based on investment options within the Company’s 401(k) program (except that the earnings rates foramounts deferred by the Company’s directors and amounts contributed unilaterally by the Company are entirely based on changes in the value of theCompany’s common stock). Changes in the deferred compensation liability under these programs are recognized based on changes in the fair value of theparticipants’ accounts, which are based on the applicable earnings rates.
Fair Value of Financial Instruments
The carrying amounts and fair values of the Company’s financial instruments as of December 31 were as follows ($ in millions):
2017 2016
CarryingAmount Fair Value
CarryingAmount Fair Value
Assets: Available-for-sale securities $ 45.4 $ 45.4 $ 170.1 $ 170.1
Liabilities: Short-term borrowings 194.7 194.7 2,594.8 2,594.8Long-term borrowings 10,327.4 10,847.1 9,674.2 10,095.1
As of December 31, 2017 and 2016, available-for-sale securities were categorized as Level 1 and Level 2, as indicated above, and short and long-termborrowings were categorized as Level 1.
The fair value of long-term borrowings was based on quoted market prices. The difference between the fair value and the carrying amounts of long-termborrowings (other than the Company’s Liquid Yield Option Notes due 2021 (the “LYONs”)) is attributable to changes in market interest rates and/or theCompany’s credit ratings subsequent to the incurrence of the borrowing. In the case of the LYONs, differences in the fair value from the carrying value areattributable to changes in the price of the Company’s common stock due to the LYONs’ conversion features. The fair values of borrowings with original
79
Source: DANAHER CORP /DE/, 10-K, February 21, 2018 Powered by Morningstar® Document Research℠The information contained herein may not be copied, adapted or distributed and is not warranted to be accurate, complete or timely. The user assumes all risks for any damages or losses arising from any use of this information,except to the extent such damages or losses cannot be limited or excluded by applicable law. Past financial performance is no guarantee of future results.

Table of Contents
maturities of one year or less, as well as cash and cash equivalents, trade accounts receivable, net and trade accounts payable approximate their carryingamounts due to the short-term maturities of these instruments.
Refer to Note 10 for information related to the fair value of the Company sponsored defined benefit pension plan assets.
NOTE 8. ACCRUED EXPENSES AND OTHER LIABILITIESAccrued expenses and other liabilities as of December 31 were as follows ($ in millions):
2017 2016
Current Noncurrent Current Noncurrent
Compensation and benefits $ 961.0 $ 236.2 $ 914.1 $ 247.1Pension and postretirement benefits 95.8 1,052.0 91.7 1,222.9Taxes, income and other 386.4 3,543.6 293.9 3,894.1Deferred revenue 666.0 104.9 539.8 92.7Sales and product allowances 155.7 2.0 144.1 2.0Other 822.8 222.4 810.6 211.5Total $ 3,087.7 $ 5,161.1 $ 2,794.2 $ 5,670.3
80
Source: DANAHER CORP /DE/, 10-K, February 21, 2018 Powered by Morningstar® Document Research℠The information contained herein may not be copied, adapted or distributed and is not warranted to be accurate, complete or timely. The user assumes all risks for any damages or losses arising from any use of this information,except to the extent such damages or losses cannot be limited or excluded by applicable law. Past financial performance is no guarantee of future results.

Table of Contents
NOTE 9. FINANCINGThe components of the Company’s debt as of December 31 were as follows ($ in millions):
2017 2016
U.S. dollar-denominated commercial paper $ 436.9 $ 2,733.5Euro-denominated commercial paper (€1.7 billion and €3.0 billion, respectively) 1,993.9 3,127.6Floating rate senior unsecured notes due 2017 (€500.0 million aggregate principal amount) (the “2017Euronotes”) — 526.00.0% senior unsecured bonds due 2017 (CHF 100.0 million aggregate principal amount) (the “2017 CHF Bonds”) — 98.01.65% senior unsecured notes due 2018 (the “2018 U.S. Notes”) 499.2 498.11.0% senior unsecured notes due 2019 (€600.0 million aggregate principal amount) (the “2019 Euronotes”) 718.4 628.62.4% senior unsecured notes due 2020 (the “2020 U.S. Notes”) 497.7 496.85.0% senior unsecured notes due 2020 (the “2020 Assumed Pall Notes”) 394.6 402.6Zero-coupon LYONs due 2021 69.1 68.10.352% senior unsecured notes due 2021 (¥30.0 billion aggregate principal amount) (the “2021 Yen Notes”) 265.5 255.61.7% senior unsecured notes due 2022 (€800.0 million aggregate principal amount) (the “2022 Euronotes”) 955.6 836.5Floating rate senior unsecured notes due 2022 (€250.0 million aggregate principal amount) (the "Floating Rate2022 Euronotes") 299.1 —0.5% senior unsecured bonds due 2023 (CHF 540.0 million aggregate principal amount) (the “2023 CHF Bonds”) 555.5 532.32.5% senior unsecured notes due 2025 (€800.0 million aggregate principal amount) (the “2025 Euronotes”) 955.6 836.83.35% senior unsecured notes due 2025 (the “2025 U.S. Notes”) 496.3 495.80.3% senior unsecured notes due 2027 (¥30.8 billion aggregate principal amount) (the “2027 Yen Notes”) 272.2 —1.2% senior unsecured notes due 2027 (€600.0 million aggregate principal amount) (the “2027 Euronotes”) 714.1 —1.125% senior unsecured bonds due 2028 (CHF 210.0 million and CHF 110.0 million, respectively, aggregateprincipal amount) (the “2028 CHF Bonds”) 220.3 108.80.65% senior unsecured notes due 2032 (¥53.2 billion aggregate principal amount) (the “2032 Yen Notes”) 470.2 —4.375% senior unsecured notes due 2045 (the “2045 U.S. Notes”) 499.3 499.3Other 208.6 124.6Total debt 10,522.1 12,269.0
Less: currently payable 194.7 2,594.8Long-term debt $ 10,327.4 $ 9,674.2
Debt discounts, premiums and debt issuance costs totaled $25 million as of both December 31, 2017 and 2016, and have been netted against the aggregateprincipal amounts of the related debt in the components of debt table above.
Commercial Paper Programs and Credit Facilities
In 2015, the Company entered into a $4.0 billion unsecured multiyear revolving credit facility with a syndicate of banks that expires on July 10, 2020,subject to a one-year extension option at the request of the Company with the consent of the lenders (the “Credit Facility”). In 2016, the Company alsoentered into a $3.0 billion 364-day unsecured revolving credit facility with a syndicate of banks that expired in October 2017 (the “364-Day Facility”), toprovide additional liquidity support for issuances under the Company’s U.S. and euro-denominated commercial paper programs. The increase in the size ofthe Company’s commercial paper programs provided necessary capacity for the Company to use proceeds from the issuance of commercial paper to fund thepurchase price for the Cepheid acquisition. No borrowings were outstanding under the 364-Day Facility at any time, nor under the Credit Facility at any timefrom inception through December 31, 2017.
81
Source: DANAHER CORP /DE/, 10-K, February 21, 2018 Powered by Morningstar® Document Research℠The information contained herein may not be copied, adapted or distributed and is not warranted to be accurate, complete or timely. The user assumes all risks for any damages or losses arising from any use of this information,except to the extent such damages or losses cannot be limited or excluded by applicable law. Past financial performance is no guarantee of future results.

Table of Contents
Under the Company’s U.S. and euro-denominated commercial paper programs, the Company or a subsidiary of the Company, as applicable, may issue andsell unsecured, short-term promissory notes. The notes are typically issued at a discount from par, generally based on the ratings assigned to the Company bycredit rating agencies at the time of the issuance and prevailing market rates measured by reference to LIBOR or EURIBOR. The Credit Facility providesliquidity support for issuances under the Company’s commercial paper programs, and can also be used for working capital and other general corporatepurposes. The availability of the Credit Facility as a standby liquidity facility to repay maturing commercial paper is an important factor in maintaining theexisting credit ratings of the Company’s commercial paper programs. The Company expects to limit any borrowings under the Credit Facility to amounts thatwould leave sufficient available borrowing capacity under such facility to allow the Company to borrow, if needed, to repay all of the outstandingcommercial paper as it matures. As commercial paper obligations mature, the Company may issue additional short-term commercial paper obligations torefinance all or part of these borrowings. As of December 31, 2017, borrowings outstanding under the Company’s U.S. and euro commercial paper programshad a weighted average annual interest rate of less than one basis point and a weighted average remaining maturity of approximately 50 days. The Companyhas classified approximately $2.4 billion of its borrowings outstanding under the commercial paper programs as well as the $500 million of the 2018 U.S.Notes as of December 31, 2017 as long-term debt in the accompanying Consolidated Balance Sheet as the Company had the intent and ability, as supportedby availability under the Credit Facility referenced above, to refinance these borrowings for at least one year from the balance sheet date.
Under the Credit Facility, borrowings (other than bid loans under the Credit Facility) bear interest at a rate equal to (at the Company’s option) either (1) aLIBOR-based rate (the “LIBOR-Based Rate”), or (2) the highest of (a) the Federal funds rate plus 0.5%, (b) the prime rate and (c) the LIBOR-Based Rate plus1%, plus a specified margin that varies according to the Company’s long-term debt credit rating. In addition to certain initial fees the Company paid withrespect to the Credit Facility at inception of the facility, the Company is obligated to pay an annual commitment or facility fee under the Credit Facility thatvaries according to the Company’s long-term debt credit rating. The Credit Facility requires the Company to maintain a consolidated leverage ratio (asdefined in the respective facility) of 0.65 to 1.00 or less, and also contains customary representations, warranties, conditions precedent, events of default,indemnities and affirmative and negative covenants. As of December 31, 2017, no borrowings were outstanding under the Credit Facility and the Companywas in compliance with all covenants under the facility. The nonperformance by any member of the Credit Facility syndicate would reduce the maximumcapacity of the Credit Facility by such member’s commitment amount.
The Company’s ability to access the commercial paper market, and the related costs of these borrowings, is affected by the strength of the Company’s creditrating and market conditions. Any downgrade in the Company’s credit rating would increase the cost of borrowings under the Company’s commercial paperprogram and the Credit Facility, and could limit or preclude the Company’s ability to issue commercial paper. If the Company’s access to the commercialpaper market is adversely affected due to a credit downgrade, change in market conditions or otherwise, the Company expects it would rely on a combinationof available cash, operating cash flow and the Credit Facility to provide short-term funding. In such event, the cost of borrowings under the Credit Facilitycould be higher than the cost of commercial paper borrowings.
In addition to the Credit Facility, the Company has also entered into reimbursement agreements with various commercial banks to support the issuance ofletters of credit.
82
Source: DANAHER CORP /DE/, 10-K, February 21, 2018 Powered by Morningstar® Document Research℠The information contained herein may not be copied, adapted or distributed and is not warranted to be accurate, complete or timely. The user assumes all risks for any damages or losses arising from any use of this information,except to the extent such damages or losses cannot be limited or excluded by applicable law. Past financial performance is no guarantee of future results.

Table of Contents
Long-Term Indebtedness
The following summarizes the key terms for the Company’s long-term debt as of December 31, 2017:
OutstandingBalance as ofDecember 31,
2017 Stated AnnualInterest Rate
Issue Price (as %of Principal
Amount) Issue Date Maturity Date Interest Payment Dates
(in arrears)2018 U.S. Notes (3) $ 499.2
1.65%
99.866%
September 15, 2015
September 15, 2018
March 15 and September
152019 Euronotes (1) 718.4 1.0% 99.696% July 8, 2015 July 8, 2019 July 82020 U.S. Notes (3) 497.7
2.4%
99.757%
September 15, 2015
September 15, 2020
March 15 and September
152020 Assumed Pall Notes(5)
394.6
5.0%
not applicable
not applicable
June 15, 2020
June 15 and December 15
2021 LYONs 69.1 see below not applicable January 22, 2001 January 22, 2021 January 22 and July 222021 Yen Notes (4) 265.5 0.352% 100% February 28, 2016 March 16, 2021 September 162022 Euronotes (1) 955.6 1.7% 99.651% July 8, 2015 January 4, 2022 January 4Floating Rate 2022Euronotes (6)
299.1
three-monthEURIBOR +
0.3%
100.147%
June 30, 2017
June 30, 2022
March 30, June 30,September 30 and
December 312023 CHF Bonds (2) 555.5 0.5% 100.924% December 8, 2015 December 8, 2023 December 82025 Euronotes (1) 955.6 2.5% 99.878% July 8, 2015 July 8, 2025 July 82025 U.S. Notes (3) 496.3
3.35%
99.857%
September 15, 2015
September 15, 2025
March 15 and September
152027 Yen Notes (7) 272.2
0.3%
100%
May 11, 2017
May 11, 2027
May 11 and November
112027 Euronotes (6) 714.1 1.2% 99.682% June 30, 2017 June 30, 2027 June 302028 CHF Bonds (2) 220.3
1.125%
102.870%
December 8, 2015 and
December 8, 2017 December 8, 2028
December 8
2032 Yen Notes (7) 470.2
0.65%
100%
May 11, 2017
May 11, 2032
May 11 and November11
2045 U.S. Notes (3) 499.3
4.375%
99.784%
September 15, 2015
September 15, 2045
March 15 and September15
U.S. dollar and euro-denominated commercialpaper
2,430.8
various
various
various
various
various
Other 208.6 various various various various variousTotal debt $ 10,522.1
(1) The net proceeds, after underwriting discounts and commissions and offering expenses, of approximately €2.2 billion (approximately $2.4 billion based on currency exchangerates as of the date of issuance) from these notes were used to pay a portion of the purchase price for the Pall Acquisition.
(2) The net proceeds, including the related premium, and after underwriting discounts and commissions and offering expenses, of CHF 758 million ($739 million based on currencyexchange rates as of date of pricing) from these bonds were used to repay a portion of the commercial paper issued to finance the Pall Acquisition and the 2017 CHF Bonds.
(3) The net proceeds, after underwriting discounts and commissions and offering expenses, of approximately $2.0 billion from these notes were used to repay a portion of thecommercial paper issued to finance the Pall Acquisition.
(4) The net proceeds, after offering expenses, of approximately ¥29.9 billion ($262 million based on currency exchange rates as of the date of issuance) from these notes were usedto repay a portion of the commercial paper borrowings issued to finance the Pall Acquisition.
(5) In connection with the Pall Acquisition, the Company acquired senior unsecured notes previously issued by Pall with an aggregate principal amount of $375 million. Inaccordance with accounting for business combinations, the Assumed Pall Notes were recorded at their fair value of $417 million on the date of acquisition and for accountingpurposes, interest charges on these notes recorded in the Company’s Consolidated Statement of Earnings reflect an effective interest rate of approximately 2.9% per year.
(6) The net proceeds at issuance, after offering expenses, of €843 million ($940 million based on currency exchange rates as of the date of pricing) from these notes were used topartially repay commercial paper borrowings.
(7) The net proceeds at issuance, after offering expenses, of approximately ¥83.6 billion ($744 million based on currency exchange rates as of the date of pricing) from these noteswere used to partially repay commercial paper borrowings.
83
Source: DANAHER CORP /DE/, 10-K, February 21, 2018 Powered by Morningstar® Document Research℠The information contained herein may not be copied, adapted or distributed and is not warranted to be accurate, complete or timely. The user assumes all risks for any damages or losses arising from any use of this information,except to the extent such damages or losses cannot be limited or excluded by applicable law. Past financial performance is no guarantee of future results.

Table of Contents
LYONs
In 2001, the Company issued $830 million (value at maturity) in LYONs. The net proceeds to the Company were $505 million, of which approximately $100million was used to pay down debt and the balance was used for general corporate purposes, including acquisitions. The LYONs originally carry a yield tomaturity of 2.375% (with contingent interest payable as described below). Pursuant to the terms of the indenture that governs the Company’s LYONs,effective as of the record date of the distribution of the Fortive shares, the conversion ratio of the LYONs was adjusted so that each $1,000 of principalamount at maturity may be converted into 38.1998 shares of Danaher common stock at any time on or before the maturity date of January 22, 2021.
During the year ended December 31, 2017, holders of certain of the Company’s LYONs converted such LYONs into an aggregate of approximately 28thousand shares of the Company’s common stock, par value $0.01 per share. The Company’s deferred tax liability associated with the book and tax basisdifference in the converted LYONs was transferred to additional paid-in capital as a result of the conversions.
As of December 31, 2017, an aggregate of approximately 21 million shares of the Company’s common stock had been issued upon conversion of LYONs. Asof December 31, 2017, the accreted value of the outstanding LYONs was lower than the traded market value of the underlying common stock issuable uponconversion. The Company may redeem all or a portion of the LYONs for cash at any time at scheduled redemption prices.
Under the terms of the LYONs, the Company pays contingent interest to the holders of LYONs during any six-month period from January 23 to July 22 andfrom July 23 to January 22 if the average market price of a LYON for a specified measurement period equals 120% or more of the sum of the issue price andaccrued original issue discount for such LYON. The amount of contingent interest to be paid with respect to any quarterly period is equal to the higher ofeither 0.0315% of the bonds’ average market price during the specified measurement period or the amount of the cash dividend paid on Danaher’s commonstock during such quarterly period multiplied by the number of shares issuable upon conversion of a LYON. The Company paid $2 million, $1 million and$1 million of contingent interest on the LYONs for each of the years ended December 31, 2017, 2016 and 2015, respectively. Except for the contingentinterest described above, the Company will not pay interest on the LYONs prior to maturity.
Long-Term Indebtedness Related to the Fortive Separation
In June 2016, the Company received net cash distributions of approximately $3.0 billion from Fortive as consideration for the Company’s contribution ofassets to Fortive in connection with the Separation. Fortive financed these cash payments through issuance of approximately $3.4 billion of debt, consistingof $500 million aggregate principal amount of borrowings under a three-year, senior unsecured term loan facility with variable interest rates, $393 million ofcommercial paper borrowings supported by a five-year, $1.5 billion senior unsecured revolving credit facility, $300 million aggregate principal amount of1.8% senior unsecured notes due 2019, $750 million aggregate principal amount of 2.35% senior unsecured notes due 2021, $900 million aggregateprincipal amount of 3.15% senior unsecured notes due 2026 and $550 million aggregate principal amount of 4.3% senior unsecured notes due 2046(collectively, the “Fortive Debt”). Danaher initially guaranteed the Fortive Debt, and the guarantee terminated effective as of the Distribution Date. As of July2, 2016 in connection with the Separation, the Fortive Debt was transferred to Fortive and is no longer reflected in the Company’s Consolidated FinancialStatements.
Long-Term Debt Repayments
The €500 million of 2017 Euronotes were repaid upon their maturity in June 2017. The CHF 100 million of 2017 CHF Bonds were repaid upon their maturityin December 2017.
The Company used a portion of the proceeds from the Fortive Distribution to repay the $500 million aggregate principal amount of 2016 Notes that maturedin June 2016 and to redeem approximately $1.9 billion in aggregate principal amount of outstanding indebtedness in August 2016 (consisting of theRedeemed Notes). Danaher also paid an aggregate of $188 million in make-whole premiums in connection with the August 2016 redemptions, plus accruedand unpaid interest. The payment of these make-whole premiums, net of certain deferred gains of $9 million, are reflected as a loss on early extinguishment ofborrowings in the accompanying Consolidated Statements of Earnings. The Company used the balance of the cash proceeds it received from Fortive to fundcertain of the Company’s regular, quarterly cash dividends to shareholders.
The Company repaid the CHF 120 million aggregate principal amount of the 4.0% senior unsecured bonds due 2016 upon their maturity in October 2016using available cash.
84
Source: DANAHER CORP /DE/, 10-K, February 21, 2018 Powered by Morningstar® Document Research℠The information contained herein may not be copied, adapted or distributed and is not warranted to be accurate, complete or timely. The user assumes all risks for any damages or losses arising from any use of this information,except to the extent such damages or losses cannot be limited or excluded by applicable law. Past financial performance is no guarantee of future results.

Table of Contents
2017 Long-Term Debt Issuances
On May 11, 2017, DH Japan Finance S.A. (“Danaher Japan”), a wholly-owned finance subsidiary of the Company, completed the private placement of ¥30.8billion aggregate principal amount of 0.3% senior unsecured notes due May 11, 2027 (the “2027 Yen Notes”) and ¥53.2 billion aggregate principal amountof 0.65% senior unsecured notes due May 11, 2032 (the “2032 Yen Notes”). The Company received net proceeds, after offering expenses, of approximately¥83.6 billion (approximately $744 million based on currency exchange rates as of the date of the pricing of the notes) and used the net proceeds from theoffering to partially repay commercial paper borrowings. Additional details regarding these notes are set forth in the table above.
On June 30, 2017, DH Europe Finance S.A. (“Danaher International”), a wholly-owned finance subsidiary of the Company, completed the underwrittenpublic offering of €250 million aggregate principal amount of the Floating Rate 2022 Euronotes and €600 million aggregate principal amount of the 2027Euronotes. The Company received net proceeds, after underwriting discounts and commissions and offering expenses, of €843 million (approximately $940million based on currency exchange rates as of the date of the pricing of the notes) and used the net proceeds from the offering to repay the 2017 Euronotes aswell as to repay commercial paper borrowings. Additional details regarding these notes are set forth in the table above.
On December 8, 2017, DH Switzerland Finance S.A. (“Danaher Switzerland”), a wholly-owned finance subsidiary of the Company, completed theunderwritten public offering of CHF 100 million aggregate principal amount of CHF bonds. Together with the CHF 110 million aggregate principal amountof CHF bonds issued on December 8, 2015, these bonds form the “2028 CHF Bonds”. The Company received net proceeds, after underwriting discounts andcommissions and offering expenses, of CHF 104 million (approximately $105 million based on currency exchange rates as of the date of the pricing of thenotes) and used the net proceeds from the offering to repay the CHF 100 million aggregate principal amount of the 2017 CHF Bonds which matured onDecember 8, 2017. Additional details regarding these notes are set forth in the table above.
Covenants and Redemption Provisions Applicable to Notes
With respect to the 2020 Assumed Pall Notes; the 2027 and 2032 Yen Notes; the 2019, 2022, 2025 and 2027 Euronotes; and the 2018, 2020, 2025 and 2045U.S. Notes, at any time prior to the applicable maturity date (or in certain cases three months prior to the maturity date), the Company may redeem theapplicable series of notes in whole or in part, by paying the principal amount and the “make-whole” premium specified in the applicable indenture orcomparable governing document, plus accrued and unpaid interest (and in the case of the Yen Notes, net of certain swap-related gains or losses as applicable).With respect to each of the 2023 and 2028 CHF Bonds at any time after 85% or more of the applicable bonds have been redeemed or purchased and canceled,the Company may redeem some or all of the remaining bonds for their principal amount plus accrued and unpaid interest. With respect to the 2021, 2027 and2032 Yen Notes; the 2019, 2022, Floating Rate 2022, 2025 and 2027 Euronotes; and the 2023 and 2028 CHF Bonds, the Company may redeem such notesand bonds upon the occurrence of specified, adverse changes in tax laws, or interpretations under such laws, at a redemption price equal to the principalamount of the bonds to be redeemed.
If a change of control triggering event occurs with respect to any of the 2020 Assumed Pall Notes; the 2021, 2027 and 2032 Yen Notes; the 2019, 2022,Floating Rate 2022, 2025 and 2027 Euronotes; the 2018, 2020, 2025 and 2045 U.S. Notes; or the 2023 and 2028 CHF Bonds, each holder of such notes mayrequire the Company to repurchase some or all of such notes and bonds at a purchase price equal to 101% (100% in the case of the 2027 and 2032 Yen Notes)of the principal amount of the notes and bonds, plus accrued and unpaid interest (and in the case of the Yen Notes, certain swap-related losses as applicable).A change of control triggering event means the occurrence of both a change of control and a rating event, each as defined in the applicable indenture orcomparable governing document. Except in connection with a change of control triggering event, the Company does not have any credit rating downgradetriggers that would accelerate the maturity of a material amount of outstanding debt. Each holder of the 2027 and 2032 Yen Notes may also require theCompany to repurchase some or all of its notes at a purchase price equal to 100% of the principal amount of the notes, plus accrued and unpaid interest andcertain swap-related losses as applicable, in certain circumstances whereby such holder comes into violation of economic sanctions laws as a result of holdingsuch notes.
The respective indentures or comparable governing documents under which the above-described notes and bonds were issued contain customary covenantsincluding, for example, limits on the incurrence of secured debt and sale/leaseback transactions. None of these covenants are considered restrictive to theCompany’s operations and as of December 31, 2017, the Company was in compliance with all of its debt covenants.
85
Source: DANAHER CORP /DE/, 10-K, February 21, 2018 Powered by Morningstar® Document Research℠The information contained herein may not be copied, adapted or distributed and is not warranted to be accurate, complete or timely. The user assumes all risks for any damages or losses arising from any use of this information,except to the extent such damages or losses cannot be limited or excluded by applicable law. Past financial performance is no guarantee of future results.

Table of Contents
Guarantors of Debt
Danaher has guaranteed long-term debt and commercial paper issued by certain of its wholly-owned subsidiaries. The 2019, 2022, Floating Rate 2022, 2025and 2027 Euronotes were issued by Danaher International. The 2017, 2023 and 2028 CHF Bonds were issued by Danaher Switzerland. The 2021, 2027 and2032 Yen Notes were issued by Danaher Japan. Each of Danaher International, Danaher Switzerland and Danaher Japan are wholly-owned financesubsidiaries of Danaher Corporation. All of the securities issued by each of these entities, as well as the 2020 Assumed Pall Notes, are fully andunconditionally guaranteed by the Company and these guarantees rank on parity with the Company’s unsecured and unsubordinated indebtedness.
Other
The Company’s minimum principal payments for the next five years are as follows ($ in millions):
2018 $ 194.72019 1,214.02020 3,321.12021 332.92022 1,258.1Thereafter 4,201.3
The Company made interest payments of $130 million, $212 million and $126 million in 2017, 2016 and 2015, respectively.
NOTE 10. PENSION BENEFIT PLANSThe Company has noncontributory defined benefit pension plans which cover certain of its U.S. employees. During 2012, all remaining benefit accrualsunder the U.S. plans ceased. Defined benefit plans from acquisitions subsequent to 2012 are ceased as soon as practical. The Company also hasnoncontributory defined benefit pension plans which cover certain of its non-U.S. employees, and under certain of these plans, benefit accruals continue. Ingeneral, the Company’s policy is to fund these plans based on considerations relating to legal requirements, underlying asset returns, the plan’s funded status,the anticipated tax deductibility of the contribution, local practices, market conditions, interest rates and other factors.
86
Source: DANAHER CORP /DE/, 10-K, February 21, 2018 Powered by Morningstar® Document Research℠The information contained herein may not be copied, adapted or distributed and is not warranted to be accurate, complete or timely. The user assumes all risks for any damages or losses arising from any use of this information,except to the extent such damages or losses cannot be limited or excluded by applicable law. Past financial performance is no guarantee of future results.

Table of Contents
The following sets forth the funded status of the U.S. and non-U.S. plans as of the most recent actuarial valuations using measurement dates of December 31($ in millions):
U.S. Pension Benefits Non-U.S. Pension Benefits
2017 2016 2017 2016
Change in pension benefit obligation: Benefit obligation at beginning of year $ 2,558.1 $ 2,603.9 $ 1,493.0 $ 1,449.3Service cost 7.3 9.0 32.7 36.4Interest cost 82.3 89.7 25.5 32.8Employee contributions — — 8.2 8.6Benefits and other expenses paid (181.8) (204.8) (58.3) (48.4)Acquisitions and other — (7.4) — —Actuarial loss (gain) 139.9 67.7 (51.4) 174.1Amendments, settlements and curtailments 7.1 — (10.5) (25.9)Foreign exchange rate impact — — 132.6 (133.9)Benefit obligation at end of year 2,612.9 2,558.1 1,571.8 1,493.0
Change in plan assets: Fair value of plan assets at beginning of year 1,868.2 1,892.6 1,042.9 1,025.9Actual return on plan assets 265.3 122.7 74.6 134.3Employer contributions 53.2 57.7 44.7 43.5Employee contributions — — 8.2 8.6Amendments and settlements — — (3.7) (7.3)Benefits and other expenses paid (181.8) (204.8) (58.3) (48.4)Foreign exchange rate impact — — 90.9 (113.7)Fair value of plan assets at end of year 2,004.9 1,868.2 1,199.3 1,042.9
Funded status $ (608.0) $ (689.9) $ (372.5) $ (450.1)
Weighted average assumptions used to determine benefit obligations at date of measurement:
U.S. Plans Non-U.S. Plans
2017 2016 2017 2016
Discount rate 3.6% 4.1% 1.8% 1.8%Rate of compensation increase 4.0% 4.0% 2.2% 2.9%
Components of net periodic pension cost (benefit):
U.S. Pension Benefits Non-U.S. Pension Benefits
($ in millions) 2017 2016 2017 2016
Service cost $ 7.3 $ 9.0 $ 32.7 $ 36.4Interest cost 82.3 89.7 25.5 32.8Expected return on plan assets (130.5) (132.6) (42.4) (40.2)Amortization of prior service credit — — (0.3) (0.3)Amortization of net loss 24.9 24.6 7.8 7.8Curtailment and settlement gains recognized — (0.7) (0.5) (0.3)Net periodic pension (benefit) cost $ (16.0) $ (10.0) $ 22.8 $ 36.2
Net periodic pension (benefits) costs are included in cost of sales and selling, general and administrative expenses in the accompanying ConsolidatedStatements of Earnings. As discussed in Note 1, beginning in 2018 only the service cost component of net periodic pension cost will be included in cost ofsales and selling, general and administrative expenses in the
87
Source: DANAHER CORP /DE/, 10-K, February 21, 2018 Powered by Morningstar® Document Research℠The information contained herein may not be copied, adapted or distributed and is not warranted to be accurate, complete or timely. The user assumes all risks for any damages or losses arising from any use of this information,except to the extent such damages or losses cannot be limited or excluded by applicable law. Past financial performance is no guarantee of future results.

Table of Contents
accompanying Consolidated Statements of Earnings and the other components of net periodic pension cost will be included in nonoperating income(expense).
Weighted average assumptions used to determine net periodic pension cost (benefit) at date of measurement:
U.S. Plans Non-U.S. Plans
2017 2016 2017 2016
Discount rate 4.1% 4.4% 1.8% 2.6%Expected long-term return on plan assets 7.0% 7.0% 3.9% 4.1%Rate of compensation increase 4.0% 4.0% 2.9% 2.9%
The discount rate reflects the market rate on December 31 for high-quality fixed-income investments with maturities corresponding to the Company’s benefitobligations and is subject to change each year. For non-U.S. plans, rates appropriate for each plan are determined based on investment-grade instruments withmaturities approximately equal to the average expected benefit payout under the plan. During 2016, the Company updated the mortality assumptions used toestimate the projected benefit obligation to reflect updated mortality tables.
Included in accumulated other comprehensive income (loss) as of December 31, 2017 are the following amounts that have not yet been recognized in netperiodic pension cost: unrecognized prior service cost of $2 million ($2 million, net of tax) and unrecognized actuarial losses of approximately $902 million($572 million, net of tax). The unrecognized losses and prior service cost, net, is calculated as the difference between the actuarially determined projectedbenefit obligation and the value of the plan assets less accrued pension costs as of December 31, 2017. The prior service cost and actuarial losses included inaccumulated other comprehensive income (loss) and expected to be recognized in net periodic pension costs during the year ending December 31, 2018 is$0.4 million ($0.2 million, net of tax) and $37 million ($24 million, net of tax), respectively. No plan assets are expected to be returned to the Companyduring the year ending December 31, 2018.
Selection of Expected Rate of Return on Assets
For the year ended December 31, 2017, the Company used an expected long-term rate of return assumption of 7.0% for its U.S. defined benefit pension planwhile for the years ended December 31, 2016 and 2015, the Company used an expected long-term rate of return assumption of 7.0% and 7.5%, respectivelyfor its U.S. defined benefit pension plan. The Company intends to use an expected long-term rate of return assumption of 7.0% for 2018 for its U.S. plan. Thisexpected rate of return reflects the asset allocation of the plan, and is based primarily on broad, publicly traded equity and fixed-income indices and forward-looking estimates of active portfolio and investment management. Long-term rate of return on asset assumptions for the non-U.S. plans were determined on aplan-by-plan basis based on the composition of assets and ranged from 1.0% to 5.8% and 1.1% to 5.8% in 2017 and 2016, respectively, with a weightedaverage rate of return assumption of 3.9% and 4.1% in 2017 and 2016, respectively.
Plan Assets
The U.S. plan’s goal is to maintain between 60% and 70% of its assets in equity portfolios, which are invested in individual equity securities or funds that areexpected to mirror broad market returns for equity securities or in assets with characteristics similar to equity investments, such as venture capital funds andpartnerships. Asset holdings are periodically rebalanced when equity holdings are outside this range. The balance of the U.S. plan asset portfolio is investedin bond funds, real estate funds, various absolute and real return funds and private equity funds. Non-U.S. plan assets are invested in various insurancecontracts, equity and debt securities as determined by the administrator of each plan. The value of the plan assets directly affects the funded status of theCompany’s pension plans recorded in the Consolidated Financial Statements.
The Company has some investments that are valued using Net Asset Value (“NAV”) as the practical expedient. In addition, some of the investments valuedusing NAV as the practical expedient have limits on their redemption to monthly, quarterly, semiannually or annually and require up to 90 days prior writtennotice. These investments valued using NAV consist of mutual funds, common collective trusts, venture capital funds, partnerships, and other privateinvestments, which allow the Company to allocate investments across a broad array of types of funds and diversify the portfolio.
88
Source: DANAHER CORP /DE/, 10-K, February 21, 2018 Powered by Morningstar® Document Research℠The information contained herein may not be copied, adapted or distributed and is not warranted to be accurate, complete or timely. The user assumes all risks for any damages or losses arising from any use of this information,except to the extent such damages or losses cannot be limited or excluded by applicable law. Past financial performance is no guarantee of future results.

Table of Contents
The fair values of the Company’s pension plan assets for both the U.S. and non-U.S. plans as of December 31, 2017, by asset category were as follows ($ inmillions):
Quoted Prices inActive Market (Level
1)
Significant OtherObservable Inputs (Level
2)
SignificantUnobservable Inputs
(Level 3) Total
Cash and equivalents $ 36.0 $ — $ — $ 36.0Equity securities:
Common stock 515.8 — — 515.8Preferred stock 6.7 — — 6.7
Fixed income securities: Corporate bonds — 138.4 — 138.4Government issued — 37.5 — 37.5
Mutual funds 341.5 147.0 — 488.5Insurance contracts — 299.4 — 299.4Total $ 900.0 $ 622.3 $ — 1,522.3Investments measured at NAV (a): Mutual funds 239.6Insurance contracts 72.1Common collective trusts 774.0Venture capital, partnerships and other private investments 596.2Total assets at fair value $ 3,204.2
(a) The fair value amounts presented in the table above are intended to permit reconciliation of the fair value hierarchy to the total plan assets.
The fair values of the Company’s pension plan assets for both the U.S. and non-U.S. plans as of December 31, 2016, by asset category were as follows ($ inmillions):
Quoted Prices inActive Market (Level
1)
Significant OtherObservable Inputs (Level
2)
SignificantUnobservable Inputs
(Level 3) Total
Cash and equivalents $ 23.7 $ — $ — $ 23.7Equity securities:
Common stock 347.5 23.4 — 370.9Preferred stock 4.3 — — 4.3
Fixed income securities: Corporate bonds — 62.9 — 62.9Government issued — 82.9 — 82.9
Mutual funds 315.1 162.6 — 477.7Insurance contracts — 260.3 — 260.3Total $ 690.6 $ 592.1 $ — 1,282.7Investments measured at NAV (a): Mutual funds 289.1Insurance contracts 70.2Common collective trusts 697.8Venture capital, partnerships and other private investments 571.3Total assets at fair value $ 2,911.1
(a) The fair value amounts presented in the table above are intended to permit reconciliation of the fair value hierarchy to the total plan assets.
Preferred stock and common stock traded on an active market, as well as mutual funds are valued at the quoted closing price reported on the active market onwhich the individual securities are traded. Preferred stock, common stock, corporate bonds,
89
Source: DANAHER CORP /DE/, 10-K, February 21, 2018 Powered by Morningstar® Document Research℠The information contained herein may not be copied, adapted or distributed and is not warranted to be accurate, complete or timely. The user assumes all risks for any damages or losses arising from any use of this information,except to the extent such damages or losses cannot be limited or excluded by applicable law. Past financial performance is no guarantee of future results.

Table of Contents
U.S. government securities and mutual funds that are not traded on an active market are valued at quoted prices reported by investment brokers and dealersbased on the underlying terms of the security and comparison to similar securities traded on an active market.
Common/collective trusts are valued based on the plan’s interest, represented by investment units, in the underlying investments held within the trust that aretraded in an active market by the trustee.
Venture capital, partnerships and other private investments are valued using the NAV based on the information provided by the asset fund managers, whichreflects the plan’s share of the fair value of the net assets of the investment. Depending on the nature of the assets, the underlying investments are valuedusing a combination of either discounted cash flows, earnings and market multiples, third-party appraisals or through reference to the quoted market prices ofthe underlying investments held by the venture, partnership or private entity where available. Valuation adjustments reflect changes in operating results,financial condition, or prospects of the applicable portfolio company.
The methods described above may produce a fair value estimate that may not be indicative of net realizable value or reflective of future fair values.Furthermore, while the Company believes the valuation methods are appropriate and consistent with the methods used by other market participants, the useof different methodologies or assumptions to determine the fair value of certain financial instruments could result in a different fair value measurement at thereporting date.
Expected Contributions
During 2017, the Company contributed $53 million to its U.S. defined benefit pension plan and $45 million to its non-U.S. defined benefit pension plans.During 2018, the Company’s cash contribution requirements for its U.S. and its non-U.S. defined benefit pension plans are expected to be approximately $30million and $50 million, respectively.
The following sets forth benefit payments, which reflect expected future service, as appropriate, expected to be paid by the plans in the periods indicated ($in millions):
U.S. Pension Plans Non-U.S. Pension Plans All Pension Plans
2018 $ 178.4 $ 51.9 $ 230.32019 176.9 55.8 232.72020 179.5 52.9 232.42021 179.3 55.5 234.82022 178.2 55.2 233.42023 – 2027 841.4 311.5 1,152.9
Other Matters
Substantially all employees not covered by defined benefit plans are covered by defined contribution plans, which generally provide for Company fundingbased on a percentage of compensation.
A limited number of the Company’s subsidiaries participate in multiemployer defined benefit and contribution plans, primarily outside of the United States,that require the Company to periodically contribute funds to the plan. The risks of participating in a multiemployer plan differ from the risks of participatingin a single-employer plan in the following respects: (1) assets contributed to the multiemployer plan by one employer may be used to provide benefits toemployees of other participating employers, (2) if a participating employer ceases contributing to the plan, the unfunded obligations of the plan may berequired to be borne by the remaining participating employers and (3) if the Company elects to stop participating in the plan, the Company may be requiredto pay the plan an amount based on the unfunded status of the plan. None of the multiemployer plans in which the Company’s subsidiaries participate areconsidered to be quantitatively or qualitatively significant, either individually or in the aggregate. In addition, contributions made to these plans during2017, 2016 and 2015 were not considered significant, either individually or in the aggregate.
Expense for all defined benefit and defined contribution pension plans amounted to $177 million, $177 million and $154 million for the years endedDecember 31, 2017, 2016 and 2015, respectively.
90
Source: DANAHER CORP /DE/, 10-K, February 21, 2018 Powered by Morningstar® Document Research℠The information contained herein may not be copied, adapted or distributed and is not warranted to be accurate, complete or timely. The user assumes all risks for any damages or losses arising from any use of this information,except to the extent such damages or losses cannot be limited or excluded by applicable law. Past financial performance is no guarantee of future results.

Table of Contents
NOTE 11. OTHER POSTRETIREMENT EMPLOYEE BENEFIT PLANSIn addition to providing pension benefits, the Company provides certain health care and life insurance benefits for some of its retired employees in theUnited States. Certain employees may become eligible for these benefits as they reach normal retirement age while working for the Company.
The following sets forth the funded status of the domestic plans as of the most recent actuarial valuations using measurement dates of December 31 ($ inmillions):
2017 2016
Change in benefit obligation: Benefit obligation at beginning of year $ 174.6 $ 193.4Service cost 0.7 0.7Interest cost 5.6 6.6Amendments, curtailments and other 0.4 (6.5)Actuarial loss (gain) 1.5 (5.0)Retiree contributions 2.9 3.2Benefits paid (18.4) (17.8)Benefit obligation at end of year 167.3 174.6
Change in plan assets: Fair value of plan assets — —
Funded status $ (167.3) $ (174.6)
As of December 31, 2017 and 2016, $152 million and $158 million, respectively, of the total underfunded status of the plan was recognized as long-termaccrued postretirement liability since it was not expected to be funded within one year.
Weighted average assumptions used to determine benefit obligations at date of measurement:
2017 2016
Discount rate 3.5% 3.9%Medical trend rate – initial 6.3% 6.5%Medical trend rate – grading period 20 years 21 yearsMedical trend rate – ultimate 4.5% 4.5%
Effect of a one-percentage-point change in assumed health care cost trend rates:
($ in millions) 1% Increase 1% Decrease
Effect on the total of service and interest cost components $ 0.3 $ (0.3)Effect on postretirement medical benefit obligation 4.9 (4.3)
The medical trend rate used to determine the postretirement benefit obligation was 6.3% for 2017. The rate decreases gradually to an ultimate rate of 4.5% in2037 and remains at that level thereafter. The trend rate is a significant factor in determining the amounts reported.
Components of net periodic benefit cost:
($ in millions) 2017 2016
Service cost $ 0.7 $ 0.7Interest cost 5.6 6.6Amortization of net gain (0.1) —Amortization of prior service credit (3.1) (3.1)Net periodic benefit cost $ 3.1 $ 4.2
91
Source: DANAHER CORP /DE/, 10-K, February 21, 2018 Powered by Morningstar® Document Research℠The information contained herein may not be copied, adapted or distributed and is not warranted to be accurate, complete or timely. The user assumes all risks for any damages or losses arising from any use of this information,except to the extent such damages or losses cannot be limited or excluded by applicable law. Past financial performance is no guarantee of future results.

Table of Contents
Net periodic benefit costs are included in cost of sales and selling, general and administrative expenses in the accompanying Consolidated Statements ofEarnings. As discussed in Note 1, beginning in 2018 only the service cost component of net periodic benefit cost will be included in cost of sales and selling,general and administrative expenses in the accompanying Consolidated Statements of Earnings and the other components of net periodic benefit cost will beincluded in nonoperating income (expense).
Included in accumulated other comprehensive income (loss) as of December 31, 2017 are the following amounts that have not yet been recognized in netperiodic benefit cost: unrecognized prior service credits of $21 million ($13 million, net of tax) and unrecognized actuarial losses of $16 million ($10million, net of tax). The unrecognized losses and prior service credits, net, is calculated as the difference between the actuarially determined projected benefitobligation and the value of the plan assets less accrued benefit costs as of December 31, 2017. The prior service credits included in accumulated othercomprehensive income (loss) and expected to be recognized in net periodic benefit costs during the year ending December 31, 2018 are $3 million ($2million, net of tax). The actuarial losses included in accumulated other comprehensive income (loss) and expected to be recognized in net periodic benefitcosts during the year ending December 31, 2018 are not material.
The following sets forth benefit payments, which reflect expected future service, as appropriate, expected to be paid in the periods indicated ($ in millions):
2018 $ 15.82019 15.22020 14.62021 14.02022 13.32023 – 2027 57.8
NOTE 12. INCOME TAXESEarnings from continuing operations before income taxes for the years ended December 31 were as follows ($ in millions):
2017 2016 2015
United States $ 927.2 $ 647.7 $ 505.5International 2,011.6 1,963.6 1,533.9Total $ 2,938.8 $ 2,611.3 $ 2,039.4
The provision for income taxes from continuing operations for the years ended December 31 were as follows ($ in millions):
2017 2016 2015
Current: Federal U.S. $ 448.3 $ 237.2 $ 213.4Non-U.S. 457.2 542.9 273.0State and local (9.6) 61.7 (9.5)
Deferred: Federal U.S. (424.7) (237.5) (83.8)Non-U.S. (61.5) (104.2) (121.5)State and local 59.3 (42.2) 21.1
Income tax provision $ 469.0 $ 457.9 $ 292.7
92
Source: DANAHER CORP /DE/, 10-K, February 21, 2018 Powered by Morningstar® Document Research℠The information contained herein may not be copied, adapted or distributed and is not warranted to be accurate, complete or timely. The user assumes all risks for any damages or losses arising from any use of this information,except to the extent such damages or losses cannot be limited or excluded by applicable law. Past financial performance is no guarantee of future results.

Table of Contents
Noncurrent deferred tax assets and noncurrent deferred tax liabilities are included in other assets and other long-term liabilities, respectively, in theaccompanying Consolidated Balance Sheets. Deferred income tax assets and liabilities as of December 31 were as follows ($ in millions):
2017 2016
Deferred tax assets: Allowance for doubtful accounts $ 18.6 $ 22.4Inventories 95.9 102.8Pension and postretirement benefits 250.6 392.4Environmental and regulatory compliance 26.8 29.9Other accruals and prepayments 345.8 211.1Stock-based compensation expense 63.9 89.3Tax credit and loss carryforwards 673.4 1,095.9Valuation allowances (324.6) (306.5)
Total deferred tax asset 1,150.4 1,637.3Deferred tax liabilities:
Property, plant and equipment (63.4) (41.4)Insurance, including self-insurance (696.2) (786.4)Basis difference in LYONs (12.9) (13.1)Goodwill and other intangibles (2,711.2) (3,645.3)Unrealized gains on marketable securities — (2.9)
Total deferred tax liability (3,483.7) (4,489.1)Net deferred tax liability $ (2,333.3) $ (2,851.8)
The Company evaluates the future realizability of tax credits and loss carryforwards considering the anticipated future earnings of the Company’ssubsidiaries as well as tax planning strategies in the associated jurisdictions. Deferred taxes associated with U.S. entities consist of net deferred tax liabilitiesof approximately $2.0 billion and $2.5 billion as of December 31, 2017 and 2016, respectively. Deferred taxes associated with non-U.S. entities consist of netdeferred tax liabilities of $301 million and $374 million as of December 31, 2017 and 2016, respectively. During 2017, the Company’s valuation allowanceincreased by $18 million through the tax provision due to certain tax benefits triggered in 2017 that are not expected to be realized. As of December 31,2017, the total amount of the basis difference in investments outside the United States for which deferred taxes have not been provided is approximately $8.0billion. As of December 31, 2017, the Company had no plans which would subject these basis differences to income taxes in the U.S. or elsewhere.
On December 22, 2017, the TCJA was enacted, substantially changing the U.S. tax system and affecting the Company in a number of ways. Notably, theTCJA:
• establishes a flat corporate income tax rate of 21.0% on U.S. earnings;
• imposes a one-time tax on unremitted cumulative non-U.S. earnings of foreign subsidiaries (“Transition Tax”);
• imposes a new minimum tax on certain non-U.S. earnings, irrespective of the territorial system of taxation, and generally allows for the repatriationof future earnings of foreign subsidiaries without incurring additional U.S. taxes by transitioning to a territorial system of taxation;
• subjects certain payments made by a U.S. company to a related foreign company to certain minimum taxes (Base Erosion Anti-Abuse Tax);
• eliminates certain prior tax incentives for manufacturing in the United States and creates an incentive for U.S. companies to sell, lease or licensegoods and services abroad by allowing for a reduction in taxes owed on earnings related to such sales;
• allows the cost of investments in certain depreciable assets acquired and placed in service after September 27, 2017 to be immediately expensed;and
• reduces deductions with respect to certain compensation paid to specified executive officers.
93
Source: DANAHER CORP /DE/, 10-K, February 21, 2018 Powered by Morningstar® Document Research℠The information contained herein may not be copied, adapted or distributed and is not warranted to be accurate, complete or timely. The user assumes all risks for any damages or losses arising from any use of this information,except to the extent such damages or losses cannot be limited or excluded by applicable law. Past financial performance is no guarantee of future results.
Table of Contents
While the changes from the TCJA are generally effective beginning in 2018, U.S. GAAP accounting for income taxes requires the effect of a change in taxlaws or rates to be recognized in income from continuing operations for the period that includes the enactment date. Due to the complexities involved inaccounting for the enactment of the TCJA, the SEC Staff Accounting Bulletin No. 118 (“SAB No. 118”) allowed the Company to record provisional amountsin earnings for the year ended December 31, 2017. Where reasonable estimates can be made, the provisional accounting should be based on such estimates.When no reasonable estimate can be made, the provisional accounting may be based on the tax law in effect before the TCJA. The Company is required tocomplete its tax accounting for the TCJA within a one year period when it has obtained, prepared, and analyzed the information to complete the income taxaccounting.
The Company has not completed its accounting for the tax effects of enactment of the TCJA; however, as described below, the Company has made reasonableestimates of the effects of the TCJA on its Consolidated Financial Statements which are included as a component of income tax expense from continuingoperations:
• Deferred tax assets and liabilities: U.S. deferred tax assets and liabilities were remeasured based on the rates at which they are expected to reverse inthe future, which is generally 21.0%, resulting in an income tax benefit of approximately $1.2 billion. The Company will continue to analyzecertain aspects of the TCJA which could potentially affect the tax basis of the reported amounts. Additionally, the Company’s U.S. tax returns for2017 will be filed during the fourth quarter of 2018 and any changes to the tax positions for temporary differences compared to the estimates usedwill result in an adjustment of the estimated tax benefit recorded as of December 31, 2017.
• Transition Tax effects: The Transition Tax is based on the Company’s total post-1986 earnings and profits that were previously deferred from U.S.income taxes. The Company recorded a provisional amount for the Transition Tax expense resulting in an increase in income tax expense ofapproximately $1.2 billion. The Company will continue to evaluate the TCJA and any future guidance from the U.S. Treasury Department andInternal Revenue Service (“IRS”) in the determination of the Transition Tax which could result in adjustment of the estimate recorded as ofDecember 31, 2017.
• Indefinite reinvestment: As of December 31, 2017, the Company held $593 million of cash and approximately $656 million of cash equivalents (asdefined by the TCJA, including trade accounts receivable net of trade accounts payable balances and certain accrued expenses) outside the UnitedStates. While repatriation of some cash held outside the United States may be restricted by local laws, most of the Company’s foreign cash could berepatriated to the United States. Following enactment of the TCJA and the associated Transition Tax, in general, repatriation of cash to the UnitedStates can be completed with no incremental U.S. tax; however, repatriation of cash could subject the Company to non-U.S. jurisdictional taxes ondistributions. The cash that the Company’s non-U.S. subsidiaries hold for indefinite reinvestment is generally used to finance foreign operations andinvestments, including acquisitions. The income taxes applicable to such earnings are not readily determinable or practicable. The Companycontinues to evaluate the impact of the TCJA on its election to indefinitely reinvest certain of its non-U.S. earnings.
The Company will continue to analyze the effects of the TCJA on its Consolidated Financial Statements and operations. Additional impacts from theenactment of the TCJA will be recorded as they are identified during the measurement period as provided for in SAB No. 118, which extends up to one yearfrom the enactment date.
94
Source: DANAHER CORP /DE/, 10-K, February 21, 2018 Powered by Morningstar® Document Research℠The information contained herein may not be copied, adapted or distributed and is not warranted to be accurate, complete or timely. The user assumes all risks for any damages or losses arising from any use of this information,except to the extent such damages or losses cannot be limited or excluded by applicable law. Past financial performance is no guarantee of future results.

Table of Contents
The effective income tax rate from continuing operations for the years ended December 31 varies from the U.S. statutory federal income tax rate as follows:
Percentage of Pretax Earnings
2017 2016 2015
Statutory federal income tax rate 35.0 % 35.0 % 35.0 %Increase (decrease) in tax rate resulting from: State income taxes (net of federal income tax benefit) 0.8 % 0.6 % 0.7 %Foreign income taxed at lower rate than U.S. statutory rate (11.6)% (10.2)% (17.1)%Resolution and expiration of statutes of limitation of uncertain tax positions (6.5)% (3.1)% (0.7)%Permanent foreign exchange losses (0.6)% (8.2)% (4.6)%Research credits, uncertain tax positions and other (1.0)% 3.4 % 1.1 %Revaluation of U.S. deferred income taxes (41.5)% — % — %TCJA - Transition Tax 41.4 % — % — %Effective income tax rate 16.0 % 17.5 % 14.4 %
The Company’s effective tax rate for each of 2017, 2016 and 2015 differs from the U.S. federal statutory rate of 35.0% due principally to the Company’searnings outside the United States that are indefinitely reinvested and taxed at rates lower than the U.S. federal statutory rate. In addition:
• The effective tax rate of 16.0% in 2017 includes 500 basis points of net tax benefits related to the revaluation of net U.S. deferred tax liabilities from35.0% to 21.0% due to the TCJA and release of reserves upon statute of limitation expiration, partially offset by income tax expense related to theTransition Tax on foreign earnings due to the TCJA and changes in estimates associated with prior period uncertain tax positions.
• The effective tax rate of 17.5% in 2016 includes 350 basis points of net tax benefits from permanent foreign exchange losses and the release ofreserves upon the expiration of statutes of limitation and audit settlements, partially offset by income tax expense related to repatriation of earningsand legal entity realignments associated with the Separation and changes in estimates associated with prior period uncertain tax positions.
• The effective tax rate of 14.4% in 2015 includes 290 basis points of net tax benefits from permanent foreign exchange losses, releases of valuationallowances related to foreign operating losses and the release of reserves upon the expiration of statutes of limitation, partially offset by changes inestimates associated with prior period uncertain tax positions.
The Company made income tax payments related to both continuing and discontinued operations of $689 million, $767 million and $584 million in 2017,2016 and 2015, respectively. Current income taxes payable related to both continuing and discontinued operations has been reduced by $85 million, $99million, and $147 million in 2017, 2016 and 2015, respectively, for tax deductions attributable to stock-based compensation, of which, the excess tax benefitover the amount recorded for financial reporting purposes for both continuing and discontinued operations was $55 million, $50 million and $88 million,respectively. The excess tax benefits realized have been recorded as increases to additional paid-in capital for the years ended December 31, 2016 and 2015and are reflected as a financing cash inflow in the accompanying Consolidated Statements of Cash Flows. As a result of the adoption of ASU 2016-09,Compensation—Stock Compensation, the excess tax benefit for the year ended December 31, 2017 has been recorded as a reduction to the current income taxprovision and is reflected as an operating cash inflow in the accompanying Consolidated Statement of Cash Flows.
Included in deferred income taxes related to continuing operations as of December 31, 2017 are tax benefits for U.S. and non-U.S. net operating losscarryforwards totaling $502 million ($283 million of which the Company does not expect to realize and have corresponding valuation allowances). Certainof the losses can be carried forward indefinitely and others can be carried forward to various dates from 2018 through 2037. In addition, the Company hadgeneral business and foreign tax credit carryforwards related to continuing operations of $171 million ($30 million of which the Company does not expect torealize and have corresponding valuation allowances) as of December 31, 2017, which can be carried forward to various dates from 2018 to 2027. In addition,as of December 31, 2017, the Company had $12 million of valuation allowances related to other deferred tax asset balances that are not more likely than notof being realized.
As of December 31, 2017, gross unrecognized tax benefits related to continuing operations totaled $737 million ($736 million, net of the impact of $104million of indirect tax benefits offset by $103 million associated with potential interest and penalties).
95
Source: DANAHER CORP /DE/, 10-K, February 21, 2018 Powered by Morningstar® Document Research℠The information contained herein may not be copied, adapted or distributed and is not warranted to be accurate, complete or timely. The user assumes all risks for any damages or losses arising from any use of this information,except to the extent such damages or losses cannot be limited or excluded by applicable law. Past financial performance is no guarantee of future results.

Table of Contents
As of December 31, 2016, gross unrecognized tax benefits related to both continuing and discontinued operations totaled $992 million ($933 million, net ofthe impact of $179 million of indirect tax benefits offset by $120 million associated with potential interest and penalties). The Company recognizedapproximately $41 million, $47 million and $39 million in potential interest and penalties related to both continuing and discontinued operationsassociated with uncertain tax positions during 2017, 2016 and 2015, respectively. To the extent unrecognized tax benefits (including interest and penalties)are not assessed with respect to uncertain tax positions, $691 million would reduce the tax expense and effective tax rate in future periods. The Companyrecognized interest and penalties related to unrecognized tax benefits within income taxes in the accompanying Consolidated Statement of Earnings.Unrecognized tax benefits and associated accrued interest and penalties are included in taxes, income and other accrued expenses as detailed in Note 8.
A reconciliation of the beginning and ending amount of unrecognized tax benefits, excluding amounts accrued for potential interest and penalties related toboth continuing and discontinued operations, is as follows ($ in millions):
2017 2016 2015
Unrecognized tax benefits, beginning of year $ 992.2 $ 990.2 $ 728.5Additions based on tax positions related to the current year 53.0 80.0 73.3Additions for tax positions of prior years 39.8 154.3 135.3Reductions for tax positions of prior years (14.5) (7.0) (10.0)Acquisitions, divestitures and other 13.4 (41.5) 140.6Lapse of statute of limitations (246.7) (124.0) (26.3)Settlements (124.8) (45.3) (18.9)Effect of foreign currency translation 24.4 (14.5) (32.3)Unrecognized tax benefits, end of year $ 736.8 $ 992.2 $ 990.2
The Company conducts business globally, and files numerous consolidated and separate income tax returns in the U.S. federal, state and foreign jurisdictions.The countries in which the Company has a material presence that have had significantly lower statutory tax rates than the United States include China,Denmark, Germany, Singapore, Switzerland and the United Kingdom. The Company’s ability to obtain a tax benefit from lower statutory tax rates outside ofthe United States depends on its levels of taxable income in these foreign countries and the amount of foreign earnings which are indefinitely reinvested inthose countries. The Company believes that a change in the statutory tax rate of any individual foreign country would not have a material effect on theCompany’s Consolidated Financial Statements given the geographic dispersion of the Company’s taxable income.
The Company and its subsidiaries are routinely examined by various domestic and international taxing authorities. The IRS has completed substantially allof the examinations of the Company’s federal income tax returns through 2011 and is currently examining certain of the Company’s federal income taxreturns for 2012 through 2015. In addition, the Company has subsidiaries in Austria, Belgium, Canada, China, Denmark, Finland, France, Germany, HongKong, India, Italy, Japan, New Zealand, Sweden, Switzerland, the United Kingdom and various other countries, states and provinces that are currently underaudit for years ranging from 2004 through 2015.
Tax authorities in Denmark have raised significant issues related to interest accrued by certain of the Company’s subsidiaries. On December 10, 2013, theCompany received assessments from the Danish tax authority (“SKAT”) totaling approximately DKK 1.5 billion (approximately $245 million based onexchange rates as of December 31, 2017) including interest through December 31, 2017, imposing withholding tax relating to interest accrued in Denmark onborrowings from certain of the Company’s subsidiaries for the years 2004-2009. The Company is currently in discussions with SKAT and anticipatesreceiving an assessment for years 2010-2012 totaling approximately DKK 895 million (approximately $144 million based on exchange rates as ofDecember 31, 2017) including interest through December 31, 2017. Management believes the positions the Company has taken in Denmark are inaccordance with the relevant tax laws and is vigorously defending its positions. The Company appealed these assessments with the National Tax Tribunal in2014 and intends on pursuing this matter through the European Court of Justice should this appeal be unsuccessful. The ultimate resolution of this matter isuncertain, could take many years, and could result in a material adverse impact to the Company’s financial statements, including its effective tax rate.
Management estimates that it is reasonably possible that the amount of unrecognized tax benefits related to continuing operations may be reduced byapproximately $130 million within 12 months as a result of resolution of worldwide tax matters, payments of tax audit settlements and/or statute oflimitations expirations. Future resolution of uncertain tax positions related to discontinued operations may result in additional charges or credits to earningsfrom discontinued operations in the Consolidated Statement of Earnings (refer to Note 3).
96
Source: DANAHER CORP /DE/, 10-K, February 21, 2018 Powered by Morningstar® Document Research℠The information contained herein may not be copied, adapted or distributed and is not warranted to be accurate, complete or timely. The user assumes all risks for any damages or losses arising from any use of this information,except to the extent such damages or losses cannot be limited or excluded by applicable law. Past financial performance is no guarantee of future results.

Table of Contents
The Company operates in various non-U.S. jurisdictions where income tax incentives and rulings have been granted for specific periods of time. InSwitzerland, the Company has various tax rulings and tax holiday arrangements which reduce the overall effective tax rate of the Company. The tax holidaysexpire between 2018 and 2020. In Singapore, the Company operates under various tax incentive agreements that provide for reduced tax rates. Subject to theCompany satisfying certain requirements, the agreements expire in 2022. The Company has satisfied the conditions enumerated in these agreements to date.Included in the accompanying Consolidated Financial Statements are tax benefits of $62 million, $61 million, and $33 million (or $0.09, $0.09 and $0.05per diluted share) for 2017, 2016, and 2015, respectively, from these rulings and tax holidays.
NOTE 13. NONOPERATING INCOME (EXPENSE)The Company received $138 million of cash proceeds and recorded $22 million in short-term other receivables from the sale of certain marketable equitysecurities during 2017. The Company recorded a pretax gain related to this sale of $73 million ($46 million after-tax or $0.06 per diluted share).
During 2016, the Company received cash proceeds of $265 million from the sale of certain marketable equity securities and recorded a pretax gain related tothis sale of $223 million ($140 million after-tax or $0.20 per diluted share).During 2016, the Company also paid $188 million of make-whole premiums associated with the early extinguishment of the Redeemed Notes. The Companyrecorded a loss on extinguishment of these borrowings, net of certain deferred gains, of $179 million ($112 million after-tax or $0.16 per diluted share).
During 2015, the Company received cash proceeds of $43 million from the sale of certain marketable equity securities and recorded a pretax gain related tothese sales of $12 million ($8 million after-tax or $0.01 per diluted share).
NOTE 14. PRODUCTIVITY IMPROVEMENT AND RESTRUCTURING INITIATIVESDuring 2017, the Company made the strategic decision to discontinue a molecular diagnostic product line in its Diagnostics segment. As a result, theCompany recorded $76 million of pretax restructuring, impairment and other related charges ($51 million after-tax or $0.07 per diluted share). These chargesincluded $49 million of noncash charges for the impairment of certain technology-related intangible assets as well as related inventory and property, plantand equipment with no further use. In addition, the Company incurred $27 million of cash restructuring costs primarily related to employee severance andrelated charges. Substantially all restructuring activities related to this discontinued product line were completed in 2017.
In addition to the molecular diagnostic product line discontinuation noted above, during 2017 the Company recorded pretax productivity improvement andrestructuring related charges of $83 million, for a total of $159 million of pretax productivity improvement and restructuring related charges in 2017.Substantially all the activities initiated in 2017 were completed by December 31, 2017 resulting in $78 million of employee severance and related charges,$81 million of facility exit and other related charges (including noncash charges for the impairment of certain technology-related intangibles as well asrelated inventory and property, plant and equipment with no further use). The Company expects substantially all cash payments associated with remainingtermination benefits will be paid during 2018. During 2016, the Company recorded pretax productivity improvement and restructuring related chargestotaling $152 million. Substantially all of the planned activities related to the 2016 plans were completed by December 31, 2016 resulting in approximately$111 million of employee severance and related charges and $30 million of facility exit and other related charges and $11 million related to an impairmentof a trade name within the Dental segment. During 2015, the Company recorded pretax productivity improvement and restructuring related charges totaling$98 million. Substantially all of the planned activities related to the 2015 plans were completed by December 31, 2015 resulting in approximately $81million of employee severance and related charges and $17 million of facility exit and other related charges.
Excluding the discontinuation of the molecular diagnostic product line, the nature of the Company’s productivity improvement and restructuring relatedactivities initiated in 2017, 2016 and 2015 were broadly consistent throughout the Company’s reportable segments and focused on improvements inoperational efficiency through targeted workforce reductions and facility consolidations and closures. These costs were incurred to position the Company toprovide superior products and services to its customers in a cost efficient manner, and taking into consideration broad economic considerations.
In conjunction with the closing of facilities, certain inventory was written off as unusable in future operating locations. This inventory consisted primarily ofcomponent parts and raw materials, which were either redundant to inventory at the facilities being merged or were not economically feasible to relocatesince the inventory was purchased to operate on equipment and tooling which was not being relocated. In addition, asset impairment charges have beenrecorded to reduce the carrying amounts of the long-lived assets that will be sold or disposed of to their estimated fair values. Charges for the assetimpairment
97
Source: DANAHER CORP /DE/, 10-K, February 21, 2018 Powered by Morningstar® Document Research℠The information contained herein may not be copied, adapted or distributed and is not warranted to be accurate, complete or timely. The user assumes all risks for any damages or losses arising from any use of this information,except to the extent such damages or losses cannot be limited or excluded by applicable law. Past financial performance is no guarantee of future results.

Table of Contents
reduce the carrying amount of the long-lived assets to their estimated salvage value in connection with the decision to dispose of such assets.
Productivity improvement and restructuring related charges, including those relate to the discontinuation of the molecular diagnostics product line, recordedfor the years ended December 31 by segment were as follows ($ in millions):
2017 2016 2015
Life Sciences $ 25.4 $ 40.5 $ 27.5Diagnostics 85.4 62.2 33.6Dental 35.8 34.3 25.3Environmental & Applied Solutions 12.5 15.4 11.1Total $ 159.1 $ 152.4 $ 97.5
The table below summarizes the Company’s accrual balance and utilization by type of productivity improvement and restructuring costs associated with the2017 and 2016 actions ($ in millions):
Employee Severance
and Related Facility Exit and
Related Total
Balance, January 1, 2016 $ 65.6 $ 13.9 $ 79.5Costs incurred 111.0 41.4 152.4Paid/settled (131.3) (43.5) (174.8)
Balance, December 31, 2016 45.3 11.8 57.1Costs incurred 77.7 81.4 159.1Paid/settled (74.0) (75.9) (149.9)
Balance, December 31, 2017 $ 49.0 $ 17.3 $ 66.3
The productivity improvement and restructuring related charges incurred during 2017 include cash charges of $103 million and $56 million of noncashcharges. The productivity improvement and restructuring related charges incurred during 2016 and 2015 include cash charges of $140 million and $94million and $12 million and $4 million of noncash charges, respectively. These charges are reflected in the following captions in the accompanyingConsolidated Statements of Earnings ($ in millions):
2017 2016 2015
Cost of sales $ 38.0 $ 25.4 $ 31.9Selling, general and administrative expenses 121.1 127.0 65.6Total $ 159.1 $ 152.4 $ 97.5
NOTE 15. LEASES AND COMMITMENTSThe Company’s operating leases extend for varying periods of time up to 20 years and, in some cases, contain renewal options that would extend existingterms beyond 20 years. Total rent expense for all operating leases was $249 million, $220 million and $209 million for the years ended December 31, 2017,2016 and 2015, respectively.
98
Source: DANAHER CORP /DE/, 10-K, February 21, 2018 Powered by Morningstar® Document Research℠The information contained herein may not be copied, adapted or distributed and is not warranted to be accurate, complete or timely. The user assumes all risks for any damages or losses arising from any use of this information,except to the extent such damages or losses cannot be limited or excluded by applicable law. Past financial performance is no guarantee of future results.

Table of Contents
The Company’s future minimum rental payments for all operating leases having initial or remaining noncancelable lease terms in excess of one year are asfollows ($ in millions):
2018 $ 199.42019 166.62020 130.92021 99.32022 79.4Thereafter 121.8
The Company generally accrues estimated warranty costs at the time of sale. In general, manufactured products are warranted against defects in material andworkmanship when properly used for their intended purpose, installed correctly, and appropriately maintained. Warranty periods depend on the nature of theproduct and range from 90 days up to the life of the product. The amount of the accrued warranty liability is determined based on historical information suchas past experience, product failure rates or number of units repaired, estimated cost of material and labor, and in certain instances estimated property damage.The accrued warranty liability is reviewed on a quarterly basis and may be adjusted as additional information regarding expected warranty costs becomesknown.
The following is a rollforward of the Company’s accrued warranty liability ($ in millions):
2017 2016
Balance, January 1 $ 75.8 $ 73.8Accruals for warranties issued during the year 54.5 62.3Settlements made (56.6) (61.2)Additions due to acquisitions 1.7 1.4Effect of foreign currency translation 3.6 (0.5)
Balance, December 31 $ 79.0 $ 75.8
NOTE 16. LITIGATION AND CONTINGENCIESThe Company is, from time to time, subject to a variety of litigation and other legal and regulatory proceedings incidental to its business (or the businessoperations of previously owned entities). These matters primarily involve claims for damages arising out of the use of the Company’s products and servicesand claims relating to intellectual property matters, employment matters, tax matters, commercial disputes, competition and sales and trading practices,environmental matters, personal injury, insurance coverage and acquisition or divestiture-related matters, as well as regulatory investigations or enforcement.The Company may also become subject to lawsuits as a result of past or future acquisitions or as a result of liabilities retained from, or representations,warranties or indemnities provided in connection with, divested businesses. Some of these lawsuits may include claims for punitive, consequential and/orcompensatory damages, as well as injunctive relief. Based upon the Company’s experience, current information and applicable law, it does not believe it isreasonably possible that any amounts it may be required to pay in connection with litigation and other legal and regulatory proceedings in excess of itsreserves as of December 31, 2017 will have a material effect on its Consolidated Financial Statements.
While the Company maintains general, products, property, workers’ compensation, automobile, cargo, aviation, crime, fiduciary and directors’ and officers’liability insurance (and has acquired rights under similar policies in connection with certain acquisitions) up to certain limits that cover certain of theseclaims, this insurance may be insufficient or unavailable to cover such losses. For general, products and property liability and most other insured risks, theCompany purchases outside insurance coverage only for severe losses and must establish and maintain reserves with respect to amounts within the self-insured retention. In addition, while the Company believes it is entitled to indemnification from third-parties for some of these claims, these rights may alsobe insufficient or unavailable to cover such losses.
The Company records a liability in the Consolidated Financial Statements for loss contingencies when a loss is known or considered probable and theamount can be reasonably estimated. If the reasonable estimate of a known or probable loss is a range, and no amount within the range is a better estimatethan any other, the minimum amount of the range is accrued. If a loss does not meet the known or probable level but is reasonably possible it is disclosed andif the loss or range of loss can be reasonably estimated, the estimated loss or range of loss is disclosed. The Company’s reserves consist of specific reserves for
99
Source: DANAHER CORP /DE/, 10-K, February 21, 2018 Powered by Morningstar® Document Research℠The information contained herein may not be copied, adapted or distributed and is not warranted to be accurate, complete or timely. The user assumes all risks for any damages or losses arising from any use of this information,except to the extent such damages or losses cannot be limited or excluded by applicable law. Past financial performance is no guarantee of future results.

Table of Contents
individual claims and additional amounts for anticipated developments of these claims as well as for incurred but not yet reported claims. The specificreserves for individual known claims are quantified with the assistance of legal counsel and outside risk professionals where appropriate. In addition, outsiderisk professionals assist in the determination of reserves for incurred but not yet reported claims through evaluation of the Company’s specific loss history,actual claims reported and industry trends among statistical and other factors. Reserve estimates may be adjusted as additional information regarding a claimbecomes known. Because most contingencies are resolved over long periods of time, liabilities may change in the future due to new developments (includinglitigation developments, the discovery of new facts, changes in legislation and outcomes of similar cases), changes in assumptions or changes in theCompany’s strategy. While the Company actively pursues financial recoveries from insurance providers and indemnifying parties, it does not recognize anyrecoveries until realized or until such time as a sustained pattern of collections is established related to historical matters of a similar nature and magnitude. Ifthe Company’s self-insurance and litigation reserves prove inadequate, it would be required to incur an expense equal to the amount of the loss incurred inexcess of the reserves, which would adversely affect the Company’s Consolidated Financial Statements.
In addition, the Company’s operations, products and services are subject to environmental laws and regulations, which impose limitations on the discharge ofpollutants into the environment, establish standards for the use, generation, treatment, storage and disposal of hazardous and nonhazardous wastes andimpose end-of-life disposal and take-back programs. A number of the Company’s operations involve the handling, manufacturing, use or sale of substancesthat are or could be classified as hazardous materials within the meaning of applicable laws. The Company must also comply with various health and safetyregulations in both the United States and abroad in connection with the Company’s operations. Compliance with these laws and regulations has not had and,based on current information and the applicable laws and regulations currently in effect, is not expected to have a material effect on the Company’s capitalexpenditures, earnings or competitive position, and the Company does not anticipate material capital expenditures for environmental control facilities.
In addition to environmental compliance costs, the Company from time to time incurs costs related to alleged damages associated with past or current wastedisposal practices or other hazardous materials handling practices. For example, generators of hazardous substances found in disposal sites at whichenvironmental problems are alleged to exist, as well as the current and former owners of those sites and certain other classes of persons, are subject to claimsbrought by state and federal regulatory agencies pursuant to statutory authority. The Company has received notification from the U.S. EnvironmentalProtection Agency, and from state and non-U.S. environmental agencies, that conditions at certain sites where the Company and others previously disposedof hazardous wastes and/or are or were property owners require clean-up and other possible remedial action, including sites where the Company has beenidentified as a potentially responsible party under U.S. federal and state environmental laws. The Company has projects underway at a number of current andformer facilities, in both the United States and abroad, to investigate and remediate environmental contamination resulting from past operations.Remediation activities generally relate to soil and/or groundwater contamination and may include pre-remedial activities such as fact-finding andinvestigation, risk assessment, feasibility study and/or design, as well as remediation actions such as contaminant removal, monitoring and/or installation,operation and maintenance of longer-term remediation systems. The Company is also from time to time party to personal injury or other claims brought byprivate parties alleging injury due to the presence of, or exposure to, hazardous substances.
The Company has recorded a provision for environmental investigation and remediation and environmental-related claims with respect to sites owned orformerly owned by the Company and its subsidiaries and third-party sites where the Company has been determined to be a potentially responsible party. TheCompany generally makes an assessment of the costs involved for its remediation efforts based on environmental studies, as well as its prior experience withsimilar sites. The ultimate cost of site cleanup is difficult to predict given the uncertainties of the Company’s involvement in certain sites, uncertaintiesregarding the extent of the required cleanup, the availability of alternative cleanup methods, variations in the interpretation of applicable laws andregulations, the possibility of insurance recoveries with respect to certain sites and the fact that imposition of joint and several liability with right ofcontribution is possible under the Comprehensive Environmental Response, Compensation and Liability Act of 1980 and other environmental laws andregulations. If the Company determines that potential liability for a particular site or with respect to a personal injury claim is known or considered probableand reasonably estimable, the Company accrues the total estimated loss, including investigation and remediation costs, associated with the site or claim. Asof December 31, 2017, the Company had a reserve of $147 million for environmental matters which are known or considered probable and reasonablyestimable (of which $116 million are noncurrent), which reflects the Company’s best estimate of the costs to be incurred with respect to such matters.
All reserves have been recorded without giving effect to any possible future third-party recoveries. While the Company actively pursues insurance recoveries,as well as recoveries from other potentially responsible parties, it does not recognize any insurance recoveries for environmental liability claims until realizedor until such time as a sustained pattern of collections is established related to historical matters of a similar nature and magnitude.
100
Source: DANAHER CORP /DE/, 10-K, February 21, 2018 Powered by Morningstar® Document Research℠The information contained herein may not be copied, adapted or distributed and is not warranted to be accurate, complete or timely. The user assumes all risks for any damages or losses arising from any use of this information,except to the extent such damages or losses cannot be limited or excluded by applicable law. Past financial performance is no guarantee of future results.

Table of Contents
The Company’s Restated Certificate of Incorporation requires it to indemnify to the full extent authorized or permitted by law any person made, or threatenedto be made a party to any action or proceeding by reason of his or her service as a director or officer of the Company, or by reason of serving at the request ofthe Company as a director or officer of any other entity, subject to limited exceptions. Danaher’s Amended and Restated By-laws provide for similarindemnification rights. In addition, Danaher has executed with each director and executive officer of Danaher Corporation an indemnification agreementwhich provides for substantially similar indemnification rights and under which Danaher has agreed to pay expenses in advance of the final disposition ofany such indemnifiable proceeding. While the Company maintains insurance for this type of liability, a significant deductible applies to this coverage andany such liability could exceed the amount of the insurance coverage.
As of December 31, 2017, the Company had approximately $611 million of guarantees consisting primarily of outstanding standby letters of credit, bankguarantees and performance and bid bonds. These guarantees have been provided in connection with certain arrangements with vendors, customers,insurance providers, financing counterparties and governmental entities to secure the Company’s obligations and/or performance requirements related tospecific transactions. The Company believes that if the obligations under these instruments were triggered, it would not have a material effect on itsConsolidated Financial Statements.
NOTE 17. STOCK TRANSACTIONS AND STOCK-BASED COMPENSATIONOn July 16, 2013, the Company’s Board of Directors approved a repurchase program (the “Repurchase Program”) authorizing the repurchase of up to 20million shares of the Company’s common stock from time to time on the open market or in privately negotiated transactions. There is no expiration date forthe Repurchase Program, and the timing and amount of any shares repurchased under the program will be determined by the Company’s management basedon its evaluation of market conditions and other factors. The Repurchase Program may be suspended or discontinued at any time. Any repurchased shares willbe available for use in connection with the Company’s equity compensation plans (or any successor plan) and for other corporate purposes. As ofDecember 31, 2017, 20 million shares remained available for repurchase pursuant to the Repurchase Program. The Company expects to fund any future stockrepurchases using the Company’s available cash balances or proceeds from the issuance of debt.
Except in connection with the disposition of the Company’s communications business to NetScout in 2015, neither the Company nor any “affiliatedpurchaser” repurchased any shares of Company common stock during 2017, 2016 or 2015. Refer to Note 3 for a discussion of the 26 million shares ofDanaher common stock tendered to and repurchased by the Company in connection with the disposition of the Company’s communications business toNetScout.
Stock options, RSUs and PSUs have been issued to directors, officers and other employees under the Company’s 2007 Omnibus Incentive Plan. In addition,in connection with the 2015 Pall Acquisition and the 2016 Cepheid Acquisition, the Company assumed certain outstanding stock options and RSUs, asapplicable, that had been awarded under the stock compensation plans of the respective, acquired businesses. These plans (the “Assumed Plans”) operate in asimilar manner to the Company’s 2007 Omnibus Incentive Plan, and no further equity awards will be issued under any of the Assumed Plans. The 2007Omnibus Incentive Plan provides for the grant of stock options, stock appreciation rights, RSUs, restricted stock, PSUs or any other stock-based award andcash based awards. A total of approximately 127 million shares of Danaher common stock have been authorized for issuance under the 2007 OmnibusIncentive Plan. As of December 31, 2017, approximately 70 million shares of the Company’s common stock remain available for issuance under the 2007Omnibus Incentive Plan.
Stock options granted under the 2007 Omnibus Incentive Plan generally vest pro rata over a five-year period and terminate 10 years from the grant date,though the specific terms of each grant are determined by the Compensation Committee of the Company’s Board (the “Compensation Committee”). TheCompany’s executive officers and certain other employees have been awarded options with different vesting criteria, and options granted to outside directorsare fully vested as of the grant date. Option exercise prices for options granted by the Company equal the closing price of the Company’s common stock onthe NYSE on the date of grant. In connection with the Company’s assumption of options issued pursuant to the Assumed Plans, the number of sharesunderlying each option and exercise price of each option were adjusted to reflect the substitution of the Company’s stock for the stock of the applicableacquired company.
RSUs issued under the 2007 Omnibus Incentive Plan provide for the issuance of a share of the Company’s common stock at no cost to the holder. The RSUsthat have been granted to employees under the 2007 Omnibus Incentive Plan generally provide for time-based vesting over a five-year period, althoughexecutive officers and certain other employees have been awarded RSUs with different time-based vesting criteria, and RSUs granted to members of theCompany’s senior management have also been subject to performance-based vesting criteria. The RSUs that have been granted to directors under the 2007Omnibus Incentive Plan vest on the earlier of the first anniversary of the grant date or the date of, and immediately prior to, the next annual meeting of theCompany’s shareholders following the grant date, but the underlying shares are not issued until the earlier of the director’s death or the first day of theseventh month following the director’s retirement from the Board. Prior to
101
Source: DANAHER CORP /DE/, 10-K, February 21, 2018 Powered by Morningstar® Document Research℠The information contained herein may not be copied, adapted or distributed and is not warranted to be accurate, complete or timely. The user assumes all risks for any damages or losses arising from any use of this information,except to the extent such damages or losses cannot be limited or excluded by applicable law. Past financial performance is no guarantee of future results.

Table of Contents
vesting, RSUs granted under the 2007 Omnibus Incentive Plan do not have dividend equivalent rights, do not have voting rights and the shares underlyingthe RSUs are not considered issued and outstanding. With respect to RSUs granted under the Assumed Plans, in connection with the Company’s assumptionof these RSUs the number of shares underlying each RSU were adjusted to reflect the substitution of the Company’s stock for the stock of the applicableacquired company, and certain of these RSUs have dividend equivalent rights.
In 2015, the Company introduced into its executive officer equity compensation program PSUs that vest based on the Company’s total shareholder returnranking relative to the S&P 500 Index over a three-year performance period and are subject to an additional two-year holding period, and are entitled todividend equivalent rights. In 2017, 2016 and 2015 one-half of the annual equity awards granted to the Company’s executive officers were granted as stockoptions, one-quarter were granted as RSUs and one-quarter were granted as PSUs. The PSUs were issued under the Company’s 2007 Omnibus Incentive Plan.
In connection with the Fortive Separation and pursuant to the anti-dilution provisions of the 2007 Omnibus Incentive Plan, the Company made certainadjustments to the exercise price and the number of shares underlying stock-based compensation awards with the intention of preserving the intrinsic valueof the awards prior to the Separation. Accordingly, the number of shares underlying each stock-based award outstanding as of the date of the Separation wasmultiplied by a factor of 1.32 and the related exercise price for stock options was divided by a factor of 1.32 which resulted in no increase in the intrinsicvalue of awards outstanding. The stock-based compensation awards continue to vest over their original vesting period. These adjustments to the Company’sstock-based compensation awards did not result in additional compensation expense. Stock-based compensation awards that were held by employees whotransferred to Fortive in connection with the Separation were canceled and replaced by awards issued by Fortive.
The equity compensation awards granted by the Company generally vest only if the employee is employed by the Company (or in the case of directors, thedirector continues to serve on the Company Board) on the vesting date or in other limited circumstances. To cover the exercise of options and vesting ofRSUs and PSUs, the Company generally issues new shares from its authorized but unissued share pool, although it may instead issue treasury shares in certaincircumstances.
The Company accounts for stock-based compensation by measuring the cost of employee services received in exchange for all equity awards granted basedon the fair value of the award as of the grant date. The Company recognizes the compensation expense over the requisite service period (which is generallythe vesting period but may be shorter than the vesting period if the employee becomes retirement eligible before the end of the vesting period). The fair valuefor RSU awards was calculated using the closing price of the Company’s common stock on the date of grant, adjusted for the fact that RSUs (other thancertain RSUs granted under the Assumed Plans) do not accrue dividends. The fair value of the PSU awards was calculated using a Monte Carlo pricing model.The fair value of the options granted was calculated using a Black-Scholes Merton option pricing model (“Black-Scholes”).
The following summarizes the assumptions used in the Black-Scholes model to value options granted during the years ended December 31:
2017 2016 2015
Risk-free interest rate 1.8 – 2.2% 1.2 – 1.8% 1.6 – 2.2%Weighted average volatility 17.9% 24.3% 24.3%Dividend yield 0.7% 0.6% 0.6%Expected years until exercise 5.0 – 8.0 5.5 – 8.0 5.5 – 8.0
The Black-Scholes model incorporates assumptions to value stock-based awards. The risk-free rate of interest for periods within the contractual life of theoption is based on a zero-coupon U.S. government instrument whose maturity period equals or approximates the option’s expected term. Expected volatilityis based on implied volatility from traded options on the Company’s stock and historical volatility of the Company’s stock. The dividend yield is calculatedby dividing the Company’s annual dividend, based on the most recent quarterly dividend rate, by the closing stock price on the grant date. To estimate theoption exercise timing used in the valuation model (which impacts the risk-free interest rate and the expected years until exercise), in addition to consideringthe vesting period and contractual term of the option, the Company analyzes and considers actual historical exercise experience for previously grantedoptions. The Company stratifies its employee population into multiple groups for option valuation and attribution purposes based upon distinctive patternsof forfeiture rates and option holding periods, as indicated by the ranges set forth in the table above for the risk-free interest rate and the expected years untilexercise.
The amount of stock-based compensation expense recognized during a period is also based on the portion of the awards that are ultimately expected to vest.The Company estimates pre-vesting forfeitures at the time of grant by analyzing historical data and
102
Source: DANAHER CORP /DE/, 10-K, February 21, 2018 Powered by Morningstar® Document Research℠The information contained herein may not be copied, adapted or distributed and is not warranted to be accurate, complete or timely. The user assumes all risks for any damages or losses arising from any use of this information,except to the extent such damages or losses cannot be limited or excluded by applicable law. Past financial performance is no guarantee of future results.

Table of Contents
revises those estimates in subsequent periods if actual forfeitures differ from those estimates. Ultimately, the total expense recognized over the vesting periodwill equal the fair value of awards that actually vest.
The following summarizes the components of the Company’s continuing operations stock-based compensation expense for the years ended December 31 ($in millions):
2017 2016 2015
RSUs/PSUs: Pretax compensation expense $ 90.2 $ 85.9 $ 69.7Income tax benefit (27.7) (25.3) (22.1)
RSU/PSU expense, net of income taxes 62.5 60.6 47.6Stock options:
Pretax compensation expense 49.2 43.9 34.1Income tax benefit (15.6) (13.6) (10.7)
Stock option expense, net of income taxes 33.6 30.3 23.4Total stock-based compensation:
Pretax compensation expense 139.4 129.8 103.8Income tax benefit (43.3) (38.9) (32.8)
Total stock-based compensation expense, net of income taxes $ 96.1 $ 90.9 $ 71.0
Stock-based compensation has been recognized as a component of selling, general and administrative expenses in the accompanying ConsolidatedStatements of Earnings. As of December 31, 2017, $130 million of total unrecognized compensation cost related to RSUs/PSUs is expected to be recognizedover a weighted average period of approximately two years. As of December 31, 2017, $117 million of total unrecognized compensation cost related to stockoptions is expected to be recognized over a weighted average period of approximately two years. Future compensation amounts will be adjusted for anychanges in estimated forfeitures.
103
Source: DANAHER CORP /DE/, 10-K, February 21, 2018 Powered by Morningstar® Document Research℠The information contained herein may not be copied, adapted or distributed and is not warranted to be accurate, complete or timely. The user assumes all risks for any damages or losses arising from any use of this information,except to the extent such damages or losses cannot be limited or excluded by applicable law. Past financial performance is no guarantee of future results.

Table of Contents
The following summarizes option activity under the Company’s stock plans (in millions, except weighted exercise price and number of years):
Options Weighted Average
Exercise Price
Weighted AverageRemaining
Contractual Term (inyears)
Aggregate IntrinsicValue
Outstanding as of January 1, 2015 (a) 30.0 $ 37.01 Granted (a) 4.1 66.64 Exercised (a) (7.8) 28.40 Cancelled/forfeited (a) (1.4) 51.55
Outstanding as of December 31, 2015 (a) 24.9 43.75 Granted 5.7 67.52 Exercised (5.3) 33.45 Cancelled/forfeited (1.2) 73.21 Adjustment due to Fortive Separation (b) (5.2) 50.44
Outstanding as of December 31, 2016 18.9 50.07 Granted 4.4 86.14 Exercised (3.3) 35.26 Cancelled/forfeited (1.2) 70.40
Outstanding as of December 31, 2017 18.8 59.84 6 $ 620.2Vested and expected to vest as of December 31, 2017 (c) 18.2 $ 59.28 6 $ 611.1Vested as of December 31, 2017 8.1 $ 43.65 4 $ 401.3
(a) The outstanding options as of December 31, 2015 and the option activity prior to December 31, 2015 (except those options canceled as part of the Separation as noted below)have been adjusted by a factor of 1.32, as noted above, due to the Separation.
(b) The “Adjustment due to Fortive Separation” reflects the cancellation of options which were outstanding as of July 2, 2016 and held by Fortive employees, which have beenconverted to Fortive options as part of the Separation.
(c) The “expected to vest” options are the net unvested options that remain after applying the forfeiture rate assumption to total unvested options.
The aggregate intrinsic value in the table above represents the total pretax intrinsic value (the difference between the Company’s closing stock price on thelast trading day of 2017 and the exercise price, multiplied by the number of in-the-money options) that would have been received by the option holders hadall option holders exercised their options on December 31, 2017. The amount of aggregate intrinsic value will change based on the price of the Company’scommon stock.
Options outstanding as of December 31, 2017 are summarized below (in millions, except price per share and number of years):
Outstanding Exercisable
Exercise Price Shares Average Exercise Price Average Remaining
Life (in years) Shares Average Exercise Price
$19.89 to $38.63 3.3 $ 30.61 2 3.3 $ 30.58$38.64 to $53.03 3.3 44.40 5 2.7 43.68$53.04 to $65.94 3.2 60.32 6 1.1 59.55$65.95 to $76.11 4.5 66.59 8 0.9 66.74$76.12 to $92.42 4.5 85.69 9 0.1 81.31
The aggregate intrinsic value of options exercised during the years ended December 31, 2017, 2016 and 2015 was $162 million, $210 million and $313million, respectively. Exercise of options during the years ended December 31, 2017, 2016 and 2015 resulted in cash receipts of $117 million, $161 million,and $223 million, respectively. Upon exercise of the award by the employee, the Company derives a tax deduction measured by the excess of the marketvalue over the grant price at the date of exercise. The Company realized a tax benefit of $50 million, $61 million, and $101 million in 2017, 2016 and 2015,respectively, related to the exercise of employee stock options.
104
Source: DANAHER CORP /DE/, 10-K, February 21, 2018 Powered by Morningstar® Document Research℠The information contained herein may not be copied, adapted or distributed and is not warranted to be accurate, complete or timely. The user assumes all risks for any damages or losses arising from any use of this information,except to the extent such damages or losses cannot be limited or excluded by applicable law. Past financial performance is no guarantee of future results.

Table of Contents
The following summarizes information on unvested RSU and PSU activity (in millions, except weighted average grant-date fair value):
Number of RSUs/PSUs
Weighted AverageGrant-DateFair Value
Unvested as of January 1, 2015 (a) 6.1 $ 45.18Granted (a) 2.9 65.66Vested (a) (2.1) 45.00Forfeited (a) (0.8) 52.56
Unvested as of December 31, 2015 (a) 6.1 53.93Granted 1.9 66.15Vested (1.8) 50.64Adjustment due to Fortive Separation (b) (1.2) 58.24Forfeited (0.5) 28.79
Unvested as of December 31, 2016 4.5 62.16Granted 1.4 86.04Vested (1.5) 58.48Forfeited (0.5) 68.83
Unvested as of December 31, 2017 3.9 71.27(a) The unvested RSUs and PSUs as of December 31, 2015 and the RSU and PSU activity in the periods prior to December 31, 2015 (except those RSUs and PSUs canceled as
part of the Separation as noted below) have been adjusted by a factor of 1.32, as noted above, due to the Separation.(b) The “Adjustment due to Fortive Separation” reflects the cancellation of RSUs and PSUs which were outstanding as of July 2, 2016 and held by Fortive employees which have
been converted to Fortive RSUs and PSUs as part of the Separation.
The Company realized a tax benefit of $35 million, $38 million and $46 million in the years ended December 31, 2017, 2016 and 2015, respectively, relatedto the vesting of RSUs.
Prior to the to the adoption of ASU 2016-09, the difference between the actual tax benefit realized upon exercise and the tax benefit recorded based on thefair value of the stock award at the time of grant (the “excess tax benefits”) was recorded as an increase to additional paid-in capital and was reflected as afinancing cash flow. As a result of the adoption of ASU 2016-09, the excess tax benefit of $55 million related to the exercise of employee stock options andvesting of RSUs for the year ended December 31, 2017 has been recorded as a reduction to the current income tax provision and is reflected as an operatingcash inflow in the accompanying Consolidated Statement of Cash Flows.
In connection with the exercise of certain stock options and the vesting of RSUs previously issued by the Company, a number of shares sufficient to fundstatutory minimum tax withholding requirements has been withheld from the total shares issued or released to the award holder (though under the terms of theapplicable plan, the shares are considered to have been issued and are not added back to the pool of shares available for grant). During the year endedDecember 31, 2017, 600 thousand shares with an aggregate value of $47 million were withheld to satisfy the requirement. During the year endedDecember 31, 2016, 668 thousand shares with an aggregate value of $48 million were withheld to satisfy the requirement. The withholding is treated as areduction in additional paid-in capital in the accompanying Consolidated Statements of Stockholders’ Equity.
NOTE 18. NET EARNINGS PER SHARE FROM CONTINUING OPERATIONSBasic net earnings per share (“EPS”) from continuing operations is calculated by dividing net earnings from continuing operations by the weighted averagenumber of common shares outstanding for the applicable period. Diluted net EPS from continuing operations is computed based on the weighted averagenumber of common shares outstanding increased by the number of additional shares that would have been outstanding had the potentially dilutive commonshares been issued and reduced by the number of shares the Company could have repurchased with the proceeds from the issuance of the potentially dilutiveshares. For the years ended December 31, 2017, 2016 and 2015, 4 million, 1 million and 2 million options to purchase shares, respectively, were not includedin the diluted earnings per share calculation as the impact of their inclusion would have been anti-dilutive.
105
Source: DANAHER CORP /DE/, 10-K, February 21, 2018 Powered by Morningstar® Document Research℠The information contained herein may not be copied, adapted or distributed and is not warranted to be accurate, complete or timely. The user assumes all risks for any damages or losses arising from any use of this information,except to the extent such damages or losses cannot be limited or excluded by applicable law. Past financial performance is no guarantee of future results.

Table of Contents
Information related to the calculation of net earnings from continuing operations per share of common stock is summarized as follows ($ and shares inmillions, except per share amounts):
Net Earnings fromContinuing Operations
(Numerator) Shares
(Denominator) Per Share Amount
For the year ended December 31, 2017 Basic EPS $ 2,469.8 695.8 $ 3.55Adjustment for interest on convertible debentures 2.1 — Incremental shares from assumed exercise of dilutive options and vesting of dilutiveRSUs and PSUs — 7.5 Incremental shares from assumed conversion of the convertible debentures — 2.8 Diluted EPS $ 2,471.9 706.1 $ 3.50
For the year ended December 31, 2016 Basic EPS $ 2,153.4 691.2 $ 3.12Adjustment for interest on convertible debentures 1.8 — Incremental shares from assumed exercise of dilutive options and vesting of dilutiveRSUs and PSUs — 6.0 Incremental shares from assumed conversion of the convertible debentures — 2.6 Diluted EPS $ 2,155.2 699.8 $ 3.08
For the year ended December 31, 2015 Basic EPS $ 1,746.7 698.1 $ 2.50Adjustment for interest on convertible debentures 2.2 — Incremental shares from assumed exercise of dilutive options and vesting of dilutiveRSUs and PSUs — 7.7 Incremental shares from assumed conversion of the convertible debentures — 2.7 Diluted EPS $ 1,748.9 708.5 $ 2.47
106
Source: DANAHER CORP /DE/, 10-K, February 21, 2018 Powered by Morningstar® Document Research℠The information contained herein may not be copied, adapted or distributed and is not warranted to be accurate, complete or timely. The user assumes all risks for any damages or losses arising from any use of this information,except to the extent such damages or losses cannot be limited or excluded by applicable law. Past financial performance is no guarantee of future results.

Table of Contents
NOTE 19. SEGMENT INFORMATIONThe Company operates and reports its results in four separate business segments consisting of the Life Sciences, Diagnostics, Dental and Environmental &Applied Solutions segments. When determining the reportable segments, the Company aggregated operating segments based on their similar economic andoperating characteristics. Operating profit represents total revenues less operating expenses, excluding other expense, interest and income taxes. Theidentifiable assets by segment are those used in each segment’s operations. Inter-segment amounts are not significant and are eliminated to arrive atconsolidated totals.
Detailed segment data for the years ended December 31 is as follows ($ in millions):
2017 2016 2015
Sales: Life Sciences $ 5,710.1 $ 5,365.9 $ 3,314.6Diagnostics 5,839.9 5,038.3 4,832.5Dental 2,810.9 2,785.4 2,736.8Environmental & Applied Solutions 3,968.8 3,692.8 3,549.8Total $ 18,329.7 $ 16,882.4 $ 14,433.7
Operating profit: Life Sciences $ 1,004.3 $ 818.9 $ 329.2Diagnostics 871.6 786.4 746.2Dental 400.7 419.4 370.4Environmental & Applied Solutions 914.6 870.0 866.6Other (170.0) (143.8) (150.2)Total $ 3,021.2 $ 2,750.9 $ 2,162.2
Identifiable assets: Life Sciences $ 20,576.8 $ 19,875.9 $ 19,658.4Diagnostics 14,359.2 14,159.6 9,848.2Dental 6,026.8 5,772.2 5,906.9Environmental & Applied Solutions 4,649.2 4,172.9 4,223.5Other 1,036.6 1,314.7 1,309.7Discontinued operations — — 7,275.5Total $ 46,648.6 $ 45,295.3 $ 48,222.2
Depreciation and amortization: Life Sciences $ 427.9 $ 426.2 $ 210.1Diagnostics 581.5 481.5 449.7Dental 121.4 127.2 132.0Environmental & Applied Solutions 99.9 86.7 82.2Other 7.6 6.5 6.8Total $ 1,238.3 $ 1,128.1 $ 880.8
107
Source: DANAHER CORP /DE/, 10-K, February 21, 2018 Powered by Morningstar® Document Research℠The information contained herein may not be copied, adapted or distributed and is not warranted to be accurate, complete or timely. The user assumes all risks for any damages or losses arising from any use of this information,except to the extent such damages or losses cannot be limited or excluded by applicable law. Past financial performance is no guarantee of future results.

Table of Contents
2017 2016 2015
Capital expenditures, gross: Life Sciences $ 130.6 $ 109.7 $ 62.3Diagnostics 372.6 374.3 336.8Dental 48.9 49.1 53.3Environmental & Applied Solutions 60.9 51.0 58.4Other 6.6 5.5 2.1Total $ 619.6 $ 589.6 $ 512.9
Operations in Geographical Areas:
For the Year Ended December 31
($ in millions) 2017 2016 2015
Sales: United States $ 6,837.9 $ 6,377.4 $ 5,678.3China 2,011.6 1,799.1 1,552.9Germany 1,161.6 1,084.6 858.4Japan 872.1 864.7 668.5All other (each country individually less than 5% of total sales) 7,446.5 6,756.6 5,675.6Total $ 18,329.7 $ 16,882.4 $ 14,433.7
Property, plant and equipment, net: United States $ 1,126.2 $ 1,198.4 $ 1,189.6Germany 212.4 190.8 192.9United Kingdom 152.0 140.6 165.5All other (each country individually less than 5% of total property, plant and equipment,net) 964.0 824.2 754.7Total $ 2,454.6 $ 2,354.0 $ 2,302.7
Sales by Major Product Group:
For the Year Ended December 31
($ in millions) 2017 2016 2015
Analytical and physical instrumentation $ 2,232.9 $ 2,088.9 $ 2,014.4Research and medical products 11,512.4 10,366.7 8,110.9Dental products 2,810.9 2,785.4 2,736.8Product identification 1,773.5 1,641.4 1,571.6Total $ 18,329.7 $ 16,882.4 $ 14,433.7
108
Source: DANAHER CORP /DE/, 10-K, February 21, 2018 Powered by Morningstar® Document Research℠The information contained herein may not be copied, adapted or distributed and is not warranted to be accurate, complete or timely. The user assumes all risks for any damages or losses arising from any use of this information,except to the extent such damages or losses cannot be limited or excluded by applicable law. Past financial performance is no guarantee of future results.

Table of Contents
NOTE 20. QUARTERLY DATA-UNAUDITED
($ in millions, except per share data) 1st Quarter 2nd Quarter 3rd Quarter 4th Quarter 2017: Sales $ 4,205.7 $ 4,510.1 $ 4,528.2 $ 5,085.7 Gross profit 2,334.3 2,482.3 2,536.8 2,839.1 Operating profit 623.9 683.7 767.5 946.1 Net earnings from continuing operations 483.8 557.3 572.1 856.6 Net earnings from discontinued operations 22.3 — — — Net earnings 506.1 557.3 572.1 856.6 Net earnings per share from continuing operations:
Basic $ 0.70 $ 0.80 $ 0.82 $ 1.23 Diluted $ 0.69 $ 0.79 $ 0.81 $ 1.21
Net earnings per share from discontinued operations: Basic $ 0.03 $ — $ — $ — Diluted $ 0.03 $ — $ — $ —
Net earnings per share: Basic $ 0.73 $ 0.80 $ 0.82 $ 1.23 Diluted $ 0.72 $ 0.79 $ 0.81 $ 1.21
2016: Sales $ 3,924.1 $ 4,241.9 $ 4,132.1 $ 4,584.3 Gross profit 2,167.3 2,381.3 2,286.0 2,500.0 Operating profit 613.1 710.1 699.1 728.6 Net earnings from continuing operations 585.8 418.0 402.6 747.0 Net earnings (loss) from discontinued operations 172.6 238.7 (11.0) — Net earnings 758.4 656.7 391.6 747.0 Net earnings per share from continuing operations:
Basic $ 0.85 $ 0.60 $ 0.58 $ 1.08 **Diluted $ 0.84 $ 0.60 $ 0.57 $ 1.07
Net earnings (loss) per share from discontinued operations: Basic $ 0.25 $ 0.35 $ (0.02) $ — Diluted $ 0.25 $ 0.34 $ (0.02) $ — Net earnings per share:
Basic $ 1.10 $ 0.95 $ 0.57 * $ 1.08 **Diluted $ 1.09 $ 0.94 $ 0.56 * $ 1.07 **
* Net earnings per share amounts do not add due to rounding.** Net earnings per share amounts do not add across to the full year amount due to rounding.
109
Source: DANAHER CORP /DE/, 10-K, February 21, 2018 Powered by Morningstar® Document Research℠The information contained herein may not be copied, adapted or distributed and is not warranted to be accurate, complete or timely. The user assumes all risks for any damages or losses arising from any use of this information,except to the extent such damages or losses cannot be limited or excluded by applicable law. Past financial performance is no guarantee of future results.

Table of Contents
ITEM 9. CHANGES IN AND DISAGREEMENTS WITH ACCOUNTANTS ON ACCOUNTING AND FINANCIAL DISCLOSURENot applicable.
ITEM 9A. CONTROLS AND PROCEDURESThe Company’s management, with the participation of the Company’s President and Chief Executive Officer, and Executive Vice President and ChiefFinancial Officer, has evaluated the effectiveness of the Company’s disclosure controls and procedures (as such term is defined in Rules 13a-15(e) and 15d-15(e) under the Securities Exchange Act of 1934, as amended (the “Exchange Act”)) as of the end of the period covered by this report. Based on suchevaluation, the Company’s President and Chief Executive Officer, and Executive Vice President and Chief Financial Officer, have concluded that, as of theend of such period, the Company’s disclosure controls and procedures were effective.
Management’s annual report on its internal control over financial reporting (as such term is defined in Rules 13a-15(f) and 15d-15(f) under the Exchange Act)and the independent registered public accounting firm’s audit report on the effectiveness of Danaher’s internal control over financial reporting are includedin the Company’s financial statements for the year ended December 31, 2017 included in Item 8 of this Annual Report on Form 10-K, under the headings“Report of Management on Danaher Corporation’s Internal Control Over Financial Reporting” and “Report of Independent Registered Public AccountingFirm,” respectively, and are incorporated herein by reference.
There have been no changes in the Company’s internal control over financial reporting that occurred during the Company’s most recent completed quarterthat have materially affected, or are reasonably likely to materially affect, the Company’s internal control over financial reporting.
ITEM 9B. OTHER INFORMATIONNot applicable.
PART III
ITEM 10. DIRECTORS, EXECUTIVE OFFICERS AND CORPORATE GOVERNANCEOther than the information below, the information required by this Item is incorporated by reference from the sections entitled Proposal 1–Election ofDirectors of Danaher, Corporate Governance and Other Information–Section 16(a) Beneficial Ownership Reporting Compliance in the Proxy Statement forthe Company’s 2018 annual meeting of shareholders and from the information under the caption “Executive Officers of the Registrant” in Part I hereof. Nonominee for director was selected pursuant to any arrangement or understanding between the nominee and any person other than the Company pursuant towhich such person is or was to be selected as a director or nominee.
Code of Ethics
Danaher has adopted a code of business conduct and ethics for directors, officers (including Danaher’s principal executive officer, principal financial officerand principal accounting officer) and employees, known as the Standards of Conduct. The Standards of Conduct is available in the “Investors – CorporateGovernance” section of Danaher’s website at www.danaher.com.
Danaher intends to disclose any amendment to the Standards of Conduct that relates to any element of the code of ethics definition enumerated inItem 406(b) of Regulation S-K, and any waiver from a provision of the Standards of Conduct granted to any director, principal executive officer, principalfinancial officer, principal accounting officer, or any of its other executive officers, in the “Investors – Corporate Governance” section of its website, atwww.danaher.com, within four business days following the date of such amendment or waiver.
ITEM 11. EXECUTIVE COMPENSATIONThe information required by this Item is incorporated by reference from the sections entitled Director Compensation, Compensation Discussion andAnalysis, Compensation Committee Report, Compensation Tables and Information and Summary of Employment Agreements and Plans in the ProxyStatement for the Company’s 2018 annual meeting of shareholders (provided that the Compensation Committee Report shall not be deemed to be “filed”).
110
Source: DANAHER CORP /DE/, 10-K, February 21, 2018 Powered by Morningstar® Document Research℠The information contained herein may not be copied, adapted or distributed and is not warranted to be accurate, complete or timely. The user assumes all risks for any damages or losses arising from any use of this information,except to the extent such damages or losses cannot be limited or excluded by applicable law. Past financial performance is no guarantee of future results.

Table of Contents
ITEM 12. SECURITY OWNERSHIP OF CERTAIN BENEFICIAL OWNERS AND MANAGEMENT AND RELATED STOCKHOLDER MATTERSThe information required by this Item is incorporated by reference from the sections entitled Beneficial Ownership of Danaher Common Stock by Directors,Officers and Principal Shareholders, Summary of Employment Agreements and Plans and Compensation Tables and Information in the Proxy Statementfor the Company’s 2018 annual meeting of shareholders.
ITEM 13. CERTAIN RELATIONSHIPS AND RELATED TRANSACTIONS, AND DIRECTOR INDEPENDENCEThe information required by this Item is incorporated by reference from the sections entitled Director Independence and Related Person Transactions in theProxy Statement for the Company’s 2018 annual meeting of shareholders.
ITEM 14. PRINCIPAL ACCOUNTANT FEES AND SERVICESThe information required by this Item is incorporated by reference from the section entitled Proposal 2–Ratification of Independent Registered PublicAccounting Firm in the Proxy Statement for the Company’s 2018 annual meeting of shareholders.
111
Source: DANAHER CORP /DE/, 10-K, February 21, 2018 Powered by Morningstar® Document Research℠The information contained herein may not be copied, adapted or distributed and is not warranted to be accurate, complete or timely. The user assumes all risks for any damages or losses arising from any use of this information,except to the extent such damages or losses cannot be limited or excluded by applicable law. Past financial performance is no guarantee of future results.

Table of Contents
PART IV
ITEM 15. EXHIBITS AND FINANCIAL STATEMENT SCHEDULESa) The following documents are filed as part of this report.
(1) Financial Statements. The financial statements are set forth under “Item 8. Financial Statements and Supplementary Data” of this Annual Report onForm 10-K.
(2) Schedules. An index of Exhibits and Schedules is on page 113 of this report. Schedules other than those listed below have been omitted from thisAnnual Report on Form 10-K because they are not required, are not applicable or the required information is included in the financial statements orthe notes thereto.
(3) Exhibits. The exhibits listed in the accompanying Exhibit Index are filed or incorporated by reference as part of this Annual Report on Form 10-K.
ITEM 16. FORM 10-K SUMMARYNot applicable.
112
Source: DANAHER CORP /DE/, 10-K, February 21, 2018 Powered by Morningstar® Document Research℠The information contained herein may not be copied, adapted or distributed and is not warranted to be accurate, complete or timely. The user assumes all risks for any damages or losses arising from any use of this information,except to the extent such damages or losses cannot be limited or excluded by applicable law. Past financial performance is no guarantee of future results.

Table of Contents
DANAHER CORPORATIONINDEX TO FINANCIAL STATEMENTS, SUPPLEMENTARY DATA AND FINANCIAL STATEMENT SCHEDULE
Page Number in
Form 10-K
Schedule: Valuation and Qualifying Accounts 121
EXHIBIT INDEX
Exhibit Number Description
2.1
Separation and Distribution Agreement, dated as of July 1,2016, by and between Danaher Corporation and FortiveCorporation +
Incorporated by reference to Exhibit 2.1 to Amendment No. 1 toFortive Corporation’s Registration Statement on Form 10, filedon March 3, 2016 (Commission File Number: 1-8089)
3.1
Restated Certificate of Incorporation of Danaher Corporation
Incorporated by reference from Exhibit 3.1 to DanaherCorporation’s Quarterly Report on Form 10-Q for the quarterended June 29, 2012 (Commission File Number: 1-8089)
3.2
Amended and Restated By-laws of Danaher Corporation
Incorporated by reference from Exhibit 3.2 to DanaherCorporation’s Current Report on Form 8-K filed December 6,2016 (Commission File Number: 1-8089)
4.1
Senior Indenture dated as of December 11, 2007 by andbetween Danaher Corporation and The Bank of New York TrustCompany, N.A. as trustee (“Senior Indenture”)
Incorporated by reference from Exhibit 1.2 to DanaherCorporation’s Current Report on Form 8-K filed on December 11,2007 (Commission File Number: 1-8089)
4.2
Supplemental Indenture to Senior Indenture, dated as ofSeptember 15, 2015, by and between Danaher Corporation andThe Bank of New York Mellon Trust Company, N.A. as trusteerelating to the 1.650% Senior Notes due 2018, 2.400% SeniorNotes due 2020, 3.350% Senior Notes due 2025 and 4.375%Senior Notes due 2045
Incorporated by reference from Exhibit 4.1 to DanaherCorporation’s Current Report on Form 8-K filed September 15,2015 (Commission File Number: 1-8089)
4.3
Indenture dated as of July 8, 2015, by and between DanaherCorporation, as guarantor, DH Europe Finance S.A., as issuer,and The Bank of New York Mellon Trust Company, N.A. astrustee (“Danaher International Indenture”)
Incorporated by reference from Exhibit 4.1 to DanaherCorporation’s Current Report on Form 8-K filed on July 8, 2015(Commission File Number: 1-8089)
4.4
First Supplemental Indenture to Danaher InternationalIndenture, dated as of July 8, 2015, by and between DanaherCorporation, as guarantor, DH Europe Finance S.A., as issuer,and The Bank of New York Mellon Trust Company, N.A. astrustee relating to the Floating Rate Senior Notes due 2017, the1.000% Senior Notes due 2019, the 1.700% Senior Notes due2022 and the 2.500% Senior Notes due 2025
Incorporated by reference from Exhibit 4.2 to DanaherCorporation’s Current Report on Form 8-K filed on July 8, 2015(Commission File Number: 1-8089)
113
Source: DANAHER CORP /DE/, 10-K, February 21, 2018 Powered by Morningstar® Document Research℠The information contained herein may not be copied, adapted or distributed and is not warranted to be accurate, complete or timely. The user assumes all risks for any damages or losses arising from any use of this information,except to the extent such damages or losses cannot be limited or excluded by applicable law. Past financial performance is no guarantee of future results.

Table of Contents
4.5
Paying and Calculation Agency Agreement, dated as of July 8,2015, by and among Danaher International, DanaherCorporation, and The Bank of New York Mellon, LondonBranch, as paying and calculation agent
Incorporated by reference from Exhibit 4.3 to DanaherCorporation’s Current Report on Form 8-K filed on July 8, 2015(Commission File Number: 1-8089)
4.6
Second Supplemental Indenture to Danaher InternationalIndenture, dated as of June 30, 2017, by and between DanaherCorporation, as guarantor, DH Europe Finance S.A., as issuer,and The Bank of New York Mellon Trust Company, N.A. astrustee relating to the Floating Rate Senior Notes due 2022 andthe 1.200% Senior Notes due 2027
Incorporated by reference from Exhibit 4.2 to DanaherCorporation’s Current Report on Form 8-K filed on June 30,2017 (Commission File Number: 1-8089)
4.7
Paying and Calculation Agency Agreement, dated as of June30, 2017, by and among Danaher International, DanaherCorporation, The Bank of New York Mellon Trust Company,N.A. as trustee and The Bank of New York Mellon, LondonBranch, as paying and calculation agent
Incorporated by reference from Exhibit 4.3 to DanaherCorporation’s Current Report on Form 8-K filed on June 30,2017 (Commission File Number: 1-8089)
10.1
Danaher Corporation 2007 Omnibus Incentive Plan, asamended and restated*
Incorporated by reference from Exhibit 10.1 to DanaherCorporation’s Quarterly Report on Form 10-Q for the quarterended June 30, 2017 (Commission File Number: 333-213631)
10.2
Danaher Corporation Non-Employee Directors’ DeferredCompensation Plan, as amended, a sub-plan under the 2007Omnibus Incentive Plan*
Incorporated by reference from Exhibit 10.2 to DanaherCorporation’s Annual Report on Form 10-K for the year endedDecember 31, 2008 (Commission File Number: 1-8089)
10.3
Amended Form of Election to Defer under the DanaherCorporation Non-Employee Directors’ Deferred CompensationPlan*
Incorporated by reference from Exhibit 10.3 to DanaherCorporation’s Annual Report on Form 10-K for the year endedDecember 31, 2008 (Commission File Number: 1-8089)
10.4
Form of Danaher Corporation 2007 Omnibus Incentive PlanStock Option Agreement for Non-Employee Directors*
Incorporated by reference from Exhibit 10.3 to DanaherCorporation’s Quarterly Report on Form 10-Q for the quarterended June 30, 2017 (Commission File Number: 1-8089)
10.5
Form of Danaher Corporation 2007 Omnibus Incentive PlanRSU Agreement for Non-Employee Directors*
Incorporated by reference from Exhibit 10.4 to DanaherCorporation’s Quarterly Report on Form 10-Q for the quarterended June 30, 2017 (Commission File Number: 1-8089)
10.6
Form of Danaher Corporation 2007 Omnibus Incentive PlanStock Option Agreement*
Incorporated by reference from Exhibit 10.5 to DanaherCorporation’s Quarterly Report on Form 10-Q for the quarterended June 30, 2017 (Commission File Number: 1-8089)
10.7
Form of Danaher Corporation 2007 Omnibus Incentive PlanRSU Agreement*
Incorporated by reference from Exhibit 10.6 to DanaherCorporation’s Quarterly Report on Form 10-Q for the quarterended June 30, 2017 (Commission File Number: 1-8089)
114
Source: DANAHER CORP /DE/, 10-K, February 21, 2018 Powered by Morningstar® Document Research℠The information contained herein may not be copied, adapted or distributed and is not warranted to be accurate, complete or timely. The user assumes all risks for any damages or losses arising from any use of this information,except to the extent such damages or losses cannot be limited or excluded by applicable law. Past financial performance is no guarantee of future results.

Table of Contents
10.8
Form of Danaher Corporation 2007 Omnibus Incentive PlanPerformance Stock Unit Agreement*
Incorporated by reference from Exhibit 10.7 to DanaherCorporation’s Quarterly Report on Form 10-Q for the quarterended June 30, 2017 (Commission File Number: 1-8089)
10.9
Danaher Corporation & Subsidiaries Amended and RestatedExecutive Deferred Incentive Program*
Incorporated by reference from Exhibit 4.1 to DanaherCorporation’s Registration Statement on Form S-8 filed onSeptember 14, 2016 (Commission File Number: 333-213631)
10.10
Danaher Corporation 2007 Executive Cash IncentiveCompensation Plan, as amended and restated*
Incorporated by reference from Appendix B to DanaherCorporation’s 2017 Proxy Statement on Schedule 14A filed onMarch 31, 2017 (Commission File Number: 1-8089)
10.11
Danaher Corporation Senior Leader Severance Pay Plan*
Incorporated by reference from Exhibit 10.1 to DanaherCorporation’s Quarterly Report on Form 10-Q for the quarterended March 29, 2013 (Commission File Number: 1-8089)
10.12
Agreement Regarding Competition and Protection ofProprietary Interests by and between Danaher Corporation andThomas P. Joyce, Jr., dated March 16, 2009* (1)
Incorporated by reference from Exhibit 10.16 to DanaherCorporation’s Annual Report on Form 10-K for the year endedDecember 31, 2014 (Commission File Number: 1-8089)
10.13
Amendment to Agreement Regarding Competition andProtection of Proprietary Interests by and between DanaherCorporation and Thomas P. Joyce, Jr., dated September 11,2014*
Incorporated by reference from Exhibit 10.1 to DanaherCorporation’s Current Report on Form 8-K filed on September15, 2014 (Commission File Number: 1-8089)
10.14
Agreement Regarding Competition and Protection ofProprietary Interests by and between Danaher Corporation andAngela S. Lalor dated March 23, 2012*
Incorporated by reference from Exhibit 10.16 to DanaherCorporation’s Annual Report on Form 10-K for the year endedDecember 31, 2016 (Commission File Number: 1-8089)
10.15
Letter Agreement by and between Danaher Corporation andAngela S. Lalor, dated March 19, 2012*
Incorporated by reference from Exhibit 10.14 to DanaherCorporation’s Annual Report on Form 10-K for the year endedDecember 31, 2012 (Commission File Number: 1-8089)
10.16
Agreement Regarding Competition and Protection ofProprietary Interests by and between Danaher Corporation andRainer Blair, dated May 2, 2010*
Incorporated by reference from Exhibit 10.20 to DanaherCorporation’s Annual Report on Form 10-K for the year endedDecember 31, 2016 (Commission File Number: 1-8089)
10.17
Description of compensation arrangements for non-management directors*
115
Source: DANAHER CORP /DE/, 10-K, February 21, 2018 Powered by Morningstar® Document Research℠The information contained herein may not be copied, adapted or distributed and is not warranted to be accurate, complete or timely. The user assumes all risks for any damages or losses arising from any use of this information,except to the extent such damages or losses cannot be limited or excluded by applicable law. Past financial performance is no guarantee of future results.
Table of Contents
10.18
Credit Agreement, dated as of July 10, 2015, among DanaherCorporation, Bank of America, N.A., as Administrative Agentand a Swing Line lender, Citibank, N.A. as Syndication Agent,Merrill Lynch, Pierce, Fenner & Smith Incorporated, CitigroupGlobal Markets Inc., The Bank Of Tokyo - Mitsubishi UFJ,Ltd., BNP Paribas Securities Corp., US Bank NationalAssociation, HSBC Securities (USA) Inc. and Wells FargoSecurities, LLC as Joint Lead Arrangers and Joint BookManagers, and the other lenders referred to therein
Incorporated by reference from Exhibit 10.1 to DanaherCorporation’s Current Report on Form 8-K filed on July 10, 2015(Commission File Number: 1-8089)
10.19
Credit Agreement, dated as of October 24, 2016, amongDanaher Corporation, Morgan Stanley Senior Funding, Inc. asAdministrative Agent, Sole Lead Arranger and SoleBookrunner, and the other lenders referred to therein
Incorporated by reference from Exhibit 10.1 to DanaherCorporation’s Current Report on Form 8-K filed on October 24,2016 (Commission File Number: 1-8089)
10.20
Management Agreement dated February 23, 2012 by andbetween FJ900, Inc. and Joust Capital III, LLC (2)
Incorporated by reference from Exhibit 10.25 to DanaherCorporation’s Annual Report on Form 10-K for the year endedDecember 31, 2011 (Commission File Number: 1-8089)
10.21
Interchange Agreement dated July 22, 2011 by and betweenDanaher Corporation and Joust Capital III, LLC (3)
Incorporated by reference from Exhibit 10.10 to DanaherCorporation’s Quarterly Report on Form 10-Q for the quarterended July 1, 2011 (Commission File Number: 1-8089)
10.22
Aircraft Time Sharing Agreement by and between DanaherCorporation and Thomas P. Joyce, Jr., dated May 7, 2014* (4)
Incorporated by reference from Exhibit 10.2 to DanaherCorporation’s Quarterly Report on Form 10-Q for the quarterended June 27, 2014 (Commission File Number: 1-8089)
10.23
Amendment No. 1 to Aircraft Time Sharing Agreement by andbetween Danaher Corporation and Thomas P. Joyce, Jr., datedJuly 1, 2016* (4)
Incorporated by reference from Exhibit 10.7 to DanaherCorporation’s Quarterly Report on Form 10-Q for the quarterended July 1, 2016 (Commission File Number: 1-8089)
10.24
Form of Director and Officer Indemnification Agreement
Incorporated by reference from Exhibit 10.35 to DanaherCorporation’s Annual Report on Form 10-K for the year endedDecember 31, 2008 (Commission File Number: 1-8089)
10.25
Employee Matters Agreement, dated as of July 1, 2016, by andbetween Danaher Corporation and Fortive Corporation
Incorporated by reference from Exhibit 10.2 to Amendment No. 1to Fortive Corporation’s Registration Statement on Form 10,filed on March 3, 2016 (Commission File Number: 1-37654)
10.26
Tax Matters Agreement, dated as of July 1, 2016, by andbetween Danaher Corporation and Fortive Corporation
Incorporated by reference from Exhibit 10.3 to Amendment No. 1to Fortive Corporation’s Registration Statement on Form 10,filed on March 3, 2016 (Commission File Number: 1-37654)
10.27
Transition Services Agreement, dated as of July 1, 2016, by andbetween Danaher Corporation and Fortive Corporation
Incorporated by reference from Exhibit 10.1 to Amendment No. 1to Fortive Corporation’s Registration Statement on Form 10,filed on March 3, 2016 (Commission File Number: 1-37654)
116
Source: DANAHER CORP /DE/, 10-K, February 21, 2018 Powered by Morningstar® Document Research℠The information contained herein may not be copied, adapted or distributed and is not warranted to be accurate, complete or timely. The user assumes all risks for any damages or losses arising from any use of this information,except to the extent such damages or losses cannot be limited or excluded by applicable law. Past financial performance is no guarantee of future results.

Table of Contents
10.28
Intellectual Property Matters Agreement, dated as of July 1,2016, by and between Danaher Corporation and FortiveCorporation
Incorporated by reference from Exhibit 10.4 to Amendment No. 1to Fortive Corporation’s Registration Statement on Form 10,filed on March 3, 2016 (Commission File Number: 1-37654)
10.29
DBS License Agreement, dated as of July 1, 2016 by andbetween Danaher Corporation and Fortive Corporation
Incorporated by reference from Exhibit 10.5 to Amendment No. 1to Fortive Corporation’s Registration Statement on Form 10,filed on March 3, 2016 (Commission File Number: 1-37654)
11.1 Computation of per-share earnings (5)
12.1 Calculation of Ratio of Earnings to Fixed Charges
21.1 Subsidiaries of Registrant
23.1 Consent of Independent Registered Public Accounting Firm
31.1
Certification of Chief Executive Officer Pursuant to Item 601(b)(31) of Regulation S-K, as adopted pursuant to Section 302 ofthe Sarbanes-Oxley Act of 2002
31.2
Certification of Chief Financial Officer Pursuant to Item 601(b)(31) of Regulation S-K, as adopted pursuant to Section 302 ofthe Sarbanes-Oxley Act of 2002
32.1
Certification of Chief Executive Officer, Pursuant to 18 U.S.C.Section 1350, as adopted pursuant to Section 906 of theSarbanes-Oxley Act of 2002
32.2
Certification of Chief Financial Officer, Pursuant to 18 U.S.C.Section 1350, as adopted pursuant to Section 906 of theSarbanes-Oxley Act of 2002
101.INS XBRL Instance Document (6)
101.SCH XBRL Taxonomy Extension Schema Document (6)
101.CAL
XBRL Taxonomy Extension Calculation Linkbase Document(6)
101.DEF XBRL Taxonomy Extension Definition Linkbase Document (6)
101.LAB XBRL Taxonomy Extension Label Linkbase Document (6)
101.PRE
XBRL Taxonomy Extension Presentation Linkbase Document(6)
117
Source: DANAHER CORP /DE/, 10-K, February 21, 2018 Powered by Morningstar® Document Research℠The information contained herein may not be copied, adapted or distributed and is not warranted to be accurate, complete or timely. The user assumes all risks for any damages or losses arising from any use of this information,except to the extent such damages or losses cannot be limited or excluded by applicable law. Past financial performance is no guarantee of future results.

Table of Contents
Danaher is a party to additional long-term debt instruments under which, in each case, the total amount of debt authorized does not exceed 10% of the totalassets of Danaher and its subsidiaries on a consolidated basis. Pursuant to paragraph 4(iii)(A) of Item 601(b) of Regulation S-K, Danaher agrees to furnish acopy of such instruments to the Securities and Exchange Commission upon request.
+ The schedules have been omitted from this filing pursuant to Item 601(b)(2) of Regulation S-K. Danaher will furnish copies of such schedules to the Securities
and Exchange Commission upon request. * Indicates management contract or compensatory plan, contract or arrangement.
(1) In accordance with Instruction 2 to Item 601(a)(4) of Regulation S-K, Danaher has entered into agreements with each of Daniel L. Comas and William K.
Daniel II that are substantially identical in all material respects to the form of agreement referenced as Exhibit 10.12 except as to the name of the counterparty.
(2) In accordance with Instruction 2 to Item 601(a)(4) of Regulation S-K, FJ900, Inc. (a subsidiary of Danaher) has entered into a management agreement withJoust Capital II, LLC that is substantially identical in all material respects to the form of agreement referenced as Exhibit 10.20, except as to the referencedaircraft and the name of the counterparty.
(3) In accordance with Instruction 2 to Item 601(a)(4) of Regulation S-K, Danaher Corporation or a subsidiary thereof has entered into additional interchangeagreements with each of Joust Capital II, LLC and Joust Capital III, LLC that are substantially identical in all material respects to the form of agreement attachedas 10.21, except as to the referenced aircraft and, in certain cases, the name of the counterparty.
(4) In accordance with Instruction 2 to Item 601(a)(4) of Regulation S-K, Danaher Corporation has entered into an aircraft time sharing agreement and relatedamendment with Daniel L. Comas that are substantially identical in all material respects to the forms of agreement referenced as Exhibit 10.22 and Exhibit10.23, respectively, except as to the name of the counterparty.
(5) Refer to Note 18, “Net Earnings Per Share from Continuing Operations”, to the Consolidated Financial Statements.
(6) Attached as Exhibit 101 to this report are the following documents formatted in XBRL (Extensible Business Reporting Language): (i) Consolidated BalanceSheets as of December 31, 2017 and 2016, (ii) Consolidated Statements of Earnings for the years ended December 31, 2017, 2016 and 2015, (iii) ConsolidatedStatements of Comprehensive Income for the years ended December 31, 2017, 2016 and 2015, (iv) Consolidated Statements of Stockholders’ Equity for theyears December 31, 2017, 2016 and 2015, (v) Consolidated Statements of Cash Flows for the years ended December 31, 2017, 2016 and 2015 and (vi) Notesto Consolidated Financial Statements.
118
Source: DANAHER CORP /DE/, 10-K, February 21, 2018 Powered by Morningstar® Document Research℠The information contained herein may not be copied, adapted or distributed and is not warranted to be accurate, complete or timely. The user assumes all risks for any damages or losses arising from any use of this information,except to the extent such damages or losses cannot be limited or excluded by applicable law. Past financial performance is no guarantee of future results.

Table of Contents
SIGNATURESPursuant to the requirements of Section 13 or 15(d) of the Securities Exchange Act of 1934, the Registrant has duly caused this report to be signed on itsbehalf by the undersigned, thereunto duly authorized.
DANAHER CORPORATION
Date: February 20, 2018 By: /s/ THOMAS P. JOYCE, JR. Thomas P. Joyce, Jr. President and Chief Executive Officer
Pursuant to the requirements of the Securities Exchange Act of 1934, this annual report has been signed below by the following persons on behalf of theRegistrant and in the capacities and on the date indicated:
Name, Title and Signature Date
/s/ STEVEN M. RALES February 20, 2018 Steven M. Rales Chairman of the Board
/s/ MITCHELL P. RALES February 20, 2018 Mitchell P. Rales Chairman of the Executive Committee
/s/ DONALD J. EHRLICH February 20, 2018 Donald J. Ehrlich Director
/s/ LINDA HEFNER FILLER February 20, 2018 Linda Hefner Filler Director
/s/ THOMAS P. JOYCE, JR. February 20, 2018 Thomas P. Joyce, Jr. President, Chief Executive Officer and Director
/s/ TERI LIST-STOLL February 20, 2018 Teri List-Stoll Director
/s/ WALTER G. LOHR, JR. February 20, 2018 Walter G. Lohr, Jr. Director
/s/ JOHN T. SCHWIETERS February 20, 2018 John T. Schwieters
Director
119
Source: DANAHER CORP /DE/, 10-K, February 21, 2018 Powered by Morningstar® Document Research℠The information contained herein may not be copied, adapted or distributed and is not warranted to be accurate, complete or timely. The user assumes all risks for any damages or losses arising from any use of this information,except to the extent such damages or losses cannot be limited or excluded by applicable law. Past financial performance is no guarantee of future results.

Table of Contents
/s/ ALAN G. SPOON February 20, 2018 Alan G. Spoon Director
/s/ RAYMOND C. STEVENS, Ph.D. February 20, 2018 Raymond C. Stevens Director
/s/ ELIAS A. ZERHOUNI, M.D. February 20, 2018 Elias A. Zerhouni, M.D. Director
/s/ DANIEL L. COMAS February 20, 2018 Daniel L. Comas Executive Vice President and Chief Financial Officer
/s/ ROBERT S. LUTZ February 20, 2018 Robert S. Lutz Senior Vice President and Chief Accounting Officer
120
Source: DANAHER CORP /DE/, 10-K, February 21, 2018 Powered by Morningstar® Document Research℠The information contained herein may not be copied, adapted or distributed and is not warranted to be accurate, complete or timely. The user assumes all risks for any damages or losses arising from any use of this information,except to the extent such damages or losses cannot be limited or excluded by applicable law. Past financial performance is no guarantee of future results.

Table of Contents
DANAHER CORPORATION AND SUBSIDIARIESSCHEDULE II—VALUATION AND QUALIFYING ACCOUNTS
($ in millions)
Classification
Balance atBeginning of
Period (a)
Charged toCosts &Expenses
Impact ofCurrency
Charged toOther Accounts
Write-Offs,Write-Downs &
Deductions Balance at End
of Period (a)
Year ended December 31, 2017: Allowances deducted from asset account Allowance for doubtful accounts $ 103.5 $ 32.9 $ 4.5 $ 3.5 (b) $ (26.2) $ 118.2Year ended December 31, 2016: Allowances deducted from asset account Allowance for doubtful accounts $ 89.7 $ 32.5 $ (0.6) $ 2.3 (b) $ (20.4) $ 103.5Year ended December 31, 2015: Allowances deducted from asset account Allowance for doubtful accounts $ 77.0 $ 25.2 $ (6.3) $ 21.1 (b) $ (27.3) $ 89.7
(a) Amounts include allowance for doubtful accounts classified as current and noncurrent.(b) Amounts related to businesses acquired, net of amounts related to businesses disposed not included in discontinued operations.
121
Source: DANAHER CORP /DE/, 10-K, February 21, 2018 Powered by Morningstar® Document Research℠The information contained herein may not be copied, adapted or distributed and is not warranted to be accurate, complete or timely. The user assumes all risks for any damages or losses arising from any use of this information,except to the extent such damages or losses cannot be limited or excluded by applicable law. Past financial performance is no guarantee of future results.

Exhibit 10.17DANAHER CORPORATION
DESCRIPTION OF NON-MANAGEMENT DIRECTOR COMPENSATION ARRANGEMENTS
Effective as of January 1, 2018, each non-management director receives:
• an annual cash retainer of $115,000, paid in four, equal installments following each quarter of service.
• if a director attends more than twenty (20) Board and Board committee meetings in aggregate during a calendar year, such director will receive acash meeting fee of $2,000 for each Board and committee meeting attended during such year in excess of such threshold, paid in aggregatefollowing completion of such year;
• an annual equity award with a target award value of $175,000, divided equally between options and RSUs. The stock options will be immediatelyexercisable upon grant. The RSUs will vest upon the earlier of (1) the first anniversary of the grant date, or (2) the date of, and immediately prior to,the next annual meeting of Danaher’s shareholders following the grant date, but the underlying shares are not issued until the earlier of the director’sdeath or the first day of the seventh month following the director’s retirement from the Board; and
• reimbursement for Danaher-related out-of-pocket expenses, including travel expenses.
In addition, the chair of the Audit Committee, Compensation Committee and Nominating and Governance Committee receives an annual cash retainer of$25,000, $20,000 and $15,000, respectively, and the lead independent director receives an annual cash retainer of $30,000, in each case paid in four, equalinstallments following each quarter of service.
Source: DANAHER CORP /DE/, 10-K, February 21, 2018 Powered by Morningstar® Document Research℠The information contained herein may not be copied, adapted or distributed and is not warranted to be accurate, complete or timely. The user assumes all risks for any damages or losses arising from any use of this information,except to the extent such damages or losses cannot be limited or excluded by applicable law. Past financial performance is no guarantee of future results.

Exhibit 12.1
DANAHER CORPORATION AND SUBSIDIARIESSTATEMENT REGARDING COMPUTATION OF RATIO OF EARNINGS TO FIXED CHARGES
($ in millions, except ratio data)
Year Ended December 31
2017 2016 2015 2014 2013
Fixed charges: Gross interest expense (including amounts allocated to discontinuedoperations) $ 162.7 $ 204.1 $ 162.8 $ 119.1 $ 141.2Interest element of rental expense 9.8 10.0 14.0 12.9 12.7Interest on unrecognized tax benefits — — — — —Total fixed charges $ 172.5 $ 214.1 $ 176.8 $ 132.0 $ 153.9
Earnings available for fixed charges: Earnings from continuing operations (excluding earnings from equityinvestees) before income taxes plus distributed income of equityinvestees $ 2,938.8 $ 2,611.3 $ 2,039.4 $ 2,086.2 $ 2,249.4Add fixed charges 172.5 214.1 176.8 132.0 153.9Interest on unrecognized tax benefits — — — — —Total earnings available for fixed charges $ 3,111.3 $ 2,825.4 $ 2,216.2 $ 2,218.2 $ 2,403.3
Ratio of earnings to fixed charges 18.0 13.2 12.5 16.8 15.6
NOTE: These ratios include Danaher Corporation and its consolidated subsidiaries. The ratio of earnings to fixed charges was computed by dividingearnings by fixed charges for the periods indicated, where “earnings” consist of (1) earnings from continuing operations (excluding earnings from equityinvestees) before income taxes plus distributed income of equity investees; plus (2) fixed charges, and “fixed charges” consist of (A) interest, whetherexpensed or capitalized, on all indebtedness, (B) amortization of premiums, discounts and capitalized expenses related to indebtedness, and (C) an interestcomponent representing the estimated portion of rental expense that management believes is attributable to interest. Interest on unrecognized tax benefits isincluded in the tax provision in the Company's Consolidated Statements of Earnings and is excluded from the computation of fixed charges.
Source: DANAHER CORP /DE/, 10-K, February 21, 2018 Powered by Morningstar® Document Research℠The information contained herein may not be copied, adapted or distributed and is not warranted to be accurate, complete or timely. The user assumes all risks for any damages or losses arising from any use of this information,except to the extent such damages or losses cannot be limited or excluded by applicable law. Past financial performance is no guarantee of future results.

Exhibit 21.1
Danaher Corporation Subsidiaries of the Registrant
Name Jurisdiction of FormationAB Sciex Finance B.V. NetherlandsAB Sciex KK JapanAB Sciex LLC DelawareAB Sciex LP CanadaAB Sciex Pte Ltd. SingaporeAdvanced Vision Technology (A.V.T.) Ltd. IsraelAguasin SpA ChileAlltec Angewandte Laserlicht Technologie GmbH GermanyAlpha Biotec Ltd. IsraelApplitek NV BelgiumAquafine Corporation CaliforniaAquafine GmbH GermanyBC Distribution BV NetherlandsBCK Holdings S.à.r.l. LuxembourgBeckman Australia ApS DenmarkBeckman Coulter AB SwedenBeckman Coulter Australia Pty Ltd AustraliaBeckman Coulter Biomedical GmbH GermanyBeckman Coulter Biotechnology (Suzhou) Co. Ltd. ChinaBeckman Coulter Biyomedikal Urunler Sanayi ve Ticaret Limited [irketi] TurkeyBeckman Coulter Canada LP CanadaBeckman Coulter Ceska republika s.r.o. Czech RepublicBeckman Coulter Commercial Enterprise (China) Co., Ltd. ChinaBeckman Coulter de Mexico, S.A. de C.V. MexicoBeckman Coulter do Brasil Ltda. BrazilBeckman Coulter d.o.o. CroatiaBeckman Coulter España, S.A. SpainBeckman Coulter France S.A.S. FranceBeckman Coulter Genomics Inc. DelawareBeckman Coulter G.m.b.H. GermanyBeckman Coulter Hong Kong Limited Hong KongBeckman Coulter, Inc. DelawareBeckman Coulter India Private Limited IndiaBeckman Coulter International SA SwitzerlandBeckman Coulter Ireland Inc. IrelandBeckman Coulter K.K. JapanBeckman Coulter Korea Ltd. Republic of KoreaBeckman Coulter Laboratory Systems (Suzhou) Co. Ltd. ChinaBeckman Coulter Limited Liability Company Russian FederationBeckman Coulter Mishima K.K. JapanBeckman Coulter Nederland B.V. NetherlandsBeckman Coulter Nippon GK JapanBeckman Coulter Saudi Arabia Co.Ltd. Saudi ArabiaBeckman Coulter, S.L. SpainBeckman Coulter South Africa (Proprietary) Limited South Africa
Source: DANAHER CORP /DE/, 10-K, February 21, 2018 Powered by Morningstar® Document Research℠The information contained herein may not be copied, adapted or distributed and is not warranted to be accurate, complete or timely. The user assumes all risks for any damages or losses arising from any use of this information,except to the extent such damages or losses cannot be limited or excluded by applicable law. Past financial performance is no guarantee of future results.

Beckman Coulter Srl ItalyBeckman Coulter Taiwan Inc. CaliforniaBeckman Coulter United Kingdom Limited United KingdomBioTector Analytical Systems Ltd IrelandCarnassial Corporation CanadaCepheid CaliforniaCepheid AB SwedenCepheid Europe SAS FranceCepheid GK JapanCepheid GmbH GermanyCepheid HBDC SAS FranceCepheid Italy Srl ItalyCepheid Proprietary Limited South AfricaCepheid UK Ltd. United KingdomChemTreat, Inc. VirginiaChemTreat International, Inc. VirginiaCiticon (Hong Kong) Limited Hong KongCoulter Electronics Pty. Limited AustraliaDanaher (Shanghai) Management Co. Ltd. ChinaDanaher HK Holdings Limited Hong KongDanaher Medical ApS DenmarkDANRAD ApS DenmarkDANRAD Holding ApS DenmarkDental Imaging Technologies Corporation DelawareDevicor Medical Europe GmbH GermanyDevicore Medical Products Inc. DelawareDH Alpha Limited United KingdomDH Business Services LLC DelawareDH Denmark Holding ApS DenmarkDH Europe Finance SA LuxembourgDH Evolution GmbH GermanyDH Holdings Corp. DelawareDH Holdings Germany LLC DelawareDH Holdings GmbH GermanyDH Holding Italia SRL ItalyDH Technologies Development Pte Ltd. SingaporeDH Verwaltungs GmbH GermanyDTIL Ireland Holdings Ltd. IrelandDUKI (2006) Finance Limited United KingdomEsko Brno S.r.o Czech RepublicEsko BVBA BelgiumEsko-Graphics BVBA BelgiumEsko-Graphics Inc. GeorgiaEsko Software BVBA BelgiumFHAB Company AB SwedenFJ 900, Inc. DelawareG. Lufft Mess- und Regeltechnik GmbH GermanyGelman Sciences Inc. MichiganHach Company Delaware
Source: DANAHER CORP /DE/, 10-K, February 21, 2018 Powered by Morningstar® Document Research℠The information contained herein may not be copied, adapted or distributed and is not warranted to be accurate, complete or timely. The user assumes all risks for any damages or losses arising from any use of this information,except to the extent such damages or losses cannot be limited or excluded by applicable law. Past financial performance is no guarantee of future results.

Hach Lange Finance GmbH GermanyHach Lange GmbH GermanyHach Lange Sàrl SwitzerlandHach Sales & Services Canada LP CanadaHach Ultra Japan KK JapanHach Water Quality Analytical Instru. (Shanghai) Co., Ltd. ChinaHemoCue AB SwedenHIC Canada LP CanadaHR Holdco GmbH GermanyHybritech Incorporated CaliforniaImmunotech SAS FranceImmunotech Sro Czech RepublicImplant Direct Sybron Administration LLC CaliforniaImplant Direct Sybron International LLC NevadaImplant Direct Sybron Manufacturing LLC CaliforniaInnova Life Sciences Corporation CanadaIris International, Inc. DelawareJoslyn Electronic Systems Company LLC DelawareKAVO Dental GmbH GermanyKavo Dental Technologies, LLC IllinoisKerr Corporation DelawareKerr GmbH GermanyKerrHawe SA SwitzerlandKreatech Biotechnology BV NetherlandsLaetus GmbH GermanyLaunchchange Limited United KingdomLeica Biosystems Imaging Inc. DelawareLeica Biosystems Melbourne Pty Ltd AustraliaLeica Biosystems Newcastle Limited United KingdomLeica Biosystems Nussloch GmbH GermanyLeica Biosystems Richmond, Inc. IllinoisLeica Instruments (Singapore) Pte Limited SingaporeLeica Microsystems (UK) Limited United KingdomLeica Microsystems CMS GmbH GermanyLeica Microsystems Holdings GmbH GermanyLeica Microsystems Inc. DelawareLeica Microsystems IR GmbH GermanyLeica Microsystems KK JapanLeica Microsystems Limited Hong KongLeica Microsystems Trading (Shanghai) Ltd. ChinaLeica Mikrosysteme (Austria) GmbH AustriaLeica Mikrosysteme Vertrieb GmbH GermanyLinx Printing Technologies Limited United KingdomLipesa Colombia SA ColombiaLumigen, Inc. MichiganMcCrometer, Inc. DelawareMetrex Research, LLC WisconsinMolecular Devices (Shanghai) Limited ChinaMolecular Devices, LLC Delaware
Source: DANAHER CORP /DE/, 10-K, February 21, 2018 Powered by Morningstar® Document Research℠The information contained herein may not be copied, adapted or distributed and is not warranted to be accurate, complete or timely. The user assumes all risks for any damages or losses arising from any use of this information,except to the extent such damages or losses cannot be limited or excluded by applicable law. Past financial performance is no guarantee of future results.

Nihon Pall Ltd. JapanNihon Pall Manufacturing Limited JapanNobel Biocare AB SwedenNobel Biocare Deutschland GmbH GermanyNobel Biocare Holding USA Inc. DelawareNobel Biocare Japan KK JapanNobel Biocare Procera LLC DelawareNobel Biocare Services AG SwitzerlandNobel Biocare USA LLC DelawareNormond info SAS FranceOrmco BV NetherlandsOrmco Corporation DelawareOrmco LLC Russian FederationPall (Canada) Limited CanadaPall (Malaysia) Sdn. Bhd. MalaysiaPall (Schweiz) AG SwitzerlandPall Aeropower Corporation DelawarePall Asia International Limited Hong KongPall Australia Pty. Ltd. AustraliaPall Austria Filter Ges.m.b.h AustriaPall Canada Holding ULC CanadaPall Corporation New YorkPall Europe Limited United KingdomPall Filter (Beijing) Co. Ltd. ChinaPall Filtration and Separations Group DelawarePall Filtration Pte. Ltd. SingaporePall ForteBio LLC DelawarePall France SAS FrancePall GmbH GermanyPall India Pvt. Ltd. IndiaPall International Sarl SwitzerlandPall Italia Srl ItalyPall Korea Ltd. Republic of KoreaPall Life Sciences Belgium BVBA BelgiumPall Life Sciences Puerto Rico, LLC Puerto RicoPall Manufacturing UK Limited United KingdomPall Medistad BV NetherlandsPall Norden AB SwedenPall Technology UK Limited United KingdomPaloDEx Group OY FinlandPantone LLC DelawarePentron Corporation DelawarePhenomenex, Inc. CaliforniaRadiometer America Inc. DelawareRadiometer Basel AG SwitzerlandRadiometer GmbH GermanyRadiometer K.K. JapanRadiometer Medical ApS DenmarkRadiometer Medical Equipment (Shanghai) Co. Ltd. China
Source: DANAHER CORP /DE/, 10-K, February 21, 2018 Powered by Morningstar® Document Research℠The information contained herein may not be copied, adapted or distributed and is not warranted to be accurate, complete or timely. The user assumes all risks for any damages or losses arising from any use of this information,except to the extent such damages or losses cannot be limited or excluded by applicable law. Past financial performance is no guarantee of future results.

Radiometer Turku Oy FinlandSea-Bird Electronics, Inc. WashingtonSendx Medical, Inc. DelawareShanghai AB Sciex Analytical Instrument Trading Co. Ltd. ChinaSpofaDental a.s. Czech RepublicSutron Corporation VirginiaSybron Canada Holdings, Inc. DelawareSybron Canada Limited Partner Company CanadaSybron Canada LP CanadaSybron Dental Specialties, Inc. DelawareTH Finance Limited United KingdomTrojan Technologies Group ULC CanadaU.S. Peroxide, LLC DelawareVideojet Argentina S.R.L. ArgentinaVideojet China Trading ChinaVideojet Do Brasil Comércio de Equipamentos Para Codificação Industrial Ltda. BrazilVideojet Technologies (I) Pvt. Ltd IndiaVideojet Technologies Europe B.V. NetherlandsVideojet Technologies Inc. DelawareVSE Holdings Pty Ltd AustraliaWater Quality GmbH GermanyX-Ray Optical Systems, Inc. DelawareX-Rite Asia Pacific Limited Hong KongX-Rite Europe GmbH SwitzerlandX-Rite Incorporated MichiganX-Rite Switzerland GmbH SwitzerlandZhuhai S.E.Z. Videojet Electronics Ltd. China
Source: DANAHER CORP /DE/, 10-K, February 21, 2018 Powered by Morningstar® Document Research℠The information contained herein may not be copied, adapted or distributed and is not warranted to be accurate, complete or timely. The user assumes all risks for any damages or losses arising from any use of this information,except to the extent such damages or losses cannot be limited or excluded by applicable law. Past financial performance is no guarantee of future results.

Exhibit 23.1CONSENT OF INDEPENDENT REGISTERED PUBLIC ACCOUNTING FIRM
We consent to the incorporation by reference in the following Registration Statements:
Registration Statement on Form S-3
Registration Number Date Filed
333-203948
May 7, 2015 (as post-effectively amended June 15, 2015)
Registration Statements on Form S-8
Name Registration Number Date Filed
Danaher Corporation 2007 Omnibus Incentive Plan, as amended and restated;Amended and Restated Danaher Corporation 1998 Stock Option Plan
333-144572
July 13, 2007
Danaher Corporation 2007 Omnibus Incentive Plan, as amended and restated
333-159059333-175223333-190014333-213629333-219421
May 8, 2009June 29, 2011July 18, 2013September 14, 2016July 24, 2017
Danaher Corporation and Subsidiaries Retirement and Savings Plan; DanaherCorporation and Subsidiaries Savings Plan
333-107500333-117678333-159057333-213630
July 31, 2003July 27, 2004May 8, 2009September 14, 2016
Danaher Corporation and Subsidiaries Amended and Restated ExecutiveDeferred Incentive Program
333-105198333-159056333-213631
May 13, 2003May 8, 2009September 14, 2016
Pall Corporation 2012 Stock Compensation Plan, as amended
333-207565333-213632
October 22, 2015September 14, 2016
Cepheid 2006 Equity Incentive Plan, as amended; Cepheid 2015 EquityIncentive Plan
333-213633
September 14, 2016
of our reports dated February 20, 2018, with respect to the consolidated financial statements and schedule of Danaher Corporation and subsidiaries and theeffectiveness of internal control over financial reporting of Danaher Corporation and subsidiaries included in this Annual Report (Form 10-K) of DanaherCorporation and subsidiaries for the year ended December 31, 2017.
/s/ Ernst & Young LLP Tysons, VirginiaFebruary 20, 2018
Source: DANAHER CORP /DE/, 10-K, February 21, 2018 Powered by Morningstar® Document Research℠The information contained herein may not be copied, adapted or distributed and is not warranted to be accurate, complete or timely. The user assumes all risks for any damages or losses arising from any use of this information,except to the extent such damages or losses cannot be limited or excluded by applicable law. Past financial performance is no guarantee of future results.

Exhibit 31.1CERTIFICATION
I, Thomas P. Joyce, Jr., certify that:
1. I have reviewed this Annual Report on Form 10-K of Danaher Corporation;
2. Based on my knowledge, this report does not contain any untrue statement of a material fact or omit to state a material fact necessary to make thestatements made, in light of the circumstances under which such statements were made, not misleading with respect to the period covered by this report;
3. Based on my knowledge, the financial statements, and other financial information included in this report, fairly present in all material respects thefinancial condition, results of operations and cash flows of the registrant as of, and for, the periods presented in this report;
4. The registrant’s other certifying officer and I are responsible for establishing and maintaining disclosure controls and procedures (as defined in ExchangeAct Rules 13a-15(e) and 15d-15(e)) and internal control over financial reporting (as defined in Exchange Act Rules 13a-15(f) and 15d-15(f)) for theregistrant and have:
a. Designed such disclosure controls and procedures, or caused such disclosure controls and procedures to be designed under our supervision, to ensurethat material information relating to the registrant, including its consolidated subsidiaries, is made known to us by others within those entities,particularly during the period in which this report is being prepared;
b. Designed such internal control over financial reporting, or caused such internal control over financial reporting to be designed under oursupervision, to provide reasonable assurance regarding the reliability of financial reporting and the preparation of financial statements for externalpurposes in accordance with generally accepted accounting principles;
c. Evaluated the effectiveness of the registrant’s disclosure controls and procedures and presented in this report our conclusions about the effectivenessof the disclosure controls and procedures, as of the end of the period covered by this report based on such evaluation; and
d. Disclosed in this report any change in the registrant’s internal control over financial reporting that occurred during the registrant’s most recent fiscalquarter (the registrant’s fourth fiscal quarter in the case of an annual report) that has materially affected, or is reasonably likely to materially affect,the registrant’s internal control over financial reporting; and
5. The registrant’s other certifying officer and I have disclosed, based on our most recent evaluation of internal control over financial reporting, to theregistrant’s auditors and the audit committee of the registrant’s board of directors (or persons performing the equivalent functions):
a. All significant deficiencies and material weaknesses in the design or operation of internal control over financial reporting which are reasonablylikely to adversely affect the registrant’s ability to record, process, summarize and report financial information; and
b. Any fraud, whether or not material, that involves management or other employees who have a significant role in the registrant’s internal control overfinancial reporting.
Date: February 20, 2018 By: /s/ Thomas P. Joyce, Jr. Name: Thomas P. Joyce, Jr. Title: President and Chief Executive Officer
Source: DANAHER CORP /DE/, 10-K, February 21, 2018 Powered by Morningstar® Document Research℠The information contained herein may not be copied, adapted or distributed and is not warranted to be accurate, complete or timely. The user assumes all risks for any damages or losses arising from any use of this information,except to the extent such damages or losses cannot be limited or excluded by applicable law. Past financial performance is no guarantee of future results.

Exhibit 31.2CERTIFICATION
I, Daniel L. Comas, certify that:
1. I have reviewed this Annual Report on Form 10-K of Danaher Corporation;
2. Based on my knowledge, this report does not contain any untrue statement of a material fact or omit to state a material fact necessary to make thestatements made, in light of the circumstances under which such statements were made, not misleading with respect to the period covered by this report;
3. Based on my knowledge, the financial statements, and other financial information included in this report, fairly present in all material respects thefinancial condition, results of operations and cash flows of the registrant as of, and for, the periods presented in this report;
4. The registrant’s other certifying officer and I are responsible for establishing and maintaining disclosure controls and procedures (as defined in ExchangeAct Rules 13a-15(e) and 15d-15(e)) and internal control over financial reporting (as defined in Exchange Act Rules 13a-15(f) and 15d-15(f)) for theregistrant and have:
a. Designed such disclosure controls and procedures, or caused such disclosure controls and procedures to be designed under our supervision, to ensurethat material information relating to the registrant, including its consolidated subsidiaries, is made known to us by others within those entities,particularly during the period in which this report is being prepared;
b. Designed such internal control over financial reporting, or caused such internal control over financial reporting to be designed under oursupervision, to provide reasonable assurance regarding the reliability of financial reporting and the preparation of financial statements for externalpurposes in accordance with generally accepted accounting principles;
c. Evaluated the effectiveness of the registrant’s disclosure controls and procedures and presented in this report our conclusions about the effectivenessof the disclosure controls and procedures, as of the end of the period covered by this report based on such evaluation; and
d. Disclosed in this report any change in the registrant’s internal control over financial reporting that occurred during the registrant’s most recent fiscalquarter (the registrant’s fourth fiscal quarter in the case of an annual report) that has materially affected, or is reasonably likely to materially affect,the registrant’s internal control over financial reporting; and
5. The registrant’s other certifying officer and I have disclosed, based on our most recent evaluation of internal control over financial reporting, to theregistrant’s auditors and the audit committee of the registrant’s board of directors (or persons performing the equivalent functions):
a. All significant deficiencies and material weaknesses in the design or operation of internal control over financial reporting which are reasonablylikely to adversely affect the registrant’s ability to record, process, summarize and report financial information; and
b. Any fraud, whether or not material, that involves management or other employees who have a significant role in the registrant’s internal control overfinancial reporting.
Date: February 20, 2018 By: /s/ Daniel L. Comas Name: Daniel L. Comas Title: Executive Vice President and Chief Financial Officer
Source: DANAHER CORP /DE/, 10-K, February 21, 2018 Powered by Morningstar® Document Research℠The information contained herein may not be copied, adapted or distributed and is not warranted to be accurate, complete or timely. The user assumes all risks for any damages or losses arising from any use of this information,except to the extent such damages or losses cannot be limited or excluded by applicable law. Past financial performance is no guarantee of future results.

Exhibit 32.1CERTIFICATION OF CHIEF EXECUTIVE OFFICER PURSUANT TO
18 U.S.C. SECTION 1350,AS ADOPTED PURSUANT TO
SECTION 906 OF THE SARBANES-OXLEY ACT OF 2002
I, Thomas P. Joyce, Jr., certify, pursuant to 18 U.S.C. Section 1350, as adopted pursuant to Section 906 of the Sarbanes-Oxley Act of 2002, that to myknowledge, Danaher Corporation’s Annual Report on Form 10-K for the fiscal year ended December 31, 2017 fully complies with the requirements of Section13(a) or 15(d) of the Securities Exchange Act of 1934 and that information contained in such Annual Report on Form 10-K fairly presents in all materialrespects the financial condition and results of operations of Danaher Corporation.
Date: February 20, 2018 By: /s/ Thomas P. Joyce, Jr. Name: Thomas P. Joyce, Jr. Title: President and Chief Executive Officer
This certification accompanies the Annual Report on Form 10-K pursuant to Section 906 of the Sarbanes-Oxley Act of 2002 and shall not be deemed filed forpurposes of Section 18 of the Exchange Act, or otherwise subject to the liability of that section. This certification shall not be deemed to be incorporated byreference into any filing under the Securities Act or the Exchange Act, except to the extent that Danaher Corporation specifically incorporates it by reference.
Source: DANAHER CORP /DE/, 10-K, February 21, 2018 Powered by Morningstar® Document Research℠The information contained herein may not be copied, adapted or distributed and is not warranted to be accurate, complete or timely. The user assumes all risks for any damages or losses arising from any use of this information,except to the extent such damages or losses cannot be limited or excluded by applicable law. Past financial performance is no guarantee of future results.

Exhibit 32.2CERTIFICATION OF CHIEF FINANCIAL OFFICER PURSUANT TO
18 U.S.C. SECTION 1350,AS ADOPTED PURSUANT TO
SECTION 906 OF THE SARBANES-OXLEY ACT OF 2002
I, Daniel L. Comas, certify, pursuant to 18 U.S.C. Section 1350, as adopted pursuant to Section 906 of the Sarbanes-Oxley Act of 2002, that to my knowledge,Danaher Corporation’s Annual Report on Form 10-K for the fiscal year ended December 31, 2017 fully complies with the requirements of Section 13(a) or15(d) of the Securities Exchange Act of 1934 and that information contained in such Annual Report on Form 10-K fairly presents in all material respects thefinancial condition and results of operations of Danaher Corporation.
Date: February 20, 2018 By: /s/ Daniel L. Comas Name: Daniel L. Comas Title: Executive Vice President and Chief Financial Officer
This certification accompanies the Annual Report on Form 10-K pursuant to Section 906 of the Sarbanes-Oxley Act of 2002 and shall not be deemed filed forpurposes of Section 18 of the Exchange Act, or otherwise subject to the liability of that section. This certification shall not be deemed to be incorporated byreference into any filing under the Securities Act or the Exchange Act, except to the extent that Danaher Corporation specifically incorporates it by reference.
Source: DANAHER CORP /DE/, 10-K, February 21, 2018 Powered by Morningstar® Document Research℠The information contained herein may not be copied, adapted or distributed and is not warranted to be accurate, complete or timely. The user assumes all risks for any damages or losses arising from any use of this information,except to the extent such damages or losses cannot be limited or excluded by applicable law. Past financial performance is no guarantee of future results.

Source: DANAHER CORP /DE/, 10-K, February 21, 2018 Powered by Morningstar® Document Research℠The information contained herein may not be copied, adapted or distributed and is not warranted to be accurate, complete or timely. The user assumes all risks for any damages or losses arising from any use of this information,except to the extent such damages or losses cannot be limited or excluded by applicable law. Past financial performance is no guarantee of future results.