carllevan.comcarllevan.com/wp-content/uploads/2013/05/ELEMO.ASLP_.docx · Web viewcarllevan.com
103
Taxation and Determinants of Legislative Representation in Africa Olufunmbi M. Elemo James Madison College Michigan State University 46 Introduction State governments are increasingly important to the execution of African democracy. Subnational governments, serving as a mechanism for participatory integration of ordinary people into the fold of governance, are also charged with “the enhancement of representative grassroots democracy” (Fajingbesi et al, 2004: 47). In order to facilitate the execution of their growing duties, state legislatures are endowed with the power to independently raise revenue. Given varied obligations, what determines state legislators’ policy priorities? The evolution of representative institutions is causally linked to the process of revenue and revenue extraction (i.e. taxation of citizens). The model begins in 15th and 16th Century, where Western European rulers are engaging in war, border protection, and essentially forging nation-states. In order to raise revenue for these expensive activities, rulers 46 This is a draft paper written for the African State Legislatures project. Please do not cite or distribute. 1
Transcript of carllevan.comcarllevan.com/wp-content/uploads/2013/05/ELEMO.ASLP_.docx · Web viewcarllevan.com
Taxation and Determinants of Legislative Representation in AfricaOlufunmbi M. Elemo
James Madison CollegeMichigan State University46
Introduction
State governments are increasingly important to the execution of African democracy.
Subnational governments, serving as a mechanism for participatory integration of ordinary
people into the fold of governance, are also charged with “the enhancement of representative
grassroots democracy” (Fajingbesi et al, 2004: 47). In order to facilitate the execution of their
growing duties, state legislatures are endowed with the power to independently raise revenue.
Given varied obligations, what determines state legislators’ policy priorities?
The evolution of representative institutions is causally linked to the process of revenue
and revenue extraction (i.e. taxation of citizens). The model begins in 15th and 16th Century,
where Western European rulers are engaging in war, border protection, and essentially forging
nation-states. In order to raise revenue for these expensive activities, rulers turn to taxing
citizens in order to fund their engagement in these activities. Specifically, rulers and citizens
enter into a contract: citizens agree to provide tax revenue in exchange for an enhanced role in
government. With taxation comes the incentive for political leaders to shift policy toward citizen
interests (Tilly, 1985/1990; Bates and Lien, 1985; Levi, 1988; North and Weingast, 1989;
Acemoglu and Robinson, 2005).
Thus, representation is the process by which elected officials act on behalf of
constituents, gauging, deliberating upon, and incorporating citizen interests in political decision-
making. This will eventually result in the expending resources to ensure that citizen preferences
46 This is a draft paper written for the African State Legislatures project. Please do not cite or distribute.
1

are being attended to (Huber and Powell, 1994; Aldrich, 1995; Stokes, 1999). However, this
Western European framework does not consider the impact of another source of revenue
becoming available, specifically natural resource revenue. Rulers, being rational and
maximizing their own utility, will also seek the most cost-effective method of acquiring
resources to carry out their activities. In this case, access to an external revenue base, provides
an avenue that is less costly than bargaining with citizens, affording a ruler the ability to
maintain their preferred policy outcome. Instead of bearing the transaction costs associated with
taxation (e.g. enforcing compliance with tax policies), leaders that are able fund their
governments without taxation can also bypass the need to defer to citizen interests (stymieing the
development of representative institutions). I argue that this is the case in many developing
nations. This consideration of alternative sources of revenue is particularly salient in Africa.
The “natural resource curse,” also known as the “oil or mineral curse,” originates in
studies of democratization in the Middle East. The dilemma arises when nations, endowed with
substantial resource deposits (including, but not limited to petroleum and other fuels, metal ores,
diamonds and precious stones) derive a substantial portion of their government revenues from
the processing and sale of these commodities. These rents, paid by foreign companies and
governments, allow political leaders to bypass deference to public interests, which citizen-based
taxation would normally generate, reducing the demand for representation (Beblawi, 1987; Ross,
2001, 2004). A body of work, both large-N, statistical and small-N/case study analyses have
emerged to investigate this link. In addition to this association between natural resource
dependence and weak representative institutions, resource dependence is also associated with the
decline in the quality of governance and weak political institutions (Karl, 1997; Lam and
Wantchekon, 1999; Jones Luong and Weinthal, 2006; Welden, 2001; Wantchekon, 2002).
2
Scholars have begun to explore the linkages between revenue extraction and
representation at the sub-national level. For example, Guyer (1991: 14) characterizes the effects
of limited taxation on the representation of subnational interests in Nigeria:
“With such low contributions in rural Nigeria, financial management becomes a poor basis for people’s demands for accountability...with no policy-making about, or financial instruments for local development of locally defined projects within the government system, the extension of national plans to local area becomes an act of fate whose financing bears no relation to the population affected by them.”
More recently, using Afrobarometer and Demographic and Health survey data, Berger
(2009) finds that Nigerian subnational governments areas that were forced to collect taxes during
the British colonial period generated a stronger the institutional capacity that manifests today in
effective bureaucracies. Furthermore, citizens in these tax dependent subnational governments
indicate higher approval ratings and more effective public service delivery than their
counterparts in non- tax dependent areas.
Focusing on Tanzania and Zambia, Gibson and Hoffman (2006: 7) ask: “Do sources of
revenue affect government expenditure?” Using subnational government budgetary data, they
find that when subnational government revenue is derived from citizen taxation, politicians will
be compelled to expend more funds on public services. On the other hand, when depending on
those funds derived from sources outside of their local constituency, (e.g. federal government
transfers, foreign aid),” politicians are more likely to spend resources on government salaries and
other recurrent expenditures.
I attempt to further test the applicability of these theories to Africa, focusing on the
Nigerian case, where interactions between income from citizen taxation and petroleum create
varied sub- national revenue compositions. In this paper, I investigate how reliance on different
forms of public revenue influences individual elected officials. I hypothesize that when
3

governments generate income from taxes on citizens, elected leaders are more likely to shift
public policy decisions to reflect the populace’s priorities. Political elites do so in order to fulfill
their part of the fiscal contract with citizens (Tilly, 1985/1990; Bates and Lien, 1985; Levi,
1988). I rely on original elite surveys with legislators to test this theory in Nigeria. Due to
limited research resources, I narrow down my cases, focusing on elites in regions with the most
variation in state tax generation. Therefore, this paper begins with an analysis of regional
variation of tax generation and oil dependence in Nigeria. After selecting two regions (and six
states) as cases, I profile revenue extraction and elite representation in each state. From here, I
outline my sampling procedures and survey methodologies. Using data from these elite surveys,
I test the hypothesis that politicians in states with higher levels of tax generation are more
representative of their constituents.
Regional Variation in Tax and Oil Dependence: Case Selection
Although Nigeria abandoned use of the “region” as a subnational unit in the Second
Republic, regional characteristics continue to play a role in Nigerian politics. According to
Suberu (2001: 219), “in order to promote the equitable and stable distribution of powers and
resources in the country,” political leaders aggregate the Nigerian states into geopolitical zones.
The North-West, North-East, Middle Belt (i.e. Lower North), South-West, South-South, and
4

South-East constitute these regions.47 The six units reflect broad regional, cultural, and ethno-
political cleavages, which historically characterize the federation (Paden, 1990). For example,
each of Nigeria’s three major ethno-linguistic groups dominates specific regions.
Demographically, the Northern Region (e.g. North-West, Middle Belt, and North-East zones) is
predominantly Muslim, with an ethnic Hausa-Fulani majority. The South-Western Region is
largely Yoruba and roughly balanced among Muslims and Christians. Last, the Eastern Region,
made up of the South-South and South-East zones, is predominantly Igbo and overwhelmingly
Christian (Lewis, 2011: 3). Given the ethno-political salience of zonal distinctions, how do tax
income generation and oil dependence vary within and between regions? Since scholars (e.g.
Paden, 1997; Suberu, 2001) argue politicians take regional groupings into account when
distributing resources, it is important to consider variation in state governments’ reliance on tax
income (vs. petroleum income) within these subnational categories.
Overall, states in the Southern portion of Nigeria generate more income from taxes on
citizens than their counterparts in the Northern portion of the country. On average, between
1999 and 2009, Southern States obtained 15% of their income from taxation of citizens.
However, during this same period, Northern States derived 8% of their revenue from taxes.
Between 1999 and 2009, states in Nigeria’s South-West Region were the most capable of
extracting tax revenue. Table 1 presents tax revenue as a percentage of total income in the 47 The contemporary Nigerian states included in each zone:North-West: Jigawa, Kaduna, Kano, Katsina, Kebbi, Sokoto, and Zamfara.Middle Belt: Federal Capital Territory (Abuja), Benue, Kogi, Kwara, Nasarawa, Niger, and Plateau.North-East: Adamawa, Bauchi, Borno, Gombe, Taraba, and Yobe.South-West: Ekiti, Lagos, Ogun, Ondo, Osun, and Oyo.South-South: Akwa-Ibom, Bayelsa, Cross River, Delta, Edo, and Rivers.South-East: Abia, Anambra, Ebonyi, Enugu, and Imo.
5
South-Western States in recent years. By 2009, four out of the six states in this region were
generating over 20% of their income from taxation of citizens. In fact, Lagos (located in the
South-West) was the only state in the federation where income from direct taxation of citizens
superseded petroleum revenue (between 1999 and 2009, 54% of their revenue from taxes, 24%
from oil transfers).
On the other hand, The North-East Region generated the least amount of their income from
taxation of its citizens: from 1999 to 2009, in this region, only 5% of state revenue came from
non-oil, tax sources. As seen in Table 2, between 2005 and 2009, all of the North-East states
managed a steady increase in their tax generation. In fact, Gombe and Taraba States were able to
at least double taxes as percentage of their total revenue. But, with the exception of Gombe,
North-Eastern states still derived less than 10% of income from taxes on citizens.
This finding that Southern states out performing Northern states in tax generation is
partially contradictory to previous research. Scholars typically argue that states in Northern
Nigeria have a historical experience as strong tax generators.
Berger (2009) asserts that, from the time of British colonialism, government units in
Northern Nigeria have been characterized with a higher capacity to raise income from the direct
taxation of citizens:
“The government of the Southern Protectorate [of Nigeria] had an obvious tax handle in import tariffs levied at the ports…[But] Since the Protectorate of Northern Nigeria had no seacoast and thus no ports the northern government was unable to raise money from tariffs. Therefore, Lugard [colonial governor in the North] raised the money he needed by a series of direct taxes. In the Muslim areas farther to the north there were property taxes and taxes on livestock. However, in what they referred to as the “pagan areas” they used a simple poll-tax” (Berger, 2009: 10).
He goes on to argue that this earlier experience with developing and maintaining a tax
administration manifests in contemporary Nigeria. Berger (2009) finds that, today, subnational
6

governments north of the 7◦ 10′ N line have more efficient bureaucracies that are better able to
deliver public services.48
However, the budgetary data presented and discussed here do not corroborate Berger’s
(2009) assertions. Southern states generate tax revenue at a higher rate. Moreover, besides
states engaged in oil production, Northern governments are the most dependent on petroleum
income from federal transfers (Table 3).49 It is especially interesting to note that oil-producing
states still out perform Northern governments in terms of tax generation. In oil producing states,
between 1999 and 2009, on average, 12% of government income was derived from non-oil taxes
on citizens. However, in Northern states, about 8% of revenue was generated from taxes.
During this same period, the Southern, non-oil producing states were the most capable of
extracting tax revenue: 18% of government income was derived from internally generated tax
income.
Given this intra and inter-regional variation in tax generation and oil dependence, what are
the consequences for elite attitudes and behavior toward representation of citizens? Does varied
reliance on tax vs. oil income change individual elite policy behavior?
By leveraging intra-regional variation, it is possible to investigate the effect of revenue on
the incentives and preferences of individual elected officials. I hypothesize that elected officials
in states with a greater capacity to generate tax income will be more representative of their
48 In 1899, the British Colonial Authority divided Nigeria into the Northern and Southern Protectorate using the 7◦ 10′ N line (Berger, 2009).
49 The following Nigerian states are oil producing: Abia and Imo in the South-East; Akwa Ibom, Bayelsa, Cross River, Delta, Edo, and Rivers in the South-South; Ondo in the South-West (Oviasuyi and Uwadiae, 2010). In addition to the standard allocation of petroleum revenue, these states receive an additional 13% of national petroleum income, beyond the standard federal allocation.
7

constituents. I expect this based on theories of revenue extraction and representation in Western
Europe (Tilly, 1985/1990; Bates and Lien, 1985; Levi, 1988; North and Weingast, 1989;
Acemoglu and Robinson, 2005) and Africa (Fjeldstad and Semboja, 2001; Fjeldstad, 2001;
Gibson and Hoffman, 2006; McGuirk, 2012). Elite opinions about revenue and representation
are not readily available for the purpose of analysis. Thus, I have conducted interviews with
Nigerian state legislators. These interviews gauging legislators’ policy perspectives and
priorities are an original contribution of this project.50 Ideally, I would have completed
interviews with legislators in all 36 Nigerian states; however, due to limited resources, I select
states from two regions with contrasting patterns of tax capacity and oil dependence to test my
hypotheses. By focusing on the regions with the greatest variability in revenue generation, I can
more effectively isolate any influence tax capacity or oil dependence has on elite perceptions of
representation. The next section outlines the case selection strategy.
Looking at average tax and oil income distribution (as percentage of total government
revenue) between 1999 and 2009, Table 4 presents the standard deviation each of Nigeria’s six
regions. A larger standard deviation indicates more within-region variation. As we can see, the
South-West Region has the highest level of variability in tax and oil revenue reliance between
1999 and 2009. The South-South Zone followed with the next highest level of variation. In this
region, between 1999 and 2009, on average, 12% of states’ income was derived from taxes on
50 The African Legislatures Project (ALP) is an academic and policy project, located in the Centre for Social Science Research at University of Cape Town (South Africa). This project utilizes both qualitative and quantitative approaches to uncover “how and why do African legislatures function as they do” and “what constitutes ‘best practice’ for the purpose of strengthening African institutions which are an essential component of democratization on the continent.” So far, analysis has been conducted in Kenya, Malawi, Mozambique, Namibia, Tanzania, Uganda, and Zambia. While research in Nigeria is currently underway, it is important to note that this project focuses exclusively on National Legislatures. Therefore, my focus on state legislators is an original contribution.
8
citizens. As another measure of control, I will not to focus on petroleum-producing states in my
analysis. Therefore, the zone with the next highest level of within-region variability in revenue
generation is the North-West. Thus, in order to maximize variation, I select the South-West and
North-West Zones for my continued analysis of the revenue and representation relationship at
the micro-level. Focusing on these two regions, I investigate the hypothesis that, elected
officials in tax-reliant states will be more representative of their constituents.
Having selected the South-West and North-West Regions for analysis, this narrows down
my possible cases from 36 to 13 states (six states in the South-West, seven states in the North-
West). Once again, due to limited resources, I limit my cases further, choosing a high performer,
average performer, and low performer with respect to tax generation in these two.51 As a result,
I am able to control for regional effects by looking at high, average, and low tax generators
within both regions. Tables 5 and 6 present the South-West and North-West’s average tax
generation and oil income dependence between 1999 and 2009. Based on this data, I select high,
average, and low performers in each region. Therefore, the cases in the South-West are Lagos
(high), Oyo (average), and Ekiti (low).52 The cases in the North-West are Sokoto (high), Kano
(average), and Katsina (low).
In the next section, I describe these six cases, providing background information on the
structure of each state’s revenue sources since Nigeria’s return to democratic rule. I will also
discuss the organization of each state’s legislature. Within this context, we can delve deeper into
the revenue and representation linkages, considering elite perspectives.
51 High, average, and low performance is with respect to the national average of tax and oil income as percentage of total state revenue. Between 1999 and 2009, on average taxes make up 13% of state income, and average oil dependence is 64%.
52 Since Ondo State is a petroleum producing state and a recipient of derivation funds, I do not include it in my analysis.
9

Revenue in the South-West and North-West Cases
As previously mentioned, since Nigeria’s return to democratic governance in 1999, the
South-West and North-West Regions have led the nation in tax generation. However, referring
to Tables 7 and 9, we can observe variation in tax generation within these zones.
Tax Generation and Oil Dependence in the South-West
Between 1999 and 2009, Lagos State (high-performer) generated an average of 53% of
state income from taxes on citizens. This made Lagos the most capable with tax extraction
during this period, not only in the South-West, but also in the Nigerian Federation. Turning to a
graphic representation of the data (Figure 1), we see, for the most part, the portion of Lagos’
state income derived from taxes steadily rose, beginning with taxes comprising 41% of revenue
in 1999 and reaching 64% in 2009.
Comparing Lagos to Oyo State, the average-performer, we observe a noticeable gap. From
1999 to 2009, Oyo State earned a mean of 17% of revenue from taxes. Though tax generation in
Oyo also steadily increased during this period, it did not reach the same rates as Lagos State.
Starting with taxes making up 10% of state income in 1999, Oyo reached a peak of 22% in 2007,
then slightly reducing to 21% in 2009.
Finally, in Ekiti State, the low-performer, taxes constituted an average of 8% of revenue
between 1999 and 2009. However, as evident in Figure 1, Ekiti (like Lagos and Oyo)
experienced an increase in tax dependence during this time frame. With that said, taxes as a
percentage of total revenue increased at a notably slower rate than the other two case-states.
Beginning with taxes making up 3% of Ekiti’s income in 1999, tax generation crested at 13% in
2009.
10

The picture of petroleum income dependence in the South-Western cases is markedly
different. While tax generation in Lagos, Oyo, and Ekiti States increased at relatively steady,
albeit different rates, oil income as a portion of state revenue was more volatile. This confirms
Ross’s (2012) assertion that the volatility of world oil prices can produce fluctuations in
government finances. Figure 2 provides a graphic representation of the South-Western oil
dependence data in Table 8.
On average, Lagos State was the least oil dependent government in this zone, as well as
among all Nigerian states. From 1999 to 2009, oil revenue from federal transfers made up 24%
of Lagos’ government income. During the same time period, oil income made up a larger
portion of state revenue in Oyo and Ekiti States. However, like in Lagos, petroleum wealth
remained a volatile component of Oyo and Ekiti’s income, declining over time. For example, in
1999 54% of Oyo State’s revenue was obtained via federal transfers of petroleum income. Oyo’s
oil dependence peaked in 2001 (78% of state income derived from oil revenue). By 2009, the
portion of income from petroleum decreased to 49%, the lowest point in Oyo during this 10-year
frame. Ekiti State, the most oil dependent state of my cases, followed a similar pattern. In 1999,
74% of Ekiti’s income was derived from oil wealth. Peaking in 2001 (at 86%), Ekiti’s oil
dependence continued to fluctuate, before then declining to 58% of state revenue coming from
petroleum transfers in 2009.
Overall, in the South-West cases, we see that as tax generation and reliance has increased,
the trend in oil dependence has decreased. Moreover, evidence confirms previous scholars’
assertions about the instability in petroleum income and the volatile influence on state budgets.
11

Tax Generation and Oil Dependence in the North-West
Turning to the North-West cases, we observe similar patterns in the growth of states’ tax
dependence and volatility, but gradual decrease in oil income reliance. Unlike in the South-West
Zone, where the high performing state is far ahead of the other cases in tax generation, Sokoto,
Kano, and Katsina States started off at similar levels of tax dependence. Referring to Table 9
and Figure 3, we see that, in 1999, tax income made up between 3% and 7% of revenue in these
cases. In Sokoto (high-performer), between 1999 and 2005, tax dependence ranged from 5% to
9% of state income. However, starting in 2007, tax income as a portion of total revenue jumped
to 19%, and reached a new height of 48% in 2009. During this same period, Kano State (average
performer) experienced a relatively more stable growth in tax reliance. Beginning in 1999, when
taxes comprised 7% of Kano’s state income, over this ten-year time frame, tax dependence
peaked at 22% by 2009. Last, in Katsina State (low performer), we also observed a stable, but
comparatively modest rate of growth in tax dependence. In 1999, 3% of Katsina’s income was
derived from taxes on citizens. This increased, reaching its highest point at the end of the decade,
where 12% of Katsina’s state revenue was tax-based. Thus, starting in 2007, Sokoto State began
to surpass other North-Western states in tax generation. And by 2009, Sokoto was the second
most tax-dependent state in Nigeria (following Lagos States). Likewise, by the end of this time
period, the internal variation in tax reliance within the North-West Zone is evident.
Oil reliance in the North-West cases follows the same trend of instability as in South-
Western states. In 1999, Kano State was the least tax dependent, with 52% of revenue coming
from federal petroleum income transfers (Table 10, Figure 4). Between 1999 and 2009, oil
dependence in Kano State fluctuated, and by the end of that time period, 53% of revenue was
derived from petroleum wealth. Similarly, over ten years, Katsina’s access to petroleum income
12

via federal transfers was volatile. In 1999, 76% of Katsina’s revenue came from oil-based
income. By 2009, federal transfers as a potion of state income dropped to 61%. On the other
hand, in Sokoto, after oil dependence reached its height in 2000 (84% of revenue from oil
income), reliance on federal transfers decreased. By 2009, 34% of Sokoto’s revenue was derived
from petroleum funds, once again making this state one of the least oil dependent in the
Federation.
Representation in the South-West and North-West Cases
Legislatures have been identified as representative institutions that contribute to the
development of democracy. In fact, some scholars argue that the success of a country’s
democracy hinges on the strength and competence of the legislature. According to Fish (2006:
5), “the presence of a powerful legislature is an unmixed blessing for democratization.”
Utilizing an index of parliamentary powers (Parliamentary Power Index, PPI), Fish (2006)
demonstrates when a country has a strong legislature it is more likely to have a strong
democracy.53 A weak legislature undermines democracy in two ways: first, it undermines
“horizontal accountability…[that is] the controls that state agencies are supposed to exercise over
other state agencies” (Fish, 2006: 12). If the legislature is unable to provide checks on executive
power, including in the bureaucracy, abusive practices are more likely to occur. Second, weak
legislatures destabilize “the growth of vertical accountability, meaning the ability of the people
to control their representatives” (Fish, 2006: 13). A strong legislature is more capable of linking
53 Legislative strength is measured with the “Parliamentary Powers Index (PPI), based on 32 items that cover the parliament’s ability to monitor the president and the bureaucracy, parliament’s freedom from presidential control, parliament’s authority in specific areas, and the resources that it brings to its work” (Fish, 2006: 7). Strength of democracy using “the scores from Freedom House’s survey of Freedom in the World. These scores represent an average of the scores for “political rights” and “civil liberties” (Fish, 2006: 9).
13

elected officials with their constituents and acting upon citizens’ preferences. Moreover, vertical
accountability affords voters the ability to reward or punish her representatives based upon the
perception that her expectations have been met.
In addition to serving as mechanisms for accountability, legislatures are “the one institution
explicitly established to represent society’s diverse interests in government” (Barkan, 2009: 1).
Barkan (2009: 7) goes on to identify representation as a legislature’s fundamental function:
“Regardless of the type of electoral system by which the members of the legislature gain their seats, the main purpose of individual legislators and the body to which they belong is to represent, that is to say re-present or mimic the varied and conflicting interests extant in society a whole. The legislature is the institutional arena where representatives of competing interests articulate and strive to advance their respective objectives in the policymaking process.”
Thus, legislatures serve are an example of an important representative institution that allows
elected officials to engage, manage, and act upon citizens’ interests.
Barkan (2009: 2) argues, “most African legislatures, like legislatures worldwide, remain
weak in relation to the executive.” In particular, the post-independence era of neopatrimonial
rule curtailed the development of legislatures in Africa. For example, during this period,
Nigeria’s legislature was completely disbanded in lieu of military-authoritarian governance
(although there were brief moments of civilian rule, i.e. First Republic (1960 – 1966), Second
Republic (1979 – 1983)). In other cases (e.g. Zambia), the legislature functioned as an executive
tool for delivering patronage to citizens in an effort to legitimize the authoritarian regime
(Barkan, 2009: 13 – 15). Rather than serving as an independent branch of government—
providing oversight or generating policy—legislatures were wholly dependent on the executive.
In both circumstances, as African countries returned to multi-party democracy in the 1990s,
legislatures emerged from the “downward spiral of conditions that had undermined them for a
quarter-century” (Barkan, 2009: 15).
14

While this previous scholarship has focused exclusively on national legislatures, I argue
that the same assertions of legislative development apply subnationally. Especially in Nigeria,
the return to democracy in 1999 has been accompanied by a two-pronged federalism. First, there
has been a distribution of authority between branches of government, equipping the national
legislature with the ability to form policy independently while serving as a check on the
executive. Second, political power has been dispersed through levels of government. State
legislatures are empowered, by law, to govern, independently of the federal government and the
state executive (governor).
According to Nigeria’s 1999 Federal Constitution, state legislatures (Houses of Assembly)
are unicameral bodies endowed with the power to “make laws for the good governance of the
state” (Omoyele, 2011: 8). The membership of each state’s House of Assembly varies,
comprised of between 24 and 40 members (three of four times the number of seats the state has
in the House of Representatives; 1999 Nigerian Constitution, Chapter 5, Part 2, Section 91). The
members of each House of Assembly also nominate and elect from among themselves several
leading officers. The Federal Constitution specifically names the Speaker (presiding over the
activities of the state legislature, keeping order and decorum, and ensuring House rules are
obeyed) and the Deputy Speaker (assisting the Speaker in his/her duties, presiding over the
Assembly in the Speaker’s absence) (1999 Nigerian Constitution, Chapter 5, Part 2, Section 92).
However, there are provisions allowing state legislators to elect other officers to assist the
Assembly in conducting business. Generally, this includes the Majority Leader and Deputy
Majority Leader (serving as the chief strategists of the majority party, in charge of government
business and the legislative schedule); the Minority Leader(s) and Deputy Minority Leader (s)
(representing the interests of the minority party (or parties)); and the Party Whips (responsible
15

for maintaining decorum during sessions, and ensuring legislators’ support for party programs
and strategies) (Omoyele, 2011: 22 – 24).
As with the National Assembly, each state legislature “performs three basic functions—
law-making, oversight functions, and representation” (Omoyele, 2011: 14; Barkan, 2009).
Generally, Houses of Assembly are expected to “make laws with respect to any matter within
[their] legislative competence, correct any defects existing law, and expose corruption,
inefficiency, or waste in the administration of laws” (Omoyele, 2011: 15).
Second, state legislatures are given the authority to check the other branches of
government, and they provide this oversight in several ways. Houses of Assembly control and
monitor public funds, such that “No money shall be withdrawn from any public fund of the State,
unless the issue of those moneys has been authorized by a Law of the House of Assembly of a
State” (1999 Nigerian Constitution, Chapter 5, Part 2, Section 120). Moreover, the Executive is
charged with preparing an annual budget, “estimate[ing] revenues and expenditures of the State
of the following financial year” (1999 Nigerian Constitution, Chapter 5, Part 2, Section 121).
This budget is presented to the House of Assembly to investigate and approve. State legislatures
also provide oversight through their power to confirm and approve Executive appointments. This
includes “screening and approval of people nominated by the Governor of the State for public
offices, such as Commissioners, Chief Judge of the State, and Chairmen and members of
statutory bodies or Commissions” (Omoyele, 2011: 16). Conversely, Houses of Assembly also
have the power to conduct investigations of public officials and public complaints. And with
their power of impeachment, the Governor, Deputy Governor, and Chief Judge of each State are
also subject to investigation and punishment of any misconduct.
Last, in the execution of representation, members of House of Assembly use deliberations
16

and the passage of bills into laws to give expression to the interests of their constituents and the
people of the State at large (Omoyele, 2011: 15). Barkan (2009: 7) expands representation to
include constituency service. This can include regular visits by legislators to their districts to
assist constituents with individual needs. Legislators can also sponsor development projects to
provide public services to their district, “including roads, water supply systems, schools, health
clinics, and meeting halls.”
Returning to my analytical focus, I hypothesize that Nigerian legislators from states with
higher levels of tax generation capacity will be more representative of their constituents.
In order to text this hypothesis, I rely on data from interviews conducted with state
legislators in the six case-states during fieldwork in Nigeria (October 2010 – July 2011). In the
next section, I describe sampling procedures, provide summary statistics about the sample of
legislators, and outline the research design.
Research Design: Revenue and Elite Perceptions of Representation
Table 11 presents a summary of the sampling procedures. The total population of
legislators in the six selected cases is 202. Ideally, I would have included all 202 legislators in
the sample; however, given limited research resources, the maximum feasible sample size was n
= 101.54 These 101 legislators resulted from including 50% of each state’s legislature in the
sample. This broke down to: 20 legislators in Lagos, 16 legislators in Oyo, 13 legislators in
Ekiti, 15 legislators in Sokoto, 20 legislators in Kano, and 17 legislators in Katsina. By
maintaining proportionality, sampling legislators in proportion to the total size of each
54 As the principal investigator, I conducted all interviews myself. Nigeria held state elections on April 23, 2011. As a result, my interviews were conducted in the midst of an election season where legislators were spending less time at the State House of Assembly, instead, campaigning in their local constituency.
17

legislature, findings from they analysis can be generalized to the larger population of legislators
in the six cases. Moreover, with around 100 legislators, I am able to use percentages to
summarize and characterize the sample. In addition, I made the selection of legislators as
random as possible, whereby each legislator had an equal chance of being included in the
sample. This way, I could avoid systematic bias between elites I interviewed and those I did not.
Tansey (2007) identifies elite interviews as a useful tool for establishing “attitudes, values,
and beliefs...[and for making] inferences about a larger population’s characteristics and
decisions.” With that said, scholars also acknowledge that legislators can be “reluctant
respondents.” This literature provides several tools for ensuring validity and reliability of elite
responses (Dean and Whyte, 1970; Aberbach, Chesney, and Rockman, 1975; Berry, 2002; Leech
and Goldstein, 2002; George and Bennett, 2005). When drafting questions for legislative
interviews, I used open-ended/grand tour questions, which have been identified as “potentially
the most valuable type of elite interviewing in more politically unstable environments” (Berry,
2002: 679). Open-ended questions afforded the best opportunity to let respondents identify the
relevant and important issues. In addition to original, open-ended questions, I replicated
questions from the African Legislatures Project and the Afrobarometer survey instruments.
Doing this allowed me to make use of questions that have already been tested in the field and
found to be successful in gathering information from potentially unreliable respondents.
Furthermore, by using more structured and closed-response questions, I was able to somewhat
dictate the direction of the interview. This also ensured that legislative responses could be
systematically compared to each other for analysis.55
With the survey, I sought data about legislators’ demography (e.g. age, ethnicity,
55 See Appendix for the list of complete survey questions.
18

education, gender), their activities while they were members of their House of Assembly,
legislators’ opinions about their relationship to constituents, and their law-making/decision-
making process.
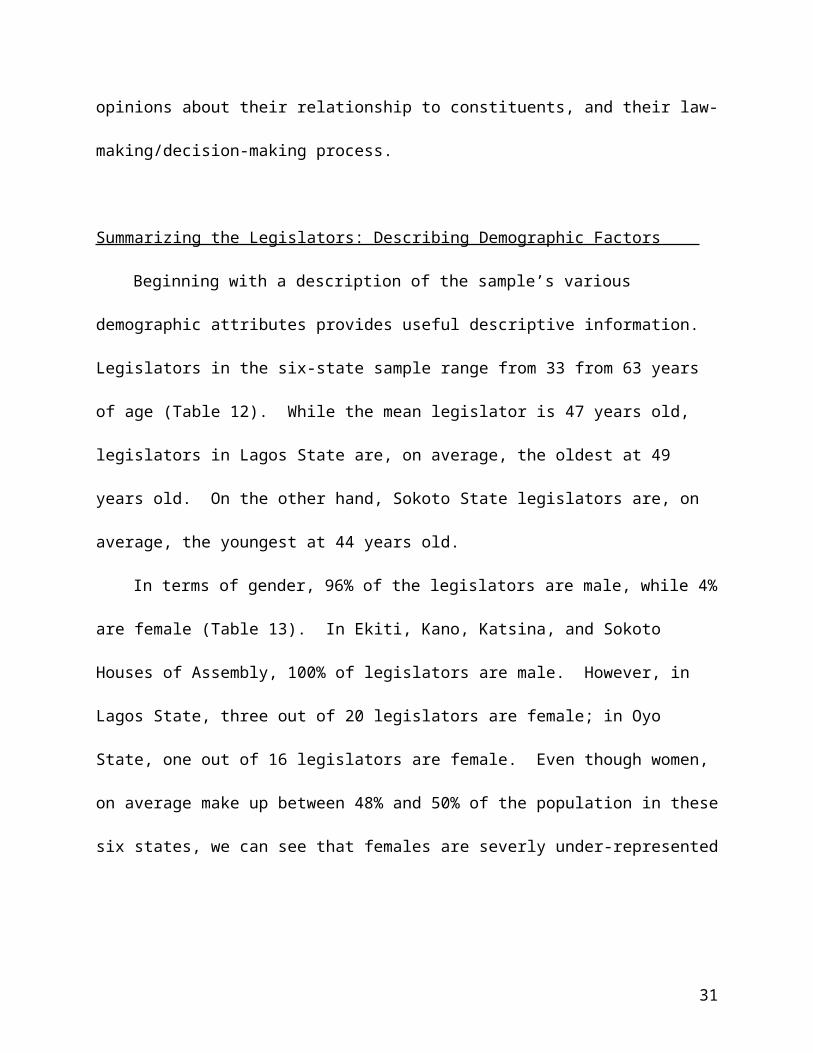
Summarizing the Legislators: Describing Demographic Factors
Beginning with a description of the sample’s various demographic attributes provides
useful descriptive information. Legislators in the six-state sample range from 33 from 63 years
of age (Table 12). While the mean legislator is 47 years old, legislators in Lagos State are, on
average, the oldest at 49 years old. On the other hand, Sokoto State legislators are, on average,
the youngest at 44 years old.
In terms of gender, 96% of the legislators are male, while 4% are female (Table 13). In
Ekiti, Kano, Katsina, and Sokoto Houses of Assembly, 100% of legislators are male. However,
in Lagos State, three out of 20 legislators are female; in Oyo State, one out of 16 legislators are
female. Even though women, on average make up between 48% and 50% of the population in
these six states, we can see that females are severly under-represented in these state
legislatures.56
Considering ethnicity, 48% of legislators are Yoruba, while 51% are from the Hausa-
Fulani, ethnic group (Table 14). All legislators in Kano, Katsina, and Sokoto (North-West) are
Hausa-Fulani. Similarly, all of the legislators included from the Ekiti and Oyo State Houses are
Yoruba. In the Lagos State Legislature, 19 out of 20 legislators are Yoruba, while one legislator
is from the Ogu (Egun) ethnic group. We can see that these state legislatures in both regions are
relatively ethnically homogenous.
56 This statistic is from a 2006 report from the Nigerian National Bureau of Statistics, entitled Women and Men in Nigeria: Facts and Figures.
19

Referring to Table 15, we see 66% of legislators affiliate with the Muslim religion, while
33% characterize themselves as Christians. Officials from Kano, Katsina, and Sokoto States
(North-West) are all Muslim. 13 out of 13 Ekiti State legislators are Christian. However, in the
Lagos State Assembly, 11 out of 20 legislators identify as Christians, while eight out of 20 are
Muslim. Likewise, nine out of 16 Oyo State legislators are of the Christian faith, and the
remaining seven identify Islam as their religious affiliation.
37% of legislators have completed a post-graduate degree (e.g. Master of Business
Administration, Master of Public Administration; Table 16). For 31% of legislators, the highest
level of education completed is a bachelor’s degree (or equivalent). 17% of legislators have
completed post-secondary school training and/or an advanced diploma. The remaining 15%
have completed secondary school. In the South-West, 13 out of 14 Ekiti State legislators (93%)
have completed at least a bachelor’s degree. In Lagos State, 18 out of 20 (90%) have attained a
university degree (or more), while in Oyo State, this number is 14 out of 16 (88%). In the North-
West Region, 11 out of 15 state legislators (73%) have completed a bachelor’s degree or more.
In Kano State, 9 out of the 20 officials (45%) at least completed university, while in Katsina
State, 5 out of 17 (29%) attained a bachelor’s degree or higher.
Moving to legislators’ prior occupational experiences, we see the majority of officials were
business people (26%), civil servants (23%), or local councilors (21%) before joining the State
Houses of Assembly (Table 17). Other occupations include: commercial farmers (7%); other
professionals (e.g. doctor, engineer, 6%); teachers/head maters (5%); supervisors/mid-level
managers (4%); bankers (3%); university lecturers (2%); lawyers, accountants, general
managers, and journalists (1% each).
Finally, turning to the number of years in legislative office, officials have been members of
20

their respective State Houses for a minimum of two years and a maximum of 12 (Table 18). The
average legislator has held his or her position for five years. On average, Lagos State legislators
have held office for the longest, at a mean of 6 years. On the other hand, legislators in Oyo,
Ekiti, and Katsina States have, on average, spent the least time in the legislature, holding only
one four-year term.
Dependent Variable: Elite Perceptions of Representation
As previously stated, I hypothesize legislators in states that generate more income from
non-oil taxes will be more representative of their constituents. To also reiterate, representation is
the process whereby elected officials gauge, deliberate upon, and incorporate citizen interests in
the execution of decisions and policy (Pitkin 1967, 1969; Huber and Powell, 1994; Aldrich,
1995; Stokes, 1999). In the performance of their representative duties, politicians must prioritize
their constituents’ preferences. Thus, when operationalizing elite perceptions of representation, I
utilize seven indicators. These variables separately measure the extent to which an individual
legislator believes his or her representative function and constituents’ opinions and interests take
precedence over other considerations.
The first indicator measures a legislator’s evaluation of how effective their state House of
Assembly does with representing constituents. Specifically, the item asks, “how well or badly
would you say the State Assembly is doing its job of representing constituents?” Respondents
can answer with the following: “very bad, bad, good, or very good.” A second indicator asks
21

this question, but specifically about “representing women’s interests.”57
The third variable I use to measure representation is legislators’ self-report of the
percentage of time he or she engages in constituency work (out of 100% of their time, and in
comparison to time spent doing plenary work, committee work, party work, and—if they have
one—their other job).58
A fourth indicator is a dummy variable measuring whether a legislator believes
“representing their constituents’ views in parliament” and performing constituency services (e.g.
bringing development to his/her constituency, assisting constituents with their personal
problems, and soliciting funds for his/her constituency) are “the most important part of being a
member of the State Assembly.”59
A fifth indicator is also a dummy variable that captures “in general, when [he/she] takes a
position about an issue in the State Assembly” how much of a priority is a legislator’s
57 “I want you to rate the effectiveness of the State Assembly like a score card. For each of the following areas, how well or badly would you say the State Assembly is doing its job?” Representing constituents? Representing women’s interests? 1=Very bad, 2=Bad, 3=Good, 4=Very good.
58 “What percentage of your time is devoted to each of the following:” Plenary work? Committee work? Constituency work? Party work (outside your constituency)? Your other job (including ministerial work)? PERCENTAGES SHOULD TOTAL TO 100%.
59 “In your opinion, which of these following jobs is the most important part of being member of the State Assembly?” 0=Debating bills and passing laws, 0=Making public policy by writing laws, 0=Overseeing the executive, 1=Representing constituents’ views in parliament, 1=Bringing development to your constituency, 1=Assisting constituents with their personal problems, 1=Soliciting funds for your constituency.
25 “In general, when you take a position about an issue in State Assembly, which of the following is most important? 0=The views of your party leader, 0=The views of your party, 0=The national interest, 0=Your knowledge about the issue, 0=Your personal convictions, 1= The views of your constituents.
22

constituents’ views? This is in comparison to other considerations.60 The sixth variable asks
specifically about legislators’ opinions of “what MPs should (generally) do if there is a conflict
between their party’s position and the views of their constituents.”61
The last measure of elite representation asks legislators what should happen if “a member
of the State Assembly ignores what his/her constituents have to say.” Should he/she remain in
office or lose their seat in the next election?62
These seven indicators each gauge the importance a given legislator places on executing
representative functions and prioritizing his/her constituents’ preferences.
Independent Variable: State Tax Dependence
The key explanatory variable in this analysis is state tax generation: that is, the percentage
of total state revenue derived from taxes on citizens. To capture this, I include a variable for
taxes as a percentage of state income in 2009 (this is the most recent data available). I also use
average tax dependence variable, which represents the mean value of taxes as a portion of state
government revenue between 1999 and 2009. I utilize both of these measures in an attempt to
capture both proximate and longer-term effects of tax reliance on shaping legislators’ incentives
and choices. I expect a positive relationship between elite perceptions of representation and state
60
61 “What should MPs do if there is a conflict between their political party’s position and the views of their constituents?” 0=Support the party position 0=Abstain from voting, 1=Oppose the party position.
62 “If an Member of the State Assembly ignores what his/her constituents have to say, do you think that he/she would still remain in office or lose the next election?” 0=Remain in office, definitely, 0=Remain in office, probably, 1=Lose their seat, probably, 1=Lose their seat, definitely.
23

reliance on tax revenue. It follows that legislators in states that generate more income from non-
oil taxes on citizens (e.g. Lagos and Sokoto States) will be more likely to identify representation
and constituency service as their job priorities. As Timmons (2005: 531) argues, in these tax-
reliant states, officials face “strong incentives to provide benefits to maintain the source of
revenue [that taxes on citizens provide].” These benefits manifest in how legislators establish
their representative duties as precedence. This also includes placing constituents’ interests ahead
of other considerations when making policy decisions (Bates and Lien, 1985; Levi, 1988).
Based on this reasoning (returning to the dependent variables), I expect legislators in tax-reliant
states will be more likely to:
Ha: rate their State House of Assembly as being highly effective in representing constituents.
Hb: rate their State House of Assembly as being highly effective in representing women’s
interests.
Hc: indicate a greater percentage of their time is spent on constituency work.
Hd: identify representation and constituency services are the most important part of being a
member of the State Assembly.
He: report that the views of their constituents are the most important consideration when taking a
position about an issue.
Hf: oppose their party position if there is a conflict with the views of their constituents.
Hg: believe that if a Member of the House of Assembly ignores their constituents’ views, he/she
should lose their seat in the next election.
Analysis and Results: Tax Reliance and Elite Execution of Representation
24

Preliminary Analysis of Correlation
Given the small sample size, I rely on a preliminary analysis of scatterplots and correlation
to test the aforementioned hypotheses. First, I separate the 101 legislators by state. In each of
the six clusters of legislators, I calculate the average value for each indicator of representation
(seven). I then plot the average value of the dependent variables against each state’s average tax
reliance between 1999 and 2009 (explanatory variable 1) and the percentage of state income
derived from taxes in 2009 (explanatory variable 2). According to my hypotheses, legislators
from states that generate higher rates of income from taxes should express attitudes that prioritize
representation and constituency services. In other words, I expect a positive relationship
between elite perceptions of representation and state tax reliance. Figures 5 through 18 present
the results.
Generally, there is a weak relationship between state tax capacity and how legislators rate
the effectiveness of their state legislature in representing constituents (Figures 5 and 6). Though
the line of best fit moves in a positive direction (as hypothesized), the six data points are
scattered widely. Moreover, a Pearson’s coefficient reveals a weak correlation between elite
perceptions of how well their House of Assembly represents constituents and average tax
generation (r = 0.43). The correlation between ratings of the state legislature and state tax
reliance in 2009 is even weaker (r = 0.26). Average tax generation accounts for 18% of variation
in elite perceptions of how well their state legislature represents constituents (r2 = 0.18). State
tax capacity in 2009 only accounts for 7% of the variation (r2 = 0.07). Thus, there is a weak
positive relationship between reliance of tax income and elite views of how effective their state
legislature represents constituents.
On the other hand, elite views of how effective the state legislature represents women has a
25

strong and positive relationship with states’ capacity to extract taxes (Figures 7 and 8). A
Pearson’s coefficient confirms the strength of this correlation: legislators’ views of how well the
House of Assembly represents women is positively related to average tax generation (r = 0.87).
These perceptions positively related to state tax reliance in 2009 (r = 0.94). Moreover, a state’s
average tax generation (1999 – 2009) explains for 76% of variation in elite perceptions of how
effective the state legislature represents women (r2 = 0.76). The portion of state income
generated from taxes in 2009 also accounts for 88% of the variation (r2 = 0.88) in legislators’
ratings. This strong, positive relationship supports the hypothesis that legislators in tax-reliant
states are more likely to rate their State House of Assembly as being effective in representing
women’s interests.
The remaining five indicators of elite representation reveal a similar robust and positive
relationship with state tax capacity. According to Figures 9 and 10, there is a positive
relationship between states that generate more income from taxes between 1999 and 2009 and
legislators who report spending a greater percentage of their time engaged in constituency work
(r = 0.75, r2 = 0.56). There is also a positive relationship whereby elites from states that report a
greater capacity to extract taxes in 2009 are also more likely to claim that they spend more time
doing directing serving their constituents (r = 0.97, r2 = 0.94).
There is a strong, positive link between states that generate more of their average income
(1999 – 2009) from taxes and state legislators that are more likely to identify representation and
constituency work as their most important job (r = 0.78, r2 = 0.61) (Figure 11). Similarly,
legislators from a state that was more tax reliant in 2009 tend to report representation as a
26

legislator’s primary concern (Figure 12; r = 0.96, r2 = 0.92). Legislators from states with a high
capacity to generate tax income (1999 – 2009) also report that their constituents’ views are the
most important consideration when making decisions (Figure 13; r = 0.73, r2 = 0.53). This
positive relationship is even stronger when considering state tax generation is 2009 (Figure 14; r
= 0.93, r2 = 0.86). State tax reliance in 2009 accounts for 86% of the variation in whether elites
identify constituents’ views as the most significant concern in their decision-making.
A legislator from a state that is (on average) a strong generator of tax income is more likely
to report that, given a conflict between the views of her political party and her constituents, she
would oppose her party (r = 0.64, r2 = 0.41) (Figure 15). There is also a positive relationship
between state tax reliance in 2009 and the likelihood legislators will choose their constituents’
views over their party’s position when making policy (Figure 16; r = 0.89, r2 = 0.79). Finally, a
state’s tax capacity (evidenced by the percentage of income between 1999 and 2009 derived
from taxes on citizens) is positively related to the likelihood that legislators will articulate that
officials who ignore their constituents should lose their seats (Figure 17; r = 0.80, r2 = 0.64).
Similarly, legislators from states that were strong tax generators in 2009 are also more likely to
report this opinion (Figure 18; r = 0.86, r2 = 0.74).
Taken together these scatterplots and analyses of correlation support my initial hypotheses.
There is a positive relationship between a state’s reliance on income from taxes on citizens and
various indicators of state legislators’ perceptions of representation. This preliminary analysis
lends support to the assertion that elected officials in states with a strong tax capacity are more
likely to report prioritizing representation and constituency services.
27

Given this initial finding of a positive relationship, I now employ a more rigorous test of
the hypotheses.
While the various elite representation variables are measured at the level of the individual
legislator, the two indicators of state tax reliance (explanatory variables) are measured at the
state (group) level. I rely on hierarchical linear modeling (HLM) as a more rigorous test of my
hypotheses. In order to isolate the effect of state tax dependence on legislators’ attitudes and
behavior toward representation, I include two other control variables. I use the number of years
a legislator has been a member of the State House of Assembly as a control variable.63 I expect
a positive relationship between legislators’ total years in office and their willingness to prioritize
representation duties. As an official spends more time as a member of the legislature, he/she
gain more experience in interacting with constituents, gauging preferences, problems, or interests
and acting upon them.
I also include a measure of party affiliation, specifically, whether the legislator in question
is a member of the majority party in his/her state legislature.64 Particularly, with rating his/her
Assembly’s effectiveness in representing constituents, a legislator in the majority party could
perceive a more favorable evaluation than legislators in the opposition.
Taken together, this results in the following model specification:
Elite Representation = a + b1 (Average % Taxes) + b2 (2009 % Taxes) + b3 (Years in Office) + b4 (Member of Majority Party).
“Elite Representation” is operationalized using the seven afore-mentioned dependent variables.
63 “How many total years have you been a member of the State Assembly?” The variable is given in years.
64 This is measured as a dummy variable, where a respondent will receive a value of 1 if he/she is a member of the majority party in their state legislature and a 0 otherwise. In the case of Ekiti State, where membership is evenly divided between two parties, all respondents receive a value of 0 because neither party is a majority.
28

This results in seven separate analyses.65 The average tax reliance variable is captured by the
mean value of taxes as a portion of state government revenue between 1999 and 2009. I also use
taxes as a percentage of state income in 2009 as a key independent variable.
For the six analyses, where the dependent variables are binary, dummy variables (Ha, Hb,
Hd, He, Hf, Hg), I utilize multi-level mixed effects logistic regression. For the remaining
analysis where the dependent variable is continuous (percentage of time legislator’s report doing
constituency work, Hc), I use multi-level mixed effects linear regression. I execute these
analyses with STATA 12.0 with clustered robust standard errors (clustered by the six case-
states).
Multi-Level Analysis of Elite Representation and Revenue
Tables 19A and 19B present the results of the seven analyses investigating the relationship
between Nigerian legislators’ perceptions of representation and tax revenue dependence. Since
my sample size is small (n = 101), in order to avoid false precision, I only present the
coefficients to demonstrate the directionality of the relationships and whether the results support
my hypotheses. In terms of substantive interpretation of the HLM coefficients, I will discuss the
broad trends.
Evidence confirms the expectations outlined in this paper: there is a positive relationship
between increased state tax reliance and legislators from those states prioritizing representation
and constituent preferences. Elected officials in states with a greater capacity to extract tax
income also express attitudes that prioritize representation of citizens and constituency service.
65 I restructure legislators’ ratings of the House of Assembly’s effectiveness in representing constituents and representing women (originally ordinal variables) as a binary dummy variable (very bad/bad = 0; very good/good = 1).
29

Furthermore, across multiple measures, as hypothesized, the positive relationship between
representation and higher rates of government tax generation endures.
Turning to the first column in Table 19A, we see both measures of state tax dependence
exert a positive influence on legislators’ evaluation of their State Assembly’s ability to represent
constituents. With that said, neither coefficient is statistically significant at the 90% level.
However, this lack of significance could be a result of minimal variation in this particular
variable. Most legislators believe their House of Assembly is doing a good/very good job of
representing constituents. In fact, in this sample, 93% of legislators (irrespective of state and
region) believe their State Assembly is doing a good or very good job of representing
constituents. However, with a larger sample, I would anticipate the positive relationship between
higher levels of state tax generation and elite execution of representation (measured with
legislative ratings of the legislature’s effectiveness) would meet the significance threshold.
Additionally, legislators from the majority party are more likely than minority members to report
that their state legislature is effective in its representation function (b = 0.1).
When considering legislators’ evaluations of the legislature’s success in representing
women, we observe a significant and positive relationship (column 2). State average tax
generation is positively related to officials’ evaluation of the state legislature (b = 0.045).
Furthermore, a state’s tax reliance in 2009 is also positively linked to legislators’ rating of the
State Assembly’s ability to represent women (b = 0.026). Elected officials in states that generate
higher portions of income from taxes on citizens are more likely to rate the state legislature as
effective in representing women.
As hypothesized, legislators in more tax-reliant states report spending a greater percentage
of their time conducting constituency service (column 3). As a state’s average tax income
30
increases, the likelihood legislators report spending more time doing constituency work also
increases (b = 0.105). Similarly, as in states that generated more of the 2009 revenue from taxes
on citizens, legislators are also indicate spending more time engaged in constituency work (b =
0.269).
Looking now at Table 19B, we see state tax generation (both measures) also exerts a
strong, positive influence on the likelihood a legislator will indicate “representing constituents’
views in parliament” or some form of constituency service as a legislator’s most important job
(column 4). Both the average tax income variable (b = 0.047) and a state’s 2009 income from
taxes (b = 0.043) exert a positive influence. Legislators in tax-reliant states are more likely than
their counterparts in other states to choose representation as their primary job.
When making decisions, legislators in tax-reliant states are more likely to designate the
views of their constituents are their most important consideration (column 5). As a state’s
average tax reliance (b = 0.043) and 2009 tax income generation (b = 0.095), the probability
legislators will prioritize constituents’ views in decision-making also increases.
In the event of a conflict between a legislator’s political party position and his/her
constituents’ views, officials in more tax dependent states are more likely to oppose their
political parties (column 6). Average tax generation (b = 0.076) and tax as a portion of state
revenue in 2009 (b = 0.086) share positive and significant relationships with the likelihood
legislators will choose to represent their citizens’ preferences, even if those preferences differ
from the party position.
Finally, legislators in states that generate more income from taxes are report that a member
of the State Assembly should lose their seat if he/she ignores what his/her constituents have to
say (column 7). Evidence suggests a positive relationship between a state’s average percentage
31

of tax generation (b = 0.092) and state tax reliance in 2009 (b = 0.093) and the liklihood
legislators in the state will express that officials who ignore their citizens should not be reelected.
Contrary to my initial hypothesis, results indicate that length of time in office has a
negative influence on legislators’ perceptions of representation. As an official spends more years
as member of the state legislature, he/she spends less time performing constituency services (b =
-0.387). This legislator is also less likely to identify representation and constituency work as a
legislator’s most important job (b = -0.054) or identify constituents’ views as his/her most
important consideration in decision-making (b = -0.043). As the amount of time a legislator
spends in office increases, he/she is less likely to oppose their party position even if it conflicts
with constituent views (b = -0.093). Last, more years in office correspond with the likelihood a
legislator will be less likely to believe a member of the Assembly should lose his/her seat if
he/she ignores constituents (b = -0.074). These findings could be the result of senior legislators
choosing to take on leadership positions in the House of Assembly and/or their political party. In
this instance, a legislator would spend more time in administration, rather than focusing on
representation and constituency service. As legislators gain leadership positions, it is also
possible this role competes with the representative function. Conversely, it is possible junior
legislators, in an effort to secure reelection, may be more committed to constituency work and
representation. In this scenario, senior legislators may believe they have already demonstrated
their representative function, and now choose prioritize other factors.
These analyses demonstrate source of revenue is a significant determinant of individual
legislators’ attitudes and behaviors toward the execution of the representation function. At the
previous findings confirm that sources of government trickle down to the micro-level. State
reliance on taxes (or other sources of revenue) shape legislators’ incentives to prioritize (or not
32

prioritize) representation and constituent interests. As scholars have argued in other contexts,
when government is generates income from taxes on citizens, there is a greater inducement for
public officials to shift policy decisions to their constituents’ interests. Elected leaders do so in
order to maintain income from their tax base (Tilly, 1985/1990; Bates and Lien, 1985; Levi,
1988; North and Weingast, 1989; Hoffman and Norberg, 1994; Timmons, 2005). My analysis
demonstrates this theory can also be used to explain how Nigerian elites perceive and carry out
representation in state legislatures. Nigerian legislators in settings with a greater capacity to
generate tax income also prioritize representation of constituents’ interests and spend more time
performing constituency services.
Conclusion
This paper investigates the relationship between revenue at representation at the micro-
level. Analysis demonstrates the incentives created by reliance on different forms of public
revenue shape individual elected official’s priorities and decision-making. As previous scholars
have theorized in Western Europe, when government is more reliant on taxes, elected leaders are
more likely to say that they would shift public policy decisions to reflect citizens’ interests.
They make this shift as a part of the contract with constituents: tax payment in exchange for a
greater influence in governance (Tilly, 1985/1990; Bates and Lien, 1985; Levi, 1988). Utilizing
original elite surveys and Nigeria’s intra-regional and inter-regional variation, we have seen this
theory holds in an African context: Nigerian elite attitudes change in the context of the different
restraints produced by tax generation. Nigerian legislators in more tax-reliant states present
themselves as most likely to represent citizens: they report spending more time performing
constituency services and prioritizing constituents’ preferences and interests above other
33

considerations (e.g. party position, personal views, etc). Multi-level analysis once again
confirms my hypotheses that legislators in states with higher levels of tax generation are more
likely to identify constituents’ interests and needs as important. These officials are also more
likely to view their House of Assembly as effective in carrying out the representative function.
Tables and Figures
Table 1: TAX GENERATION IN THE SOUTH-WEST REGION (TAX REVENUE AS A PERCENTAGE OF TOTAL, %)STATE 2005 2007 2008 2009EKITI 9.3 10.1 11.9 13.1LAGOS 51.2 62.2 63.5 64.3OGUN N/A 11.4 27.5 29.3ONDO 10.1 15.2 16.4 N/AOSUN 14.9 15.2 16.2 22.0OYO 18.3 22.3 20.0 20.6
Table 2: TAX GENERATION IN THE NORTH-EAST REGION (TAX REVENUE AS A PERCENTAGE OF TOTAL, %)STATE 2005 2007 2008 2009ADAMAWA 3.3 4.7 4.979 5.1BAUCHI 2.9 2.9 3.6 5.8BORNO 3.8 4.8 5.3 7.5GOMBE 4.6 5.2 7.1 11.1TARABA 2.3 6.7 8.2 9.0
34

YOBE 2.5 2.5 2.4 3.0
Table 3: TAX VS. OIL INCOME IN NIGERIA’S REGIONS (PRECENTAGE OF TOTAL REVENUE, 1999 – 2009, %)REGION TAX OILNORTHERN STATES 8.2 64.5SOUTHERN OIL STATES 11.6 67.6SOUTHERN, NON-OIL STATES 18.4 53.3
35

Table 4: STANDARD DEVIATION IN REGIONAL TAX AND OIL INCOME AS A PERCENTAGE OF STATE BUDGET (1999 – 2009, %)
REGION
STANDARD DEVIATION IN TAX INCOME
STANDARD DEVIATION IN OIL INCOME
NORTH-WEST 4.252 4.106MIDDLE BELT 2.062 3.192NORTH-EAST 2.380 3.885SOUTH-WEST 16.568 17.977SOUTH-SOUTH 5.931 7.989SOUTH-EAST 3.726 3.054
Table 5: AVERAGE TAX GENERATION IN THE SOUTH-WEST REGION, 1999 - 2009 (% OF TOTAL REVENUE)STATE TAX OILEKITI 7.5 71.0LAGOS 53.4 23.5OGUN 18.9 56.5ONDO 11.2 73.5OSUN 16.4 61.1OYO 16.7 59.1
36

Table 6: AVERAGE TAX GENERATION IN THE NORTH-WEST REGION, 1999 - 2009 (% OF TOTAL REVENUE)STATE TAX OILJIGAWA 7.6 67.4KADUNA 12.9 59.4KANO 13.2 56.6KATSINA 7.1 66.2KEBBI 8.2 65.7SOKOTO 17.6 63.6ZAMFARA 7.9 66.1
Table 7: TAX GENERATION IN THE SOUTH-WEST REGION (TAX REVENUE AS A PERCENTAGE OF TOTAL REVENUE, 1999 – 2009, %)STATE 1999 2000 2001 2002 2003LAGOS (HIGH PERFORMER) 40.8 41.8 49.7 54.3 53.4OYO (AVERAGE PERFORMER) 10.0 11.5 13.9 15.9 17.7EKITI (LOW PERFORMER) 2.8 3.2 5.3 6.0 6.0
Table 7 (cont’d): TAX GENERATION IN THE SOUTH-WEST REGION (TAX REVENUE AS A PERCENTAGE OF TOTAL REVENUE, 1999 – 2009, %)STATE 2005 2007 2008 2009 MEANLAGOS (HIGH PERFORMER) 51.2 62.2 63.5 64.3 53.4OYO (AVERAGE PERFORMER) 18.3 22.3 20.0 20.6 16.7EKITI (LOW PERFORMER) 9.3 10.1 11.9 13.1 7.5
37

Table 8: OIL DEPENDENCE IN THE SOUTH-WEST REGION (PETROLEUM REVENUE AS A PERCENTAGE OF TOTAL REVENUE, 1999 – 2009, %)STATE 1999 2000 2001 2002 2003
LAGOS (HIGH PERFORMER) 22.95 39.09 39.26 20.95 20.37OYO (AVERAGE PERFORMER) 54.33 66.12 77.65 51.58 65.37EKITI (LOW PERFORMER) 73.85 82.03 85.73 62.47 73.69
Table 8 (cont’d ): OIL DEPENDENCE IN THE SOUTH-WEST REGION (PETROLEUM REVENUE AS A PERCENTAGE OF TOTAL REVENUE, 1999 – 2009, %)STATE 2005 2007 2008 2009 MEAN
LAGOS (HIGH PERFORMER) 26.09 10.62 16.43 15.34 23.5OYO (AVERAGE PERFORMER) 62 55.38 49.95 49.2 59.1EKITI (LOW PERFORMER) 80.37 65.4 58.04 57.57 71.0
38

Table 9: TAX GENERATION IN THE NORTH-WEST REGION (TAX REVENUE AS A PERCENTAGE OF TOTAL REVENUE, 1999 – 2009, %)STATE 1999 2000 2001 2002 2003SOKOTO (HIGH PERFORMER) 5.4 6.8 6.7 8.0 8.9KANO (AVERAGE PERFORMER) 6.8 10.4 11.4 12.8 12.7KATSINA (LOW PERFORMER) 2.9 3.7 4.4 6.0 6.08
Table 9 (cont’d): TAX GENERATION IN THE NORTH-WEST REGION (TAX REVENUE AS A PERCENTAGE OF TOTAL REVENUE, 1999 – 2009, %)STATE 2005 2007 2008 2009 MEANSOKOTO (HIGH PERFORMER) 8.9 19.3 46.7 47.7 17.6KANO (AVERAGE PERFORMER) 11.2 14.7 17.2 21.6 10.8KATSINA (LOW PERFORMER) 9.2 8.4 10.9 11.8 7.1
39
Table 10: OIL DEPENDENCE IN THE NORTH-WEST REGION (PETROLEUM REVENUE AS A PERCENTAGE OF TOTAL REVENUE, 1999 – 2009, %)STATE 1999 2000 2001 2002 2003SOKOTO (HIGH PERFORMER) 77.08 84.01 76.32 72.37 73.48KANO (AVERAGE PERFORMER) 51.53 70.87 50.58 54.59 39.28KATSINA (LOW PERFORMER) 75.95 75.35 77.06 46.71 69.8
Table 10 (cont’d): OIL DEPENDENCE IN THE NORTH-WEST REGION (PETROLEUM REVENUE AS A PERCENTAGE OF TOTAL REVENUE, 1999 – 2009, %)STATE 2005 2007 2008 2009 MEANSOKOTO (HIGH PERFORMER) 66.25 53.42 35.28 34.41 76.7KANO (AVERAGE PERFORMER) 76.79 63 49.55 53.22 53.4KATSINA (LOW PERFORMER) 78.42 48.62 63.2 60.69 69.0

Table 11: SAMPLING PROCEDURES IN SIX STATE LEGISLATURES
STATE
TOTAL NUMBER OF LEGISLATORS
IN STATE LEGISLATURE
NUMBER OF STATE
LEGISLAORS IN SAMPLE
LAGOS 40 20OYO 32 16EKITI 26 13
Subtotal 98 49
SOKOTO 30 15KANO 40 20KATSINA 34 17
Subtotal 104 52
TOTAL 202 101
Table 12:AGE OF LEGISLATORS (YEARS), n = 101
STATES MINIMUM MAXIMUM MEANLAGOS 38 63 49OYO 37 55 47EKITI 35 55 46SOKOTO 33 58 44KANO 38 57 48KATSINA 40 55 48TOTAL SAMPLE 33 63 47
40

Table 13: GENDER OF LEGISLATORS, n = 101
STATES MALE FEMALELAGOS 17/20 3/20OYO 15/16 1/16EKITI 13/13 0/13SOKOTO 15/15 0/15KANO 20/20 0/20KATSINA 17/17 0/17
TOTAL SAMPLE 96% 4%
Table 14: ETHNICITY OF LEGISLATORS, n = 101
STATES YORUBAHAUSA-FULANI OTHER
LAGOS 19/20 0/20 1/20OYO 16/16 0/16 0/16EKITI 13/13 0/13 0/13SOKOTO 0/15 15/15 0/15KANO 0/20 20/20 0/20KATSINA 0/17 17/17 0/17
TOTAL SAMPLE 48% 51% 1%
41

Table 15: RELIGION OF LEGISLATORS, n = 101
STATES CHRISTIANITY ISLAMLAGOS 11/20 8/20OYO 9/16 7/16EKITI 13/13 0/13SOKOTO 0/15 15/15KANO 0/20 20/20KATSINA 0/17 17/17
TOTAL SAMPLE* 33% 66%* 1% of respondents declined answering.
Table 16: HIGHEST LEVEL LEGISLATORS' EDUCATION, n = 101
STATESSECONDARY
SCHOOL
POST-SECONDARY
DIPLOMABACHELOR'S
DEGREE
POST-GRADUATE
DEGREELAGOS 0/20 2/20 7/20 11/20OYO 0/16 2/16 7/16 7/16EKITI 0/13 1/13 1/13 11/13SOKOTO 4/15 0/15 9/15 2/15KANO 3/20 8/20 5/20 4/20KATSINA 6/17 6/17 2/17 3/17
TOTAL SAMPLE 15% 17% 31% 37%
42
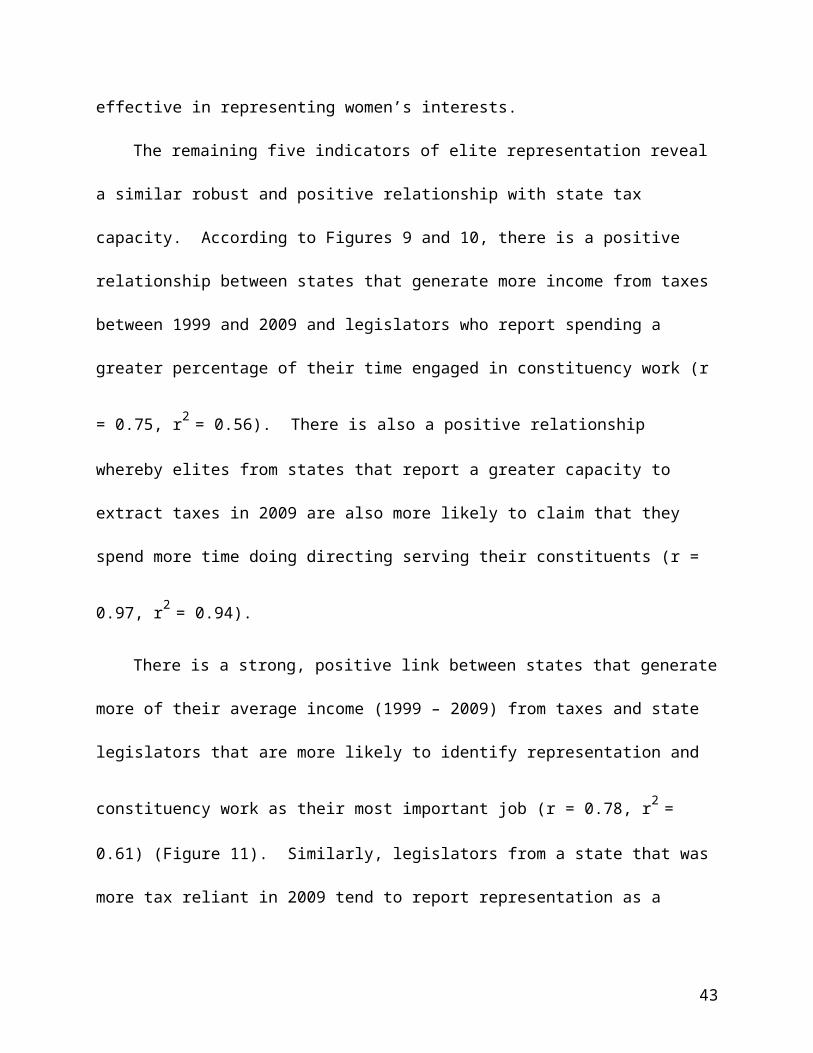
Table 17: OCCUPATION PRIOR TO LEGISLATIVE OFFICE (%), n = 101
OCCUPATION %BUSINESS PERSON 26CIVIL SERVANT 23LOCAL COUNCILLOR 21COMMERCIAL FARMER 7OTHER PROFESSIONAL 6TEACHER 5SUPERVISOR/MID-LEVEL MANAGER 4BANKER 3UNIVERSITY LECTURER 2LAWYER 1ACCOUNTANT 1GENERAL MANAGER 1JOURNALIST 1
Table 18: NUMBER OF YEARS IN LEGISLATIVE OFFICE (YEARS), n = 101
STATES MINIMUM MAXIMUM MEANLAGOS 4 12 6OYO 3 8 4EKITI 4 4 4SOKOTO 4 12 5KANO 4 12 5KATSINA 2 4 4
TOTAL SAMPLE 2 12 5
43

Table 19A: EFFECT OF REVENUE ON LEGISLATORS' EXECUTION OF REPRESENTATION
1 2 3
REPRESENTING CONSTITUENTS
REPRESENTING WOMEN
TIME SPENT DOING
CONSTITUENCY SERVICE
STATE LEVEL
AVERAGE STATE TAX DEPENDENCE (1999 - 2009)
0.035(0.002)
0.045*(0.046)
0.198*(0.117)
2009 STATE TAX DEPENDENCE
0.008(0.002)
0.046*(0.037)
0.269*(0.094)
INDIVIDUAL LEVEL
YEARS IN OFFICE -0.015(0.009)
-0.019(0.019)
-0.387*(0.098)
MEMBER OF MAJORITY PARTY
0.100*(0.038)
0.049*(0.083)
0.546(2.110)
Notes: *p < 0.10, two-tailed.
44

Table 19A (cont’d): EFFECT OF REVENUE ON LEGISLATORS' EXECUTION OF REPRESENTATION
1 2 3
REPRESENTING CONSTITUENTS
REPRESENTING WOMEN
TIME SPENT DOING
CONSTITUENCY SERVICE
CONSTANT 0.942* 0.762* 24.092*STANDARD ERROR 0.048 0.104 2.653RANDOM EFFECTSRESIDUAL STANDARD DEVIATION 0.163 0.353 9.035
INTRACLASS CORRELATION 0.011 0.025 0.636
LOG LIKLIHOOD -138.164 -76.512 -52.81
OBSERVATIONS 101 101 101STATES 6 6 6
Notes: *p < 0.10, two-tailed.
45

Notes: *p < 0.10, two-tailed.
46
Table 19B: EFFECT OF REVENUE ON LEGISLATORS' EXECUTION OF REPRESENTATION
4 5 6 7
REPRESENTATION IS MOST
IMPORTANT JOB
VIEWS OF CONSTITUENTS
ARE MOST IMPORTANT
CONSIDERATION
OPPOSE PARTY TO SUPPORT
CONSTITUENTS' VIEWS
MPs WHO IGNORE
CONSTITUENTS SHOULD LOSE
STATE LEVELAVERAGE STATE TAX DEPENDENCE (1999 - 2009)
0.047*(0.005)
0.095*(0.059)
0.076*(0.012)
0.092*(0.006)
2009 STATE TAX DEPENDENCE
0.043*(0.004)
0.043*(0.005)
0.086*(0.009)
0.093*(0.005)
INDIVIDUAL LEVEL
YEARS IN OFFICE -0.054*(0.023)
-0.043*(0.055)
-0.093*(0.053)
-0.074*(0.038)
MEMBER OF MAJORITY PARTY
0.107(0.122)
0.089(0.107)
0.115(0.223)
0.174*(0.102)
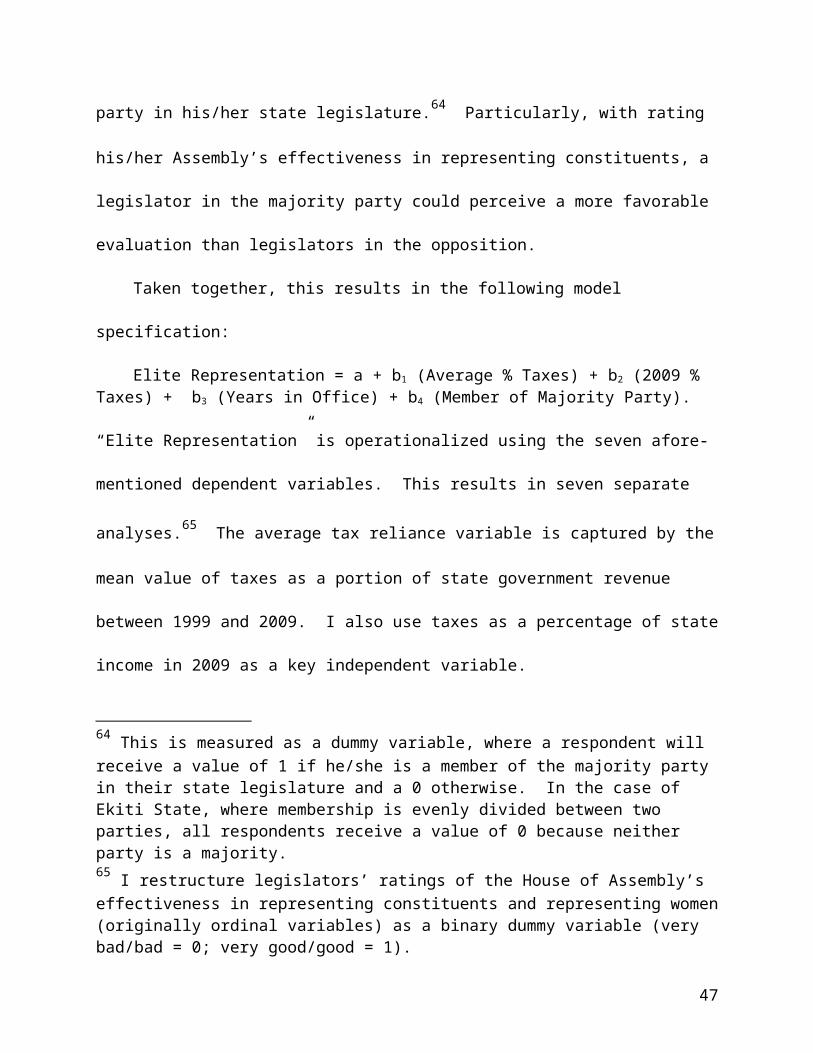
Table 19B (cont’d): EFFECT OF REVENUE ON LEGISLATORS' EXECUTION OF REPRESENTATION
4 5 6 7
REPRESENTATION IS MOST
IMPORTANT JOB
VIEWS OF CONSTITUENTS
ARE MOST IMPORTANT
CONSIDERATION
OPPOSE PARTY TO SUPPORT
CONSTITUENTS' VIEWS
MPs WHO IGNORE
CONSTITUENTS SHOULD LOSE
CONSTANT -0.313* 0.340* 0.475* 0.505*STANDARD ERROR 0.122 0.135 0.280 0.129RANDOM EFFECTSRESIDUAL STANDARD DEVIATION
0.415 0.459 0.954 0.438
INTRACLASS CORRELATION 0.029 0.032 0.067 0.031
-2 x LOG LIKLIHOOD (DEVIANCE)
-54.548 -64.718 -80.646 -59.985
N 101 101 101 101STATES 6 6 6 6Notes: *p < 0.10, two-tailed.
47
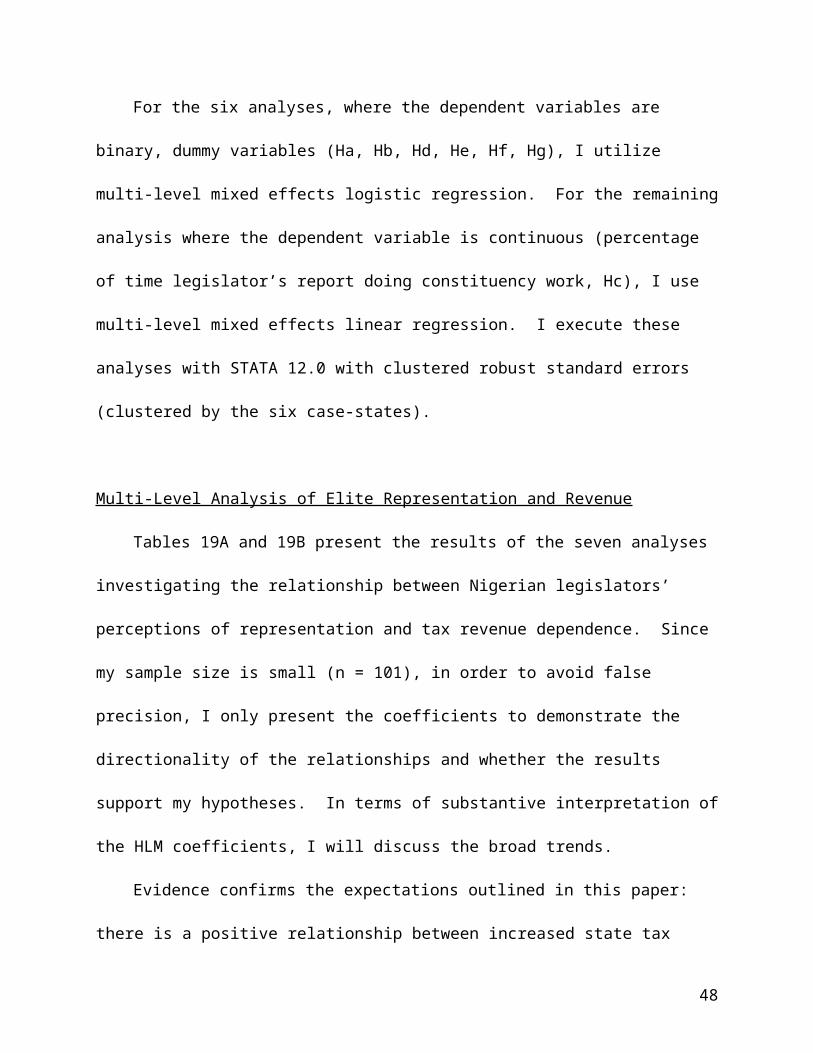
Figure 1: Tax Generation in the South-West Cases (1999 – 2009)
0
10
20
30
40
50
60
70
LAGOS (HIGH PERFORMER)OYO (AVERAGE PERFORMER)EKITI (LOW PERFORMER)
1999 - 2009
% O
F ST
AT
E R
EV
EN
UE
48

Figure 2: Oil Dependence in the South-West Cases (1999 – 2009)
0
10
20
30
40
50
60
70
80
90
100
LAGOS (HIGH PERFORMER)OYO (AVERAGE PERFORMER)EKITI (LOW PERFORMER)
1999 - 2009
% O
F ST
AT
E R
EV
EN
UE
49

Figure 3: Tax Generation in the North-West Cases (1999 – 2009)
0
10
20
30
40
50
60
SOKOTO (HIGH PERFORMER)KANO (AVERAGE PERFORMER)KATSINA (LOW PERFORMER)
1999 - 2009
% O
F ST
AT
E R
EV
EN
UE
50

Figure 4: Oil Dependence in the North-West Cases (1999 – 2009)
0
10
20
30
40
50
60
70
80
90
SOKOTO (HIGH PERFORMER)KANO (AVERAGE PERFORMER)KATSINA (LOW PERFORMER)
1999 - 2009
% O
F ST
AT
E R
EV
EN
UE
51
Figure 5: Legislators’ Ratings of How Effective their State Legislature Represents Constituents vs. Average State Tax Generation
Correlation = 0.43r2 = 0.18
0 10 20 30 40 50 603
3.1
3.2
3.3
3.4
3.5
3.6
3.7
3.8
3.9
4
EKITI
LAGOS
KANOOYO
KATSINA
SOKOTO
TAXES AS A % OF STATE INCOME (AVERAGE, 1999 - 2009)
AV
ER
AG
E R
AT
ING
OF
STA
TE
LE
GIS
-L
AT
UR
E
52
Figure 6: Legislators’ Ratings of How Effective their State Legislature Represents Constituents vs. 2009 State Tax Generation
Correlation = 0.26r2 = 0.07
0 10 20 30 40 50 60 703
3.1
3.2
3.3
3.4
3.5
3.6
3.7
3.8
3.9
4
EKITI
LAGOS
OYOKANO
KATSINA
SOKOTO
TAXES AS A % OF STATE INCOME (2009)
AV
ER
AG
E R
AT
ING
OF
STA
TE
L
EG
ISL
AT
UR
E
53

Figure 7: Legislators’ Ratings of How Effective their State Legislature Represents Woman vs. Average State Tax Generation
Correlation = 0.87r2 = 0.76
0 10 20 30 40 50 602
2.2
2.4
2.6
2.8
3
3.2
3.4
3.6
3.8
4
EKITI
LAGOS
OYO
KANO
KATSINA
SOKOTO
TAXES AS A % OF STATE INCOME (AVERAGE, 1999 - 2009)
AV
ER
AG
E R
AT
ING
OF
STA
TE
L
EG
ILA
TU
RE
54

Figure 8: Legislators’ Ratings of How Effective their State Legislature Represents Woman vs. 2009 State Tax Generation
Correlation = 0.94r2 = 0.88
0 10 20 30 40 50 60 702
2.2
2.4
2.6
2.8
3
3.2
3.4
3.6
3.8
4
EKITI
LAGOS
OYO
KANO
KATSINA
SOKOTO
TAXES AS A % OF STATE INCOME (2009)
AV
ER
AG
E R
AT
ING
OF
STA
TE
LE
G-
ISL
AT
UR
E
55
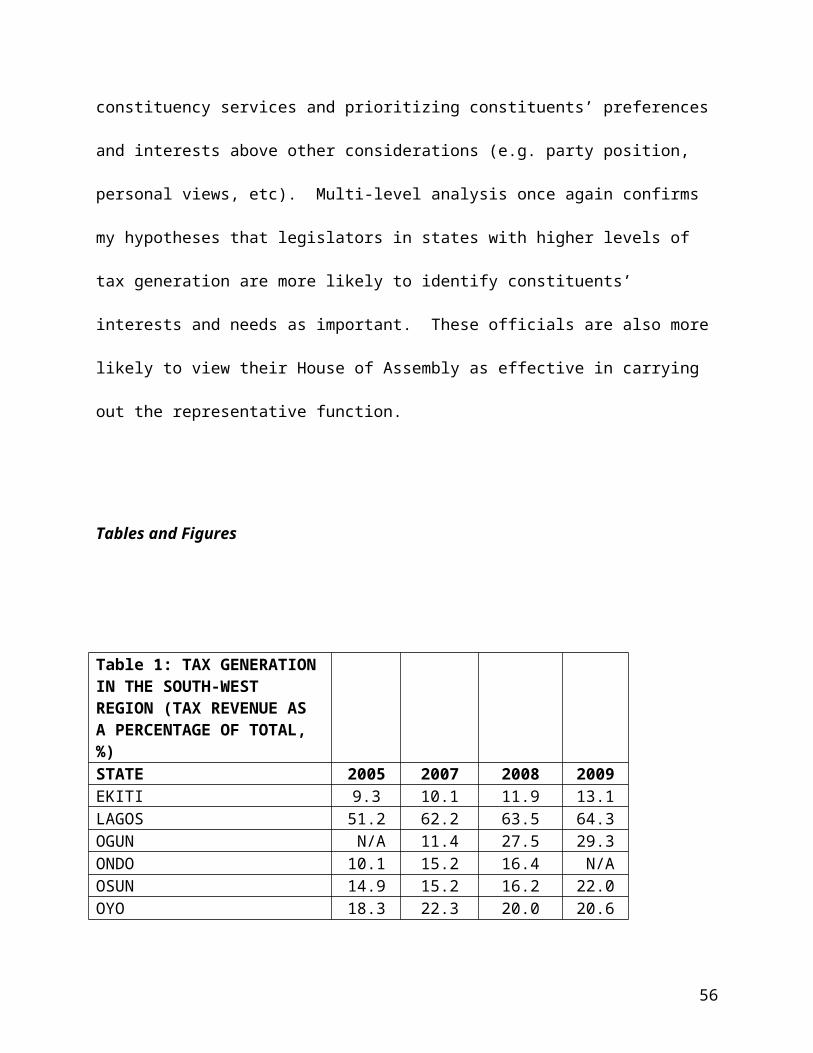
Figure 9: Time Legislators Report Devoting to Constituency Work vs. Average State Tax Generation
Correlation = 0.75 r2 = 0.56
0 10 20 30 40 50 6020
25
30
35
40
45
50
55
EKITI
LAGOS
OYOKANO
KATSINA
SOKOTO
TAXES AS A % OF STATE INCOME (AVERAGE, 1999 - 2009)
AV
ER
AG
E %
TIM
E D
EV
OT
ED
TO
C
ON
STIT
UE
NC
Y W
OR
K
56
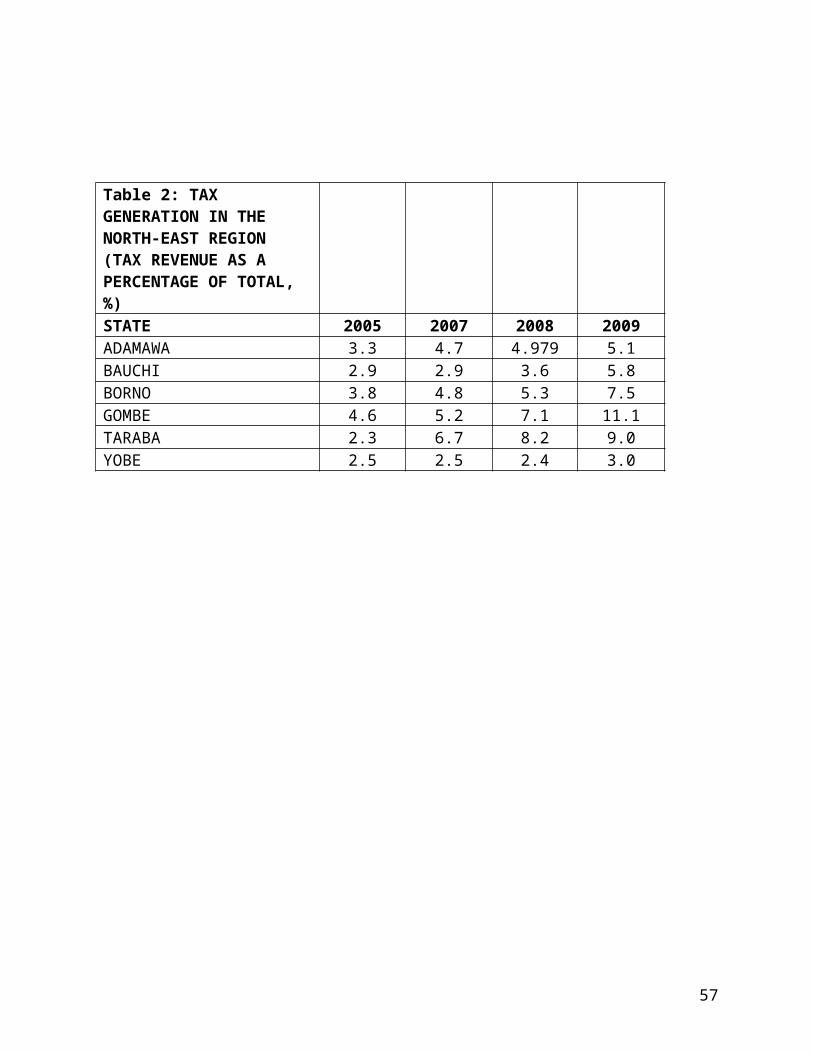
Figure 10: Time Legislators Report Devoting to Constituency Work vs. 2009 State Tax Generation
Correlation = 0.97r2 = 0.94
0 10 20 30 40 50 60 7020
25
30
35
40
45
50
55
60
EKITI
LAGOS
OYOKANO
KATSINA
SOKOTO
TAXES AS A % OF STATE INCOME (2009)
AV
ER
AG
E %
TIM
E D
EV
OT
ED
TO
C
ON
STIT
UE
NC
Y W
OR
K
57

Figure 11: Representation is Legislator’s Most Important Job vs. Average State Tax Generation
Correlation = 0.78r2 = 0.61
0 10 20 30 40 50 600.1
0.2
0.3
0.4
0.5
0.6
0.7
0.8
EKITI
LAGOS
OYOKANO
KATSINA
SOKOTO
TAXES AS A % OF STATE INCOME (AVERAGE, 1999 - 2009)
RE
PRE
SEN
TA
TIO
N IS
MO
ST IM
-PO
RT
AN
T J
OB
(AV
ER
AG
E)
58

Figure 12: Representation is Legislator’s Most Important Job vs. 2009 State Tax Generation
Correlation = 0.96r2 = 0.92
0 10 20 30 40 50 60 700.1
0.2
0.3
0.4
0.5
0.6
0.7
0.8
EKITI
LAGOS
OYO
KANO
KATSINA
SOKOTO
TAXES AS A % OF STATE INCOME (2009)
RE
PRE
SEN
TA
TIO
N IS
MO
ST IM
-PO
RT
AN
T J
OB
(AV
ER
AG
E)
59

Figure 13: Constituents’ Views Are the Most Important Consideration When Making Decisions vs. Average State Tax Generation
Correlation = 0.73r2 = 0.53
0 10 20 30 40 50 600
0.1
0.2
0.3
0.4
0.5
0.6
0.7
0.8
EKITI
LAGOS
OYO
KANO
KATSINA
SOKOTO
TAXES AS A % OF STATE INCOME (AVERAGE, 1999 - 2009)
CO
NST
ITU
EN
TS
AR
E M
OST
IM-
POR
TA
NT
CO
NSI
DE
RA
TIO
N (A
V-
ER
AG
E)
60

Figure 14: Constituents’ Views Are the Most Important Consideration When Making Decisions vs. 2009 State Tax Generation
Correlation = 0.93r2 = 0.86
Figure 15: In Case of Conflict, Will Oppose Party to Support Constituents vs. Average State Tax Generation
0 10 20 30 40 50 60 700
0.1
0.2
0.3
0.4
0.5
0.6
0.7
0.8
EKITI
LAGOS
OYO
KANO
KATSINA
SOKOTO
TAXES AS A % OF STATE INCOME (2009)
CO
NST
ITU
EN
TS
AR
E M
OST
IM-
POR
TA
NT
CO
NSI
DE
RA
TIO
N (A
V-
ER
AG
E)
61
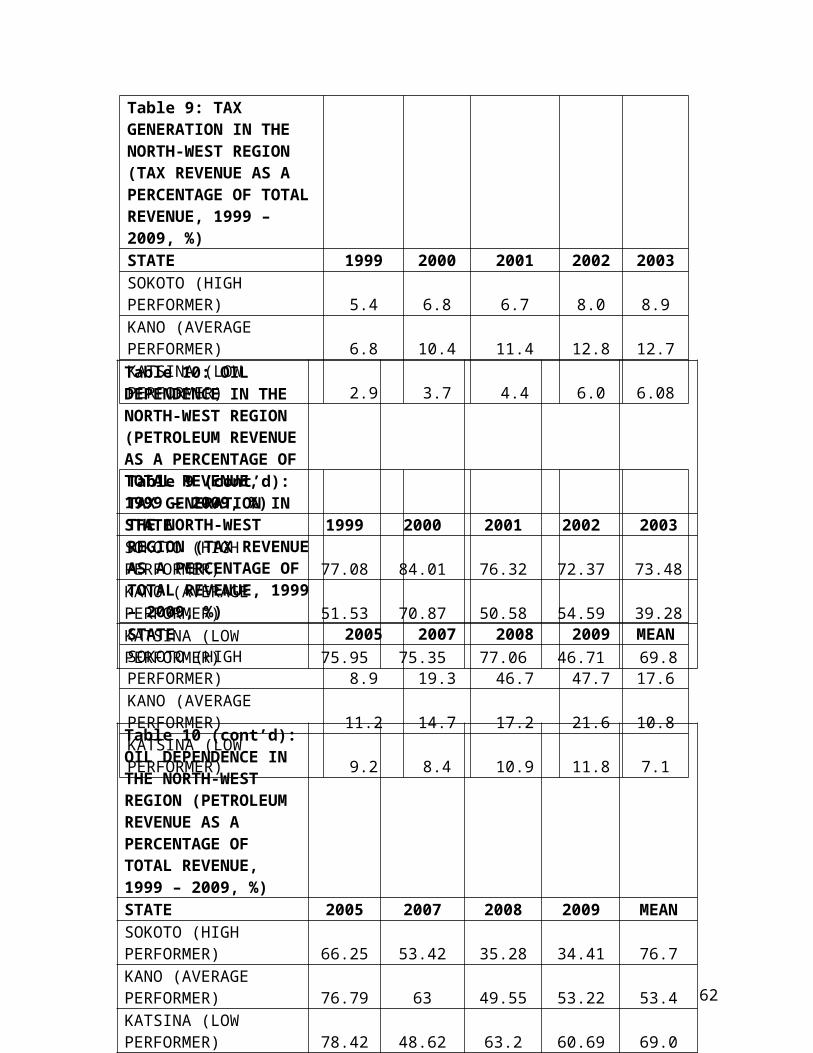
Correlation = 0.64r2 = 0.41
Figure 16: In Case of Conflict, Will Oppose Party to Support Constituents vs. 2009 State Tax Generation
0 10 20 30 40 50 600
0.1
0.2
0.3
0.4
0.5
0.6
0.7
0.8
0.9
1
EKITI
LAGOS
OYO
KANO
KATSINA
SOKOTO
TAXES AS A % OF STATE INCOME (AVERAGE, 1999 - 2009)
OPP
OSE
PA
RT
Y T
O S
UPP
OR
T
CO
NST
ITU
EN
TS
(AV
ER
AG
E)
62
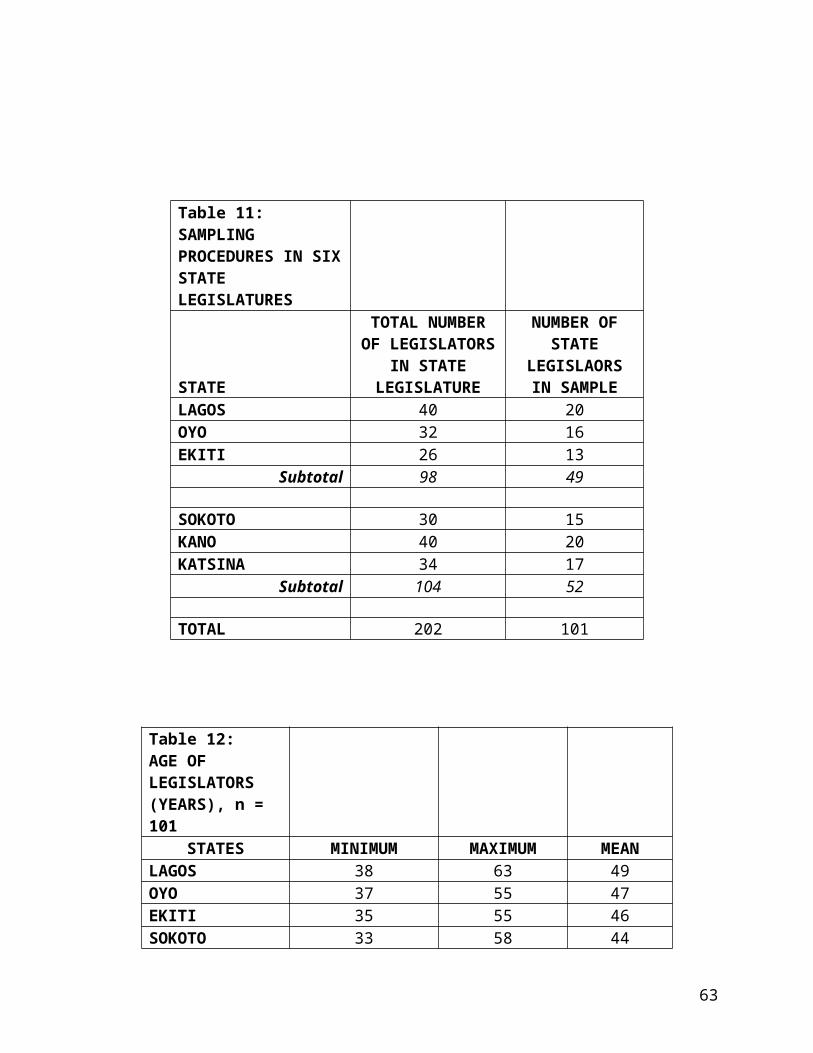
Correlation = 0.89r2 = 0.79
Figure 17: If Legislator Ignores Constituents He/She Should Lose Seat vs. Average State Tax Generation
0 10 20 30 40 50 60 700
0.1
0.2
0.3
0.4
0.5
0.6
0.7
0.8
0.9
1
EKITI
LAGOS
OYO
KANO
KATSINA
SOKOTO
TAXES AS A % OF STATE INCOME (2009)
OPP
OSE
PA
RT
Y T
O S
UPP
OR
T
CO
NST
ITU
EN
TS
(AV
ER
AG
E)
63

Correlation = 0.80r2 = 0.64
Figure 18: If Legislator Ignores Constituents He/She Should Lose Seat vs. 2009 State Tax Generation
0 10 20 30 40 50 600
0.1
0.2
0.3
0.4
0.5
0.6
0.7
0.8
0.9
1
EKITI
LAGOS
OYO
KANO
KATSINA
SOKOTO
TAXES AS A % OF STATE INCOME (AVERAGE, 1999 - 2009)
LO
SE S
EA
T IF
IGN
OR
ES
CO
NST
ITU
EN
TS
(AV
ER
AG
E)
64

Correlation = 0.86r2 = 0.74
0 10 20 30 40 50 60 700
0.1
0.2
0.3
0.4
0.5
0.6
0.7
0.8
0.9
1
EKITI
LAGOS
OYOKANO
KATSINA
SOKOTO
TAXES AS A % OF STATE INCOME (2009)
LO
SE S
EA
T IF
IGN
OR
ES
CO
NST
ITU
EN
TS
(AV
ER
AG
E)
65

References
Aberbach, J., J. Chesney, and B. Rockman. 1975. “Exploring Elite Political Attitudes: Some Methodological Lessons,” Political Methodology, 2: 1 – 27.
Acemoglu, D. and J. Robinson. 2005. Economic Origins of Dictatorship and Democracy. New York: Cambridge University Press.
Aldrich, J. 1995. Why Parties? The Origin and Transformation of Political Parties in America. Chicago: University of Chicago Press.
Barkan, J. 2009. “African Legislatures and the ‘Third Wave’ of Democratization.” In J. Barkan (ed.) Legislative Power in Emerging African Democracies, Boulder: Lynne Rienner.
Bates, R., and D. Lien. 1985. "A Note on Taxation, Development, and rRpresentative Government," Politics and Society, 14 (1): 53-270.
Beblawi, H. 1987. The Rentier State in the Arab World. H. Beblawi and G. Luciani (eds). NewYork: Croom Helm.
Berger, D. 2009. “Taxes, Institutions and Local Governance: Evidence from a Natural Experiment in Colonial Nigeria,” Department of Political Science: New York University.
Bratton, M. 2009. “Citizen Perceptions of Local Government Responsiveness in Sub-SaharanAfrica,” Paper Prepared under World Bank Contract No. 715131.
Brautigam, D.A. O. Fjeldstad, and M. Moore. Taxation and State-Building in DevelopingCountries: New York: Cambridge University Press.
Central Bank of Nigeria. 2000, 2005, 2007. Annual Report and Statement of Accounts (2000,2005, 2007). Lagos and Abuja.
Dunning, T. 2008. Crude Democracy: Natural Resource Wealth and Political Regimes.Cambridge: Cambridge University Press.
Fajingbesi, A., A. Odusola, and E. Uga. 2004. “Revenue Mobilization at the State and LocalGovernment Levels.” in Fiscal Federalism and Democratic Governance in Nigeria, I. Taiwo and A. Fajingbesi (eds). Ibadan: National Centre for Economic Management and Administration.
Federal Inland Revenue Service (FIRS). 2006 - 2009. Quarterly Performance of Revenue Collection. Abuja: Federal Government Press.
Federal Republic of Nigeria. 1999. Constitution of the Federal Republic of Nigeria 1999. Lagos: Federal Government Press.
Fjeldstad, O. 2001. “Taxation, Coercion and Donors: Local Government Tax Enforcement inTanzania,” Journal of Modern African Studies, 39 (2): 289 – 306.
Fjeldstad, O. and J. Semboja. 2001. “Why People Pay Taxes: The Case of the Development Levyin Tanzania,” World Development 29 (12): 2059 – 2074.
Gibson, C.C., and B.D. Hoffman. 2006. "Fiscal Governance and Public Services: Evidence fromTanzania and Zambia," under review, Journal of Politics and Society.
Guyer, J.I. 1991. "Representation without Taxation: An Essay on Democracy in Rural Nigeria,1952-1990," In African Studies Center: Working Papers. Boston: Boston University.
Huber, J.D. and G. Bingham Powell, Jr. 1994. “Congruence between Citizens and Policymakersin Two Visions of Liberal Democracy,” World Politics 46: 291 – 326.
Ikein, A. and C. Briggs-Anigboh. 1998. Oil and Fiscal Federalism in Nigeria: The Political Economy of Resource Allocation in a Developing Country, Aldershot: Ashgate Publishing Company.
Jones – Luong, P. and E. Weinthal. 2006. "Rethinking the Resource Curse: Ownership Structure,
66

Institutional Capacity, and Domestic Constraint," Annual Review of Political Science9:241-63.
Karl, T.L. 1997. The Paradox of Plenty: Oil Booms and Petro-States. Los Angeles: University ofCalifornia Press.
Lam, R. and L. Wantchekon. 1999. "Dictatorships as a Political Dutch Disease," Department ofPolitical Science: Yale University.
Levi, M. 1988. Of Rule and Revenue. Berkley: University of California Press. Lewis, P. 1996. “From Prebendalism to Predation: The Political Ecoonomy of Decline in
Nigeria,” The Journal of Modern African Studies 34 (1): 79 – 103. McGuirk, E. 2012. “The Illusory Leader: Natural Resources, Taxation and Accountability.”
Public Choice, forthcoming.North, D.C. and B.R. Weingast. 1989. "Constitutions and Commitment: The Evolution of
Institutions Governing Public Choice in Seventeenth-Century England," The Journal ofEconomic History XLIX (4):803-32.
Olaniyi, O. 2001. "The Oil Sector and Growth of Non-Oil Sectors in Nigeria." Journal ofEconomics and Allied Fields, 1 (2): 1 - 11.
Okoko, A.B., and N.J. Nna. 1997. "Federalism and Resource Allocation: The NigerianExperience," Nigerian Journal of Oil and Politics, 1 (1): 16 - 36.
Orewa, G. 1979. Taxation in Western and Mid-Western Nigeria. Ibadan: Nigeria Institute ofSocial and Economic Research.
Pitkin, H. 1967. The Concept of Representation. Berkley: University of California Press. Powell, G. Bingham, Jr. 2004. “The Chain of Responsiveness,” Journal of Democracy 15 (4):
91–105.Powell, G. Bingham, Jr. 2004. “Political Representation in Comparative Politics,” Annual
Review of Political Science 7: 273 – 296.Ross, M.L. 2001. "Does Oil Hinder Democracy?" World Politics 53:325-61.———. 2004. "Does Taxation lead to Representation?" British Journal of Political
Science 34: 229-49. Suberu, R. 2003. “The Politics of Fiscal Federalism in Nigeria.” in Nigeria After
Military Rule: Federalism, Resource Allocation, and Ethnic Politics, W. Reno (ed) Evanston: Program of African Studies, Northwestern University.
Therkildsen, O. 2001. “Understanding Taxation in Poor African Countries: A Critical Review ofSelected Perspectives,” Forum for Development Studies (number 1).
Tilly, C. 1985. "War Making and State Making as Organized Crime." in Bringing the State Back In, P. Evans, D. Rueschemeyer and T. Skocpol (eds). London: Cambridge University
Press. ———. 1990. Coercion, Capital, and European States, AD 990-1992. Cambridge: Blackwell. Timmons, J.F. 2005. "The Fiscal Contract: States, Taxes, and Public Services," World Politics
57: 530 - 67. Wantchekon, L. 2002. "Why do Resource Abundant Countries Have Authoritarian
Governments?" Department of Political Science: Yale University.———. 2003. “Clientelism and Voting Behavior: Evidence from a Field Experiment in
Benin,” World Politics, 55: 399-422. Welden, S.M. 2001. Independent Sources of State Revenue in Developing Countries: The Impact
on Democracy, Development, and Human Rights, Department of Sociology: University of California, Irvine.
67

68