· Web viewBuilding geodatabase 3. Data integration. Ferenc Végső. Building geodatabase 3.:...
29
Building geodatabase 3. Data integration Ferenc Végső Created by XMLmind XSL-FO Converter.
Transcript of · Web viewBuilding geodatabase 3. Data integration. Ferenc Végső. Building geodatabase 3.:...

Building geodatabase 3.Data integration
Ferenc Végső
Created by XMLmind XSL-FO Converter.

Building geodatabase 3.: Data integrationFerenc VégsőLector: Szabolcs Mihály
This module was created within TÁMOP - 4.1.2-08/1/A-2009-0027 "Tananyagfejlesztéssel a GEO-ért" ("Educational material development for GEO") project. The project was funded by the European Union and the Hungarian Government to the amount of HUF 44,706,488.
v 1.0
Publication date 2010Copyright © 2010 University of West Hungary Faculty of Geoinformatics
Abstract
In this module we are looking for data integration questions, such as data sources, data capture methods, vector and raster data, capturing attribute data, data conversion, transformations and so on.
The right to this intellectual property is protected by the 1999/LXXVI copyright law. Any unauthorized use of this material is prohibited. No part of this product may be reproduced or transmitted in any form or by any means, electronic or mechanical, including photocopying, recording, or by any information storage and retrieval system without express written permission from the author/publisher.
Created by XMLmind XSL-FO Converter.

Table of Contents3. Data integration ................................................................................................................................ 1
1. 3.1 Introduction ...................................................................................................................... 12. 3.2 Data capture ...................................................................................................................... 1
2.1. 3.2.1 Data sources ...................................................................................................... 12.2. 3.2.2 Primary data capture ......................................................................................... 2
2.2.1. 3.2.2.1 Vector data capture ............................................................................ 22.2.2. 3.2.2.2 COGO data entry ............................................................................... 42.2.3. 3.2.2.3 Raster data capture ............................................................................ 4
2.3. 3.2.3 Secondary geographic data capture .................................................................. 62.3.1. 3.2.3.1 Raster data capture using scanners .................................................... 6
2.4. 3.2.4 Vector data capture ............................................................................................ 72.4.1. 3.2.4.1 Manual digitizing .............................................................................. 72.4.2. 3.2.4.2 Heads-up digitizing and vectorization ............................................... 72.4.3. 3.2.4.3 Automated methods ........................................................................... 8
2.5. 3.2.5 Capturing attribute data .................................................................................. 122.6. 3.2.6 Data conversion .............................................................................................. 132.7. 3.2.7 Transformations .............................................................................................. 17
2.7.1. 3.2.7.1 Map projections ............................................................................... 172.8. 3.2.8 Cartesian coordinate transformations ............................................................. 19
2.8.1. 3.2.8.1 Central projection ............................................................................ 202.9. 3.2.9 The quality of transformations ........................................................................ 21
Created by XMLmind XSL-FO Converter.

Chapter 3. Data integration1. 3.1 IntroductionIn this section we examine, how can we get the positioning and descriptive data for the geodatabase, what actions they should be implemented to create a common reference system and incorporating into the GIS database? It should be stressed out the importance of a common reference system. GIS can not make a valid analysis without a common reference system.
2. 3.2 Data captureOnce GIS users defined the specifics, they collect the data from multiple sources, such as already published maps and tabulations, current field observations, surveys, and aerial/satellite imagery. In the next step they convert the varied data into computer-compatible formats.
Figure 1. Data sources of GIS1
Before the collection of data must be examined the data sources. The flow chart below shows the possibilities:
2.1. 3.2.1 Data sourcesData collection workflow
• Planning includes establishing user requirements, gathering resources, and developing a project plan.
• Preparation involves obtaining data, redrafting poor-quality map sources, editing
scanned map images, removing noise, and setting up appropriate GIS hardware and
software systems to accept data.
• Digitizing and transfer are the stages where the majority of the effort will be expended.
• Editing and improvement covers many techniques designed to validate data, as well as correct errors and improve quality.
• Evaluation is the process of identifying project successes and failures.
There are two main sources of GIS data:
• Primary Data Capture
11 http://rst.gsfc.nasa.gov/Sect15/Sect15_4.html
Created by XMLmind XSL-FO Converter.

Data integration
• Digitizing
• Tablet digitizing
• Heads up digitizing
• Automatic digitizing
• Scanning
• Other point measurements (in text files)
Figure 3. Mapping by coordinate list
• GPS collections
• Aerial photographs
• Remote sensing data
• Secondary Data Capture
• Published or released data (originally primary data)
• All primary data from others are secondary data for you
2.2. 3.2.2 Primary data capture2.2.1. 3.2.2.1 Vector data capture
• Two main branches are ground surveying and GPS.
Created by XMLmind XSL-FO Converter.

Data integration
Figure 4. GPS station
Figure 5. GPS rover instrument
• Ground surveying is based on the principle that the 3-D location of any point can be
determined by measuring angles and distances from other known points.
• Traditional equipment like theodolites has been replaced by total stations that can measure both angles and distances to an accuracy of 1 mm.
• Ground survey is a very time-consuming and expensive activity, but it is still the best way to obtain highly
Created by XMLmind XSL-FO Converter.

Data integration
accurate point locations.
• Typically used for capturing buildings, land and property boundaries, and
other objects that need to be located accurately.
• Also employed to obtain reference marks for use in other data capture projects.
2.2.2. 3.2.2.2 COGO data entry
COGO is a suite of programs used in civil engineering for solving coordinate geometry problems.
Some remarks:
• COGO is a contraction of the term coordinate geometry, a methodology for capturing and representing geographic data.
• COGO uses survey-style bearings and distances to define each part of an object.
• COGO data are very precise measurements and are often regarded as the only legally acceptable definition of land parcels.
2.2.3. 3.2.2.3 Raster data capture
• Remote sensing is a technique used to derive information about the physical, chemical, and biological properties of objects without direct physical contact.
• Information is derived from measurements of the amount of electromagnetic radiation reflected, emitted, or scattered from objects.
• Resolution is a key physical characteristic of remote sensing systems.
• Spatial resolution refers to the size of object that can be resolved and the most usual measure is the pixel size.
• Spectral resolution refers to the parts of the electromagnetic spectrum that are
measured.
• Temporal resolution, or repeat cycle, describes the frequency with which images are collected for the same area.
Figure 6. The principle of remote sensing2
22crisp.nus.edu.sg
Created by XMLmind XSL-FO Converter.

Data integration
Figure 7. Satellite picture3
• Aerial photography is equally important in medium- to large-scale projects.
• Aerial photographs are collected using airplanes, helicopters, robot airplanes, balloons etc.
• Photographs are normally collected by analog optical cameras and later scanned.
• Can provide stereo imagery for the extraction of digital elevation models.
Figure 8. Principle of aerial photography4
Figure 9. Functional schema of processing photographs5
Advantages are:
33portal.unesco.org
44fao.org
55http://www.sisgraph.com.br/Backup%2018.06.2010/istationsw/default.asp
Created by XMLmind XSL-FO Converter.

Data integration
• consistency of the data;
• availability of systematic global coverage;
• regular repeat cycles.
Disadvantages are:
• resolution is often too coarse;
• many sensors are restricted by cloud cover.
2.3. 3.2.3 Secondary geographic data capture2.3.1. 3.2.3.1 Raster data capture using scanners
Three main reasons to scan hardcopy media are:
• Documents are scanned to reduce wear and tear, improve access, provide integrated database storage, and to index them geographically.
• Film and paper maps, aerial photographs, and images are scanned and georeferenced so that they provide geographic context for other data.
• Maps, aerial photographs, and images are scanned prior to vectorization.
Figure 10. Map scanner6
Figure 11. Large format scanner7
66blogs.lib.berkeley.edu
77procaptura.com
Created by XMLmind XSL-FO Converter.

Data integration
2.4. 3.2.4 Vector data capture2.4.1. 3.2.4.1 Manual digitizing
• Digitizing is the process where features on a map or image are converted into digital format for use by a GIS.
• Digitizing converts the features on the map into three basic data types:
• Points – zero dimensional objects
• Lines – one dimensional objects
• Polygons – two dimensional objects
• Digitizers operate on the principle that it is possible to detect the location of a cursor or puck passed over a table inlaid with a fine mesh of wires.
2.4.2. 3.2.4.2 Heads-up digitizing and vectorization
• Vectorization is the process of converting raster data into vector data.
Figure 12. Converting raster data into vector data
• The simplest way to create vectors from raster layers is to digitize vector objects manually straight off a computer screen using a mouse or digitizing cursor.
In this case a specialized person digitizes the image by hand (using a mouse or digitizer) creating the necessary nodes and shapes to produce the supplied image. The resulting vector drawing is the best possible with the fewest nodes and depends very little on how good the original image is. This method also guarantees that all stems will be uniform and the thickness will be the same in all letters etc.
Tablet digitizing requires a person to enter coordinate information through the use of a digitizing tablet and digitizing puck
• A digitizing tablet is a hardened surface with a fine electrical wire grid under the surface.
Figure 13. Large format backlit digitizing table
• Digitizing tablets are either hardened, more stationary tables or rollup boards designed for portability
• A digitizing puck is an electrical device with cross hairs and multiple buttons to perform data entry operations
Created by XMLmind XSL-FO Converter.

Data integration
Figure 14. Digitizing puck8
• An operator then enters the information using the puck.
9Figure 16. Tablet digitizing
Tablet digitizing is not without its problems:
• Tablet digitizing is tedious, and “operator fatigue” is very common. When digitizing for 8 hours a day, one should take plenty of breaks! As an operator gets tired, he may also tend to get careless.
• Due to environmental conditions (such as humidity), the source materials may actually change (due to shrinking and expansion). This may not seem like a big deal, but consider that on a 1:100,000 scale map, a slight shift in the map on the tablet (if you accidentally bump or move the map), or a slight shrinking of the map of only 0.1 mm-s would equal an 10 meters shift in the real world. The high accuracy is only achieved with more expensive digitizing tablets. 1010
2.4.3. 3.2.4.3 Automated methods
Scanning and vectorization
Vectorization is the process of converting raster data into vector data.
Possible cases raster to vector conversions are in the following table:
Where →
From ↓
Vector Raster
88http://www.geodecisions.com/history.htm
99 http://rst.gsfc.nasa.gov/Sect15/Sect15_7.html
1010Arthur J. Lembo Cornell University
Created by XMLmind XSL-FO Converter.

Data integration
Vector data transfer display
Raster vectorizing image processing
Bitmap image files (also called raster images) are usually taken from imaging devices such as scanners or digital cameras. Usually they’re of poor quality and resolution. When larger sizes are required these files display jagged or blurred edges.
Using professional vectorizing methods the image becomes an excellent vector file that can be enlarged to any size. It prints perfect at any resolution and can also be plotted on a plotter or cutter. It also occupies less storage (memory) and can be manipulated easier and faster.
There are essentially three approaches of rasterization:
• Automatic Conversion Software - traces the dots in the raster image and automatically replaces the dots with CAD vector lines.
• Manual Underlay Conversion - insert the raster image in a CAD application and draw vectors over it in CAD.
• Manual Digitizing - use the mouse or a digitizing tablet to manually trace over each original line.
Interactive vectorizing
Along with automatic vectorization, you can also generate features manually. This process is known as interactive vectorization and is similar to the existing techniques used to create features with the editor. Interactive vectorization consists of several components: raster snapping, raster tracing and shape recognition.
Raster snapping can help ensure that you create features accurately. You can snap to raster centerlines, intersections, corners, ends, and solids.
Snapping to centerlines, to corner, to ends and to solid
1111
Raster tracing
With the trace tool, you simply point the cursor in the direction you wish to vectorize and click. With each click, features will be generated at the centerline of the raster cells. The current vectorization settings will influence the output vector geometry. You have the option to generate line or polygon features. The image below shows raster tracing and snapping used to create polygon features.
Shape recognition
You can also capture vector features of a certain shape, such as a building or storage tank via the shape
1111http://webhelp.esri.com/arcgisdesktop/9.3/index.cfm?TopicName=What_can_you_do_with_ArcScan?
Created by XMLmind XSL-FO Converter.

Data integration
recognition tool. This allows you to generate features simply by clicking once on the raster feature you wish to capture.
Figure 17. Result of shape recognition
Automatic image tracing
Most graphic design programs today offer automatic image tracing functionality. The user specifies the image and tracing parameters and the program converts the image within a few seconds to vector format. The resulting drawing’s quality depends on the quality of the original image. It usually needs a lot of editing (and time) to remove nodes and adjust curves for smoothness and accuracy. Hand vectorized artwork is by far more superior in quality than any automatically generated one.
Figure 18. Original (scanned) image
Figure 19. Manual vectorizing
Created by XMLmind XSL-FO Converter.

Data integration
Figure 20. Automatic vectorizing
Styles of vectorizing
Figure 21. Original image
Centerline Vectorizing
This type produces a vector drawing with contour lines through the center of each image area. Usually a single line is produced for each image area. Basically used for map vectorizing.
Figure 22. Centerline vectorizing
Outline Vectorizing
This type produces a vector drawing with contour lines around the image areas. Usually two lines are produced for each image area. Basically used by sign makers and graphic artists.
Figure 23. Outline vectorizing
Manual versus automatic vectorization (considerations)
Why would one even consider a manual approach when an automatic option is available? Well, even though the initial vectorization is automatic, there is almost invariably some manual reworking required to clean up the vectors created by automatic vectorization software.
And, as a rule of thumb, the worse the quality of the original raster image (degradation by fading, coffee stains, etc.) and the greater the clutter and overprinting in the drawing, the more manual work will be required. We've tried to illustrate this in the next diagram.
So why use automatic software if some of the work will have to be done manually?
Created by XMLmind XSL-FO Converter.

Data integration
Say you have a drawing which would take 10 hours to redraw using a completely manual approach and an automatic vectorization software that converts the same image (in a matter of seconds) but then requires 5 hours of manual clean-up. Which would you choose?
Why can't automatic conversion software do a perfect job?
All the computing power of the modern personal computer can't come near the human vision. So it's easy for you to look at a detail on an image and know that it's a 'joist hanger detail' or 'tapered sleeve' or whatever. You can do this because your brain interprets what it sees in the context of the overall drawing.
However the limited power of the computer just sees 'a lot of lines coming together'. It probably won't draw the junctions anything like as pristinely as you would draft them in CAD. And it will usually be very literal - if a line is in the scan the vectorizing software will replicate it, whether it should be there or not.
When will automatic vectorizing software do a perfect job? And when should it be avoided altogether?
Logos and artwork scanned for NC cutting can often be converted and used with either no or only minimal manual clean-up. Clean maps, architectural or mechanical sheet drawings work well.
At the other extreme, the coffee-stained sheet recovered from the shop floor, barely held together with tape, will not scan well. Expect this to be a hard scan for a human to interpret, let alone automatic conversion software. Ancient vellums and faded blues will create similar problems.
So should I buy software or have someone do conversions for me?
Reasons for outsourcing service Reasons for buying software
One-off or occasional need. No spare hours to do it in-house. Poor quality originals.
Repeating requirement. Modifying only details of originals.
How is text converted?
If you are converting to vectors for CAD use text should be converted to real characters. This means an 'A' is stored as the character 'A'. However if you are converting to vectors for use in cutting software you'll want an 'A' to be converted to vector lines - two sides and a horizontal.
Automatic conversion software is usually equipped with an OCR function to convert raster text to characters. If this is not used the text is converted to vector lines suitable for use in cutting applications. If you outsource the conversion be sure to tell the converter whether you need character or vector line text. If you specify vector line text you should also specify if you want center-line or outline vectors. 1212
2.5. 3.2.5 Capturing attribute dataAttribute (tabular) data is the descriptive data that GIS links to map features. Attribute data is collected and compiled for specific areas like states, census tracts, cities, and so on and often comes packaged with map data. When implementing a GIS, the most common sources of attribute data are your own organization's databases combined with data sets you buy or acquire from other sources to fill in gaps.
Sources of tabular information
There are lots of sources of tabular data. Tabular information could be stored as tables in folders or databases, text files, queries on databases, and so on.
In addition, if you have spatial data, you probably already have tabular attributes that describe those geographic features. File-based tables are stored in folders on disk. Some examples of file-based sources of tabular information include
1212http://www.trixsystems.com/raster-to-vector-how-to.html
Created by XMLmind XSL-FO Converter.

Data integration
• dBase, the format used with shape files
• Text files such as those created in a text editor and delimited by commas or tabs
• Many other sorts of tables, including those generated in other programs, such as Microsoft Excel, Oracle, Ingres etc. either accessed directly or through the OLE DB functionality
• Geodatabase attribute table. Own format of GIS software, native using
Entering attributes
Attributes can be entered by direct data loggers, manual keyboard entry, file conversion, optical character recognition (OCR) or, increasingly, voice recognition.
Optical character recognition, usually abbreviated to OCR, is the mechanical or electronic translation of scanned images of handwritten, typewritten or printed text into machine-encoded text. 1313 It is widely used to convert books and documents into electronic files, to computerize a record-keeping system in an office, or to publish the text on a website. OCR makes it possible to edit the text, search for a word or phrase, store it more compactly, display or print a copy free of scanning artifacts, and apply techniques such as machine translation, text-to-speech and text mining to it. OCR is a field of research in pattern recognition, artificial intelligence and computer vision.
Figure 24. Workflow of OCR
OCR systems require calibration to read a specific font; early versions needed to be programmed with images of each character, and worked on one font at a time. "Intelligent" systems with a high degree of recognition accuracy for most fonts are now common. Some systems are capable of reproducing formatted output that closely approximates the original scanned page including images, columns and other non-textual components.
The accurate recognition of Latin, typewritten text is now considered largely a solved problem on applications where clear imaging is available such as scanning of printed documents. Typical accuracy rates on these exceed 99% total accuracy can only be achieved by human review. Other areas—including recognition of hand printing, cursive handwriting, and printed text in other scripts (especially those East Asian language characters which have many strokes for a single character)—are still the subject of active research.
An essential requirement for separate data entry is common identifiers (also called a key) that can be used to relate object geometry and attributes together following data capture.
2.6. 3.2.6 Data conversionOne of the biggest problems with data obtained from external sources is that they can be encoded in many different formats. Many tools have been developed to move data between systems and to reuse data through open application programming interfaces (APIs).
Data conversion is the conversion of computer data from one format to another. Throughout a computer environment, data is encoded in a variety of ways. Furthermore, each computer program handles data in a different manner. Whenever any one of these variable is changed, data must be converted in some way before it can be used by a different computer, operating system or program. Even different versions of these elements usually involve different data structures. Data conversions may as simple as the conversion of a text file from
1313http://en.wikipedia.org/wiki/Optical_character_recognition
Created by XMLmind XSL-FO Converter.

Data integration
one character encoding system to another; or more complex, such as the conversion of office file formats, or the conversion of image and audio file formats or CAD, GIS formats
There are many ways in which data is converted within the computer environment. The conversion may require processing by the use of a special conversion program, or it may involve a complex process of going through intermediary stages, or involving complex "exporting" and "importing" procedures, which may converting to and from a tab-delimited or comma-separated text file. In some cases, a program may recognize several data file formats at the data input stage and then is also capable of storing the output data in a number of different formats. Such a program may be used to convert a file format (for example ITR – DAT in Hungary). If the source format or target format is not recognized, then at times third program may be available which permits the conversion to an intermediate format, which can then be reformatted using the first program. There are many possible scenarios.
Before any data conversion is carried out, the user or application programmer should keep a few basics of computing and information theory in mind.
These include:
• Information can easily be discarded by the computer, but adding information takes effort
• The computer can add information only in a rule-based fashion
• Upsampling the data or converting to a more feature-rich format (for example converting grayscale image to color – it is possible, but has no meaning) does not add information; it merely makes room for that addition, which usually a human must do.
About semantic translation
Semantic translation is a term coined by the Open Geospatial Consortium, Inc. (OGC), and refers to the restructuring of data during the translation process. This term is used to describe a many-to-one translation method rather than a one-to-one translation. It's the concept of taking information from one data model and moving it to a different data model. 1414
GIS software gives you the entire supported formats list. The following table shows the ESRI ArcGIS software-supported formats are listed as an example.
ArcGIS (ArcView, ArcEditor, and ArcInfo) supported formats
Vector formats
ArcGIS Server geocode services
ArcGIS Server globe services
ArcGIS Server image services ArcGIS Server map services
ArcInfo coverages
ArcIMS feature services
ArcIMS map services
DGN (5.x to 8)
DWG (Release 12 to AutoCAD 2006)
1414http://webhelp.esri.com/arcgisdesktop/9.3/index.cfm?TopicName=Semantic_translation
Created by XMLmind XSL-FO Converter.

Data integration
DXF (Release 12 to AutoCAD 2006)
Geodatabases (personal geodatabase, file geodatabase, and ArcSDE geodatabase)
OLE DB tables
OGC WCS services (OGC = Open Geospatial Consortium)
OGC WMS services
PC ARC/INFO coverages
Raster formats
• ADRG Image (.IMG)
• ADRG Overview (.OVR)
• ADRG Legend (.LGG)
• ArcSDE raster
• BSB charts
• Compressed ARC Digitized Raster Graphics (CADRG)
• Controlled Image Base (CIB)
• Digital Geographic Information Exchange Standard (DIGEST)
• DTED Level 0, 1, and 2 (.DT*)
• ER Mapper (.ERS)
• ER Mapper Enhanced Compressed Wavelet (.ECW)
• ERDAS 7.5 GIS (.GIS)
• ERDAS 7.5 Lan (.LAN)
• ERDAS IMAGINE (.IMG)
• ERDAS Raw (.RAW)
• ESRI Band Interleaved by Line (.BIL)
• ESRI Band Interleaved by Pixel (.BIP)
• ESRI Band Sequential (.BSQ)
• ESRI Grid
• ESRI Grid Stack (<directory>)
• ESRI Grid Stack file (.STK)
• ESRI Raster Catalogs (Image Catalogs)
• Graphic Interchange Format (.GIF)
Created by XMLmind XSL-FO Converter.

Data integration
• Hierarchical Data Format (HDF) 4
• Idrisi Raster Format (RST)
• Intergraph raster file (.CIT or .COT)
• JPEG File Interchange Format, JIFF (.JPG) and JPEG 2000 (.JP2)
• LizardTech MrSID and MrSID Gen 3 (.SID)
• National Image Transfer Format, NITF 2.0 and 2.1 (.NTF)
• PC Raster (.MAP)
• PCI Geomatica (.PIX)
• Portable Network Graphics (.PNG)
• Raster Product Format (RPF)
• Tagged Image File Format, TIFF (.TIF)
• USGS DEM (.DEM)
• Windows bitmap (.BMP)
• XPixMap (.XPM)
Other formats
Shape files (.SHP)
Text files (.TXT)
TIN
VPF (Vector Product Format)
GIS data standards
More than 25 organizations are involved in the standardization of various aspects of geographic data and geoprocessing. ISO (International Standards Organization) is responsible for coordinating efforts through the work of technical committees TC 211 and 287. In Europe, CEN (Comité Européen de Normalisation) is engaged in geographic standardization. OGC (Open Geospatial Consortium) is a group of vendors, academics, and users interested in the interoperability of geographic systems.
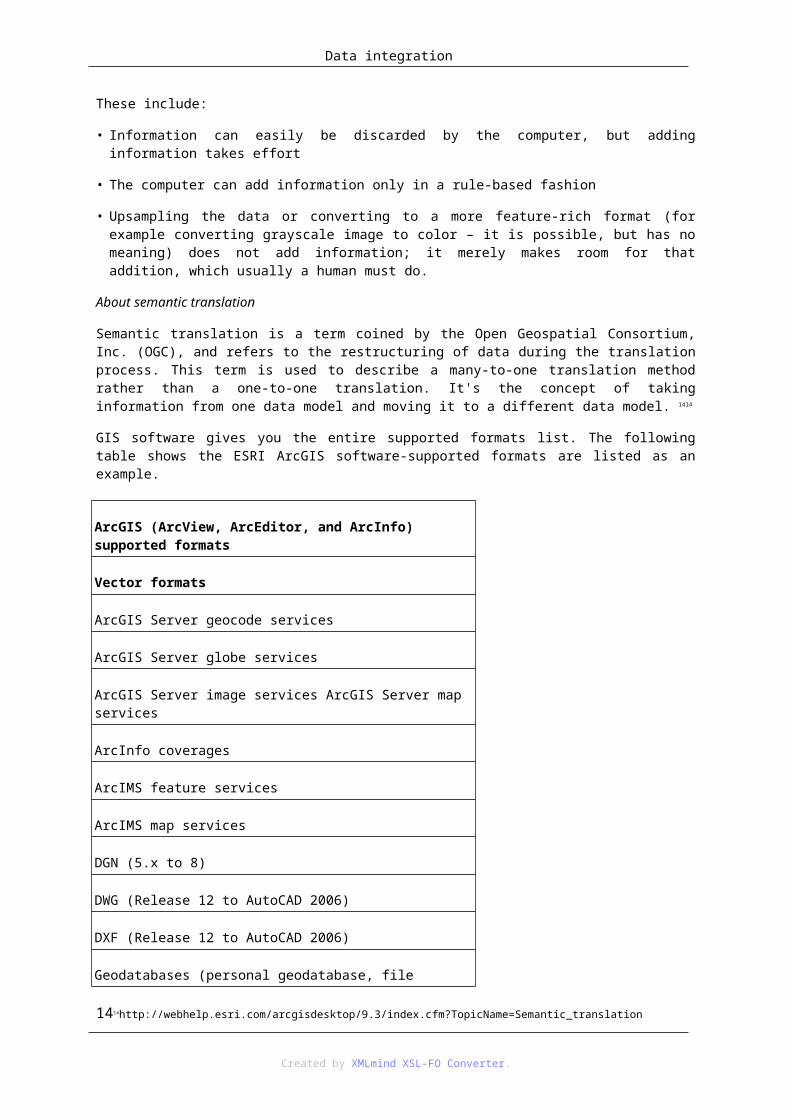
Obtaining data from external sources (data transfer)
The best way to find geographic data is to search the Internet. Here you will find the basic data and corporate data. The good examples: USGS in the USA, Ordnance Survey in UK, FÖMI (Institute of Geodesy, Cartography and Remote Sensing) in Hungary (fomi.hu)
Created by XMLmind XSL-FO Converter.
Data integration
Figure 25. Available data and services at FÖMI1515
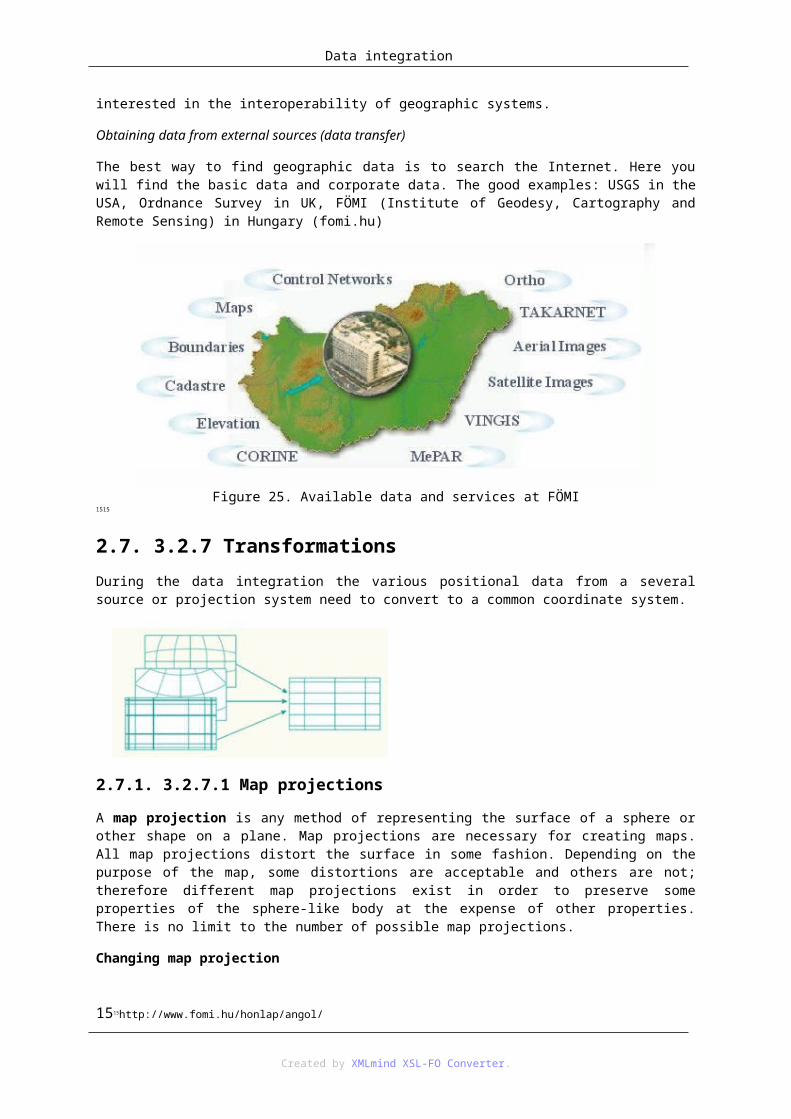
2.7. 3.2.7 TransformationsDuring the data integration the various positional data from a several source or projection system need to convert to a common coordinate system.
2.7.1. 3.2.7.1 Map projections
A map projection is any method of representing the surface of a sphere or other shape on a plane. Map projections are necessary for creating maps. All map projections distort the surface in some fashion. Depending on the purpose of the map, some distortions are acceptable and others are not; therefore different map projections exist in order to preserve some properties of the sphere-like body at the expense of other properties. There is no limit to the number of possible map projections.
Changing map projection
Forward and inverse mapping equations are generally used to transform data from one map projection to another. The inverse equation of the source projection is used first to transform source projection coordinates (x,y) to geographic coordinates (f,l). Next, the forward equation of the target projection is used to transform the geographic coordinates (f,l) to target projection coordinates (x’,y’). The first equation takes us from a projection A into geographic coordinates. The second takes us from geographic coordinates (f,l) to another map projection B. 1616
This is illustrated in the figure below.
1515http://www.fomi.hu/honlap/angol/
1616http://www.kartografie.nl/geometrics/Coordinate%20transformations/coordtrans.html
Created by XMLmind XSL-FO Converter.

Data integration
Figure 26. Changing map projection by projection equations
If the geoid is different between two projections, you cannot use projection equations. In this case (for example between Stereographic or Cylindrical projection and EOV projection in Hungary) may be possible to use a 2D Cartesian transformation. 2D ground control points or common points are then required to determine the relationship between the projections. The transformation may be conformal, affine, polynomial, or of another type, depending on the geometric differences between the two map projections. This is illustrated in the figure below.
Sometimes, your data is given geocentric coordinate system (WGS). These include the GPS coordinates. This must be converted to some kind of projection system.
Created by XMLmind XSL-FO Converter.

Data integration
Figure 27. Conversion from geocentric coordinate system to geographic coordinate system
2.8. 3.2.8 Cartesian coordinate transformations2D Cartesian coordinate transformations can be used to transform 2D Cartesian coordinates (x,y) from one 2D Cartesian coordinate system to another 2D Cartesian coordinate system. The three primary transformation methods are:
• the conformal transformation,
• the affine transformation, and
• the polynomial transformation.
The conformal transformation
A special case is the two-dimensional Helmert transformation. Here, only four parameters are needed (two translations, one scaling, and one rotation). These can be determined from two known points; if more points are available then checks can be made.
Figure 28. Transformation between local coordinates and absolute coordinates1717
Affine transformation
An affine transformation is a linear (or first-order) transformation and relates two 2D Cartesian coordinate systems through a rotation, a scale change in x- and y-direction, followed by a translation. The transformation function is expressed with 6 parameters: one rotation angle, two scale factors, a scale factor in the x-direction and a scale factor in the y-direction, and two origins.
1717 http://eki.sze.hu/ejegyzet/ejegyzet/ottofi/8fejezet.htm
Created by XMLmind XSL-FO Converter.
Data integration
1818
Affine transformation is often used to rectify distortion of paper maps.
Polynomial transformation
A polynomial transformation is a non-linear transformation and relates two 2D Cartesian coordinate systems through a translation, a rotation and a variable scale change. The transformation function can have an infinite number of terms.
Polynomial transformations are sometimes used to georeference uncorrected satellite imagery or aerial photographs or to match vector data layers that don't fit exactly by stretching or rubber sheeting them over the most accurate data layer.
Figure 29. Example of polynomial transformations1919
2.8.1. 3.2.8.1 Central projection
Central projection is a projection of one plane onto a second plane such that a point on the first plane and its image on the second plane lie on a straight line through a fixed point not on either plane.
1818http://www.jaketa.hu/software/didger/didger_reszl.html
1919http://webhelp.esri.com/arcgiSDEsktop/9.3/index.cfm?TopicName=warp_%28data_management%29
Created by XMLmind XSL-FO Converter.

Data integration
Figure 30. The principle of central projection
The projective transformation used for transformation of aerial photographs in GIS. Four points define a central connection.
Figure 31. Aerial photograph before projection2020
2.9. 3.2.9 The quality of transformationsThe transformation parameters are a best fit between the source and destination control points. If you use the transformation parameters to transform the actual source control points, the transformed output locations won't match the true output control point locations.
Figure 32. The digitized and calculated place
2020http://www.freshbrook.org/pages/aerial_photo
Created by XMLmind XSL-FO Converter.

Data integration
2121
This is called the residual error; it is a measure of the fit between the true locations and the transformed locations of the control points. This error is generated for each displacement link. The RMS error calculated by least squares, so more links should be given than are necessary.
LiteraturesHohl P. (ed) : GIS Data Conversion: Strategies, Techniques and Management. NM: OnWord Press. Santa Fe,
1997
Jones C.: Geographic Information Systems and Computer Cartography. Reading, MA: Addison- Wesley Longman. 1997
Lillesand T.M., Kiefer R.W., Chipman R.W.: Remote Sensing and Image, 2003
Interpretation (5th edn). Hoboken, NJ: Wiley.
Paine D.P., - Kiser J.D. : Aerial Photography and Image Interpretation (2nd edn). Hoboken, NJ: Wiley. 2003
Walford N.: Geographical Data: Characteristics and Sources. Hoboken, NJ: Wiley. 2002
Longley P.A., Goodchild M.F., Maguire D.J., and Rhind D.W. (eds) : Geographical Information Systems: Principles, Techniques, Management and Applications (abridged edition). Hoboken, NJ: Wiley. 2005
Encoding and validating data from maps and images, I. Dowman
Digital remotely-sensed data and their characteristics, M. Barnsley
A. Lange and C. Gilbert: Using GPS for GIS data capture
Maguire D.J., Goodchild M.F., Rhind D.W. (eds) : Geographical Information Systems: Principles and applications. Harlow, UK: Longman, 1991
M.J. Jackson and P.A. Woodsford : GIS data capture hardware and software
S.C. Guptill :
2121http://webhelp.esri.com/arcgisdesktop/9.3/index.cfm?TopicName=Georeferencing_a_raster_dataset
Created by XMLmind XSL-FO Converter.