images.pcmac.orgimages.pcmac.org/.../Math_Packet_Daily_Activities.docx · Web viewA police officer...
58
Georgetown - Coastal Carolina University Mathematics Partnership Workshop This notebook belongs to ______________________________________ 1
Transcript of images.pcmac.orgimages.pcmac.org/.../Math_Packet_Daily_Activities.docx · Web viewA police officer...

Georgetown - Coastal Carolina University Mathematics Partnership Workshop
This notebook belongs to
______________________________________
1

2

What to Expect
Dr. Tara Craig, [email protected]
Week 1
Day 1: Introduction & Equations in Context
Day 2: Equations in Context
Day 3: Graphing as a Tool (Intro)
Day 4: Foundation of Functions
Week 2
Day 5:Foundations of Functions
Day 6: Graphing as a Tool (Extension)
Day 7: Analyzing Functions
Day 8: Analyzing Functions & Closing
3

4
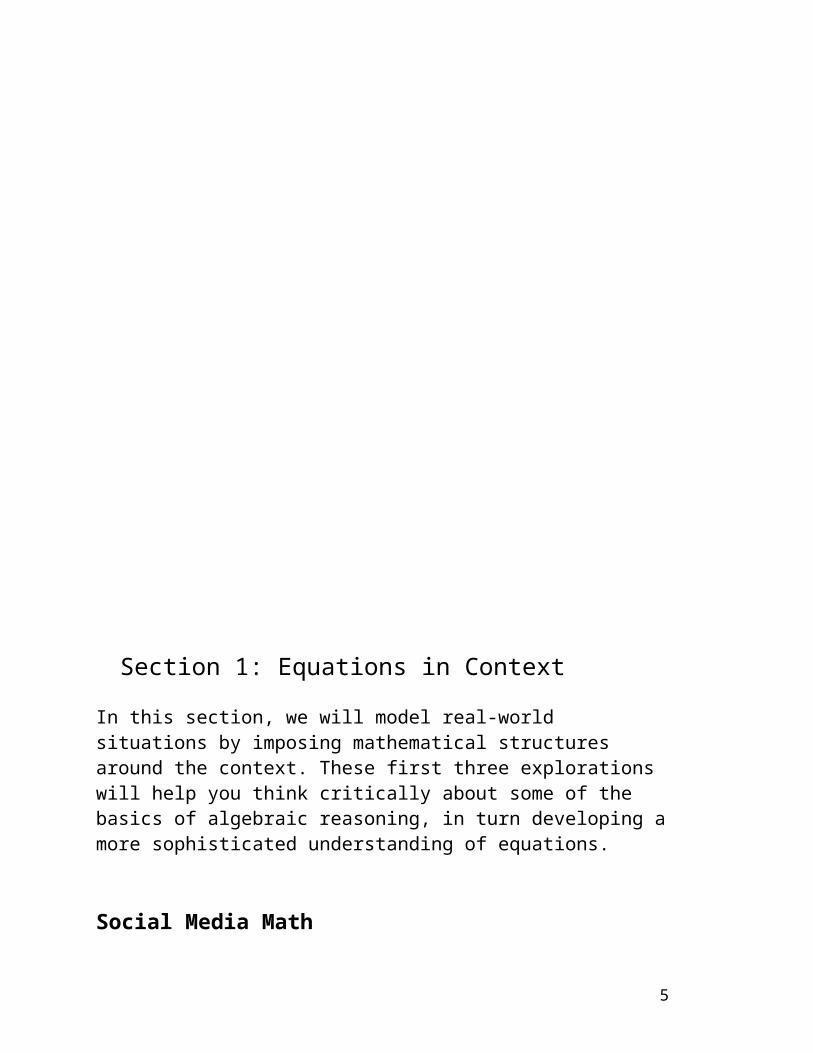
Section 1: Equations in Context
In this section, we will model real-world situations by imposing mathematical structures around the context. These first three explorations will help you think critically about some of the basics of algebraic reasoning, in turn developing a more sophisticated understanding of equations.
Social Media Math
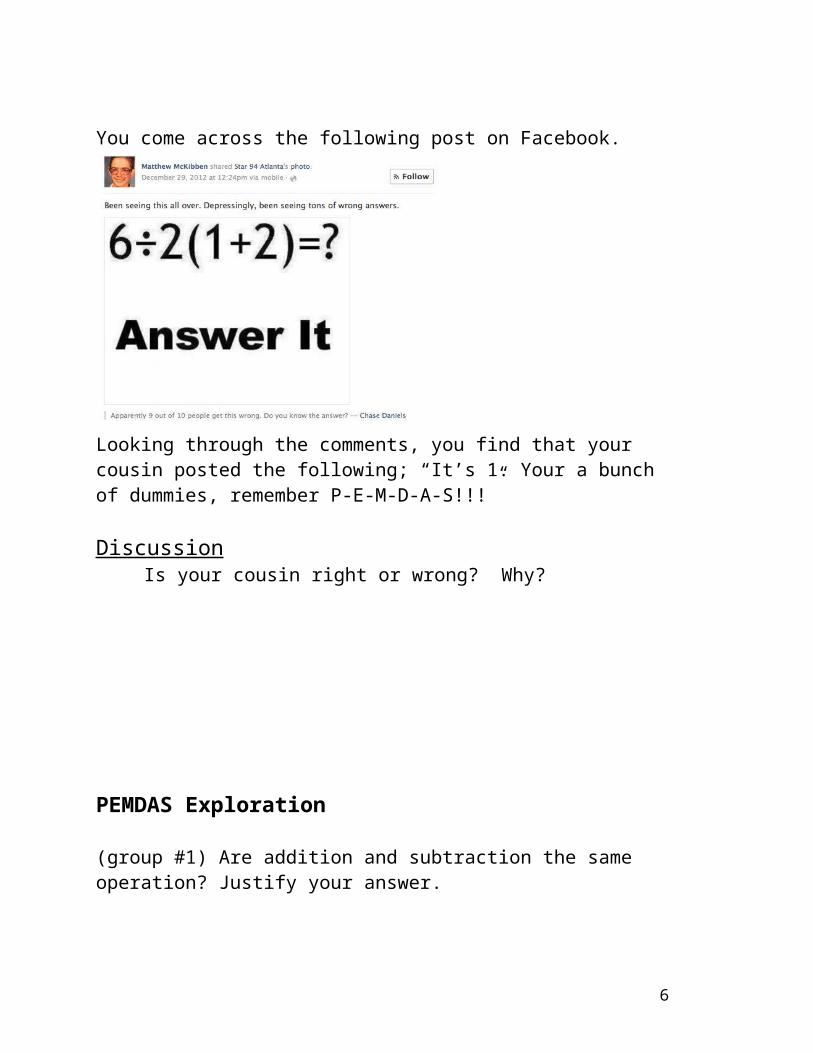
You come across the following post on Facebook.
Looking through the comments, you find that your cousin posted the following; “It’s 1. Your a bunch of dummies, remember P-E-M-D-A-S!!!”
DiscussionIs your cousin right or wrong? Why?
5
PEMDAS Exploration
(group #1) Are addition and subtraction the same operation? Justify your answer.
(group #2) Are multiplication and division the same operation? Justify your answer.
6

Racetrack ExplorationRonnie goes to the racetrack with his buddies on a weekly basis. One week he tripled his money, but then lost $12. He took his money back the next week, doubled it, but then lost $40. The following week he tried again, taking his money back with him. He quadrupled it, and then played well enough to take that much home, a total of $224. How much money did he start with the first week? Justify your solution.
7

Pokemon Go ExplorationElla gave four-fifths of her Pokemons to Cade. Then she gave two-thirds of the remaining Pokemons to Mason. If Ella ended up with ten Pokemons for herself, with how many did she start?
Basketball ExplorationIf a basketball weighs 10.5 ounces plus half its own weight, how much does it weigh?
8

Catwoman ExplorationIf you ask batman’s nemesis, Catwoman, how many cats she has, she answers with a riddle: “Five-Sevenths of my cats plus six.” How many cats does Catwoman have? Justify your response.
Shopping ExplorationAt the mall you obtain a 30% discount, but you must pay 11% tax. Which would you prefer to calculate first? Justify your response.
9

Rectangle ExplorationAdding a 3x1 rectangle to the top of the previous rectangle creates each term in the sequence below.
Make a list of 3-4 questions you could ask your students given this context.
Question: _____________________________________________________________________
10

Side Square ExplorationColoring the outside row of any grid creates a square border; see the 10-side square border below. Without counting one-by-one, explain how can you determine the number of colored squares for the square border of a 1,000,000-side square?
10-Side Square Border
11

Matchstick ExplorationHow many matchsticks are required to make n-squares in a row, with the side of each square being the length of a match, as in the following sequence.
12

Car ExplorationA car leaves Georgetown traveling 42 mph. 20 minutes later a truck leaves Georgetown following the car and traveling 55 mph. How many minutes will it take for the truck to overtake or pass the car? Round to the nearest tenth.
Boat ExplorationTwo boats leave at the same time from a city to go to the same island. The first boat travels at 28 mph. The second boat travels at 42 mph. In how many hours will the two boats be 60 miles apart? Round to the nearest tenth.
13

Train Exploration
Two trains are traveling toward each other on adjacent tracks. The first train is 270 feet long and is moving at 45 miles per hour. The second train is 192 feet long and is moving at 60 miles per hour. How much time elapses from the moment the trains’ first meet until they completely pass each other?
Gasoline ProblemThe gasoline gauge on a van initially read
18 full. When 15 gallons were
added to the tank, the gauge read 34 full. How many more gallons are
needed to fill the tank?
14
Tutoring ProblemRudy and Andrea are starting a business tutoring students in math. They rent an office for $400 per month and charge $40 per hour tutoring session. They made $600 in profit this month. How many tutoring sessions did they hold this month?
15

Section 2: Graphing as a Tool
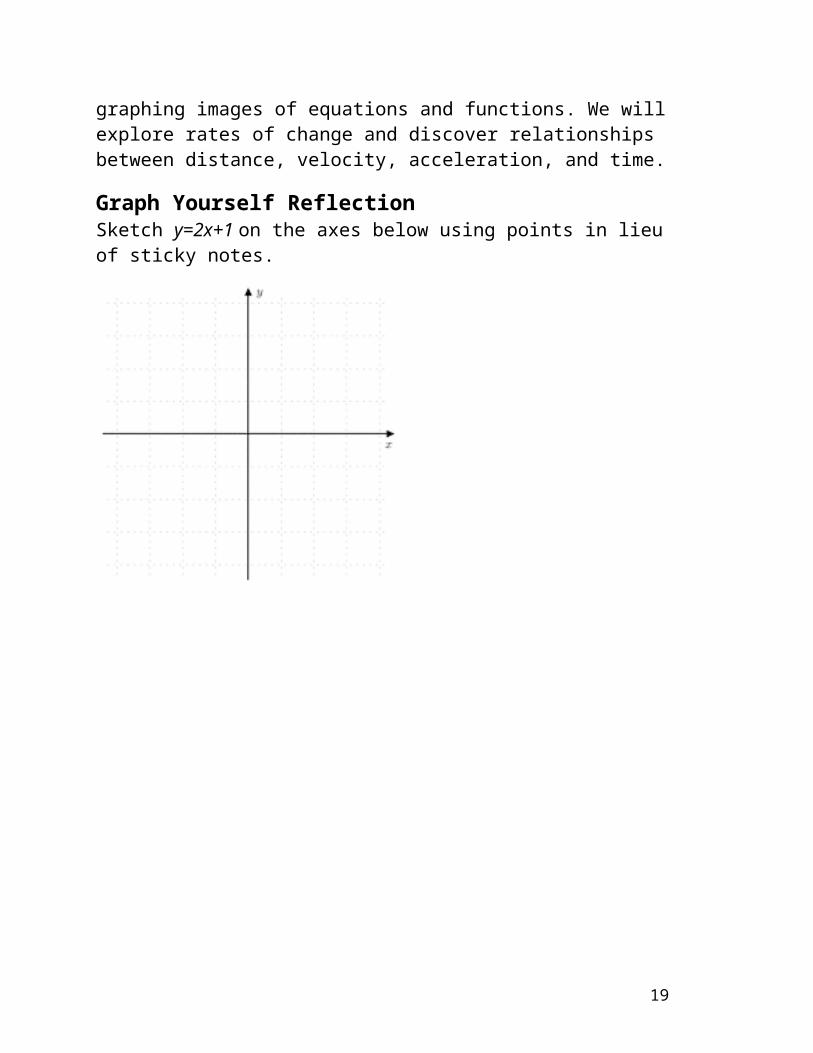
In this section, we will explore the basics of graphing images of equations and functions. We will explore rates of change and discover relationships between distance, velocity, acceleration, and time.
Graph Yourself ReflectionSketch y=2x+1 on the axes below using points in lieu of sticky notes.
16

Ideas for my classroom
17

Pythagorean Exploration
Distance Formula Pythagorean Theorem
d=√(x2−x1)2+( y2− y1)
2 a2+b2=c2
How does the distance formula relate to the Pythagorean Theorem? Justify your answer.
18
Motion Detector Lab The goal of this lab is to gain a more robust understanding of graphs of functions, specifically relationships amongst distance, position, time, speed, velocity, and acceleration.
Instructions
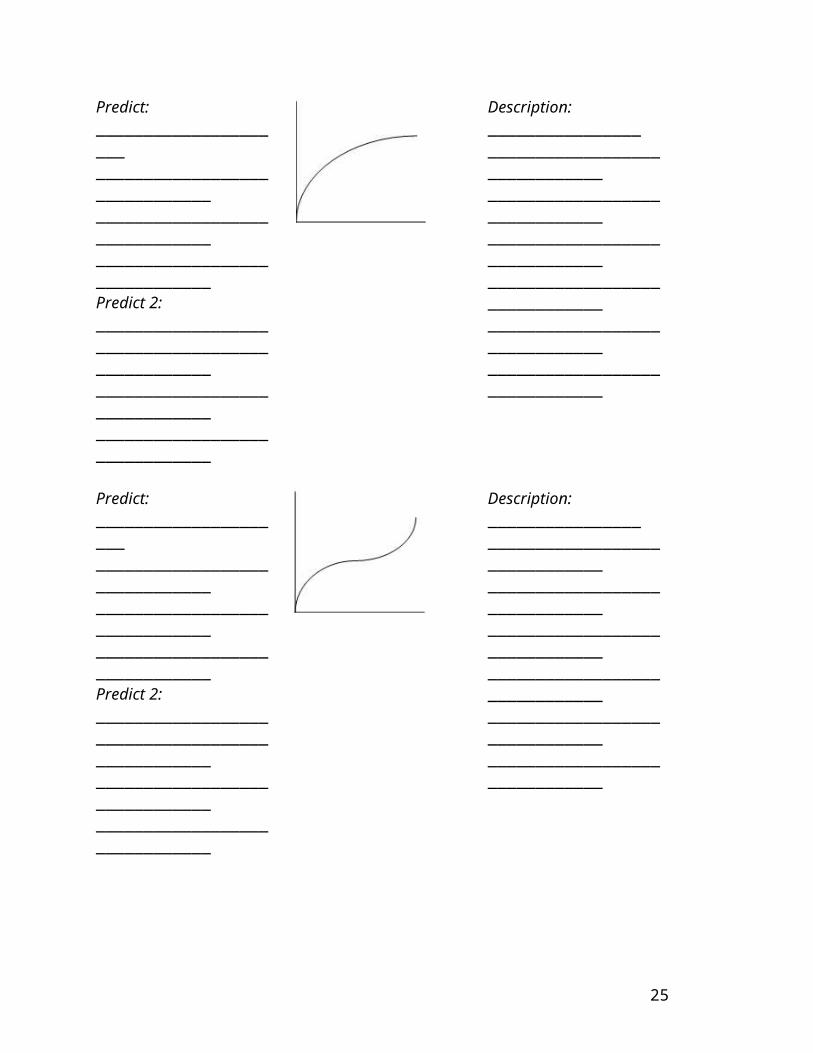
1. Individually write one sentence predicting the motion needed to create the distance (y) v. time (x) graph.
2. For each assigned graph, try to discover a way to reproduce it using the motion detector.
3. Write a detailed description of how your group produced the graph. The description should be written using terms such as ‘rate of change’ and detailed enough to allow another group to reproduce your results.
Predict: _______________________________________________________________________________________________________________Predict 2: ____________________________________________________________________________________________________________
Description: ____________________________________________________________________________________________________________________________________________________________________________________________________
19

Predict: _______________________________________________________________________________________________________________Predict 2: ____________________________________________________________________________________________________________
Description: ____________________________________________________________________________________________________________________________________________________________________________________________________
20

Predict: _______________________________________________________________________________________________________________Predict 2: ____________________________________________________________________________________________________________
Description: ____________________________________________________________________________________________________________________________________________________________________________________________________
21
Section 3: Foundations of Functions
In this section, we will delve into the concept of function. We will develop a definition and explore the general properties of functions.What is a function? (final class/personal definition)
Identifying Functions Exploration
1. y=x2 2.
3. 4.
y4=x2
5. 6.
(3,6)
(2,1)
(3,7)
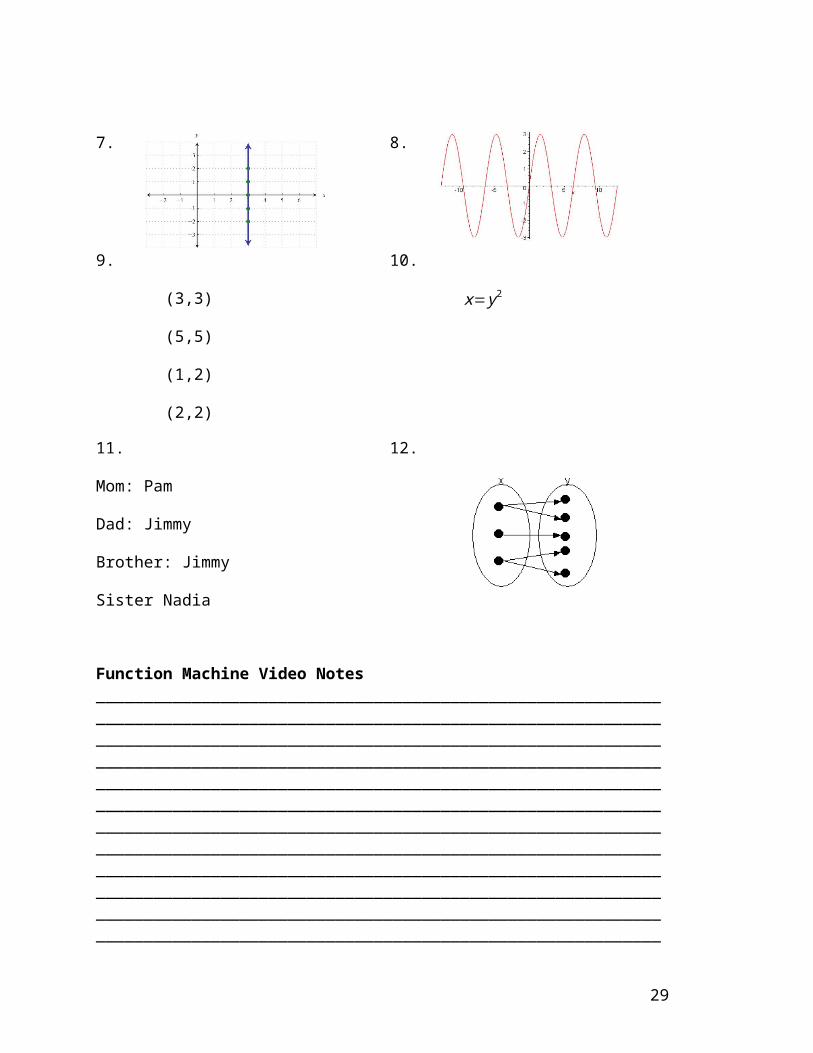
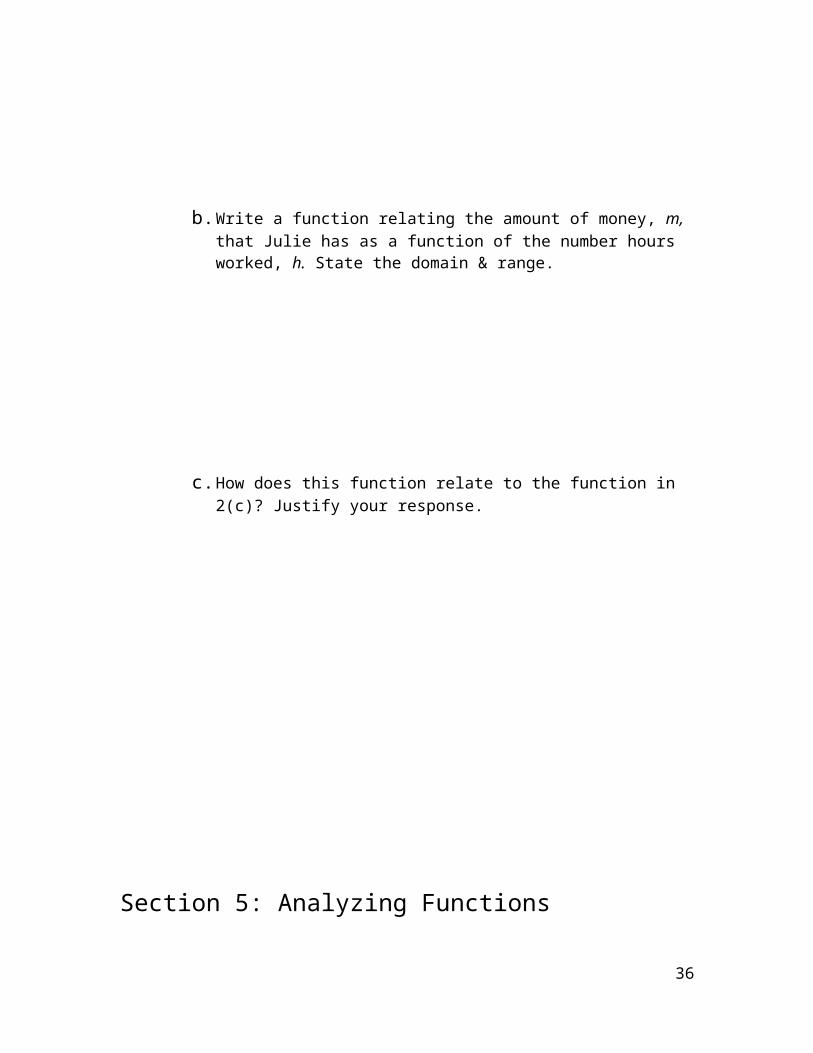
7. 8.
22

9.
(3,3)
(5,5)
(1,2)
(2,2)
10.
x= y2
11.
Mom: Pam
Dad: Jimmy
Brother: Jimmy
Sister Nadia
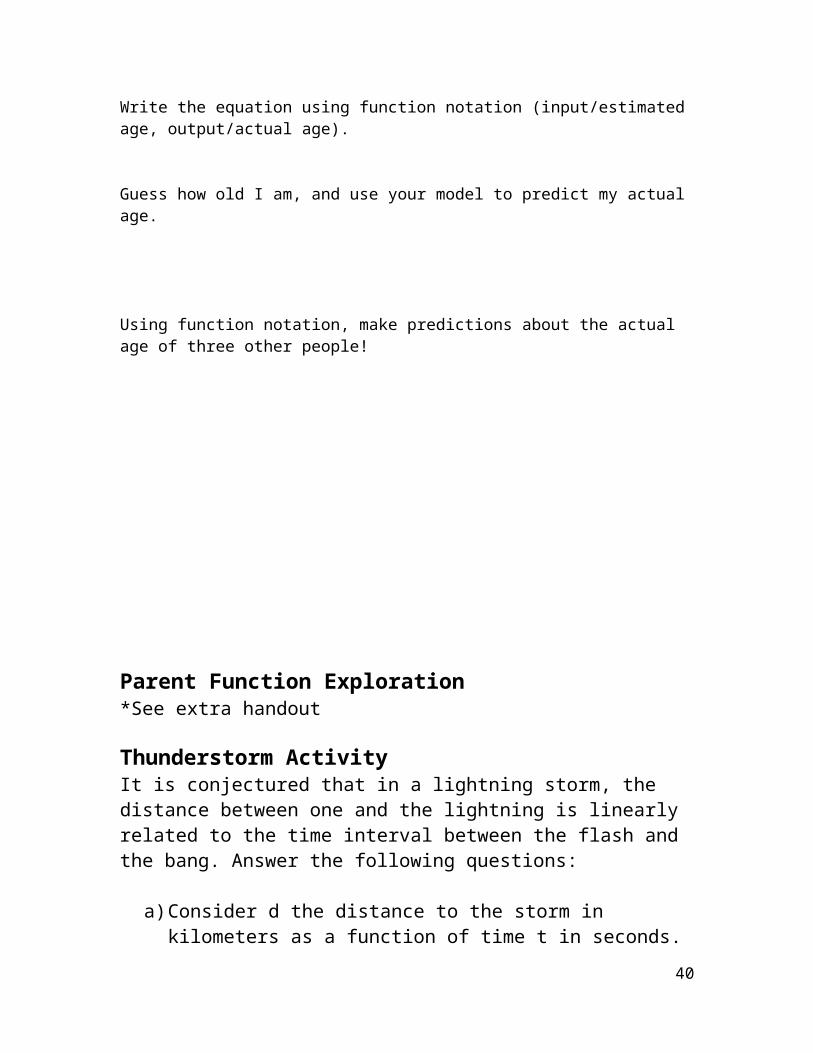
12.
Function Machine Video Notes________________________________________________________________________________________________________________________________________________________________________________________________________________________________________________________________________________________________________________________________________________________________________________________________________________________________________________________________________________________________________________________________________________________________________________________________________________________________________________________________________________________________________________________________________________________________________________________________________________________________________________________________________________________________________________________________________________________________________________________________________________________________________________________________________________________________________________________________________________________________________________________________________________________________________________________________________________________________________________________________________________________________________________________________________________________________________________________________________________________________________________________________________________________________________________________________________________________________________________________________________________________________________________________________________________________________________________________________________________________________________________________________________________________________
Function Writing Assignment1. Is there an essential element that makes a function a function?
Please explain your answer.
23

2. Just because you believe you know the definition of function, does that mean you understand what a function is? Please explain your answer.
3. What is your definition of a function? How has it changed since beginning this training?
4. What is the domain and range, and how do they related to functions?
Scavenger HuntIn your pairs, find at least 3 examples of functions around the campus and 1 example of some relationship that is not a function. Be sure to take a picture of each function and fill in each column of the table
24
below, describing your function.
Description Domain Range Function?
25

Section 4: Representation of FunctionsIn this section we will explore a variety of ways to represent solutions to equations, inequalities, and functions. We will explore patterns amongst some of these common representations, and create models of real-life data, allowing predictions based on our functions.
Exploring Solution Sets
1. Janet has at most $200 to spend on new clothes. She wants to buy a new pair of jeans for $42 and spend the rest on t-shirts. Each t-shirt costs $15.
a. How many t-shirts can she buy?
b. How many different ways can you write the solutions to this problem?
c. Write a general function relating the cost, c, of clothes for Janet as a function of the number of t-shirts she buys, t.
d. What is the solution set for the cost function above?
e. What is the domain and range of this function? How does this relate to the solution from part (a)?
26

2. Melissa works for the House of Blues booking department. She is booking Möstley Crüe (a Mötley Crüe tribute band) to play at House of Blues this summer. The initial cost of the event for set-up, lights, sound engineer, etc. is $875. The cost per ticket is $23.
a. If house of blues wants to make at least $2,500 profit. How many tickets must they sell?
b. How many different ways can you write the solutions to this problem?
c. Write a function relating the profit, p, for House of Blues as a function of the number of tickets sold, t.
d. What is the solution set for the profit function above?
e. What is the domain and range of this function? How does this relate to the solution from part (a)?
27

3. Julie borrowed $875 from a friend to help with some unexpected medical costs. She got a job working for the House of Blues as their marketing coordinator, making $23 per hour.
a. How many hours does she need to work to at least get out of debt with her friend?
b. Write a function relating the amount of money, m, that Julie has as a function of the number hours worked, h. State the domain & range.
c. How does this function relate to the function in 2(c)? Justify your response.
28
Section 5: Analyzing FunctionsIn this section we will use a variety of functions to model data. We will use our models to make predictions about a variety of real-life contexts including thunder and lighting, planets’ distance to the sun, and beyond!
The graph below shows the selling price of houses in your neighborhood for the years 2001 through 2010. You are thinking of selling your house in the next few years. Based on the data visualized below, when would be the best time to sell your house? Why?
Introduction to Modeling Workshop
A scatter plot (or scatter diagram) is used to show the relationship between two variables
Linear Correlation Curvilinear Correlation
29

Correlation analysis is used to measure strength of the association (linear relationship) between two variables
– Only concerned with strength of the relationship – No causal effect is implied
Correlation v. Causation:
Sketch a strong linear correlation and a weak linear correlation
Strong Linear Correlation Weak Linear Correlation
Sketch data with no correlation
No Correlation
30

Correlation Coefficient (r)
Coefficient of Determination (R 2 )
Age Game
Fill in the following table with the estimated ages from the power point!
Graph your scatter plot the back.
What type of correlation does your scatter plot have? Write a sentence explaining how you knew that.
Run a linear regression to find the equation of the best fit line of your data.
Write the equation using function notation (input/estimated age, output/actual age).
Guess how old I am, and use your model to predict my actual age.
Using function notation, make predictions about the actual age of three other people!
Estimated Age (e)
Actual Age (a)
31

Parent Function Exploration*See extra handout
Thunderstorm ActivityIt is conjectured that in a lightning storm, the distance between one and the lightning is linearly related to the time interval between the flash and the bang. Answer the following questions:
a) Consider d the distance to the storm in kilometers as a function of time t in seconds. Suppose, as an experiment, a friend travels along with the storm and reports the actual distance that the storm is from your house as you record the seconds between the flash and the bang.
b) Make a scatter plot of the data and use regression to write the linear equation for this direct variation function.
t 2.98 6.09 14.94 28.99 37.11
d 1 2 5 10 12
c) Use your model to work backwards in order to calculate the times for the thunder sound to reach you from lightning bolts, which are 1.5, 2.5, and 15 kilometers away. What do you call the processes of looking within and beyond your actual data?
CHALLENGE: What would your formula be with seconds and miles as your units?
Function Patterns Exploration
32

Try to find a pattern in both the domain and range of the listed functions.
___x__ f(x)2 4
4 9 6 14 8 19
10 24Example 1
___x__ f(x)1 15
3 5 5 19
7 57 9 119
Example 2
___x__ f(x)1 15
3 135 5 1215
7 10935Example 3
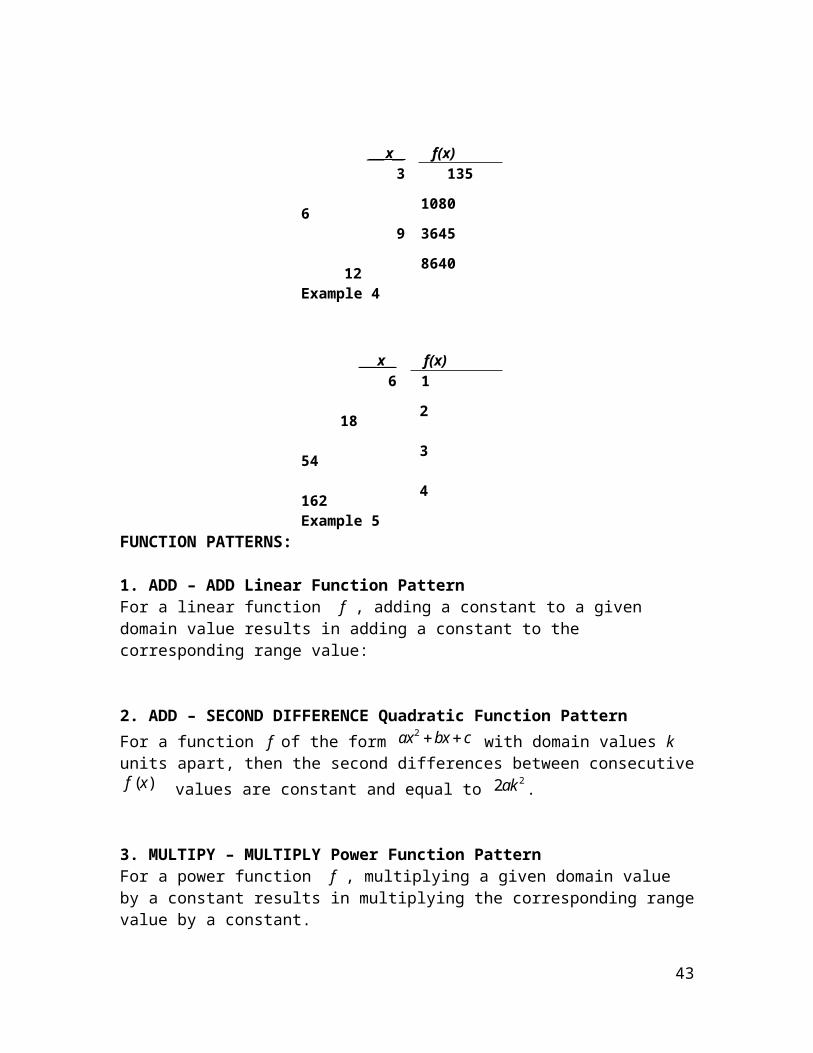
___x__ f(x)3 135
6 1080 9 3645
12 8640Example 4
___x__ f(x)6 1
18 2 54 3 162 4Example 5
FUNCTION PATTERNS:
33

1. ADD – ADD Linear Function PatternFor a linear function f , adding a constant to a given domain value results in adding a constant to the corresponding range value:
2. ADD – SECOND DIFFERENCE Quadratic Function Pattern
For a function f of the form 2ax bx c with domain values k units apart, then the
second differences between consecutive ( )f x values are constant and equal to 22ak .
3. MULTIPY – MULTIPLY Power Function PatternFor a power function f , multiplying a given domain value by a constant results in multiplying the corresponding range value by a constant.
4. ADD – MULTIPLY Exponential Function PatternFor an exponential function f , adding a constant to a given domain value results in multiplying the corresponding range value by a constant.
5. MULTIPLY – ADD Logarithmic Function PatternFor a logarithmic function f , multiplying a given domain value by a constant results in adding a constant to the corresponding range value.
34

Planet ActivityThe table below shows the periods of the orbits of each planet in years and the mean distance from the Sun in kilometers.
Name Period - P (yrs)
Millions of kmfrom the Sun(semi-major axis distance -d)
Mercury 0.24 57.9Venus 0.61 108.2Earth 1 149.6Mars 1.88 228.0Jupiter 11.86 778.5Saturn 29.46 1433.3Uranus 84.01 2872.6Neptune 164.79 4493.6
a) Use "function patterns" (remember this is real data) to try to decide what type of function this data represents considering period, P, as a function of mean distance, d, from the Sun.
b) Based on your answer to a), run a regression to find the equation for the function that fits this data. In addition, comment on the r or R2 (whichever is appropriate for your model).
c) Pluto’s period of revolution is 247.92 Earth years. Can you use your regression equation to determine Pluto’s distance from the Sun? (look online and see how close your model is)
35
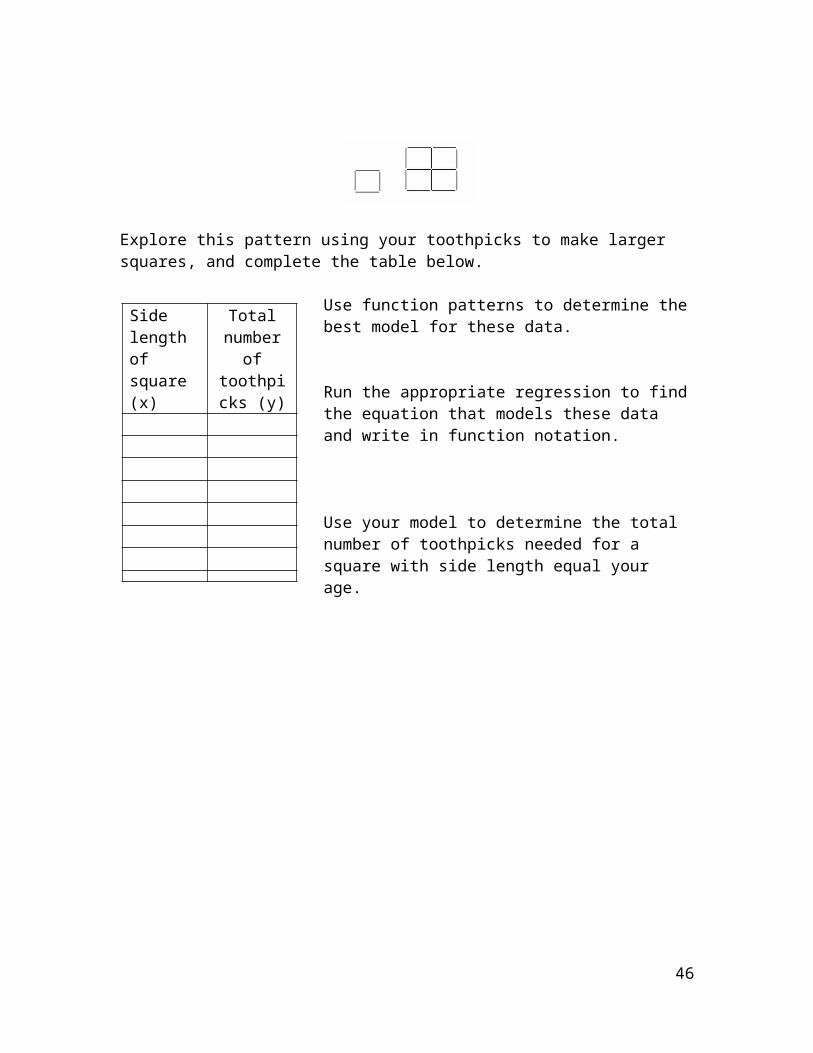
Toothpick FunctionsIn your groups, determine a mathematical model that gives the total number of toothpicks required to construct a square of any size that is subdivided into 1x1 squares of toothpicks. The 1x1 and 2x2 are shown below.
Explore this pattern using your toothpicks to make larger squares, and complete the table below.
Use function patterns to determine the best model for these data.
Run the appropriate regression to find the equation that models these data and write in function notation.
Use your model to determine the total number of toothpicks needed for a square with side length equal your age.
Car Wreck Exploration
Side length of square (x)
Total number of toothpicks
(y)
36

The data below show the speed a mid-size car was traveling, s, and the resulting length in feet, l, of tire skid marks when they slam on brakes.
Speed s
Lengthl
11 2.7319 9.8229 21.2538 37.7951 61.1562 90.88
1. Use "function patterns" (remember this is real data) to try to decide what type of function best models these data considering length, l, as a function of speed, s.
2. Based on your answer above, run a regression to find the equation for the function that best fits this data. In addition, comment on the r or R2 (whichever is appropriate for your model).
3. A police officer arrives at the scene of a car accident to find the drivers arguing over who was at fault for the accident. The woman in the mid-sized, Mercedes Benz says that the man in the mid-sized Porche was speeding, and that is what caused the accident. The man in the Porche claims that he was going the posted speed limit, 55mph. The police officer measured the tire skid marks from the Porche slamming on breaks to be 125 feet long. Use your model to determine whether the man in the Porche was telling the truth.
Section 6: Graphing as a Tool (continued) In this section we will continue to explore graphing, moving from concrete examples to more abstract graphing. Transformations of function graphs will be the major
37

focus of this section, as well as using graphs to make predictions and answer a variety of questions.
Tortoise v. Hare Exploration
The graph below shows the distance traveled during a race between The Tortoise and The Hare.
Based only on this graph, what details do you know about the race? Justify your response.
Math Taboo Meets Pictionary Ideas for your classroom:__________________________________________________________________________________________________________________________________________________________________________________________________
38

______________________________________________________________________________________________________________________________________________________________________________________________________________________________________________________________________________________________________________________________________________________________________________________________________________________________________________________________________________________________________________________________________________________________________________________________________________________________________________________________________________________________________________________________________________________________________________________________________________________________________________________________________________________________________________________________________________________________________________________________________________________________________________________________________________________________________________________________________________________________________________________________________________________________________________________________________________________________________________________________________________________________________________________________________________
Transformation Exploration(1) Graph the Parent Function of the family you were assigned.
Equation: f ( x )=¿¿
For #2-11Using different colors for each graph.
Explore using your ti-84 or https://www.desmos.com/calculator Make sure to clearly label each equation you graph. Once you have identified a pattern, write a hypothesized rule. Justify each of your hypothesized rules with a table or explanation of why
that transformation occurs.
(2) What happens to the parent function
when you add a constant to the output of
39
the parent function? f ( x )+c
Rule:
Justification
(3)What happens to the parent function
when you add a constant to the input of the parent function?
f ( x+c )
Rule:
Justification
(4) What happens to the parent function
when you make all the outputs negative?
−f ( x )
Rule:
Justification
40

(5)What happens to the parent function
when you make all the inputs negative? f (−x )
Rule:
Justification
(6) What happens to the parent function when you multiply the outputs by a
coefficient a, where 0<a<1? a ∙ f ( x )
Rule:
Justification
(7)What happens to the parent function when you multiply the outputs by a
coefficient a, where 0<a<1? a ∙ f ( x )
Rule:
Justification
41

(8)What happens to the parent function when you multiply the outputs by a
coefficient a, where a>1? a ∙ f ( x )
Rule:
Justification
Motion Detector Lab ExtensionModified from original work by Mark L. Daniels, The University of Texas at Austin
The goal of this activity is to continue to explore graphs of functions, while discovering specific relationships between acceleration, velocity, and position v. time.
1. Predict what the following position-time, velocity-time, and acceleration-time graphs will look like if you start at the motion detector and walk backwards at a constant velocity.
Position-time graph Explain your rationale.
42
Velocity-time graph Explain your rationale.
Acceleration-time graph Explain your rationale.
2. Now test your prediction by trying with the motion detector (switching between position/distance, acceleration, and velocity. What did you find? Redraw your graphs below if needed.
Position-time graph Explain your rationale.
43

Velocity-time graph Explain your rationale.
Acceleration-time graph Explain your rationale.
3. For each of the following velocity vs. time graphs try to sketch what you think the corresponding position graph and acceleration graph will look like. Check your work by using the ‘moving man’ PHET simulator on your tablet or personal computer.
A B C
44

Velocity vs. Time (given)
Acceleration vs. Time (your guess)
Position vs. Time (your guess
4. Now try these.A B C
velocity v. time
45
acceleration v. time
position v. time
5. In your own words, explain how velocity, acceleration, and position relate to one another.
46