images1.loopnet.com...Urbanization Group Suburban Periphery Urban Periphery Metro Cities Urban...
16
!" #$ %&%% ' #%()$ &* ' + #%()$ &,,)) -./01 23 4 )% 56 7 89 * :;. ) :<= 0 ;. 60 >1 ;<0 ?< @<; ::<0 %22)
Transcript of images1.loopnet.com...Urbanization Group Suburban Periphery Urban Periphery Metro Cities Urban...

Criteria Used for AnalysisIncome:Median Household Income
Age:Median Age
Population Stats:Total Population
Segmentation:1st Dominant Segment
$57,768 39.5 64,696 Home Improvements
Consumer SegmentationLife Mode UrbanizationWhat are thepeople like thatlive in this area?
Family LandscapesSuccessful younger families in newerhousing
Where do peoplelike this usuallylive?
Suburban PeripheryAffluence in the suburbs, married couple-families, longercommutes
Top TapestrySegments
HomeImprovement
AmericanDreamers City Commons Urban Villages Savvy Suburbanites
% of Households 4,948 (23.6%) 2,943 (14.0%) 2,345 (11.2%) 2,162 (10.3%) 1,718 (8.2%)
% of Miami 0 or no data (0.0%) 0 or no data (0.0%) 7,215 (4.2%) 473 (0.3%) 0 or no data (0.0%)
Lifestyle Group Family Landscapes Ethnic Enclaves Midtown Singles Ethnic Enclaves Affluent Estates
Urbanization Group Suburban Periphery Urban Periphery Metro Cities Urban Periphery Suburban Periphery
Residence Type Single Family Single Family Multi-Unit Rentals;Single Family
Single Family Single Family
Household Type Married Couples Married Couples Single Parents Married Couples Married Couples
Average Household Size 2.86 3.16 2.66 3.75 2.83
Median Age 37 31.8 27.6 33.3 44.1
Diversity Index 63.4 83.3 49.5 85.6 33.2
Median Household Income $67,000 $48,000 $17,000 $58,000 $104,000
Median Net Worth $162,000 $53,000 $10,000 $99,000 $502,000
Median Home Value $174,000 $130,000 – $228,000 $311,000
Homeownership 80.3 % 65 % 24.1 % 70.2 % 91 %
Average Monthly Rent – – $650 – –
Employment Professional orServices
Services orAdministration
Services,Administration orProfessional
Services orAdministration
Professional orManagement
Education College Degree High School Graduate High School Graduate No High SchoolDiploma
College Degree
Preferred Activities Eat at Chili's, Chick-fil-A, PaneraBread. Shopwarehouse/club, homeimprovement stores.
Own feature-rich cellphones. Pay bills,socialize online.
Shop warehouseclubs/discount. Buybaby/children'sproducts.
Buy new clothes; goclubbing; visit waterparks. Shop at Costco,Whole Foods, Target,Nordstrom.
Enjoy good food,wine. DIY gardening,home remodeling.
Financial Invest conservatively Spend moneycarefully; buynecessities
Own private healthcare policy
Carry credit cards Carry first, secondmortgages
Media Watch DIY Network Listen to urban orHispanic radio
Listen to urban radio Own smartphones Shop, bank online
Vehicle Own minivan, SUV One or two vehicles Take publictransportation
Own late-modelcompact car, SUV
Prefer late-modelSUVs, minivans,station wagons
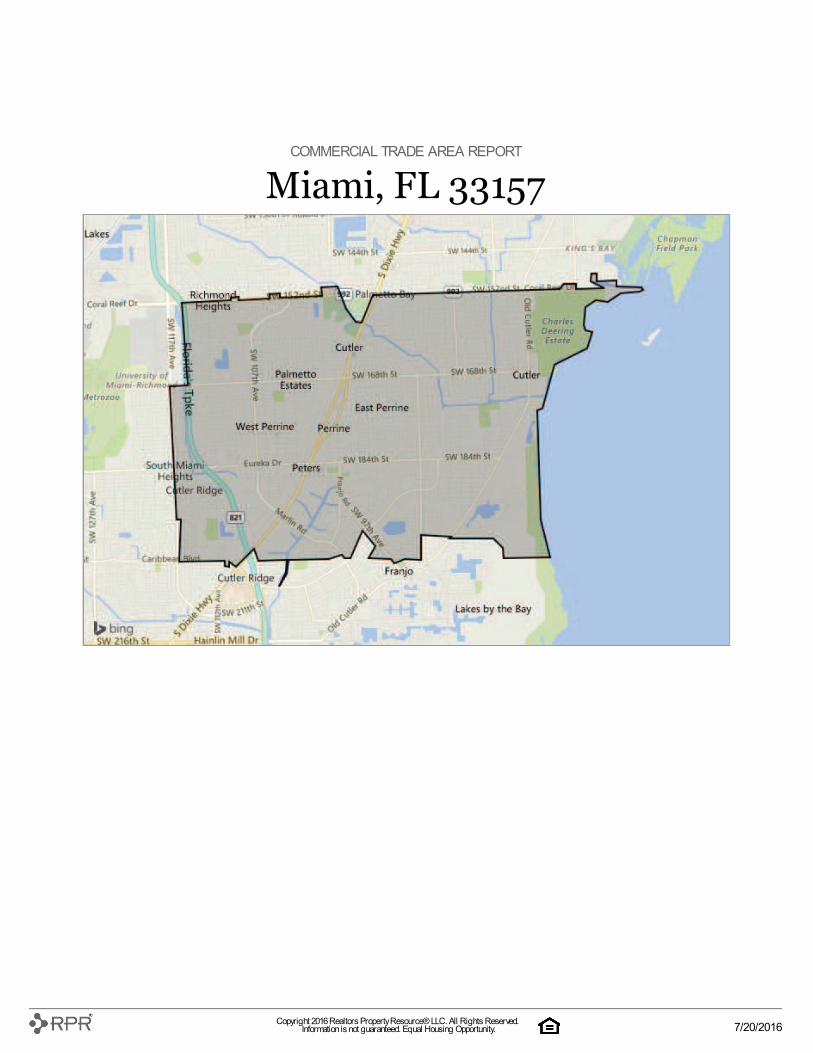
Miami, FL 33157
Copyright 2016 Realtors Property Resource® LLC. All Rights Reserved. Information is not guaranteed. Equal Housing Opportunity. 7/20/2016

Who We AreMarried-couple families occupy well overhalf of these suburban households. MostHome Improvement residences aresingle-family homes that are owneroccupied, with only one-fifth of thehouseholds occupied by renters.Education and diversity levels are similarto the U.S. as a whole. These familiesspend a lot of time on the go and thereforetend to eat out regularly. When at home,weekends are consumed with homeimprovement and remodeling projects.
Our NeighborhoodThese are low-density suburbanneighborhoods.Eight of every 10 homes are traditional single-family dwellings, owner occupied.Majority of the homes were built between 1970and 2000.More than half of the households consist ofmarried-couple families; another 12% includesingle-parent families.
Socioeconomic TraitsHigher participation in the labor force andlower unemployment than US levels; mosthouseholds have 2+ workers.Cautious consumers that do their researchbefore buying, they protect their investments.Typically spend 4-7 hours per weekcommuting, and, therefore, spend significantamounts on car maintenance (performed at adepartment store or auto repair chain store).They are paying off student loans and secondmortgages on homes.They spend heavily on eating out, at both fast-food and family restaurants.They like to work from home, when possible.
Market ProfileEnjoy working on home improvement projectsand watching DIY networks.Make frequent trips to warehouse/club andhome improvement stores in their minivan orSUV.Own a giant screen TV with fiber-opticconnection and premium cable; rent DVDsfrom Redbox or Netflix.Very comfortable with new technology;embrace the convenience of completing taskson a mobile device.Enjoy dining at Chili's, Chick-fil-A and PaneraBread.Frequently buy children's clothes and toys.
An overview of who makes up this segment across the United States
The demographic segmentation shown here can help you understand the lifestyles and life stages of consumers in a market. Data provider Esri classifiesU.S. residential neighborhoods into 67 unique market segments based on socioeconomic and demographic characteristics. Data Source: Esri 2015. UpdateFrequency: Annually.
This is the
#1dominant segmentfor this area
In this area
23.6%of households fallinto this segment
In the United States
1.7%of households fallinto this segment
About this segment
Home Improvement
Miami, FL 33157
Copyright 2016 Realtors Property Resource® LLC. All Rights Reserved. Information is not guaranteed. Equal Housing Opportunity. 7/20/2016

Who We AreLocated throughout the South and West,most American Dreamers residents owntheir own homes, primarily single-familyhousing--farther out of the city, wherehousing is more affordable. Medianhousehold income is slightly belowaverage. The majority of householdsinclude younger married-couple familieswith children and, frequently,grandparents. Diversity is high; manyresidents are foreign born, of Hispanicorigin. Hard work and sacrifice haveimproved their economic circumstance asthey pursue a better life for themselvesand their family. Spending is focusedmore on the members of the householdthan the home. Entertainment includesmultiple televisions, movie rentals andvideo games at home or visits to themeparks and zoos. This market is connectedand adept at accessing what they wantfrom the Internet.
Our NeighborhoodAmerican Dreamers residents are family-centricand diverse. Most are married couples withchildren of all ages or single parents;multigenerational homes are common.Average household size is higher than U.S.average at 3.16.Residents tend to live further out from urbancenters--more affordable single-family homesand more elbow room.Tenure is slightly above average with 65%owner occupancy; primarily single-familyhomes with more mortgages and slightlyhigher monthly costs.Three quarters of all housing were built since1970.Many neighborhoods are located in the urbanperiphery of the largest metropolitan areasacross the South and West.Most households have one or two vehiclesavailable and a longer commute to work.
Socioeconomic TraitsWhile nearly 16% have earned a collegedegree, the majority, or 63%, hold a highschool diploma only or spent some time at acollege or university.Unemployment is higher at 10.7%; labor forceparticipation is also higher at 67%.Most American Dreamers residents deriveincome from wages or salaries, but the rate ofpoverty is a bit higher in this market.They tend to spend money carefully and focusmore on necessities.They are captivated by new technology,particularly feature-rich smartphones.Connected: They use the Internet primarily forsocializing but also for convenience, likepaying bills online.
Market ProfileWhen dining out, these residents favor fast-food dining places such as Taco Bell orWendy's, as well as family-friendly restaurantslike Olive Garden, Denny's or IHOP.Cell phones are preferred over landlines.Favorite channels include Animal Planet,MTV, Cartoon Network, and Disney, as well asprogramming on Spanish TV.Residents listen to urban or Hispanic radio.During the summer, family outings to themeparks are especially popular.
An overview of who makes up this segment across the United States
The demographic segmentation shown here can help you understand the lifestyles and life stages of consumers in a market. Data provider Esri classifiesU.S. residential neighborhoods into 67 unique market segments based on socioeconomic and demographic characteristics. Data Source: Esri 2015. UpdateFrequency: Annually.
This is the
#2dominant segmentfor this area
In this area
14.0%of households fallinto this segment
In the United States
1.5%of households fallinto this segment
About this segment
American Dreamers
Miami, FL 33157
Copyright 2016 Realtors Property Resource® LLC. All Rights Reserved. Information is not guaranteed. Equal Housing Opportunity. 7/20/2016

Who We AreThe City Commons segment is one of theyoungest and largest markets, primarilycomprising single-parent and single-person households living within large,metro cities. While more than a third havea college degree or spent some time incollege, nearly a third have not finishedhigh school, which has a profound effecton their economic circumstance. However,that has not dampened their aspiration tostrive for the best for themselves and theirchildren.
Our NeighborhoodSingle parents, primarily female, and singleshead these young households.Average household size is slightly higher thanthe U.S. average at 2.66.City Commons are found in large metropolitancities, where most residents rent apartments inmidrise buildings.Neighborhoods are older, built before 1960,with high vacancy rates.Typical of the city, many households owneither one vehicle or none, and use publictransportation or taxis.
Socioeconomic TraitsAlthough some have college degrees, nearlyone in three have not graduated from highschool.Unemployment is very high at 24%; labor forceparticipation is low at 54%.Most households receive income from wages orsalaries, but nearly one in four receivecontributions from Social Security and publicassistance.Consumers endeavor to keep up with the latestfashion trends.Most families prefer the convenience of fast-food restaurants to cooking at home.
Market ProfileBaby and children's products, like food andclothing, are the primary purchases.They shop primarily at warehouse clubs likeSam's Club and discount department storessuch as Kmart.While most residents obtain privately issuedmedical insurance plans, some are covered byFederal programs like Medicaid.They subscribe to cable TV; children-orientedprograms are popular, as are game shows andhome shopping channels.Magazines are extremely popular sources ofnews and the latest trends, including baby,bridal and parenthood types of magazines.They enjoy listening to urban radio.
An overview of who makes up this segment across the United States
The demographic segmentation shown here can help you understand the lifestyles and life stages of consumers in a market. Data provider Esri classifiesU.S. residential neighborhoods into 67 unique market segments based on socioeconomic and demographic characteristics. Data Source: Esri 2015. UpdateFrequency: Annually.
This is the
#3dominant segmentfor this area
In this area
11.2%of households fallinto this segment
In the United States
0.9%of households fallinto this segment
About this segment
City Commons
Miami, FL 33157
Copyright 2016 Realtors Property Resource® LLC. All Rights Reserved. Information is not guaranteed. Equal Housing Opportunity. 7/20/2016

Who We AreUrban Villages residents are multicultural,multigenerational and multilingual. Trendyand fashion conscious, they are risktakers. However, these consumers focuson their children and maintain gardens.They are well connected with theirsmartphones, but more likely to shop inperson or via the Home ShoppingNetwork. Their favorite stores are asdiverse as they are, Costco or WholeFoods, Target or Nordstrom.
Our NeighborhoodOlder homes (most built before 1970) arefound in the urban periphery of largemetropolitan markets.Married couples with children, andgrandparents; many households aremultigenerational. Average household size is3.75.Homes are older, primarily single family, with ahigher median value of $228,000 and a lowervacancy rate of 5.2%.
Socioeconomic TraitsMulticultural market including recentimmigrants and some language barriers.Education: more than half the populationaged 25 or older have a high school diplomaor some college.Labor force participation rate higher than theU.S., but so is the unemployment rate at10.5%.Brand conscious but not necessarily brandloyal; open to trying new things.Status-conscious consumers; choices reflecttheir youth--attention to style and pursuit oftrends.Comfortable with technology and interested inthe latest innovations.
Market ProfileFashion matters to Urban Villages residents,who spend liberally on new clothes for thewhole family.Saving is more limited than spending in thisyoung market.They carry credit cards, but banking is basic.They are likely to pay bills in person or online.Media preferences vary, but feature culturallyspecific channels or children's shows.Leisure includes family activities like going towater parks, gardening, and clubbing, plussports like soccer and softball.
An overview of who makes up this segment across the United States
The demographic segmentation shown here can help you understand the lifestyles and life stages of consumers in a market. Data provider Esri classifiesU.S. residential neighborhoods into 67 unique market segments based on socioeconomic and demographic characteristics. Data Source: Esri 2015. UpdateFrequency: Annually.
This is the
#4dominant segmentfor this area
In this area
10.3%of households fallinto this segment
In the United States
1.1%of households fallinto this segment
About this segment
Urban Villages
Miami, FL 33157
Copyright 2016 Realtors Property Resource® LLC. All Rights Reserved. Information is not guaranteed. Equal Housing Opportunity. 7/20/2016

Who We AreSavvy Suburbanites residents are welleducated, well read and well capitalized.Families include empty nesters and emptynester wannabes, who still have adultchildren at home. Located in olderneighborhoods outside the urban core,their suburban lifestyle includes homeremodeling and gardening plus the activepursuit of sports and exercise. They enjoygood food and wine, plus the amenities ofthe city's cultural events.
Our NeighborhoodEstablished neighborhoods (most builtbetween 1970 and 1990) found in thesuburban periphery of large metropolitanmarkets.Married couples with no children or olderchildren; average household size is 2.83.91% owner occupied; 71% mortgaged.Primarily single-family homes, with a medianvalue of $311,000.Low vacancy rate at 4.5%.
Socioeconomic TraitsEducation: 48.1% college graduates; 76.1%with some college education.Low unemployment at 5.8%; higher labor forceparticipation rate at 68.5% with proportionatelymore two-worker households at 65.4%.Well-connected consumers that appreciatetechnology and make liberal use of it foreverything from shopping and banking tostaying current and communicating.Informed shoppers that do their research priorto purchasing and focus on quality.
Market ProfileResidents prefer late model, family-orientedvehicles: SUVs, minivans, and station wagons.Gardening and home remodeling arepriorities, usually DIY. Riding mowers andpower tools are popular, although they alsohire contractors for the heavy lifting.There is extensive use of housekeeping andpersonal care services.Foodies: They like to cook and prefer natural ororganic products.These investors are financially active, using anumber of resources for informed investing.They are not afraid of debt; many householdscarry first and second mortgages, plus homeequity credit lines.Physically fit, residents actively pursue anumber of sports, from skiing to golf, and investheavily in sports gear and exercise equipment.
An overview of who makes up this segment across the United States
The demographic segmentation shown here can help you understand the lifestyles and life stages of consumers in a market. Data provider Esri classifiesU.S. residential neighborhoods into 67 unique market segments based on socioeconomic and demographic characteristics. Data Source: Esri 2015. UpdateFrequency: Annually.
This is the
#5dominant segmentfor this area
In this area
8.2%of households fallinto this segment
In the United States
3.0%of households fallinto this segment
About this segment
Savvy Suburbanites
Miami, FL 33157
Copyright 2016 Realtors Property Resource® LLC. All Rights Reserved. Information is not guaranteed. Equal Housing Opportunity. 7/20/2016

20152020 (Projected)
Total PopulationThis chart shows the total population inan area, compared with othergeographies.Data Source: U.S. Census AmericanCommunity Survey via Esri, 2015Update Frequency: Annually
20152020 (Projected)
Population DensityThis chart shows the number of peopleper square mile in an area, comparedwith other geographies.Data Source: U.S. Census AmericanCommunity Survey via Esri, 2015Update Frequency: Annually
20152020 (Projected)
Population Change Since 2010This chart shows the percentage changein area's population from 2010 to 2015,compared with other geographies.Data Source: U.S. Census AmericanCommunity Survey via Esri, 2015Update Frequency: Annually
20152020 (Projected)
Average Household SizeThis chart shows the average householdsize in an area, compared with othergeographies.Data Source: U.S. Census AmericanCommunity Survey via Esri, 2015Update Frequency: Annually
Miami, FL 33157: Population Comparison
Miami, FL 33157
Copyright 2016 Realtors Property Resource® LLC. All Rights Reserved. Information is not guaranteed. Equal Housing Opportunity. 7/20/2016

20152020 (Projected)
Population Living in FamilyHouseholdsThis chart shows the percentage of anarea’s population that lives in ahousehold with one or more individualsrelated by birth, marriage or adoption,compared with other geographies.Data Source: U.S. Census AmericanCommunity Survey via Esri, 2015Update Frequency: Annually
Women 2015Men 2015Women 2020 (Projected)Men 2020 (Projected)
Female / Male RatioThis chart shows the ratio of females tomales in an area, compared with othergeographies.Data Source: U.S. Census AmericanCommunity Survey via Esri, 2015Update Frequency: Annually
Miami, FL 33157
Copyright 2016 Realtors Property Resource® LLC. All Rights Reserved. Information is not guaranteed. Equal Housing Opportunity. 7/20/2016

20152020 (Projected)
Median AgeThis chart shows the median age in anarea, compared with other geographies.Data Source: U.S. Census AmericanCommunity Survey via Esri, 2015Update Frequency: Annually
20152020 (Projected)
Population by AgeThis chart breaks down the population ofan area by age group.Data Source: U.S. Census AmericanCommunity Survey via Esri, 2015Update Frequency: Annually
Miami, FL 33157: Age Comparison
Miami, FL 33157
Copyright 2016 Realtors Property Resource® LLC. All Rights Reserved. Information is not guaranteed. Equal Housing Opportunity. 7/20/2016

MarriedUnmarried
Married / Unmarried AdultsRatioThis chart shows the ratio of married tounmarried adults in an area, comparedwith other geographies.Data Source: U.S. Census AmericanCommunity Survey via Esri, 2015Update Frequency: Annually
MarriedThis chart shows the number of people inan area who are married, compared withother geographies.Data Source: U.S. Census AmericanCommunity Survey via Esri, 2015Update Frequency: Annually
Never MarriedThis chart shows the number of people inan area who have never been married,compared with other geographies.Data Source: U.S. Census AmericanCommunity Survey via Esri, 2015Update Frequency: Annually
WidowedThis chart shows the number of people inan area who are widowed, comparedwith other geographies.Data Source: U.S. Census AmericanCommunity Survey via Esri, 2015Update Frequency: Annually
DivorcedThis chart shows the number of people inan area who are divorced, compared withother geographies.Data Source: U.S. Census AmericanCommunity Survey via Esri, 2015Update Frequency: Annually
Miami, FL 33157: Marital Status Comparison
Miami, FL 33157
Copyright 2016 Realtors Property Resource® LLC. All Rights Reserved. Information is not guaranteed. Equal Housing Opportunity. 7/20/2016

20152020 (Projected)
Average Household IncomeThis chart shows the average householdincome in an area, compared with othergeographies.Data Source: U.S. Census AmericanCommunity Survey via Esri, 2015Update Frequency: Annually
20152020 (Projected)
Median Household IncomeThis chart shows the median householdincome in an area, compared with othergeographies.Data Source: U.S. Census AmericanCommunity Survey via Esri, 2015Update Frequency: Annually
20152020 (Projected)
Per Capita IncomeThis chart shows per capita income in anarea, compared with other geographies.Data Source: U.S. Census AmericanCommunity Survey via Esri, 2015Update Frequency: Annually
Average Disposable IncomeThis chart shows the average disposableincome in an area, compared with othergeographies.Data Source: U.S. Census AmericanCommunity Survey via Esri, 2015Update Frequency: Annually
Miami, FL 33157: Economic Comparison
Miami, FL 33157
Copyright 2016 Realtors Property Resource® LLC. All Rights Reserved. Information is not guaranteed. Equal Housing Opportunity. 7/20/2016

MiamiMiami-Dade CountyFloridaUSA
Unemployment RateThis chart shows the unemploymenttrend in an area, compared with othergeographies.Data Source: Bureau of Labor Statisticsvia 3DLUpdate Frequency: Monthly
Employment Count byIndustryThis chart shows industries in an areaand the number of people employed ineach category.Data Source: Bureau of Labor Statisticsvia Esri, 2015Update Frequency: Annually
Miami, FL 33157
Copyright 2016 Realtors Property Resource® LLC. All Rights Reserved. Information is not guaranteed. Equal Housing Opportunity. 7/20/2016
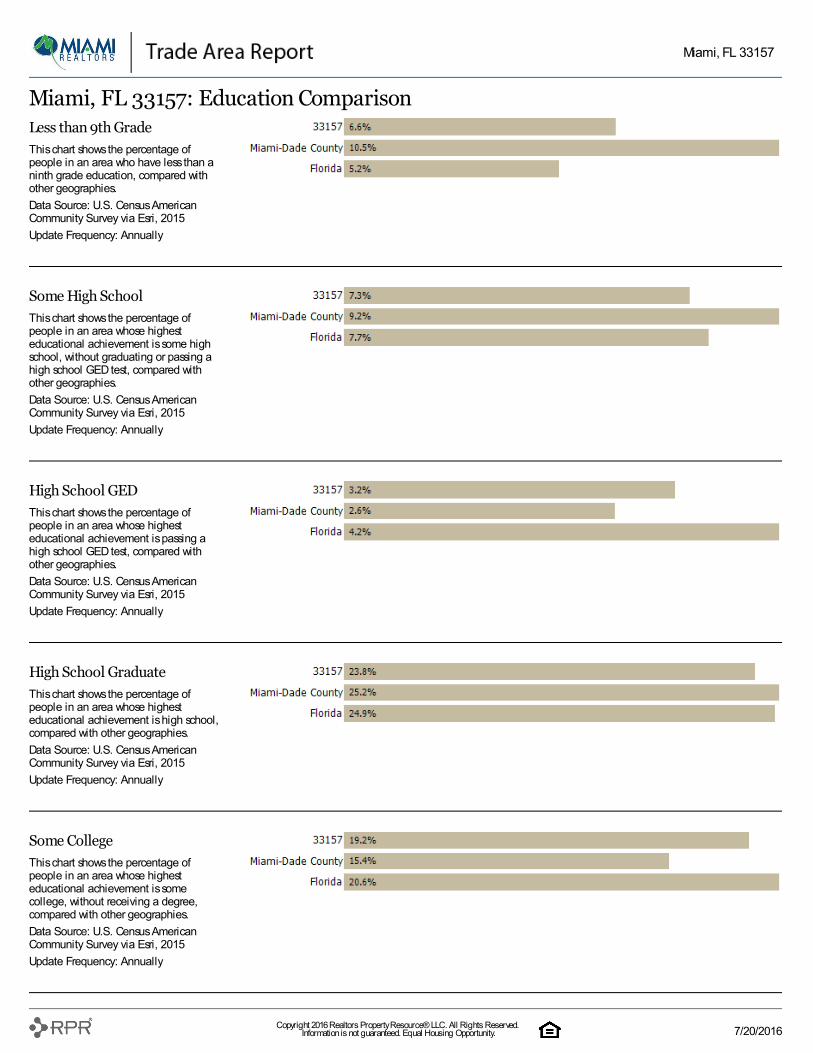
Less than 9th GradeThis chart shows the percentage ofpeople in an area who have less than aninth grade education, compared withother geographies.Data Source: U.S. Census AmericanCommunity Survey via Esri, 2015Update Frequency: Annually
Some High SchoolThis chart shows the percentage ofpeople in an area whose highesteducational achievement is some highschool, without graduating or passing ahigh school GED test, compared withother geographies.Data Source: U.S. Census AmericanCommunity Survey via Esri, 2015Update Frequency: Annually
High School GEDThis chart shows the percentage ofpeople in an area whose highesteducational achievement is passing ahigh school GED test, compared withother geographies.Data Source: U.S. Census AmericanCommunity Survey via Esri, 2015Update Frequency: Annually
High School GraduateThis chart shows the percentage ofpeople in an area whose highesteducational achievement is high school,compared with other geographies.Data Source: U.S. Census AmericanCommunity Survey via Esri, 2015Update Frequency: Annually
Some CollegeThis chart shows the percentage ofpeople in an area whose highesteducational achievement is somecollege, without receiving a degree,compared with other geographies.Data Source: U.S. Census AmericanCommunity Survey via Esri, 2015Update Frequency: Annually
Miami, FL 33157: Education Comparison
Miami, FL 33157
Copyright 2016 Realtors Property Resource® LLC. All Rights Reserved. Information is not guaranteed. Equal Housing Opportunity. 7/20/2016

Associate DegreeThis chart shows the percentage ofpeople in an area whose highesteducational achievement is an associatedegree, compared with othergeographies.Data Source: U.S. Census AmericanCommunity Survey via Esri, 2015Update Frequency: Annually
Bachelor's DegreeThis chart shows the percentage ofpeople in an area whose highesteducational achievement is a bachelor'sdegree, compared with othergeographies.Data Source: U.S. Census AmericanCommunity Survey via Esri, 2015Update Frequency: Annually
Grad/Professional DegreeThis chart shows the percentage ofpeople in an area whose highesteducational achievement is a graduateor professional degree, compared withother geographies.Data Source: U.S. Census AmericanCommunity Survey via Esri, 2015Update Frequency: Annually
Miami, FL 33157
Copyright 2016 Realtors Property Resource® LLC. All Rights Reserved. Information is not guaranteed. Equal Housing Opportunity. 7/20/2016

Median Estimated Home ValueThis chart displays property estimates foran area and a subject property, whereone has been selected. Estimated homevalues are generated by a valuationmodel and are not formal appraisals.Data Source: Valuation calculationsbased on public records and MLS sourceswhere licensedUpdate Frequency: Monthly
12-Month Change in MedianEstimated Home ValueThis chart shows the 12-month change inthe estimated value of all homes in thisarea, the county and the state. Estimatedhome values are generated by avaluation model and are not formalappraisals.Data Source: Valuation calculationsbased on public records and MLS sourceswhere licensedUpdate Frequency: Monthly
Median Listing PriceThis chart displays the median listingprice for homes in this area, the countyand the state.Data Source: On- and off-market listingssourcesUpdate Frequency: Monthly
12-Month Change in MedianListing PriceThis chart displays the 12-month changein the median listing price of homes inthis area, and compares it to the countyand state.Data Source: On- and off-market listingssourcesUpdate Frequency: Monthly
Miami, FL 33157: Home Value Comparison
Miami, FL 33157
Copyright 2016 Realtors Property Resource® LLC. All Rights Reserved. Information is not guaranteed. Equal Housing Opportunity. 7/20/2016