SURVEYS, OF THE EARTH'S RESOURCES AND, ENVI-PR0NMENT, BY ... · PDF fileSURVEYS OF THE EARTH'S...
20
'-1 '!, - I . . .- -- NX-900-75-35 .. .. B.. ' . {\ • / ", - " V , - -- ' '---\ "- - - " -. •j , 1 . . r\ ' - l ,,, - -' _ . - 's-_ N i-- 6 " N " ' . - , \ , - . '" . - - r. r -' - r -SURVEYS, OF THE EARTH'S RESOURCES AND, ENVI-PR0NMENT, BY SATELLITES -: / -1 ( - (NASA-TM-X-7 0 843 ) SURVEYS OF THE EARTH'S N75-18 6 9 6 , RESOURCES AND ENVIRONMENT BY SATELLITES i (NASA) 20 p HC $3.25 CSCL 08G ( Ap $Unclas G3/43 13285 " -- '- . .. . .-. - I E . . i.:. WI1IP~~: NoRDBERG r-'-WILLIAM - - -: HERB--rIEDEMANN . - - CHf!!RLES BOHN " - .,"ODAR SPC-LGTCNE ---- - < -- - G B " ..- L N -r - .:.,I- - ."-. . PRESENW AT AMRICAN-MNING-COGRESS' - --. •,8 ,O- ,B:ER,1974 , , - ' . I * ", ". j / 7 >-f " ] k : , -- FEBRUARY 1975 ys- - <- N >1 "/ -:" ... -- . II < " ' " - "" - N - - " " REENBELT MARYLAND -- - -PR ESENTED AT AMERICAN-MININ-CONGRESS .- , . '\_CO ER '7 . - -4- - N I8 OTMERN CON RES https://ntrs.nasa.gov/search.jsp?R=19750010624 2018-05-15T18:44:40+00:00Z
Transcript of SURVEYS, OF THE EARTH'S RESOURCES AND, ENVI-PR0NMENT, BY ... · PDF fileSURVEYS OF THE EARTH'S...

'-1 '!, - I
. . .- -- NX-900-75-35
.. .. B.. ' . {\ • / ", - "
V , -
-- ' '---\ "- - - " -.
•j , 1 . . r\ ' - l,,, - -' _ . - 's-_ N i-- 6" N " ' . - , \ , - . '" .- -
r. r
-' -r
-SURVEYS, OF THE EARTH'S RESOURCESAND, ENVI-PR0NMENT, BY SATELLITES
-: / -1 (
- (NASA-TM-X-7 0 8 4 3 ) SURVEYS OF THE EARTH'S N75-18 6 9 6 ,RESOURCES AND ENVIRONMENT BY SATELLITES i
(NASA) 20 p HC $3.25 CSCL 08G( Ap $Unclas
G3/43 13285
" -- '- . .. . .-. -
I E. .
i.:. WI1IP~~: NoRDBERGr-'-WILLIAM - -
-: HERB--rIEDEMANN . -- CHf!!RLES BOHN " -
.,"ODAR SPC-LGTCNE
---- - < -- -
G B " ..- L N -r -
.:.,I- - ."-. .
PRESENW AT AMRICAN-MNING-COGRESS'
- --. •,8 ,O- ,B:ER,1974 , ,
- ' . I * ", ". j / 7 >-f " ] k : ,
-- FEBRUARY 1975 ys- - <-
N >1
"/ -:" ... -- .
II
< " '
" - "" - N - - " "
REENBELT MARYLAND
-- - -PR ESENTED AT AMERICAN-MININ-CONGRESS.- , . '\_CO ER '7 .- -4-
- N
I8 OTMERN CON RES
https://ntrs.nasa.gov/search.jsp?R=19750010624 2018-05-15T18:44:40+00:00Z

-N
For information concerning availabilityof this document contact:
Technical Information Division, Code 250Goddard Space Flight CenterGreenbelt, Maryland -20771'
(Telephone 301-982-4488)
"This paper presents the views of the aithor(s), and doesinot necessarilyreflect the views of the Goddard Space Flight Center, or NASA."
//
/-

X-900-75-35
SURVEY OF THE EARTH'S RESOURCES
AND ENVIRONMENT BY SATELLITES
William Nordberg
Herb TiedemannCharles Bohn
February 1975
GODDARD SPACE FLIGHT CENTERGreenbelt, Maryland

SURVEYS OF THE EARTH'S RESOURCES
AND ENVIRONMENT BY SATELLITES
Dr. William Nordberg
ABSTRACT
Two of NASA's recent satellites have made very significant con-
tributions to the systematic surveying of processes and phenom-
ena occurring on the surface of the earth. ERTS-1, which has
operated almost flawlessly since August 1972, is providing
registered, multispectral images of about 5 million square
kilometers of the earth's surface every day. These images
are being used to make thematic maps on scales of at least
1:250, 000 almost instantly. They have been used for the assess-
ment of available water resources and for a iationwide survey
of water impoundment. Maps of landforms and tectonic features
made from ERTS images have demonstrated their utility in
facilitating mineral and petroleum exploration, expecially in
making such exploration more cost effective. Other applica-
tions of ERTS-1 images throughout the world have been in land
use planning; crop, forest and rangeland inventory; assessment
of flood, earthquake and other environmental hazards; monitor-
ing coastal processes and the environmental effects of industrial
effluents and of air pollution.
Images of the earth's surface, although with the crude spatial
resolution of 30 x 30 km, were extended into the microwave
spectrum for the first time with NIMBUS 5 in 1973. This has
resulted in our ability to map, daily and synoptically, the dis-
tribution and types of ice covering the earth's polar caps. Some
gross characteristics of global soil moisture distributions can
also be derived from these observations.
PRECEDING PAGE BLANK NOT FILMED
iii

CONTENTS
Page
ABSTRACT ................... ....... ii
INTRODUCTION ........... ........ .... 1
GEOLOGICAL ANALYSES OF ERTS IMAGES ......... .. 3
MINERAL AND PETROLEUM EXPLORATION . .......... 5
GEOLOGICAL HAZARDS AND USE OF ERTS IMAGES
IN CIVIL CONSTRUCTION PROJECTS ......... . . 6
ENVIRONMENTALIMPACT .................. 7
CONCLUSION .................. ........ 8
REFERENCES ......... ......... .. . . .. 9
FIGURE CAPTIONS ..................... . 10
ILLUSTRATIONS
Figure Page
1 Photo Mosaic of the State of Nevada ...... . .... 11
2 United States Photo Mosaic of the 48 Contiguous States . . . 12
3 Structure Map of Wind River Range, Wyoming . ...... 13
4 Vegetation Destruction - Ducktown, Tennessee . ... . . 14
PRECEDING PAGE BLANK NOT FILMED
v

INTRODUTION
Since the launching of the first Earth Resources Technology Satellite (ERTS),which took place more than two years ago, many words have been spoken and
written about this new marvel of our space technology. Some have claimed
that this method of observing our planet will be a panacea to finding minerals,predicting earthquakes, harvesting crops and ridding the world of the plaguesof pollution and the abuse of land resources, while cynics have called remote
sensing from satellites just another tinkertoy of the engineers. Obviously,the truth lies somewhere between these two extremes. It is the intent of this
presentation to put this argument in a realistic perspective, and to discuss, atthe hand of a few examples, the potential and promises of observing the earth
from the vantage point of space.
Furthermore, it is intended to bring this argument, of just how good and how
useful remote sensing of the earth from space is, before an audience that
carries considerably more weight in judging this issue than the aerospacecommunity and the bureaucrats who have argued it so far. Ironically, theso-called user community, the decision makers, whom one would expect towelcome with open arms--and open minds--any advanced technique that makes
their jobs easier, more reliable and more economical, have remainedrelatively aloof of the question whether earth surveys from space are useful
or not. Many of those who should be concerned with the exploration andmanagement of mineral and water resources, with land use planning or withenvironmental protection, are generally unaware of the vast, new informationthat is available to them, virtually for the asking.
The first ERTS has by now produced more than 100, 000 multispectral images ofalmost every land mass on earth. Land forms, land use practices, and waterfeatures of every continent have been observed several times during the past two
years with accuracies that are commensurate with map scales of 1:250, 000. Withsome additional effort, thematic maps on scales of up to 1:60, 000 can be pro-duced from the satellite images. These images can be purchased at nominalcost from several federal data centers by anyone who asks for them. One ofthem is the U. S. Department of Interior, EROS Data Center, Sioux Falls,South Dakota, 57198 (Telephone 605/594-6511).
The perspective of the satellite images is such that vast areas, such asentire mountain ranges, watersheds, States and indeed entire continents canbe mapped nearly synoptically. The cost of producing these relatively largescale, thematic, synoptic maps from ERTS images is orders of magnitudesless than the cost of conventional techniques, such as aerial surveys. ERTSprovides a sequence of uniformly illuminated, essentially planimetric,
1

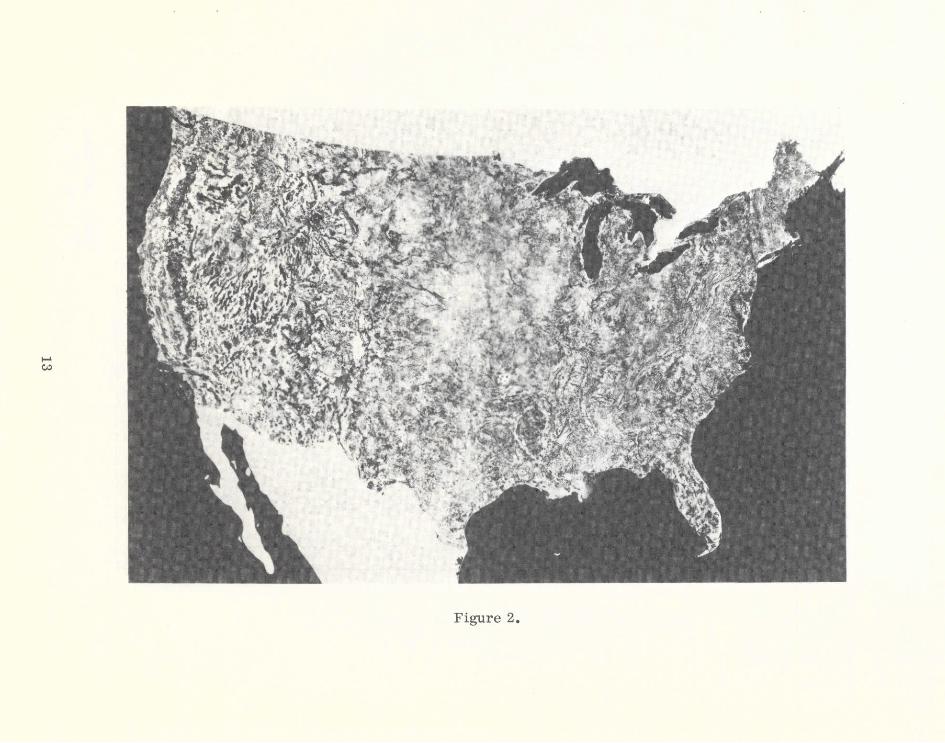
vertical views of the Earth's surface. The images can be readily joinedtogether in mosaics which are very close to being orthographic. This greatlyincreases the synoptic character of the imagery and extends the assessmentof contextual relationships to regional proportions, as is shown in Figure 1,where ERTS-1 images obtained on several consecutive satellite passes, werecombined into a mosaic of the entire state of Nevada. Such mosaicking canbe extended almost arbitrarily and the Soil Conservation Service of theU. S. Department of Agriculture has now produced a mosaic that embraces theentire continental United States (Figure 2). In its original 1:1, 000, 000 scale,this mosaic covers a display area of 24 feet (east-west) by 10 feet (north-south). Synoptic, thematic mapping of such immensely large areas hasresulted, for the first time, in a uniform photobase of the Earth's surface tointegrate physiographic or geologic provinces up to continental scales.
Surface features of North America have been observed by ERTS-1 about 10-35times on the average during the first 30 months of the satellite's life. Thefrequency of useful observations depends on cloud cover. Consistently cloud-free areas such as the Southwestern U. S. were imaged as many as 35 times,while perennially cloud-covered regions such as the Gulf Coast or the FloridaPeninsula may have been seen only 10-15 times by the satellite in that period.Such sequential observations are extremely important, especially if onewishes to determine, for example, the water runoff from diminishing snowcover in a mountainous watershed, or the position of a surging glacier whichthreatens unstable conditions in the damming of a river valley. They arealso important for the observation of seasonal and long-term coastal processeswhich cause sedimentation and erosion and have practical application to haborand shoreline maintenance, ocean waste disposal, marine pollution, andfisheries. Sequential observation of surface mining operations can provideaccurate and timely data on mined acreage and the status of land reclamationactivities.
In contrast to conventional aerial photographs, ERTS images are generatedfrom digital electronic signals which measure the intensity of sunlight in fourspectral bands, detected by a scanning telescope and an array of photo-electric detectors on-board the satellite. The four spectral bands cover thevisible green and red (0. 5 to 0.6 and 0.6 to 0. 7 p m) and two near-infraredbands (0.7 to 0.8 and 0.8 to 1.1 pm). The sensor output is telemetered fromthe satellite to ground stations, and recorded on tape. From the magnetictapes, black-and-white images are generated for each of the four spectralbands. The polychromatic or multispectral nature of the images permits theidentification or measurement of the quality and composition of water, thepotential water content of snow, the moisture and possible composition ofsoils, the types and state of vegetation cover, and factors relating to stresseson the environment. For example, water is clear, where it appears dark inall four spectral bands; it is sediment laden or contains high concentrations
2

of nutrients, where it appears bright in the short wavelengths and dark in the
long wavelengths. Vigorous vegetation appears very dark in the visible
spectrum but is almost as bright as snow in the infrared, while less vigorous
or diseased vegetation becomes brighter in the visible and darker in the
infrared. Images in the separate spectral bands can be overlaid in color
composites which display the spectral contrasts in varying shades of blue,
green and red and permit, readily, the identification and measurement of
these botanical, hydrographic, environmental or cultural features on the
earth's surface. In other more sophisticated techniques, data from the tapesare fed directly into computer-controlled displays for enhancements for
measurements of certain desired characteristics.
GEOLOGICAL ANALYSES OF ERTS IMAGES
The applications that have been derived from the ERTS-1 images are so
diversified and cover so many disciplines, that it is not possible to mention
all of them in this presentation. Therefore, only a few examples will be
discussed here; namely some illustrating the potential of land-form
observations for mineral exploration and for the assessment of geologicalhazards, and others showing the efficiency and cost effectiveness of using
thematic maps made from the satellite pictures in decisions or settlements
involving environmental protection and reclamation. Many of the other
applications, such as land-use planning and land-value assessments, cropand rangeland productivity surveys, water quality and marine resources
surveys, flood plain mapping and water run-off predictions are beyond the
scope of this presentation.
The greatest potential of ERTS images for mineral exploration rests on ourability to map synoptically the geomorphology and general geological envi-
ronment of very large areas. Two phenomena are of particular significance
in this context:
(1) linear or circular features can be identified and mapped; they can be: (a) of
tectonic origin, such as faults or fractures, which are thought to be indicative ofmineral deposits, particular, where these lineaments intersect; or (b) revealingland forms such as salt domes which might be indicative of petroleum.
(2) color tone differentiations in the images may: (a) permit the delineation of
rock types, vegetation or soil differences, each again leading to possible con-clusions regarding mineral deposits; or (b) be related to oxidation or other
chemical reactions on the surface which may imply mineralization or petroleum
deposits.
3
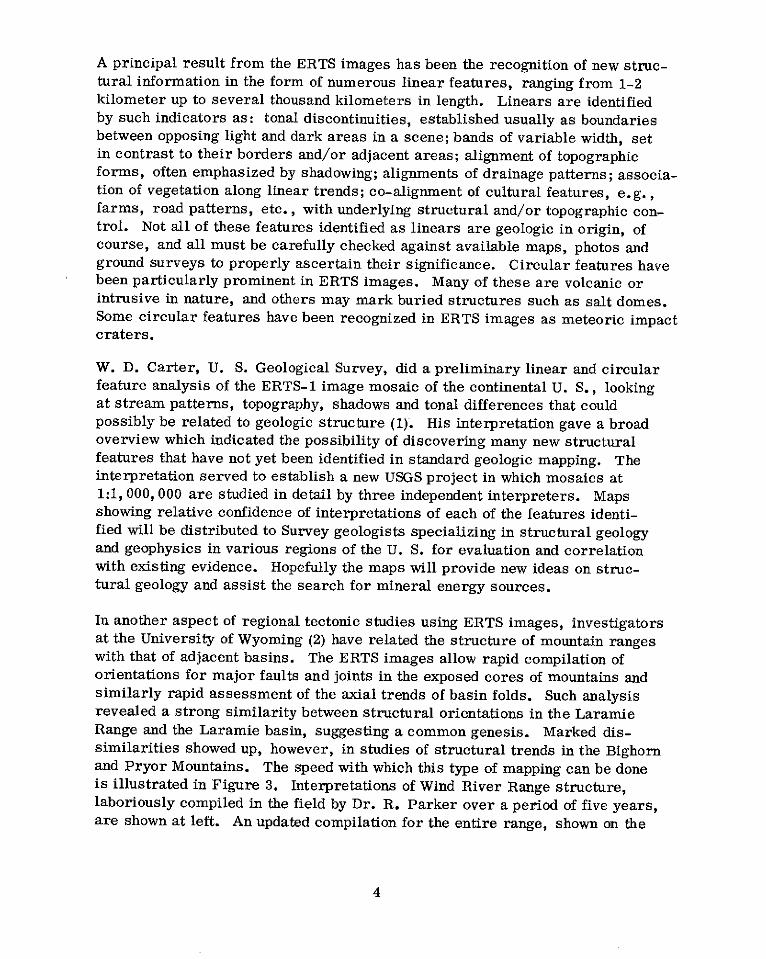
A principal result from the ERTS images has been the recognition of new struc-tural information in the form of numerous linear features, ranging from 1-2kilometer up to several thousand kilometers in length. Linears are identifiedby such indicators as: tonal discontinuities, established usually as boundariesbetween opposing light and dark areas in a scene; bands of variable width, setin contrast to their borders and/or adjacent areas; alignment of topographicforms, often emphasized by shadowing; alignments of drainage patterns; associa-tion of vegetation along linear trends; co-alignment of cultural features, e.g.,farms, road patterns, etc., with underlying structural and/or topographic con-trol. Not all of these features identified as linears are geologic in origin, ofcourse, and all must be carefully checked against available maps, photos andground surveys to properly ascertain their significance. Circular features havebeen particularly prominent in ERTS images. Many of these are volcanic orintrusive in nature, and others may mark buried structures such as salt domes.Some circular features have been recognized in ERTS images as meteoric impactcraters.
W. D. Carter, U. S. Geological Survey, did a preliminary linear and circularfeature analysis of the ERTS-1 image mosaic of the continental U. S., lookingat stream patterns, topography, shadows and tonal differences that couldpossibly be related to geologic structure (1). His interpretation gave a broadoverview which indicated the possibility of discovering many new structuralfeatures that have not yet been identified in standard geologic mapping. Theinterpretation served to establish a new USGS project in which mosaics at1:1, 000, 000 are studied in detail by three independent interpreters. Mapsshowing relative confidence of interpretations of each of the features identi-fied will be distributed to Survey geologists specializing in structural geologyand geophysics in various regions of the U. S. for evaluation and correlationwith existing evidence. Hopefully the maps will provide new ideas on struc-tural geology and assist the search for mineral energy sources.
In another aspect of regional tectonic studies using ERTS images, investigatorsat the University of Wyoming (2) have related the structure of mountain rangeswith that of adjacent basins. The ERTS images allow rapid compilation oforientations for major faults and joints in the exposed cores of mountains andsimilarly rapid assessment of the axial trends of basin folds. Such analysisrevealed a strong similarity between structural orientations in the LaramieRange and the Laramie basin, suggesting a common genesis. Marked dis-similarities showed up, however, in studies of structural trends in the Bighornand Pryor Mountains. The speed with which this type of mapping can be doneis illustrated in Figure 3. Interpretations of Wind River Range structure,laboriously compiled in the field by Dr. R. Parker over a period of five years,are shown at left. An updated compilation for the entire range, shown on the
4

right, was completed in a matter of hours. Although this map is a preliminary
evaluation, some confidence in its accuracy is afforded by evidence of frac-
turing found at several field-checked locations.
MINERAL AND PETROLEUM EXPLORATION
A study of ERTS images of northern Alaska (3), which revealed an interesting
alignment of lakes over distances of several hundreds of kilometers has led to
speculations about the extension of petroleum exploration in Northern Alaska.
Lakes in the Arctic Coastal Plain are dominantly elongate, with their long axes
parallel and trending about N 90W. This is believed to be erosion controlled.
However, an analysis of ERTS-1 imagery revealed an additional east-west-
trending alignment of lakes extending over a much larger region and not pre-
viously recognized on aerial photographs or in field studies. In addition, the
alignment of many small lakes forms ellipses superimposed on the regional lin-
eation. When combined with the sparse magnetic and gravity survey data for the
region, these lineations suggest heretofore unsuspected structures may be con-
cealed beneath the mantling Quaternary Gubik Formation and that favorable res-
ervoir beds may occur in the area. In an earlier investigation, E. Lathram (3)
of the U. S. Geological Survey verified the presence of sets of intersecting NE-
and NW-trending regional lineaments in Alaska. Based on the occurrence of
these regional fractures, Lathram suggested that mineral emplacement might
have occurred at the intersections of these fractures. The results is an alternate
hypothesis for mineral emplacement in Alaska than was previously held. This
will probably stimulate interest in exploration efforts in areas which were long
regarded as non-productive.
Duane Preble and W. D. Carter, of the U. S. Geological Survey, identified
linear and circular anomalies in the Louisiana-Mississippi area on the basis
of vegetation, stream drainage patterns and soil tones (4). Eleven small
circulars, one with a diameter of 70 kilometers, were identified near known
salt domes from which oil and gas are produced. Some of the newly found
suspected salt domes correspond to negative gravity anomalies. Others,
where such data are not available, are to be surveyed with a field gravimeter
to determine if they are worthy of more detailed exploration. The linear
features may possibly be related to subsurface faults which could serve as
control for accumulation of oil and gas.
E. Rich (5) of Stanford University and M. Abdel-Gawad (6) of North American
Rockwell Corp. and I. Bechtold of Bechtold Satellite Technology Corporation
(7) have correlated mining localities in California and Nevada with lineaments
observed in the ERTS images. Abdel-Gawad correlated mercury mining
5

localities with a newly discovered set of transverse faults in the CaliforniaCoast Ranges, Bechtold demonstrated a similar correlation between fissuresin the Lake Mead area and gold, silver and other metallic ore deposits.
Many shallow mineral deposits give rise to distinctive surface stains (gossansand blooms) caused by alteration or secondary enrichment. If broad enough,some of these stains may be detactable as color-brightness anomalies. In astudy of such color tone phenomena, A. F. H. Goetz, Jet PropulsionLaboratory, and L. C. Rowan, U. S. Geological Survey, have applied bandratio techniques to the search for iron oxides (8). Confirming from field andlaboratory spectrometer measurements that limonite has a spectral responsequite different from most other common minerals, the investigators concludedthat this response can be detected with ERTS by imaging the ratios of severalof the spectral bands rather than by displaying the bands themselves, as iscommonly done. They have analyzed an ERTS image of central Nevada thatincludes the Goldfield mining district and have found that the distinctivespectral signatures in the images correlate with those mineralized areasaround Goldfield where surface iron stains were known before. In addition,they have detected these signatures in adjacent areas where mineralizationwas not previously known. Insofar as gossans are indicators of potential min-eralization, this enhancement technique for revealing the distribution of hydrousiron oxides in ERTS images, if it bears up under further testing, now standsas a major breakthrough in mineral prospecting.
Soil coloration is also known to occur in the vicinity of petroleum depositswhere surface minerals have been chemically altered by combination withescaping hydrocarbons. To test the capability of ERTS to detect this phenom-enon, imagery of the Anadarko basin in Oklahoma was analyzed for tonaldifferences around known gas and oil producing areas (9). On one color com-posite image, 76 features were classified as geomorphic or tonal anomaliesand "hazy" areas. The "hazy" areas appear as if image detail had beensmudged or partially erased. Of these 76 anomalies, 59 correlate with pro-ducing oil and gas fields, 11 are of known but non-producing structures, andthe remaining 6 could not be correlated with known features. Further studyis underway at NASA to test the validity and applicability of the associationof these anomalies with gas and oil occurences.
GEOLOGICAL HAZARDS AND USE OF ERTS IMAGES IN CIVILCONSTRUCTION PROJECTS
Mapping of regional lineaments with ERTS images has resulted in delineatingseismic hazards not otherwise recognized. Abdel-Gawad discovered evidenceof recent movement along faults in an area of Californa that had long been
6

considered to be inactive (6). L. Gedney of the University of Alaska constructed
a mosaic of central Alaska using six ERTS images (10), which clearly revealed
the presence of new sets of lineaments that correlated well with the distribution
of shallow-focus earthquake epicenters in that region. An active leg of the Denali
fault was found to lie close to a proposed bridge site over the Yukon River, and
the proposed path of the Alaskan oil pipeline.
Dan Krinsley, of the U. S. Geological Survey, used sequential ERTS images
of the Great Kavir area in Iran to delineate seasonally wet, rough and unstable
ground. This analysis resulted in the selection of a preliminary road align-
ment that would take advantage of the best terrain and considerably shorten
the present route between northern and central Iran (11).
ENVIRONMENTAL IMPACT
The use or ERTS in the observation of the effect of man's activity on the
natural evironment is illustrated in Figure 4. The very light tones in the
center of this enlarged portion of an ERTS image (1:250, 000 scale) shows the
destruction of vegetation around a 90 square kilometer area near Ducktown,Tennessee, by copper mining operations, including fumes from the openroasting of ore and timber cutting. The light area is indicative of almost
total denudation. Parts of the area are now being reclaimed by the plantingof pine trees and grasses, and natural grasses and trees are returning in
response to control of smelter gases (12). ERTS images have also revealed
the denuding of vegetation near Wawa, Ontario, where prevailing winds
carrying sulfur dioxide fumes from a local sintering plant have caused vege-tation damage similar to that around Ducktown (13). ERTS images have per-
mitted the delineation and measurement of the degree of vegetation damage
in a most economical, rapid and objective manner.
In the Chicago-Gary area, particulate plumes from steel mills observed in
the ERTS images have been traced across Lake Michigan during the
1972/73 winter season (14). The plumes, carrying condensation nuclei,were observed to trigger dense stratus cloud cover which resulted in snowfall
200km downwind on the western shore of Michigan.
The extent of coal strip mining and the progress of reclamation is beingmonitored in western Maryland by NASA scientists (15). Acreage figures
are being compiled for seven land use classes, ranging from stripped earth
to fully reclaimed land. This monitoring technique provides more accurate
and complete data than are available from conventional surveys, since data
collected by State agencies cover only post-1967 mining activity and do not
7

include areas of backfilling and contouring around the boundaries of the mines.Sequential ERTS coverage provides timely and complete status reports onreclamation of the mined areas.
CONCLUSION
A vast data base has been accumulated with the first ERTS. This data base hasbarely been tapped and is ready to be exploited. Early research investigationssponsored by NASA and other Government agencies have demonstrated the valid-ity and utility of this data base to the dynamic inventoring of the world's waterand food resources, to the more efficient exploration of mineral, and possiblyfuel resources, to the planning of land use and civil projects, and to the quanti-tative assessment of the environmental impact of many of our activities. Theultimate users of this data base, who stand to benefit most from this investmentmade by the Government, however, have not yet warmed up to this new tech-nique of earth surveys, leave alone, having taken full advantage of its potential.
Although NASA will launch a second ERTS in January 1975, there will not bea continuation of this program after the second satellite, unless there is areal demand to use this data base by those concerned with exploration, hazardassessment and environmental impact prediction. If this demand does notmaterialize, the paradoxical situation might arise that in a few years whenthe users will begin to realize the value of this methodology and will get usedto the continuing and practically free data flow, the Government will havecancelled the program for lack of interest.
8

REFERENCES
1. Carter, W. D., personal communication, work in progress.
2. Houston, R. S., R. W. Marrs, R. M. Breckenridge, and D. L.
Blackstone, Application of the ERTS system to the study of Wyoming
resources with emphasis on the use of basic data products, Proc. of
3rd ERTS-1 Symposium, NASA SP-351, pp. 595-619, Dec. 10-14,
1973.
3. Lathram, E. H., I. L. Tailleur, W. W. Patton, Jr., and W. A.
Fischer, Preliminary geologic application of ERTS-1 imagery in
Alaska, Proc. of Symp. on Significant Results Obtained from ERTS-1,
NASA SP-327, pp. 257-264, Mar. 5-9, 1973.
4. Carter, W. D., personal communication, work in progress.
5. Rich, E. I., Relation of ERTS-1 detected geologic structure to known
economic ore deposits, Proc. of Symp. on Significant Results Obtained
from ERTS-1, NASA SP-327, pp. 395-399, March 5-9, 1973.
6. Abdel-Gawad, M., and J. Silverstein, ERTS applications in earthquake
research and mineral exploration in California, Proc. of Symp. on
Significant Results Obtained from ERTS-1, pp. 433-449, Mar. 5-9,1973.
7. Bechtold, I. D., M. A. Liggett and J. F. Childs, Regional tectonic con-
trol of Tertiary mineralization and recent faulting in the southern Basin-
Range province, an application of ERTS-1 data, Proc. of Symp. on
Significant Results Obtained from ERTS-1, pp. 425-432, Mar. 5-9,
1973.
8. Rowan, L. C., P. H. Wetlaufer, A. F. H. Goetz, F. C. Billingsley
and J. H. Stewart, Discrimination of rock types and detection of hydro-
thermally altered areas in south-central Nevada by the use of computer-
enhanced ERTS images, U. S. Geol. Surv. Prof. Paper 883, 1974.
9. Collins, R. J., F. P. McCown, L. P. Stonis, G. Petzel and J. Everett,An Evalaution of the suitability of ERTS data for the purposes of petroleum
exploration, Proc. of 3rd ERTS-1 Symposium, NASA SP-351, pp. 809-821,
Dec. 10-14, 1973.
9
10. Gedney, L. D. and J. D. VanWormer, Some aspects of active tectonismin Alaska as seen on ERTS-1 imagery, Proc. of Symp. on SignificantResults Obtained from ERTS-1, NASA SP-327, pp. 451-455, Mar. 5-9,1973.
11. Krinsley, D. G., Preliminary road alignment through the Great Kavirin Iran by repetitive ERTS-1 coverage, Proc. of 3rd ERTS-1 Symposium,NASA SP-351, p. 823, Dec. 10-14, 1973.
12. McGee, M., Geology and ore deposits of the Ducktown district, Tennessee,Ore Deposits of the United States, 1933-1967, Am. Inst. Mining, Metal-lurgical and Petroleum Engineers, 1968.
13. Murtha, P. A., So 2 damage to forests recorded by ERTS-1, Proc. of3rd ERTS-1 Symposium, NASA SP-351, pp. 137-143, Dec. 10-14, 1973.
14. Lyons, W. A., ERTS-1 views the Great Lakes, Proc. of Symp. on Sig-nificant Results Obtained from ERTS-1, NASA SP-327, pp. 847-854, Mar.5-9, 1973.
15. Anderson, A. T. and J. Schubert, A demonstration of ERTS-1 analogand digital techniques applied to strip mining in Maryland and WestVirginia, NASA Document X-923-74-313, Goddard Space Flight Center,Nov. 1974.
10

FIGURES
Figure 1. Photo Mosaic of the State of Nevada
Figure 2. United States Photo Mosaic of the 48 Contiguous States
Figure 3. Structure Map of Wind River Range, Wyoming
Figure 4. Vegetation Destruction - Ducktown, Tennessee
11

fIIi
aHsi
I
i
I
i
a
r
16
IrI
1Id
a
ara
I
I
,
r
;::: :::~i~::
r :~~i:~:: ~i::i:i:: :i::i: :i::i: i::ii:ii:::~:::~:::~ ha:
~bt'*~b: ~:*~
*~~t~ ancr:I :::::::: : " :i:~ "~s"
''"
I nor,~:~idIIr
Figure i.
iri ORIGINAL PAGE: ISIi OF POOR QUALPTY;
r 12I
rre
:r4V;~ o
, k5.
-4.-
Fiur 2

Oub5e Du.boisU U
mies 0 20mles
\k , -04in
rUI.TS S[WA ZOS A--mlrfi City FAULTS, SHEAR ZONEES IKES tk Qcy
DIADASE DIWS -V I AND OTHER LINEARS
1L a 11,mi , H 8 PaRNER. 1972
Mapped Prior to ERTS-1 Observed by ERTS-1
Figure 3.
Lade

ORIGINAL PAGt: kOF POOR QUALITY
Figure 4