复件 supporting information SC-EDG-12-2013-053334.R2 · 1 Supporting Information Fabrication of...
15
1 Supporting Information Fabrication of High-performance Facilitated Transport Membranes for CO 2 Separation Jiayou Liao, Zhi Wang*, Chengyun Gao, Shichun Li, Zhihua Qiao, Ming Wang, Song Zhao, Xianmei Xie, Jixiao Wang, and Shichang Wang 1 Thermogravimetry-mass spectrometry (TG-MS) and N 2 adsorption-desorption Characterization of hydrotalcite (HT) and layerd double oxide(LDO) Figure S1. TG-MS spectra of (a) HT; (b) LDO. Figure S1(a) presents the TG-MS diagrams for HT. The TG profile indicates two major weight losses. The first at about 460K ascribes to interlayer water loss (m/z=18); the second at about 653K corresponds to the loss of water from the decomposition of OH groups in the host layers and the removing CO 2 from decomposition of interlayer carbonate anions (m/z=44) 1-3 . At the same time, the TG profile also shows a small weight loss below 400K, which attributes to adsorption of water in the environment for the sample. In the TG-MS curves of LDO (Figure S1 (b)), gradual weight loss is also observed with increasing temperature. The weight loss around 346K is assigned to the loss of water, which was adsorbed by LDO from the environment. It is worthwhile to note that an amount of CO 2 was released around 513K. The reason is that the LDO was obtained from calcined HT in the air without any protective gas, which leads Electronic Supplementary Material (ESI) for Chemical Science. This journal is © The Royal Society of Chemistry 2014
Transcript of 复件 supporting information SC-EDG-12-2013-053334.R2 · 1 Supporting Information Fabrication of...

1
Supporting Information
Fabrication of High-performance Facilitated Transport Membranes for
CO2 Separation
Jiayou Liao, Zhi Wang*, Chengyun Gao, Shichun Li, Zhihua Qiao, Ming Wang, Song Zhao,
Xianmei Xie, Jixiao Wang, and Shichang Wang
1 Thermogravimetry-mass spectrometry (TG-MS) and N2 adsorption-desorption
Characterization of hydrotalcite (HT) and layerd double oxide(LDO)
Figure S1. TG-MS spectra of (a) HT; (b) LDO.
Figure S1(a) presents the TG-MS diagrams for HT. The TG profile indicates two major weight losses.
The first at about 460K ascribes to interlayer water loss (m/z=18); the second at about 653K corresponds
to the loss of water from the decomposition of OH groups in the host layers and the removing CO2 from
decomposition of interlayer carbonate anions (m/z=44)1-3. At the same time, the TG profile also shows a
small weight loss below 400K, which attributes to adsorption of water in the environment for the sample.
In the TG-MS curves of LDO (Figure S1 (b)), gradual weight loss is also observed with increasing
temperature. The weight loss around 346K is assigned to the loss of water, which was adsorbed by LDO
from the environment. It is worthwhile to note that an amount of CO2 was released around 513K. The
reason is that the LDO was obtained from calcined HT in the air without any protective gas, which leads
Electronic Supplementary Material (ESI) for Chemical Science.This journal is © The Royal Society of Chemistry 2014

2
to the adsorption of CO2 from the environment for LDO. And the adsorption of CO2 creates necessary
conditions for LDO to reconstruct HT in PEIE solution. Concurrently, the N2 adsorption-desorption
analysis shows that LDO has larger BET surface area and pore volume than HT (Table S1), which means
that LDO is more loose and porous.
Table S1. BET surface area and porosity characteristics of HT and LDO obtained from N2 adsorption-desorption data
2 Chemical structure analysis of PEIE-HT Complex
(1) ATR-FTIR analysis
The ATR- FTIR spectra of the hydrotalcite(HT) is shown in Figure S2(a). An intense and broad peak
at 3426cm-1 is ascribed to the stretching vibration of hydroxyl groups of HT host layer layers and
interlayer water molecules4-6. A band is also observed at 1366cm-1 and this feature has been attributed to
the vibrational absorption of interlayer CO32- 7. At the same time, the absorption bands around 600-
900cm-1 is assigned to M-O (M=Mg,Al)8. The result shows that the sample has the typical brucite-like
layer of hydrotalcite and the presence of mobile anions and water in the interlayer. The ATR-FTIR
spectrum of the PEIE is shown in Figure S2 (b). The broad absorption bands around 3268cm-1 and
3426cm-1 are assigned to amino-group and hydroxyl, respectively9-11, whereas the presence of the alkyl
stretch at 2922cm-1 and 2843cm-1 indicates that the alkyl chain are attached to the amino-group and
hydroxyl12, 13. The absorption bands of the N-H and C-H are 1555 cm-1 and 1461 cm-1 respectively14. The
peaks at 1406cm-1, 1296cm-1are assigned to the OH deformation vibration, while the peaks at 1100cm-1,
1050cm-1 are attributed to the stretching of C-O10, 15, 16. The result indicates that the polymer has a
derivative structure of polyethyleinimine (PEI) and contains a certain amount of hydroxyl group. The
Figure S2 (c) is the ATR-FTIR spectrum of PEIE-HT complex. It shows that the characteristics
absorption peak of HT was observed in PEIE-HT complex: the interlayer carbonate ions (CO32-)
characteristic absorption peak at 1366cm-1, the stretching vibrations peak of OH on host layer around
3426cm-1 and the absorption bands of M-OH(M=Mg, Al) around 600-900cm-1, which indicate that the
HT reconstructed in PEIE solution successfully. Moreover, the absorption bands of the PEIE were
appeared in PEIE-HT complex too. But the absorption bands at 1406cm-1 and 1296cm-1, which are
assigned to the deformation vibration of OH on the PEIE alkyl stretch, become weak, because the
hydroxyl groups of the PEIE were consumed partly with the occurrence of the coupling reaction. Besides,
the a new peak at 1265cm-1 is attributed to the stretching of Si-C17-20. The absorption bands around
1100cm-1 are assigned to the C-O-Si and C-O stretching vibrations, and the absorption bands around
sample BET surface area (m2g-1) Pore volume (cm3g-1)
HT LDO
82.8040 247.5685
0.6725 0.9092

3
1050cm-1 are assigned to the Si-O-M(Mg, Al) 20-22 and C-O. The results showed that the PEIE and HT
were coupled successfully by using the APTES as the molecular bridge.
Figure S2. ATR-FTIR spectra of (a) HT; (b) PEIE; (c) PEIE-HT complex.
(2) XPS analysis
As illustrated in Figure S3, C1s spectra of the PEIE-HT complex show peaks at 282.8, 284.6,285.7,
286.5 and 288.3eV which correspond to C-Si ,C-C/C-H, C-N, C-O-Si/ C-O-H and CO32-, respectively23-30.
The Si2p orbital consists of Si- C,Si-O-Mg, and Si-O-C groups that occur at normalized binding
energies of 100.8eV, 101.6eV, and 102.5eV, respectively24, 31-36. Figure S3(c) shows that Mg2p spectra
have peaks at 49.3 eV and 48.4 eV which correspond to Mg-O-H group and Mg-O-Si group,
respectively29, 37, 38. In Figure S3(d), the narrow scan of Al2p region shows a peak at 73.8eV
corresponding to Al-O-H of LDHs group and a peak at 73.1 eV corresponding to Al-O-Si group38-40. The
XPS analysis indicate that the PEIE-HT complex contains both C-O-Si groups and M (Mg,Al)-O-Si
groups. The results show that the silane coupling agent (APTES) played the role of the molecular bridge
between the PEIE and the HT through reacting with the hydroxyl groups on the polymers and HT host
layers.

4

5
Figure S3. XPS spectra of the PEIE-HT complex: (a) C1s spectra; (b) Si2p spectra; (c) Mg2p spectra; (d) Al2p spectra.
(3) TEM and STEM-EDS analysis
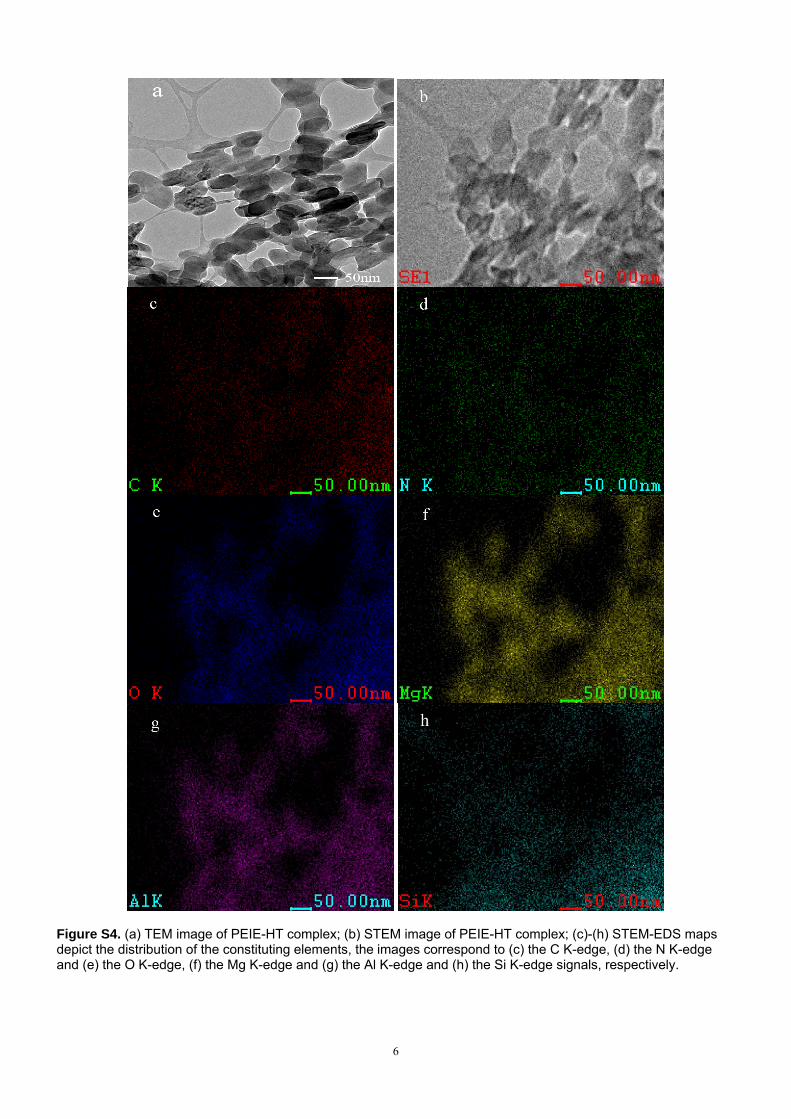
Figure S4(a) and Figure S4(b) are the TEM and STEM image of PEIE-HT complex, respectively. It
can be seen that the reconstructed hydrotalcites are well dispersed in the polymer. And the C, O, N, Mg,
Al and Si were detected by EDS. The STEM-EDS mapping (Figure S4 c-h) showed that Mg and Al were
uniformly distributed in the C, O and N. Besides, the Si element showed a good match between other
elements. The result indicated that this is a well dispersed system, and the PEIE and HT were coupled by
the silane coupling agent(APTES).
6
Figure S4. (a) TEM image of PEIE-HT complex; (b) STEM image of PEIE-HT complex; (c)-(h) STEM-EDS maps depict the distribution of the constituting elements, the images correspond to (c) the C K-edge, (d) the N K-edge and (e) the O K-edge, (f) the Mg K-edge and (g) the Al K-edge and (h) the Si K-edge signals, respectively.

7
(4) XRD analysis
The characteristic peaks of hydrotalcite (2θ=11.35°, 23.23°, 34.54°, 39.30°,46.82°,60.65° and 62.22°),
corresponding to Miller indices (003), (006), (009), (015), (018), (110)and(113), were observed in Figure
S5(a)8, 41. It demonstrate that the well-crystallized HT has been synthetised in this paper. After calcination,
a series of peaks corresponding to HT are replaced by characteristic patterns of LDO (2θ =43.3° and
63.1°)7, which were displayed in Figure S5(b). Moreover, the XRD patterns of PEIE presenced in a broad
diffraction peak at 2θ=15-35° (Figure S5(c)). Compared with single substance, the XRD pattern of PEIE-
HT complex contain the characteristic peaks of HT and the reflections of PEIE polymer, while the
characteristic reflections of LDO at the 2 θ =43.3° and 63.1° were not appeared in the PEIE-HT complex.
The results showed that the HT reconstructed successfully by using the LDO as raw material. It is
worthwhile to note that the peaks of reconstructed HT in the PEIE is much lower than the peaks of the
original HT (Figure S5(d)). This indicate that the superposition between layers of the reconstructed HT is
reduces compared with the original HT. This also proved that the layer of the HT can be exfoliated and
scattered by this method42, 43. Simultaneously, it is easy to find that the diffraction band (2θ=15-35°) of
PEIE in the complexes is lower than the peaks of original polymer at the corresponding location. This
result indicates that the regular structure of polymer and HT was disrupted simultaneously by
interpenetrating each other, and their crystallinity reduced.
Figure S5. XRD patterns of (a) HT; (b) LDO; (c) PEIE; (d) PEIE-HT complex.

8
3 Performance comparison of membrane Table S2. Performance comparison of the membrane obtained in this work
with other the state-of-the-art membranes NO. Membrane RCO2
(GPU)CO2/N2
selectivityTemperature
(K) Membrane
type Ref.
a b c d e f g h i j k l
m
PEO-PBT(PAN-PMS) PolarisTM
PolarisTM
Glycine-Na-Glycerol Glycine-Na PVBTAF
PE-AA- ethylenediamine PVAm/PVA PVAm/PPO
DNMDAm-DGBAmE-TMC/PDMS (DAmBS–DGBAmE–TMC)/PDMS
PVAm-PIP/PS PEIE-HT
896 1000 2200 207 648 11.3 100 212 365
1601 5831 6500 5693
55 50 50
2090 5140 983 4700 174 60
138 86
277 268
293 300.15 298.15
296.15±2
298.15 296
—
298.15 298.15 295.15 298.15 295.15 298.15
CPM CPM CPM SLM SLM IEM IEM FCM FCM FCM FCM FCM FCM
44 45 46 47 48 49 50 51 52
53 54 55
This work
CPM: common polymeric membrane; SLM: supporting liquid membrane; IEM: ion-exchange membrane; FCM: fixed carrier
membrane;
Figure S6. The effects of content of LDO (precursor of HT) on the performance of PEIE-HT membrane. Wet coating thickness: 50μm; Feed gas: 15vol% CO2 and 85vol% N2; 298.15K; Pressure: 0.2 Mpa.

9
Figure S7. Performance comparison of PVAm-HT membrane and PVAm membrane (a) CO2 permeance; (b) CO2/N2 selectivity. Wet coating thickness: 50μm; Feed gas: 15vol% CO2 and 85vol% N2; 298.15K.
Figure S8. Performance comparison of the PEIE-HT membrane, PEIE-ZnAl- CO3
2--HTLcs membrane, PEIE-NiAl-CO3
2--HTLcs membrane and PEIE membrane. Wet coating thickness: 50μm; Feed gas: 15vol% CO2 and 85vol% N2; 298.15K; Pressure: 0.11 Mpa.

10
4 Stability of the PEIE-HT membrane in simulated flue gas
Figure S9. Separation performance stability at 0.11MPa and 1.5MPa. (a) Separation performance stability at 0.11MPa; (b) Separation performance stability at 1.5MPa. Wet coating thickness: 50μm; Feed gas: 15vol% CO2 and 85vol% N2; 298.15K.
Figure S10. The effects of temperature on the performance of PEIE-HT membrane. Wet coating thickness: 50μm; Feed gas: 15vol% CO2 and 85vol% N2; Pressure: 0.2 Mpa.
Figure S11. PEIE-HT membrane tested by using CO2/N2 mixed gas (15vol% CO2 and 85vol% N2) and simulated flue gas(14.5vol% CO2, 6.5vol% O2, 40ppm SO2, 70ppm NO2, 10ppm CO, balanced by N2). (a) CO2 permeance; (b) CO2/N2 selectivity. Wet coating thickness: 50μm; 298.15K; Pressure: 0.2 MPa.

11
Figure S12. ATR-FTIR spectra of (a) polysulfone ultrafiltration membrane; (b) original PEIE-HT membrane
; (c) PEIE-HT membrane after being tested in simulated flue gas.
Table S3 (a). The surface elemental analysis for original PEIE-HT membrane.
Element C1s N1s O1s Mg2p Al2p Si2p S2p
Relative atomic ratio
(atm.%) 48.85 13.59 26.73 6.86 2.81 1.03 0.13
Binding energy(eV) 284.80 398.36 531.08 49.45 73.73 101.27 168.21
Table S3 (b). The surface elemental analysis for PEIE-HT membrane after being tested in simulated flue gas.
Element C1s N1s O1s Mg2p Al2p Si2p S2p
Relative atomic ratio
(atm.%) 49.17 15.31 24.27 7.56 2.61 0.92 0.16
Binding energy(eV) 284.80 398.36 530.89 49.21 73.69 101.62 168.02
5 Experimental
Synthesis of PEIE: Polyethyleinimine and epichlorohydrin copolymer (PEIE) was synthesized via
block polymerization. In a 100ml round bottom flask equipped with a mechanical agitator, a constant
pressure dropping funnel and a reflux condenser, 20g 10% PEI was charged. Under the protection of
nitrogen, 0.14g epichlorohydrin was dropped into the flask with 4~6 drops/min at 308.15K controlled by
water bath while stirring. After dropping, keep at 308.15K for 1h and then heat to 328.15K for 24h. Then,
a certain amount of deionized water was added and a colorless, transparent viscous solution was obtained.
The polymer solution was mixed with anion exchange resin(Amberlite 717) and was further stirred for 2h.
Finally, the PEIE aqueous solution was obtained by vacuum filtration of the mixture.

12
Synthesis of HT and LDO:The synthesis of HT was carried out in a three-neck flask equipped with a
reflux condenser. In a typical procedure, 0.09mol Mg(NO3)2·6H2O and 0.03mol Al(NO3)3·9H2O were
dissolved in 100ml mixed solution (H2O/ethanol=80/20, by volume) . Then, the mixed basic
solution(contain 2M NaOH and 1M Na2CO3) was dropped into the flask with stirring until the pH value
equal to 10. The slurry thus obtained was stirred for an additional 30 min, and then was put into a
stainless steel reactor, and was hydrothermally treated at 393.15K for 24h. The resulting white, solid
product was filtered, washed with deionized water and absolute ethanol several times, and finally dried
under vacuum at 353.17K for 24h. The LDO was obtained by calcined HT in air atmosphere at 673.15K
for 5h.
Preparation of PEIE-HT complex and PEIE-HT membrane: 1.0wt% LDO was mixed in 1.5wt%
PEIE solution with intensely stirring to distribute the particles uniformly. It was stirring continually for 5
day to reconstruct HT, afterwards 0.1wt% APTES was added and reacted at 353.15K for 2h and the
PEIE-HT complex was obtained. The PEIE-HT membrane was prepared by casting the PEIE-HT
complex solution on porous polysulfone ultrafiltration membrane under 303.15K and 40% relative
humidity, and then dried at the same condition over night.
Gas permeation measurements: The gas permselectivity of membranes was characterized at
298.15K by a homemade apparatus with humidifier detailed in literature54. The membrane was mounted
in a circular stainless steel cell (effective membrane area=19.26cm2). Both the feed gas and the sweep gas
(H2) were saturated with water. The flow of outlet sweep gas was measured using a soap film meter and
its composition was analyzed by a gas chromatograph equipped with athermal conductivity detector
(HP7890, Porapak N). It has been proved that the effect of both back-diffusion of H2 and concentration
polarization on data analysis could be neglected54, 55.
6 Characterization techniques in the experiment
To characterize the structure of PEIE-HT complex, the PEIE-HT complex solution was coated on the
polytetrafluoroethene substrate, then drying at 303.15K and 40% relative humidity in an artificial climate
chamber (Climacell 222R, Germany) for 24 hours, finally, the PEIE-HT complex film was peeled from
the polytetrafluoroethene substrate. This film was used as the test sample of TG-MS, N2 adsorption-
desorption ATR-FTIR, XPS, and XRD. And the PEIE-HT complex solution was used to fabricate TEM,
STEM-EDS sample.
The TG of each sample and the MS profile of the evolved gaseous water (m/z =18) and carbon dioxide
(m/z =44) were collected by means of NETZSCH Simultaneous TG-DTA/DSC (Apparatus STA
449C/4/G Jupiter-QMS 403C Aeolos) in N2 atmosphere at a ramping rate of 2K/min from 300.15K to
973.15 K. For each measurement, about 50-60 mg of dried sample was used. The N2 adsorption-
desorption experiments were measured with a Micromeritics ASAP 2010 automatic analyzer.

13
Attenuated total reflectance infrared (ATR-FTIR) spectroscopy (FTS-6000, Bio-Rad of USA) was
used to study the chemical structure of sample. The chemical characterization of sample was further
accomplished by X-ray photoelectron spectroscopy (XPS, PHI-1600). XPS analysis was performed using
Mg Kα as the radiation source and the spectra were taken with the electron emission angle at 45º. X-ray
diffraction (XRD) patterns were recorded on Rigaku D/max-2500 (40 kV, 100 mA) using Cu Kα
radiation at a scanning rate of 2θ = 10º /min, in the scanning range of 5º −85º.
Both TEM and STEM studies were performed using a JEOL JEM-2100F field emission transmission
electron microscope equipped with an ultra high resolution pole-piece operating at 200 kV. Energy
dispersive X-ray spectrometer (EDS) attached to the JEM-2100F microscope was used to determine the
elemental composition of the samples. TEM specimens were prepared by placing microdrops of PEIE-HT
complex solution directly onto a copper grid coated with carbon film (300 mesh, EMS).
Scanning electron microscopy (SEM) images of the surface and the cross-section for the PEIE-HT/PS
composite membranes were obtained on Nova NanoSEM 430 (FEI, USA). For the cross-section
observation, the membrane samples were prepared by peeling away the polyester backing fabric, then
frozen in liquid nitrogen and fractured. All membrane samples were coated with gold by a sputter-coating
machine.
References
1. H. A. Prescott, Z.-J. Li, E. Kemnitz, A. Trunschke, J. Deutsch, H. Lieske and A. Auroux, J. Catal., 2005, 234, 119-
130.
2. K. Teramura, S. Iguchi, Y. Mizuno, T. Shishido and T. Tanaka, Angew. Chem., 2012, 124, 8132-8135.
3. J. Zhang, Y. F. Xu, G. Qian, Z. P. Xu, C. Chen and Q. Liu, J. Phys. Chem. C, 2010, 114, 10768-10774.
4. B. M. Choudary, M. L. Kantam, A. Rahman, C. V. Reddy and K. K. Rao, Angew. Chem., 2001, 113, 785-788.
5. H. Fei, M. R. Bresler and S. R. J. Oliver, J. Am. Chem. Soc., 2011, 133, 11110-11113.
6. P. J. Sideris, U. G. Nielsen, Z. Gan and C. P. Grey, Science, 2008, 321, 113-117.
7. F. Millange, R. I. Walton and D. O'Hare, J. Mater.Chem., 2000, 10, 1713-1720.
8. M. Ogawa and H. Kaiho, Langmuir, 2002, 18, 4240-4242.
9. T. R. Boussie, G. M. Diamond, C. Goh, K. A. Hall, A. M. LaPointe, M. K. Leclerc, V. Murphy, J. A. W. Shoemaker,
H. Turner, R. K. Rosen, J. C. Stevens, F. Alfano, V. Busico, R. Cipullo and G. Talarico, Angew. Chem. Int.Ed., 2006,
45, 3278-3283.
10. S. Suganuma, K. Nakajima, M. Kitano, D. Yamaguchi, H. Kato, S. Hayashi and M. Hara, J. Am. Chem. Soc., 2008,
130, 12787-12793.
11. Y. Zhong, F. Peng, X. Wei, Y. Zhou, J. Wang, X. Jiang, Y. Su, S. Su, S.-T. Lee and Y. He, Angew. Chem. Int. Ed.,
2012, 51, 8485-8489.
12. M. de Loos, J. van Esch, R. M. Kellogg and B. L. Feringa, Angew. Chem., 2001, 113, 633-636.
13. B. M. Choudary, M. L. Kantam, A. Rahman, C. V. Reddy and K. K. Rao, Angew. Chem. Int. Ed., 2001, 40, 763-766.
14. A. Corma, P. Concepción and P. Serna, Angew. Chem., 2007, 119, 7404-7407.
15. N. A. Dhas, A. Zaban and A. Gedanken, Chem. Mater., 1999, 11, 806-813.

14
16. Ö. Çelik and Ö. Dag, Angew. Chem. 2001, 113, 3915-3919.
17. E. Finocchio, G. Garuti, M. Baldi and G. Busca, Chemosphere, 2008, 72, 1659-1663.
18. N. Hering, K. Schreiber, R. Riedel, O. Lichtenberger and J. Woltersdorf, Appl. Organomet. Chem., 2001, 15, 879-886.
19. J. Jeong, M. Cho, Y. T. Lim, N. W. Song and B. H. Chung, Angew. Chem. Int. Ed., 2009, 48, 5296-5299.
20. A. J. Patil, E. Muthusamy, A. M. Seddon and S. Mann, Adv. Mater., 2003, 15, 1816-1819.
21. T. Sugama, R. Sabatini and L. Petrakis, Ind. Eng. Chem. Res., 1998, 37, 79-88.
22. F. Wypych, W. H. Schreiner, N. Mattoso, D. H. Mosca, R. Marangoni and C. A. da S. Bento, J. Mater. Chem., 2003,
13, 304-307.
23. T. Cha, A. Guo, Y. Jun, D. Pei and X.-Y. Zhu, PROTEOMICS, 2004, 4, 2823-2823.
24. G. G. Condorelli, A. Motta, M. Favazza, I. L. Fragalà, M. Busi, E. Menozzi, E. Dalcanale and L. Cristofolini,
Langmuir, 2006, 22, 11126-11133.
25. H. J. Martin, K. H. Schulz, J. D. Bumgardner and K. B. Walters, Langmuir, 2007, 23, 6645-6651.
26. Z. Qian, Z. Zhang, L. Song and H. Liu, J. Mater. Chem., 2009, 19, 1297-1304.
27. M.-R. Choi, T.-H. Han, K.-G. Lim, S.-H. Woo, D. H. Huh and T.-W. Lee, Angew. Chem., 2011, 123, 6398-6401.
28. L. Li and H. Yokoyama, Angew. Chem., 2006, 118, 6486-6489.
29. H. Nakano, T. Mitsuoka, M. Harada, K. Horibuchi, H. Nozaki, N. Takahashi, T. Nonaka, Y. Seno and H. Nakamura,
Angew. Chem. Int. Ed., 2006, 45, 6303-6306.
30. Y. Vaynzof, T. J. K. Brenner, D. Kabra, H. Sirringhaus and R. H. Friend, Adv. Funct. Mater., 2012, 22, 2418-2424.
31. B. D. Freeman, NOVEL NANOCOMPOSITE MEMBRANE STRUCTURES FOR H2 SEPARATIONS, 2005.
32. N. Maxim, P. C. M. M. Magusin, P. J. Kooyman, J. H. M. C. van Wolput, R. A. van Santen and H. C. L. Abbenhuis,
Chem. Mater., 2001, 13, 2958-2964.
33. H. Nakayama and T. Hata, Thin Solid Films, 2006, 501, 190-194.
34. F. Thieblemont, O. Seitz, A. Vilan, H. Cohen, E. Salomon, A. Kahn and D. Cahen, Adv. Mater., 2008, 20, 3931-3936.
35. R. Voicu, R. Boukherroub, V. Bartzoka, T. Ward, J. T. C. Wojtyk and D. D. M. Wayner, Langmuir, 2004, 20, 11713-
11720.
36. Y. Yang, G. Meng, X. Liu and L. Zhang, Angew. Chem., 2008, 120, 371-373.
37. H. Y. Kim, H. M. Lee and J.-N. Park, J. Phys. Chem. C, 2010, 114, 7128-7131.
38. L. Ukrainczyk, R. A. Bellman and A. B. Anderson, J. Phys. Chem. B, 1997, 101, 531-539.
39. J. A. Boscoboinik, X. Yu, B. Yang, F. D. Fischer, R. Włodarczyk, M. Sierka, S. Shaikhutdinov, J. Sauer and H.-J.
Freund, Angew. Chem. Int. Ed., 2012, 51, 6005-6008.
40. X. Zhang, G. Zhuang, J. Chen, Y. Wang, X. Wang, Z. An and P. Zhang, J. Phys. Chem. B, 2006, 110, 12588-12596.
41. R. k. Allada, A. Navrotsky, H. T. Berbeco and W. H. Casey, Science, 2002, 296, 721-723.
42. G. S. Attard, J. M. Corker, C. G. Göltner, S. Henke and R. H. Templer, Angew. Chem. Int. Ed. in English, 1997, 36,
1315-1317.
43. E. Kockrick, P. Krawiec, W. Schnelle, D. Geiger, F. M. Schappacher, R. Pöttgen and S. Kaskel, Adv. Mater., 2007, 19,
3021-3026.
44. Y. Wilfredo, C. Anja, W. Jan and P. Klaus-Viktor, Nanotechnology, 2010, 21, 395301.
45. T. C. Merkel, H. Lin, X. Wei and R. Baker, J. Membr. Sci., 2010, 359, 126-139.
46. T. C. Merkel, X. Wei, Z. He, L. S. White, J. G. Wijmans and R. W. Baker, Ind. Eng. Chem. Res., 2012, 52, 1150-1159.
47. H. Chen, A. S. Kovvali and K. K. Sirkar, Ind. Eng. Chem.Res., 2000, 39, 2447-2458.
48. H. C. A. S. Kovvali, G. Obuskovic, S. Majumdar, A. K. Sirkar, Abs. Pap. Am. Chem. Soc., 2000, 220, U392-U392.
49. R. Quinn and D. V. Laciak, J. Membr. Sci., 1997, 131, 49-60.

15
50. H. Matsuyama, M. Teramoto and K. Iwai, J. Membr. Sci., 1994, 93, 237-244.
51. L. Deng, T.-J. Kim and M.-B. Hägg, J. Membr. Sci., 2009, 340, 154-163.
52. M. Sandru, S. H. Haukebø and M.-B. Hägg, J. Membr. Sci., 2010, 346, 172-186.
53. S. Li, Z. Wang, X. Yu, J. Wang and S. Wang, Adv. Mater., 2012, 24, 3196-3200.
54. M. Wang, Z. Wang, S. Li, C. Zhang, J. Wang and S. Wang, Energy Environ.l Sci., 2013.
55. Z. Qiao, Z. Wang, C. Zhang, S. Yuan, Y. Zhu, J. Wang and S. Wang, AIChE J., 2013, 59, 215-228.