í^»/ Soybean Industry J
56
\í^»/ United States fi ^ Department of Agriculture Economic Research Service Agricultural Economic Report Number 588 The U.S. Soybean Industry J James Schaub W.C. McArthur Duane Hacklander Joseph Glauber Mack Leath Harry Doty Î V-*'^ I #s . ::3. - 4Í
Transcript of í^»/ Soybean Industry J

\í^»/
United States fi ^ Department of Agriculture
Economic Research Service
Agricultural Economic Report Number 588
The U.S. Soybean Industry J James Schaub W.C. McArthur Duane Hacklander Joseph Glauber Mack Leath Harry Doty
Î V-*'^
I #s
.■::3.
-■4Í

Additional copies of this report . . .
can be purchased from the Superintendent of Documents, U.S. Government Printing Office, Washington, DC 20402. Ask for The U.S. Soybean Industry (AER-588). Write to the above address for price and ordering instructions. For faster service, call the GPO order desk at 202-783-3238 and charge your purchase to your Visa, MasterCard, or GPO Deposit Account. A 25-percent bulk discount is available on orders of 100 or more copies shipped to a single address. Please add 25 percent extra postage for shipments to foreign addresses.
Microfiche copies ($6.95 for each report plus $3 per order for processing) can be purchased from the order desk. National Technical Information Service, 5285 Port Royal Road, Springfield, VA 22161. Enclose check or money order, payable to NTIS. For faster service, call NTIS at 703-487-4650 and charge your purchase to your Visa, MasterCard, American Express, or NTIS Deposit Account. NTIS will ship rush orders within 24 hours for an extra $10; charge your rush order by calling 800-336-4700.
The Economic Research Service has no copies for free mailing.

The U.S. Soybean Industry, by James Schaub, W. C. McArthur, Duane Hack- lander, Joseph Glauber, Mack Leath, and Harry Doty, Commodity Economics Division, Economic Research Service, U.S. Department of Agriculture. Agricul- tural Economic Report No. 588.
Abstract
U.S. soybean production has increased sevenfold since 1950, making soybeans the second highest valued crop after corn. Soybean production has risen in response to increasing world demand for soybeans and the derivative products, oil and meal. The U.S. share of the world export market has ranged from 65-80 percent during the 1980's. Soybean oil accounts for 75 percent of the fats and oils used in edible oil products. Soybean meal is the major high- protein feed fed to livestock in the United States. This report describes the U.S. soyt)ean industry from producers to consumers and provides a single source of economic and statistical information on soyt)eans.
Keywords: Soybeans, soybean meal, soybean oil, oilseeds. Government pro- grams, prices, marketing, exports.
Acknowledgments
The authors appreciate the contributions of Linwood Hoffman, Roger Hoskin, and Karen Griffin of the Economic Research Service, and Keith Smith of the American Soybean Association.
Washington, DC 20005-4788 May 1988

Contents Hi Highlights
1 introduction
1 Production
10
15
24
1 Production Patterns and Trends 5 Characteristics of Farms Harvesting
Soybeans 8 Supply 8 Production Adjustments
10 Costs and Returns
Soybean Use 10 Meal 11 Oil
Soybean Prices 18 Historical Trends 21 Soybean Pricing System 21 Relationships to Other Pricing
Systems 22 Value of Soybean Products 23 Processing Margins 24 Futures and Options Markets
iMarlœting Strategies 24 Marketing Methods 25 Pricing Arrangements 25 Pricing Soybeans Sold Directly from the
Field 25 Pricing Soybeans Delivered Off-Farm at
Harvest 26 Pricing Soybeans Sold from Onfarm
Storage 27 Pricing Methods
28 Government Programs for Soybeans
31 Soybean Processing 31 Development of Processing 31 Soybean Oil Mills 32 Processing Steps 33 Soybean Receipts and Holdings 33 Soybean Crushings 33 Refining
34 Storage and Handiing 34 Farm Storage 36 Commercial Storage
37 iWlarlœt Flow Patterns and Transportation Modes
38 Shipments by Region 39 Regional Destinations and
Transportation Modes 40 Changes in Domestic Marketing
Patterns
40 World Production and Trade 40 Location of Production 40 World Production Trends 41 World Trade
45 References
48 Appendix A: Soybean Acreage, Yield, and Production Trends
51 Appendix B: U.S. Standards for Soybeans

Highlights
U.S. soybean production has increased sevenfold since 1950, making soybeans the second highest valued crop after corn. Soybean production has risen in response to increasing world demand for soybeans and their derivative products, oil and meal. The U.S. share of the world soybean export market has ranged from 65-80 percent during the 1980*s. Soybean oil accounts for 75 percent of the fats and oils used in edible oil products. Soybean meal is the major high-protein feed fed to livestock in the United States.
This report describes the U.S. soybean industry from producers to consumers and provides a single source of economic and statistical information on soybeans.
U.S. farmers increased soybean plantings from 15.6 million acres in 1950 to 60.4 million acres in 1986. Production increased from 299.2 million to nearly 2 billion bushels. Average yield per acre increased from 21.6 to 33.3 bushels.
About 55 percent of the U.S. soybean crop is crushed domestically. Most of the rest is exported as beans. Soybean meal is the principal livestock feed used in the United States; about 45 percent is fed to poultry, and about 30 percent is fed to hogs. Soybean oil is the dominant vegetable oil used in edi- ble oil products, such as salad and cooking oils, baking and frying fats, and margarine.
Soybean prices increased moderately through the 1960*s, then jumped sharply in the 1970's, reflecting crop failures abroad and increasing world demand for protein feeds. Soybean prices have fluctuated widely since the 1970's, as have prices for soybean oil and meal.
Government price supports have been available for soybeans every year since 1941 except for 1975. The season average price has exceeded the price sup- port level for most years. The loan rate was $5.02 per bushel in 1985 and $4.77 per bushel in 1986.
The United States, the leading producer and exporter of soybeans, neverthe- less saw its share of world production drop from 74 percent during 1967-69 to 56 percent during 1984-86. Brazil and Argentina became major competitors during that period, increasing their share of world production from 2.8 percent to 24.4 percent.
Japan and the European Community (EC) are the principal importers of U.S. soybeans. The EC and other European countries are the major importers of U.S. soybean meal. Pakistan, India, and Mexico are the major importers of U.S. soybean oil.
iii

The U.S. Soybean Industry James Schaub, W. C. McArthur, Duane Hacklander, Joseph Glauber, Mack Leath, Harry Doty*
Introduction
Soybeans are the second highest valued U.S. crop, with an aggregate production value over $9.2 billion in 1986, surpassed only by corn (67).^ Soybeans have been one of agriculture's fastest growing indus- tries in recent decades. Domestic production increased over sevenfold in the last three decades, while world production rose about fivefold. This rapid growth in the volume produced and processed re- sulted largely from increasing world demand for soy- beans and the primary products, soybean oil and soy- bean meal.
This report provides information on the structure and performance of the soybean industry and emphasizes production trends, practices, and costs; uses; prices; Government programs; marketing patterns and trans- portation; processing; and world trade.
Soybeans were cultivated in ancient China, Manchu- ria, and neighboring countries (38). The crop was in- troduced into the United States from the Orient dur- ing the early 1800's, but it had little economic importance here for several decades, with production being used primarily for hay.
Soybeans were first processed for oil and meal in the United States about 1910 by an oil mill on the west coast (9). This mill processed beans that were im- ported from Manchuria. U.S. production was first used for processing in 1914 when a few cottonseed oil mills in North Carolina began crushing soybeans. The use of cottonseed oil mills for this purpose spread to other mills in the South, but these first ef- forts were unsuccessful due to a lack of processing
* Schaub, Glauber, and Leath are agricultural economists in the Commodity Economics Division (CED), Economic Research Serv- ice (ERS). U.S. Department of Agriculture. McArthur, Hacklander, and Doty were associated with CED at the time this research was conducted. Hacklander is now in the Agriculture and Rural Econ- omy Division, ERS. McArthur and Doty have retired.
^ Italicized numbers in parentheses identify sources listed in the References section.
experience and difficulties in obtaining a local supply of soybeans. Commercially successful processing of U.S. soybeans began in 1922. After this initial suc- cess, several other companies entered the soybean processing business in the 1920's. The industry has continued to expand.
Production
Soybeans are grown in all States in the area bounded by North Dakota, Texas, Florida, and New Jersey (fig. 1). This section describes production patterns and trends since 1950, characteristics of farms growing soybeans, soybean supply, factors leading to produc- tion adjustments, and costs and returns from soybean production. The major soybean-producing States are grouped into seven production regions for comparing yields, production practices, trends, and other factors among relatively homogeneous regions (fig. 2). The minor soybean-producing States (Delaware, Mary- land, New Jersey, and Pennsylvania) are reported in the tables as "Other."
Production Patterns and Trends
Soybeans are generally planted in May and June. The soybean plant flowers and pod-filling occurs in July and August. Harvesting begins in September and is largely completed by mid-November. Produc- tion is concentrated in the Corn Belt, the region with the highest average yields.
Planted Acres. Increasing world demand for soybeans and their products during the last three de- cades encouraged the expansion of soybean acre- age. U.S. soybean acreage has increased steadily since 1950 when 15.6 million acres were planted (table 1). Plantings peaked at 71.4 million acres in 1979 and dropped to 60.4 million acres by 1986. The largest year-to-year increase occurred in 1973 when 9.6 million acres were added. Soybean plantings fell a record 7.1 million acres in 1983 when the payment- in-kind (PIK) program was in effect. Although

Figuro 1
lO Soybeans harvested for beans, 1982
1 dot= 10,000 acres

Figure 2
Major soybean production regions
soybeans were not covered in the PIK program, soy- bean acreage declined because soybeans were not allowed to be planted on conservation use acres, such as those set aside in the wheat PIK program. Even so, soybean plantings exceeded corn plantings. Overall, farmers planted four times as many acres to soybeans in 1986 as in 1950. Trends in soybean planted acres, yields, and production are measured in appendix A.
Production. Production gains were even more dra- matic than acreage gains, increasing 600 percent be- tween 1950 and 1985. From a base of 300 million bushels in 1950, soybean production trended upward, never displaying back-to-back yearly decreases in production (table 1). The largest crop was in 1979, when the 2-billion-bushel mark was first passed, with 2,261 million bushels harvested. Production exceeded 2 billion bushels again in 1982 and 1985. The 1985 crop, 2,099 million bushels, was produced on signifi- cantly fewer acres than the other 2-billion-bushel crops.
Yields. Soybean yields have trended upward during the last 37 years, ranging from a low of 18.2 bushels per acre in 1953 to a record high 34.1 bushels per acre in 1985 (table 1). National average yields have been in the 30-bushel range five times since first breaking the 30 bushels per acre mark in 1977. The
largest swings in yields were +6.0 in 1985 and -5.6 in 1980.
A high-yielding hybrid soybean variety, such as that achieved with corn, has not been developed. Increases in yields have come from better cultivating and harvesting practices and improved plant varieties. Plant scientists are pursuing the genetic alteration of soybeans for improved yields using biotechnology methods.
Crop rotation, typically corn with soybeans, is a com- mon practice that improves soybean yields. Double- cropping soybeans with wheat has become more common in the South. However, yields of double-cropped soybeans tend to be lower than single-cropped beans, restraining the national annual yield gain (24).
Weather significantly affects soybean yields. Insuffi- cient moisture and unusually high temperatures in August, when flowering ends and pod-filling begins, substantially reduces yields. Just 3 percent of the farms producing soybeans irrigate, and only 3.5 per- cent of the harvested soybean acreage is irrigated.
Regional Perspective. Soybean acreage trended up- ward nationally and in every region from 1950 to 1985. The Southeast had the greatest percentage

increase in acres between 1950-54 and 1980-85 (table 2). The Corn Belt's percentage increase was the smallest, but this region added the most acres to U.S. soybean production.
Increased yields in all regions accompanied the ex- pansion of soybean acreage (table 2). The Northern Plains led all regions, gaining 13.8 bushels per acre between 1950-54 and 1980-85, to become the third highest yielding region behind the Corn Belt and the Lake States. The Lake States increased yields 13.3 bushels per acre and now average over 30 bushels per acre. The three Southern regions had the small- est yield increases. Their 1980-85 average yields were less than 25 bushels per acre. Among the fac- tors limiting yield gains in the South have been the cyst nematode, the practice of double-cropping soy-
Table 1—U.S. soybean planted acres, yield, and production
Year Planted acres Yield Production
Millions Bushels per harvested acre Million bushels
1950 15.6 21.6 299.2 1951 15.7 20.8 283.8 1952 16.4 20.7 298.8 1953 16.7 18.2 269.2 1954 18.9 20.0 341.1 1955 20.0 20.1 373.7 1956 22.0 21.8 449.3 1957 22.2 23.2 483.3 1958 25.3 24.2 580.3 1959 23.6 23.5 532.9
1960 24.6 23.5 555.1 1961 28.0 25.1 678.6 1962 28.6 24.2 669.2 1963 29.6 24.4 699.2 1964 31.7 22.8 700.9 1965 35.2 24.5 845.6 1966 37.3 25.4 928.5 1967 40.8 24.5 976.4 1966 42.3 26.7 1.107.0 1969 42.5 27.4 1.133.1
1970 43.1 26.7 1.127.1 1971 43.5 27.5 1.176.1 1972 46.9 27.8 1,270.6 1973 56.5 27.8 1,547.5 1974 52.5 23.7 1,216.3 1975 54.6 28.9 1.548.3 1976 50.3 26.1 1,288.6 1977 59.0 30.6 1.767.3 1978 64.7 29.4 1,868.8 1979 71.4 32.1 2,260.7
1980 69.9 26.5 1.797.5 1981 67.8 30.1 1.989.1 1982 70.9 31.5 2.190.3 1983 63.8 26.2 1,635.8 1984 67.8 28.1 1.860.9 1985 63.1 34.1 2.098.5
1986 60.4 33.3 1.940.1
Source: {50, 60).
beans with wheat, three droughts since 1980, and generally poorer quality soils for soybean production.
Illinois, Indiana, Iowa, Minnesota, Ohio, and Wiscon- sin had yields of 30 or more bushels per acre at least nine times between 1975 and 1985. Illinois, Indiana, and Ohio had yields of at least 40 bushels per acre in 1985. Only Kansas and Oklahoma had yields below 20 bushels per acre in 5 of the last 10 years.
The Corn Belt, with the highest average yield and greatest acreage, remains the most important soy- bean producing region, accounting for more than half the U.S. production (table 2). The Southern Plains region produces the smallest soybean crop. Even so, the average annual value of this area's soybean pro- duction was over $100 million during 1980-85.
Mix of Major Crops. The crop mix by region illus- trates the regional effects of the soybean programs and programs for competing crops, such as corn. Crop mix information also provides insights into where soybean production adjustments, such as acre- age expansion, might occur.
Soybeans dominate the planted acreage in the Delta, accounting for nearly half the acreage planted to prin- cipal crops (table 3). Other regions where soybeans account for a substantial part of the acreage are the Corn Belt, Appalachia, and the Southeast. Soybeans are planted on less than 10 percent of the cropland in the Southern and Northern Plains where wheat domi- nates. Although corn is an important alternative crop in most regions, it is a minor crop in the Delta States and Southern Plains compared with wheat, cotton, rice, and sorghum.
Shifts in Ljocation of Production. Soybean acreage and yields have increased in all regions since 1950 but at uneven rates. The Corn Belt's extremely large share of U.S. soybean production (nearly 75 percent in 1950) has fallen since 1950-54 (table 4). Major share gainers have been the Delta, the Southeast, the Northern Plains, and Appalachia. The Corn Belt's share has declined, not because its yield increases failed to keep pace with those of other regions, but because Corn Belt acreage increased less, by 205 percent compared with an average rise of 675 per- cent for all other regions.
Several factors account for relative shifts in the loca- tion of production, including soybean profitability compared with alternative crops, variability of soy- bean returns, regional differences in climate, and pro- duction practices, including double cropping and crop rotation schemes. Additional land for soybean produc-

tion carne from new acres put into production and from displacement of other crops. In the Corn Belt during the 1950's, soybeans accounted for at)out 15 percent of harvested acreage; corn, 39 percent; and oats, 15 percent. Since then, soybean's share of har- vested acreage increased to 36 percent, corn's share increased to 43 percent, and oat's share decreased to 2 percent. In the Delta, the crop mix changed even more since the 1950's: corn decreased from 21 per- cent to 1 percent, wheat increased from 1 percent to 12 percent, cotton decreased from 30 percent to 11 percent, and soybean's share of acres increased from
5 percent to 48 percent. The Southeast crop mix also changed dramatically. There, soybean's share of acre- age increased from 3 percent to 38 percent, cotton decreased from 19 percent to 5 percent, and corn fell from 38 percent to 16 percent.
Characteristics of Farms Harvesting Soybeans
Soybeans are produced under a variety of farm enter- prise structures, ranging from small-scale individual proprietorships to large-acreage corporate farms. This section describes selected structural characteristics of
Table 2—Soybean planted and harvested acres, yields, and production, by region
Region 1950-54 1955-59 1960-64 1965-69 1970-74 1975-79 1980-85
1000 acres Planted acres:
Lake States 1,582 2,936 2,819 3.981 4,237 4,958 6,365 Corn Belt 10,456 13,100 16.032 20,027 25,156 28,440 31,022 Northern Plains 759 959 1,400 2,230 2,420 3.065 5,304 Southern Plains 95 103 228 404 446 977 853 Appalachia 1,317 1,395 1,929 2,957 3,960 5,684 6,299 Southeast 487 717 1,000 1,981 2.947 4,841 5,812 Delta 2,131 2,495 4,433 7,278 8,732 11.151 10,538 Other 267 439 490 429 584 855 972
United States 17,094 22,144 28,331 39,287 48,481 59.971 67,168
Harvested acres: Lake States 1,504 2,860 2,783 3,919 4,177 4,899 6,255 Corn Belt 10,066 12,862 15,870 20,076 24.881 28,224 30,663 Northern Plains 671 905 1,366 2,188 2.362 3,002 5.151 Southern Plains 54 82 206 380 417 917 773 Appalachia 759 1,113 1,640 2,687 3,733 5,444 6.076 Southeast 239 545 911 1,867 2,847 4,681 5.552 Delta 1.183 2,651 4,301 7,106 8,533 10,946 10.183 Other 201 383 454 413 570 839 950
United States 14,677 21,401 27,531 38,636 47,520 58,952 65,603
Bushels per acre Yields:
Lake States 19.1 19.6 21.3 21.8 25.4 30.3 32.4 Corn Belt 22.0 24.6 26.5 28.8 29.8 34.1 34.3 Northern Plains 14.0 15.3 19.7 22.8 23.2 26.5 27.8 Southern Plains 11.3 20.0 20.7 23.5 22.8 24.4 22.2 Appalachia 16.6 20.8 22.2 23.6 24.1 25.4 24.2 Southeast 13.2 17.3 19.8 21.6 21.5 22.8 20.5 Delta 15.1 20.9 20.0 22.6 22.1 24.3 22.3 Other 17.5 22.1 20.3 24.0 26.8 28.0 27.5
United States 20.3 22.6 24.0 25.8 26.7 29.6 29.4
1,000 bushels Production:
Lake States 28,765 55,923 59,244 85,385 105,962 148,602 202.705 Corn Belt 221.841 316.435 420.294 578.866 742.433 961.068 1.051.265 Northern Plains 9.401 13,865 26,972 49.968 54.712 79,556 143.341 Southern Plains 608 1.648 4.273 8,944 9,508 22,334 17.165 Appalachia 12,598 23.116 36,453 63.460 89.943 137,984 146.888 Southeast 3,163 9.431 18.029 40.290 61.065 106,874 113.963 Delta 17,887 55,487 86.040 160.379 188.404 266,327 227,119 Other 3,508 8,462 9,224 9.897 15,282 23,509 26.163
United States 297.770 484.368 660.529 997,189 1,267,309 1,746,253 1,928.609
Source: (50, 60).

soybean-producing farms with emphasis on regional differences in acreage, sales, organization, operator tenure, and irrigation.
Number and Sizes of Farms. The 1982 Census of Agriculture reported 511,229 farms harvesting soy- beans (table 5). The number of soybean-harvesting farms in each region, except for the Delta States and Appalachia, is generally proportional to that region's
share of total soybean production. The Delta's share of production is much larger than its share of farms because its average soybean acreage is so large. Ap- palachia has a larger share of farms than production because average soybean acreage is small and yields are below average.
Forty percent of the Nation's soybean-harvesting farms harvest fewer than 50 acres of soybeans, 25
Source: (60).
Table 3— Proportion of total acreage of planted to selected crops, by region
Region/year Soybeans Sorghum Wheat Corn Cotton Rice Other crops
All principal
crops
cu
0 0
0 0
34.9 35.5
1,000 acres
38,864 38,789
Lake States: 1984 1985
18.0 16.9
0 0
r
9.9 9.7
^»i^wffc— —— —■
37.2 37.9
Corn Belt: 1984 1985
35.9 35.4
2.0 2.2
7.6 4.8
42.3 44.2
.2
.2 .1 .1
11.9 13.1
87,538 87,549
Northern Plains: 1984 1985
8.2 7.2
9.5 9.5
37.3 36.3
16.4 15.9
0 0
0 0
28.6 31.1
78.671 78,538
Southern Plains: 1984 1985
2.2 1.7
15.7 15.4
48.5 50.0
5.6 5.1
18.6 16.9
1.3 1.0
8.1 9.9
31.145 31.787
Appalachia: 1984 1985
28.9 26.0
2.5 3.6
11.3 9.5
24.8 26.4
2.1 .6
0 0
30.4 33.9
20,825 20,275
Southeast: 1984 1985
38.4 33.5
3.2 4.0
13.5 15.6
16.3 17.0
4.3 5.6
0 0
24.3 24.3
13.954 13.226
Delta: 1984 1985
49.0 47.3
6.6 11.0
13.3 7.0
1.3 2.5
10.8 11.7
9.4 9.3
9.6 11.2
20,105 18.389
Other: 1984 1985
1.9 1.8
1.6 1.4
32.1 33.3
12.3 14.5
3.7 4.0
.9
.8 47.5 44.3
54.008 53.711
United States: 1984 1985
19.6 18.5
5.0 5.3
23.0 22.1
23.4 24.4
3.2 3.1
.8
.7 25.0 25.9
345.110 342.264
Table 4—Regional shares of soybean production
Region 1950-54 1955-59 1960-64 1965-69 1970-74 1975-79 1980-85
Percent
Lake States 9.6 11.5 9.0 8.6 8.4 8.5 10.5 Corn Belt 74.5 65.3 63.6 58.0 58.6 55.0 54.5 Northern Plains 3.2 2.9 4.1 5.0 4.3 4.6 7.4 Southern Plains .2 .3 .7 .9 .7 1.3 .9 Appalachia 4.2 4.8 5.5 6.4 7.1 7.9 7.6 Southeast 1.1 2.0 2.7 4.0 4.8 6.1 5.9 Delta 6.0 11.5 13.0 16.1 14.9 15.3 11.8 Other 1.2 1.7 1.4 1.0 1.2 1.3 1.4
Source: (50, 60).

percent harvest 100-249 acres, and 4 percent har- vest over 500 acres. This size distribution varies sig- nificantly across regions. Soyt)ean-harvesting farms in Appalachia tend to be small; 58 percent harvested fewer than 50 acres of soybeans. The Delta States' farms harvest on average the most soybean acres, 338 acres. Nearly 22 percent of the farms growing soybeans in the Delta harvest more than 500 acres. Only 1 percent of the Nation's soybean producers are in the Southern Plains, but they have a relatively large proportion of large farms (250 or more acres of soybeans).
Value of Sales. Classifying soybean-harvesting farms by value of sales results in a distribution across sales classes and regions similar to the distribution by acres (table 6). The Southern Plains and Delta had the largest proportions of farms with sales of $100,000 or more. However, most farms with large sales are in the Corn Belt. Appalachia and the South- east had the largest proportions of farms in the two smallest sales categories. Nationally, 33 percent of
soybean-harvesting farms had sales below $20,000 compared with 47 percent in Appalachia and the Southeast.
Specialized Soybean Farms. The Census of Agricul- ture classifies soybean farms as those where soy- beans account for 50 percent or more of sales. Figure 3 shows the 1982 distribution of the Nation's 129,607 specialized soybean farms across regions, and table 7 shows three measures of these farms' sizes: aver- age acres of harvested cropland, average capital as- sets, and average value of sales. The Corn Belt has the most soybean farms. Soybean farms in the Corn Belt are comparable to those in the Lake States, Ap- palachia, and the Southeast in all three size mea- sures. The largest soybean farms are in the Southern Plains and the Delta.
Type of Organization. The organization of soybean- harvesting farms does not differ much from the organ- ization of all U.S. farms, nor does it differ much by region (table 8). About 84 percent of the farms are
Table 5—Size distribution of soybean farms, by acres of soybeans harvested, 1982
Source: (62).
Share of farms by acres of soybeans harvested Farms growing
soybeans Region 1-24 25-49 50-99 100-249 250-499 500-999
1,000 acres or more
nt Number
Lake States 20.8 20.3 24.0 26.6 6.7 1.4 0.2 59.439 Corn Belt 18.4 18.8 23.0 28.3 9.1 2.1 .3 260.171 Northern Plains 17.6 21.6 26.1 26.3 6.7 1.4 .2 48.935 Southern Plains 12.8 14.8 20.3 28.7 14.4 6.7 2.2 5,061 Appalachia 37.0 20.6 17.2 15.5 6.2 2.6 .9 60.656 Southeast 23.6 18.2 18.3 21.9 11.0 5.2 1.7 35.223 Delta 12.5 12.3 13.8 21.1 18.8 14.2 7.4 30.485 Other 37.5 20.0 17.6 16.2 6.2 2.2 .4 11.259
United States 21.2 19.0 21.7 25.3 8.9 3.0 .9 511.229
Table 6—Distribution of farms growing soybeans, by value of sales, 1982
Value of sales Total farms Region $100,000 $40,000 to $20,000 to $10,000 to Less than
or more $99,999 $39,999 $19,999 $10,000
Number
59.429 Uke States 24.1 28.4 17.9 12.8 16.7 Corn Belt 25.3 27.6 17.2 13.2 16.7 260,092 Northern Plains 26.1 32.4 19.1 11.8 10.6 48,908 Southern Plains 34.1 26.5 15.2 10.7 13.5 5,045 Appalachia 17.6 18.9 16.3 15.6 31.7 60,512 Southeast 21.3 18.5 13.6 14.0 32.7 35.183 Delta 30.6 20.1 12.6 11.5 25.1 30,453 Other 29.1 18.7 13.6 13.1 25.5 11.336
United States 24.5 25.8 16.7 13.2 19.7 510,958
Source: {62).

Figure 3
Soybean farms, 1982
1 dot = 100 farms
individual proprietorships, 13 percent are partner- ships, and 3 percent are corporations. The Delta, where there is a high proportion of farms with large acreage and large value of sales, has the largest pro- portion of corporate farms.
Tenure of Operator. The national tenure distribution of soybean producers is 36 percent full owners, 46 percent part owners, and 18 percent tenants, but the regional distributions deviate from this pattern (table 9). Part-owner status was the most frequent in all re- gions and showed the least variation across regions. In all regions, except the Southern Plains, full owners were more common than tenants.
Irrigation by Soybean Producers. In 1982, 16,176 farms irrigated 2.32 million acres of soybeans, repre- senting 3.2 percent of the farms harvesting soybeans and 3.7 percent of the Nation's soybean acreage (table 10). Regions were quite different in their use of irrigation because of differences in soil type, climate, and water availability. The largest number of farms reporting irrigation was in the Northern Plains. The Corn Belt and Appalachia had virtually no soybean irrigation, while in the Southern Plains, 41 percent of the soybean-harvesting farms irrigated. The average number of soybean acres irrigated by farms reporting irrigation varied from 61 acres in Appalachia to 264 acres in the Delta.
Supply
The total U.S. soybean supply consists of the current year's production plus the carryin from the previous year (table 11). (Carryin is also referred to as the pre- vious year's ending stocks and the current year's be- ginning stocks.) The record soybean production in 1979 led to the largest carryover ever, 359 million bushels beginning stocks for the 1980/81 marketing year Total supply has averaged 2,259 million bushels in the 1980's, and carryin has averaged 328 million bushels. The 1969 carryin, 326.8 million bushels, amounted to about 22 percent of the U.S. soybean supply, the largest relative carryin between 1950 and 1986. Soybean imports are insignificant. They have never amounted to more than 500,000 bushels in any of the last 30 years.
Production Adjustments
U.S. soybean production and its location are deter- mined in part by (1) foreign (world) oilseed supply and demand conditions, (2) U.S. agricultural com- modity, trade, and land-use policies, and (3) domestic demand conditions and production practices. Biologi- cal advances that substantially increase soybean yields and discoveries of new uses for soybean prod- ucts will also affect soybean production.

Table 7—Characteristics of specialized soybean farms, 1982
Table 10—Soybean irrigation, by region, 1982
Average Average Average Region Farms harvested capital value of
cropland assets sales
Number
12,266
Acres
166
n^Êi^^
Lake States 332,305 28,102 Corn Belt 60,964 186 381,882 33,335 Northern Plains 6,113 243 392,984 35,196 Southern Plains 1,017 402 679,697 49,255 Appalachia 17,193 160 279,753 27,196 Southeast 13,818 186 336,387 27.304 Delta 15,454 396 618.215 63.468 Other 2.780 127 343,850 19,750
United States 129.607 209 381,726 34,906
Source: (62). Source: (62).
Irrigated Share of —
Region Farms Cropland Cropland
per farm Farms All cropland
Number
859
AM.» A ^^•V\A»l#
Uke States 76.441 89 1.5 1.3 Corn Belt 1,833 250.660 137 .7 .8 Northern Plains 6,638 617.943 93 13.6 12.4 Southern Plains 2.067 334.147 162 40.8 33.9 Appalachia 228 13.899 61 .4 .2 Southeast 1.165 179.816 154 3.3 3.4 Delta 3.132 827.545 264 10.3 8.0
United States 16.176 2.321.138 143 3.2 3.6
Table 11—U.S. soybean supplies
Table 8—Farms growing soybeans, tiy type of organization, 1982
Region Individual proprietorship Partnership Corporation Other Total
farms
Ptirr^nt Number
59.429 Lake States 86.6 11.4 1.8 0.3 Corn Belt 83.6 13.1 2.9 .4 260.092 Northern Plains 86.4 10.2 3.1 .3 48.908
Southern Plains 83.5 12.1 4.0 .4 5,045
Appalachia 84.0 13.9 1.7 .3 60,512 Southeast 85.4 12.1 2.1 .5 35.183 Delta 81.2 12.7 5.4 .6 30.453 Other 82.6 12.9 4.1 .4 11.336
United States 84.2 12.6 2.8 .4 510,958
Source: (62).
Table 9—Tenure of soybean producere, 1982
Region Full owner Part owner Tenant Total operators
Number
59.429 Lake States 39.8 44.7 15.5 Corn Belt 36.5 43.6 20.0 260,092 Northern Plains 27.5 52.4 20.1 48.908 Southern Plains 24.1 51.1 24.8 5.045 Appalachia 39.9 46.2 13.9 60,512 Southeast 37.2 49.9 12.9 35,183 Delta 30.3 47.8 21.9 30.453 Other 36.6 47.8 15.5 11,336
United States 36.0 45.7 18.3 510,958
Year Production Beginning stocks Total
Million bushels
1950 299.2 2.9 302.2 1951 283.8 4.2 287.9 1952 298.8 3.6 302.4 1953 269.2 22.4 291.4 1954 341.1 8.1 349.2 1955 373.7 22.6 396.3 1956 449.3 21.0 470.3 1957 483.4 31.6 515.0 1958 580.2 42.8 623.0 1959 532.9 87.8 620.7
1960 555.1 51.8 606.9 1961 678.6 27.1 705.7 1962 669.2 78.3 747.5 1963 699.2 46.0 745.5 1964 700.9 67.3 768.2 1965 845.6 29.7 875.3 1966 928.5 35.6 964.1 1967 976.1 90.1 1,066.2 1968 1,107.0 166.3 1.273.3 1969 1.133.1 326.8 1.460.0
1970 1.127.1 229.8 1.356.9 1971 1,176.1 98.8 1,274.9 1972 1.270.1 72.0 1.342.6 1973 1,547.5 59.6 1.607.2 1974 1,216.3 170.8 1,387.0 f975 1,548.3 188.2 1,736.5 1976 1,288.6 244.9 1,533.5 1977 1.767.3 102.9 1,870.2 1978 1.868.8 161.2 2,029.9 1979 2.260.7 176.0 2.436.7
1980 1.797.5 358.8 2,156.3 1981 1.989.1 313.0 2.302.1 1982 2.190.3 254.0 2.444.3 1983 1.635.8 345.0 1.980.8 1984 1,860.9 176.0 2.036.9 1985 2.098.5 316.0 2.414.5
1986 1.940.1 536.0 2.476.1
Source: (62). Source: (50, 60).

Among the foreign events expected to affect U.S. pro- duction are trade policy decisions of the European Community, Japan, and centrally planned economies; Brazil's and Argentina's success in establishing soy- bean production, processing, and export industries; and the expansion of palm oil, rapeseed, and other competing foreign oilseed industries.
Important U.S. policies influencing soybean produc- tion include those affecting the relative profitability of soybeans and competing crops; conservation pro- grams that encourage producers to plant on only the most productive, least erodible land; direct trade pol- icy decisions, including embargoes and carrier re- quirements; and indirect macroeconomic policies af- fecting exchange rates and interest rates.
Domestic demand influences that might ultimately affect production decisions include population and income growth rates and shifts in demand toward or away from commodities produced with soybeans. Pro- duction practices affecting soybean production in- clude adoption of reduced tillage methods, crop rota- tion schemes, and double cropping.
Acreage expansion is possible in all regions. The specific regions most likely to expand will depend on soybean's competitiveness with other crops within each region. The Northern and Southern Plains are not prime sites for expansion because of their depen- dence on irrigation and their relatively small acreage expansion since 1950.
Costs and Returns
The data in table 12 are estimates of costs and re- turns per planted acre from soybean production for 1983, 1984, and 1985. Cash receipts are current-year returns or revenues based on harvest-period prices and average yield per planted acre. Government pay- ments are excluded from receipts.
Total returns from soybean production vary from year to year because prices and yields change. Soybean returns fell from $204.46 per acre in PIK year 1983 to a more typical $166.72 per acre in 1984. Although U.S. average soybean yields per planted acre increased slightly between 1983 and 1984, per acre returns decreased substantially because soybean prices fell from $7.95 to $6.05 per bushel. Yields rose and prices fell again in 1985, maintaining per acre cash receipts near 1984 levels.
The cost of producing soybeans varies from year to year because input prices and quantities of inputs used change. Cash expenses are divided into vari- able expenses and fixed expenses. Variable
expenses are incurred only when production occurs, while fixed expenses are incurred whether or not pro- duction takes place. The largest variable cash expense in soybean production in 1983-85 was chemicals followed by fuel, seed, and fertilizer. Among fixed expenses, interest was much larger than general farm overhead, taxes, and insurance combined.
The economic costs section of table 12 includes a value placed on inputs and resources used in produc- tion without regard to ownership of the resource. Sub- tracting variable expenses, general farm overhead, taxes and insurance, and capital replacement from cash receipts leaves net returns to owned inputs con- sisting of land, labor, and capital. These returns fell from almost $100 in 1983 to less than $62 in 1984 and 1985.
USDA also estimates costs and returns from produc- ing soybeans by region (tables 13-16). (The cost of production estimates use differently defined regions than are used elsewhere in this report.) Variable costs are highest in the Southeast and k)west in the North- ern Plains. Most of the differences in variable costs between these regions result from differences in out- lays for fertilizer and chemicals. Fixed costs are high- est in the Lake States and Corn Belt regions and low- est in the Delta and Southeast regions. The cost difference arises because of higher taxes, insurance, and interest expenses in the Lake States and Corn Belt. The biggest difference between regions in allo- cated returns to owned inputs is in net land rent which is highest in the Lake States and Corn Belt and lowest in the Southeast.
Soybean Use
Soybeans are crushed to produce joint products of meal and oil. About 55 percent of the crop is normally crushed, while most of the balance is exported (table 17). About 62 percent of the value of soybeans nor- mally comes from meal and 38 percent from oil.
Meal
Soybean meal is used primarily as a high-protein live- stock feed. Only 1-2 percent of the meal is used to produce food protein. The supply and disappearance of U.S. soybean meal are shown in table 18. During the first half of the 1980's, about a fourth of the do- mestically produced meal was exported.
Soybean meal is the major high-protein feed fed in the United States, increasing from 57 percent of the total protein fed in 1965/66 to 75 percent in 1984/85, on a 44-percent crude protein basis. During the same
10

period, soybean meal, as a percentage of total oil meals fed, increased from 80 percent to 89 percent.
1980 and 1984 to 19 percent in 1981, reflecting differ- ences in world supply and demand.
From 1980/81 to 1985/86, poultry consumed about 45 percent of the soybean meal, with broilers accounting for nearly half of this amount (table 19). Hogs con- sumed over 30 percent of the soybean meal. Beef cattle and milk cows each consumed slightly less than 10 percent.
Oil
During the first half of the 1980's, 16 percent of the soybean oil produced in the United States was ex- ported (table 20). Exports varied from 14 percent in
Soybean oil is the dominant vegetable oil used do- mestically in edible oil products. Since 1960, soybean oil and cottonseed oil have comprised about 75 per- cent of the total fats and oils used in edible oil prod- ucts (table 21). The striking difference between the two oils is that the proportion of cottonseed oil used declined from 22 percent in 1960 to 4 percent in 1985/86 while soybean oil used increased from 54 percent to 72 percent.^ The proportional use of other fats and oils has remained fairly stable, except for
^ Bureau of the Census started reporting annual tables on a mar- keting year (Oct.-Sept.) basis in 1978/79.
Table 12-U.S. soybean production costs
Item 1983 1984 1985
Dollars per planted acre
Cash receipts 204.46 166.72 162.72
Cash expenses: Seed 7.98 10.08 8.74 Fertilizer 7.58 7.70 6.84 Lime and gypsum 1.16 1.15 1.12 Chemicals 19.18 18.35 17.47 Custom operations 3.84 3.85 3.86 Fuel. lube, and electricity 10.35 8.43 7.58 Repairs 6.63 6.64 6.49 Hired labor 1.47 1.47 1.50 Miscellaneous .34 .35 .34 Technical services .18 .16 .15
Total, variable expenses 58.71 58.18 54.10 General farm overhead 10.43 10.81 10.91 Taxes and insurance 11.18 11.77 12.16 Interest 32.57 33.82 33.23
Total, fixed expenses 54.18 56.40 56.30 Total, cash expenses 112.89 114.58 110.40
Receipts less cash expenses 91.57 52.14 52.32 Capital replacement 24.50 24.13 23.80 Receipts less cash expenses and replacement 67.07 28.01 28.52
Economic (full ownership) costs: Variable expenses 58.71 58.18 54.10 General farm overhead 10.43 10.81 10.91 Taxes and insurance 11.18 11.77 12.16 Capital replacement 24.50 24.13 23.80 Allocated returns to owned inputs-
Returns to operating capital 2.21 2.47 1.81 Returns to other nonland capital 8.22 8.08 8.06 Net land rent 63.46 52.99 48.80 Unpaid labor 9.82 9.84 10.07
Total, economic costs 188.53 178.27 169.71 Residual returns to management and risk 15.93 -11.55 -6.99 Total, returns to owned inputs 99.64 61.83
Dollars per bushel
61.75
Harvest-period price 7.95 6.05
Bushels per planted acre
4.86
Yield 25.72 27.54 33.45
Source: (52).
11

Table 13—Soybean production costs, Southeast
Item
Cash receipts Cash expenses:
Seed Fertilizer Lime and gypsum Chemicals Custom operations Fuel, lube, and electricity Repairs Hired latx)r Miscellaneous Technical services
Total, variable expenses General farm overhead Taxes and insurance Interest
Total, fixed expenses Total, cash expenses
Receipts less cash expenses Capital replacement Receipts less cash expenses and replacement
Economic (full ownership) costs: Variable expenses General farm overhead Taxes and insurance Capital replacement Allocated returns to owned inputs-
Returns to operating capital Returns to other nonland capital Net land rent Unpaid labor
Total, economic costs Residual returns to management and risk Total, returns to owned inputs
Harvest-period price
Yield
1983 1984
Dollars per bushel 7.79 6.07
Bushels per planted acres 17.67 23.29
1985
Dollars per planted acre 137.72 141.46 124.39
7.25 9.96 8.20 16.31 14.73 13.38 3.94 4.03 4.06
22.11 20.82 19.79 5.65 5.73 5.89
10.96 8.98 8.22 7.47 7.45 7.28 1.62 1.59 1.60
.21 .21 .21
.24 .24 .23 75.76 73.74 68.87 6.05 6.23 6.21 5.10 5.27 5.55
20.45 19.38 18.78 31.60 30.88 30.54
107.36 104.62 99.41 30.36 36.84 24.98 20.43 20.72 20.27 9.93 16.12 4.71
75.76 73.74 68.87 6.05 6.23 6.21 5.10 5.27 5.55
20.43 20.72 20.27
3.11 3.39 2.50 6.58 6.52 6.44
27.03 27.88 25.36 10.88 10.63 10.74
154.94 154.38 145.94 17.22 -12.92 -21.55 30.38 35.50 23.49
5.04
24.67
^ Southeast includes Virginia. North Carolina, South Carolina, Georgia, Alabama, Tennessee, and Kentucky. Source: (52).
Table 14—Soybean production costs, Delta '
Item 1983 1984 1985
Do//ars per planted acre Cash receipts 158.68 154.29 122.50 Cash expenses:
Seed 7.67 10.78 10.00 Fertilizer 4.92 5.83 5.29 Lime and gypsum .41 .43 .40 Chemicals 20.82 19.17 18.19 Custom operations 4.89 4.98 5.12 Fuel, lube, and electricity 11.01 8.82 8.01 Repairs 7.20 7.21 7.10 Hired labor 1.58 1.56 1.54 Miscellaneous .86 .88 .87 Technical services .44 .44 .41
Total, variable expenses 59.80 60.09 56.93 General farm overhead 7.10 7.23 7.19 Taxes and insurance 4.69 4.99 5.18 Interest 14.48 18.36 17.69
Total, fixed expenses 26.27 30.58 30.06 Total, cash expenses 86.07 90.67 86.99
Receipts less cash expenses 72.61 63.62 35.51 Capital replacement 22.56 23.30 22.84 Receipts less cash expenses and replacement 50.05 40.32 12.67
Contint
12

Table 14—Soybean production costs, E>elta ^—Continued
Item 1983 1984 1985
Economic (full ownership) costs: Variable expenses 59.80 60.09 56.93 General farm overhead 7.10 7.23 7.19 Taxes and Insurance 4.89 4.99 5.18 Capital replacement 22.56 23.30 22.84 Allocated returns to owned inputs-
Returns to operating capital 2.39 2.82 2.09 Returns to other nonland capital 7.30 7.29 7.22 Net land rent 33.19 33.44 27.33 Unpaid lat)or 10.55 10.40 10.32
Total, economic costs 147.58 149.57 139.10 Residual returns to management and risk 11.10 4.72 -16.60 Total, returns to owned inputs 64.53 58.68
Dollars per bushel 30.36
Harvest-period price 7.86 6.20 Bushels per planted acre
5.01
Yield 20.20 24.88 24.47
^ Delta includes Mississippi. Louisiana, and Arkansas. Source: {52).
Table 15—Soybean production costs, Northern Plains ^
Item 1983 1984 1985
Cash receipts Cash expenses:
Seed Fertilizer Lime and gypsum Chemicals Custom operations Fuel, lut>e, and electricity Repairs Hired labor Miscellaneous
Total, variable expenses General farm overhead Taxes and insurance Interest
Total, fixed expenses Total, cash expenses
Receipts less cash expenses Capital replacement Receipts less cash expenses and replacement
Economic (full ownership) costs: Variable expenses General farm overhead Taxes and insurance Capital replacement Allocated returns to owned inputs-
Returns to operating capital Returns to other nonland capital Net land rent Unpaid labor
Total, economic costs Residual returns to management and risk Total, returns to owned inputs
Harvest-period price
Yield
185.69
6.11 3.26
.12 13.73 3.40 9.87 7.45 1.42
.04 45.40 11.26 11.20 32.57 55.03
100.43 85.26 20.44 64.82
45.40 11.26 11.20 20.44
1.59 7.78
56.86 9.50
164.03 21.66 97.39
7.98
23.27
Dollars per planted acre 125.65
8.97 2.68
.12 13.43 3.57 8.60 7.50 1.51
.04 46.42 11.87 11.73 31.92 55.52
101.94 23.71 20.57
3.14
46.42 11.87 11.73 20.57
1.84 7.69
37.78 10.10
148.00 -22.35
35.06 Dollars per bushel
5.83 Bushels per planted acre
21.56
151.45
7.43 2.50
.11 12.85 3.71 8.13 7.47 1.58
.04 43.82 12.11 12.43 31.53 56.08 99.90 51.55 20.45 31.10
43.82 12.11 12.43 20.45
1.37 7.70
42.30 10.57
150.75 .70
62.64
4.68
32.38
^ Northern Plains includes South Dakota, Nebraska, and Kansas. Source: (52).
13

lard which has declined from 10 percent of total fats and oils in 1960 to 3 percent in 1985/86. Also, palm oil use has increased in response to a favorable price differential in relation to soybean oil in the mid-1970's.
Total fats and oils consumed in salad and cooking oils increased 370 percent between 1960 and 1985/86. The share of soybean oil used in salad and cooking oils increased even faster, from 46 percent to 78 percent (table 22).
Fats and oils consumed in baking and frying fats in- creased 250 percent between 1960 and 1985/86. The amount of soybean oil used in baking and frying fats increased at a faster rate, resulting in the proportion of total fats and oils accounted for by soybean oil in- creasing from 51 percent to 62 percent.
Soybean oil, as a proportion of total fats and oils used in margarine, has remained around 80 percent since 1960. The amount of fats and oils consumed in margarine has increased nearly 40 percent.
Table 16—Soybean production costs, Lake States and Corn Belt ^
Item 1983 1984 1985
Dollars per planted acre
Cash receipts 239.93 183.28 183.15
Cash expenses: Seed 8.54 10.09 8.75 Fertilizer 6.20 6.90 6.13 Lime and gypsum .65 .65 .68 Chemicals 18.57 18.16 17.33 Custom operations 3.05 3.05 3.08 Fuel. lube, and electricity 10.04 8.15 7.25 Repairs 6.11 6.14 6.03 Hired labor 1.40 1.41 1.46 Miscellaneous .27 .27 .27 Technical services .11 .11 .10
Total, variable expenses 54.94 54.93 51.08
General farm overhead 12.57 12.89 12.80 Taxes and insurance 14.81 15.39 15.41 Interest 41.22 42.23 40.68
Total, fixed expenses 68.60 70.51 68.89
Total, cash expenses 123.54 125.44 119.98
Receipts less cash expenses 116.39 57.84 63.17 Capital replacement 26.81 25.85 25.35 Receipts less cash expenses and replacement 89.58 31.99 37.82
Economic (full ownership) costs: Variable expenses 54.94 54.93 51.08 General farm overhead 12.57 12.89 12.80 Taxes and insurance 14.81 15.39 15.41 Capital replacement 26.81 25.85 25.35
Allocated returns to owned inputs- Returns to operating capital 1.97 2.21 1.63 Returns to other nonland capital 9.03 8.79 8.71 Net land rent 83.77 67.48 60.52 Unpaid labor 9.34 9.44 9.77
Total, economic costs 213.24 196.98 185.28
Residual returns to management and risk 26.69 -13.70 -2.13 Total, returns to owned inputs 130.80 74.22
Dollars per bushel
78.50
Harvest-period price 7.99 6.04
Bushels per planted acre
4.84
Yield 30.01 30.33 37.88
^ Lake States are Minnesota, Wisconsin, and Michigan. Corn Belt includes Iowa. Missouri, Illinois, Indiana, and Ohio. Source: (52).
14

Overall, the fats and oils consumed in edible fats and oils products more than doubled between 1960 and 1985/86. The use of soybean oil in these products increased at a faster rate, going from 54 percent to 72 percent.
The dominant use of soybean oil is in salad and cooking oils, followed by baking and frying fats and margarine. In 1960, the use of soybean oil in salad and cooking oils ranked third behind the use in bak- ing and frying fats and margarine (table 23). Forty- seven percent of the soybean oil consumed in the United States is going into salad and cooking oils, compared with only 26 percent in 1960. This rise is offset by a decline in the proportion used in marga- rine (from 32 percent to 17 percent). The decline in proportional use in margarine reflects the slower growth in margarine consumption and the fact that
soybean oil became the dominant oil used in marga- rine before 1960.
Soybean oil use in inedible products has declined from 6 percent in 1960 to only 2 percent in 1985/86. Inedible uses include paint or varnish, fatty acids, and resins and plastics.
Soybean Prices
Soybean prices depend on the interaction of supply and demand in the marketplace as well as the ef- fects of Government programs. The weather, world demand for soybeans, changes in Government policy, and the value of the dollar in relation to other curren- cies, among other things, can upset the supply- demand balance, causing wide swings in soybean prices.
Table 17—Soybeans supply and use
Year^ Supply Crush Exports Other 2 Total use
Ending stocks
Million bushels
1955 396 282 69 24 375 21 1956 471 314 84 41 439 32 1957 515 351 88 33 472 43 1958 623 399 105 31 535 88 1959 621 394 140 35 569 52
1960 607 406 135 39 580 27 1961 706 432 149 47 628 78 1962 748 473 181 48 702 46 1963 745 437 187 54 678 67 1964 768 479 212 47 738 30
-1965 876 537 251 52 840 36 1966 964 559 262 53 874 90 1967 1,066 576 267 57 900 166 1968 1,273 606 287 53 946 327 1969 1.460 737 433 60 1,230 230
1970 1,357 760 434 64 1,258 99 1971 1,275 721 417 65 1,203 72 1972 1,343 722 479 82 1,283 60 1973 1,607 821 539 76 1,436 171 1974 1.387 701 421 77 1.199 188
1975 1,736 865 555 71 1,491 245 1976 1,534 790 564 77 1,431 103 1977 1,870 927 700 82 1.709 161 1978 2.030 1,018 739 97 1,854 176 1979 2,437 1,123 875 81 2.079 358
1980 2.156 1.020 724 99 1.843 313 1981 2,302 1.030 929 89 2,048 254 1982 2,444 1.108 905 86 2,099 345 1983 1,981 983 743 79 1.805 176 1984 2,037 1,030 598 93 1,721 316
1985 2,415 1.053 740 86 1.879 536 1986 2,476 1.179 757 104 2,040 436
Year beginning September 1. ^ Seed, feed, and residual. Source: (55).
15

Table 18—Soybean meal: Supply and disappearance
Supply Disappearance
Year
Stocks '
Production
Total Exports Domestic Total
beginning October 1
Total
For- Ending
Animal feed
Edible protein
Stocks
7,000 short tons
1960 1961 1962 1963 1964
83 78 94
159 122
9,452 10,342 11,127 10,609 11.286
NA NA NA NA NA
NA NA NA NA NA
9,536 10,420 11,221 10,768 11,408
590 1.064 1,475 1,479 2.036
8.867 9,262 9.586 9,167 9,265
9,457 10.326 11,061 10,646 11.301
78 94
159 122 106
1965 1966 1967 1968 1969
106 132 138 145 157
12,901 13.483 13.660 14,581 17.596
NA NA NA NA NA
NA NA NA NA NA
13,007 13,615 13,798 14,726 17,753
2,604 2,657 2,899 3.044 4,036
10,271 10,820 10,753 11.525 13,581
12,875 13.477 13.652 14,569 17,616
132 138 145 157 137
1970 1971 1972 1973 1974
137 146 192 183 507
18,035 17.024 16,709 19,674 16,702^
NA NA NA NA
16.436
NA NA NA NA
265
18,172 17,170 16,901 19,857 17,209
4,559 3,805 4.745 5,548 4,299
13,467 13,173 11,972 13.802 12.551
18,026 16.978 16.717 19.350 16,850
146 192 183 507 358
1975 1976 1977 1978 1979
358 355 228 243 267
20.754 18,488 22.371 24.354 27.105
20,395 18.100 21.961 23,986 26,808
359 388 410 368 297
21,112 18,843 22,599 24,597 27,372
5,145 4,559 6,080 6,610 7,932
15,612 14,056 16.276 17,720 19.214
20,757 18,615 22.356 24.330 27,146
355 228 243 267 226
1980 1981 1982 1983 1984
226 163 175 474 255
24,312 24,634 26,714 22.756 24.529
24,026 24,326 26,411 22.489 24,262
286 308 303 267 267
24,538 24,797 26.889 23,230 24,784
6,784 6,908 7.109 5,360 4,917
17,591 17,714 19,306 17,615 19,480
24,375 24,622 26,415 22,975 24,397
163 175 474 255 387
1985 1986
387 212
24,951 27,758
24,691 NA
260 NA
25,338 27,970
6.008 7,300
19.118 20.430
25.126 27.730
212 240
NA = not available. ^ Stocks at processor plants. ^ In January 1975. soybean crushers started reporting the breakdown of soybean meal production between that for animal feed and edible
protein. Source: (55, 64).
Table 19- Soybean meal consumed, by livestock class for selected yeare ^
Item 1965 1970 1975 1980 1981 1982 1983 1984 1985
Ml Ilion metric to ns
Dairy animals 1.0 1.0 1.6 1.5 1.5 1.6 1.5 1.7 1.7 Cattle on feed .4 .9 1.2 .6 .8 .9 .6 .8 .9 Other beef cattle .3 .6 .7 .8 .8 .9 .9 .7 .8 Hens, pullets, and
chickens raised 1.9 2.2 2.7 2.6 2.7 2.9 2.7 1.8 1.9 Broilers 1.4 1.9 2.4 3.3 3.3 3.5 3.4 4.0 4.1 Turkeys .6 .8 1.0 1.3 1.2 1.8 1.3 1.6 1.8 Hogs 3.3 4.3 5.1 4.9 5.2 5.4 4.4 4.6 5.2 Other .4 .5 .5 .6 .6 .6 .7 2.5 1.8
Total 9.3 12.2 15.2 15.6 16.1 17.6 16.5 17.7 18.2
^ Years beginning October 1. Source: (54).
16

Table 20—Soybean oil: Supply and disappearance
Year Supply Disappearance
boQinning Octoben
Beginning stocks
Productk)n Total Exports Domestic' Total Ending stocks
i M////on pounds
1960 308 4,420 4.728 7212 3.330 4,051 677
1961 677 4,790 5.467 1.309^ 3.540 4.849 618 1962 618 5,091 5,709 1.165^ 3.624 4,789 920
1963 920 4.822 5,742 1.106^ 4,058 5,164 578 1964 578 5,146 5.724 1.340^ 4,087 5,427 297
1965 297 5,800 6,097 923 4.712 5.635 462 1966 462 6.076 6,538 1.077 4.865 5.942 596
1967 596 6,032 6.628 963 5.125 6,088 540 1968 540 6,531 7,071 870 5.786 6,656 415 1969 415 7,904 8.319 1.419 6.357 7,776 543
1970 543 8.265 8.808 1,743 6.292 8,035 773
1971 773 7.892 8.665 1,398 6.482 7,880 785 1972 785 7,501 8.286 1.066 6,704 7.770 516 1973 516 8,995 9.511 1.436 7,280 8,716 794 1974 794 7,375 8.169 1.028 6,580 7,608 561
1975 561 9,630 10.191 976 7.964 8,940 1.251 1976 1.251 8,578 9.829 1,547 7.511 9.058 771 1977 771 10.288 11,059 2,057 8.273 10,330 729 1978 729 11.323 12.052 2,334 8.942 11,276 776 1979 776 12.105 12.881 2,690 8.891 11,671 1,210
1980 1,210 11.270 12.480 1,631 9.113 10,744 1,736 1981 1.736 10,979 12.715 2,077 9,536 11,612 1.103 1982 1,103 12,040 13.143 2,025 9,857 11,882 1.261 1983 1,261 10,872 12.133 1,824 9.588 11,412 721 1984 721 11,468 12.209 1.660 9,917 11.577 632
1985 632 11,617 12.257 1.257 10,053 11.310 947
' Includes shipments to U.S. territories. ^ Includes estimates off foreign donations off ffats and oils, not reported by the Bureau off the Census, 1960-64. Source: (55, 64).
Table 21 -Market share of selected fats and oils in edible oil products
Product I960 1965 1970 1975 1980/8 V 1984/85 1985/86
Percer It
Soybean oil Cottonseed oil Com oil
54 22
5
56 19 D
65 10 D
66 6 5
72 5 5
74 4 6
72 4 5
Peanut oil Urd
1 9
1 7
2 6
1 2
1 3
1 2
1 3
Edible talk>w 5 5 6 6 6 7 7
Coconut oil Palm oil Sunffk>wer oil
3 D
NA
3 D
NA
4 D
NA
4 7
NA
3 2 1
2 2 1
3 3 1
D « Bureau off the Census withhekj data to avoid disck>sing ffigures ffor individual companies. NA s Not available. ^ Census started reporting annual tables on a marketing year (Oct.-Sept.) basis in 1978/79. Source: (55, 65).
17

Table 22 Soybean oil consumed In end products and share of total fats and oils consumed 1
1960 1970 1975
Product Soybean oil
Share of total fats and oils
Soybean oil Share of total fats and oils
Soybean oil Share of total fats and oils
Million pounds Púrcent Million
pounds Percent Million pounds Percent
Baking and frying fats Salad and cooking oils Margarine Other products
Edible Inedible
1,169 887
1,105 27
3.188 218
51 46 81 10 54
5
2.182 2.470 1.409
38 6.099
223
61 73 79
8 65
4
2.025 3.031 1.568
22 6.646
184
54 76 82
5 66
4
Total 3.406 34 6.322 44 6,830 46
1980/81 ' 1984/85 1985/86
Soybean oil Share of total fats and oils
Soybean oil Share of total fats and oils
Soybean oil Share of total fats and oils
Million pounds Percent Million
pounds Percent Million pounds Percent
Baking and frying fats Salad and cooking oils Margarine Other products
Edible Inedible
2.675 4.226 1.666
43 8.610
202
63 80 82 11 72 4
3.654 4.800 1,589
129 10.172
251
67 80 83 34 74
5
3,440 4,686 1.735
138 10,004
280
62 78 85 35 72
5
Total 8.812 50 10.423 55 10,284 53
^ Bureau of the Census started reporting annual tables on a marketing year (Oct.-Sept.) basis in 1978/79. Source: {55, 65).
Historical Trends
Soybean prices followed a moderate upward trend through the 1960's, but prices increased sharply in the 1970's as the demand for exports grew dramati- cally. For example, average farm prices of soybeans rose from $2.13 per bushel for the 1960/61 marketing year to $2.85 for 1970/71 and to $7.57 per bushel for 1980/81 (table 24). Farm prices of soybeans have fluctuated in the 1980's, rising as high as $7.81 per bushel for 1983/84 while falling the following year to $5.78.
Marked year-to-year fluctuations have characterized price behavior since the early 1970's. Major forces contributing to the sharp price increases in the 1970's included foreign soybean crop failures, unfavorable weather in the United States, favorable exchange rates, and strong economic growth in importing coun- tries (53).
Seasonal Farm Prices. Soybean farm prices are usu- ally lowest in October, November, and December when the majority of the crop is harvested and then
Table 23—Proportion of soybean oil used in various edible oil products
Product 1960 1970 1975 1980/81 ' 1984/85 1985/86
Percent Bal<ing and
frying fats 34 35 30 30 35 34
Salad and cool(ing oils 26 39 44 48 46 47
Margarine 32 22 23 19 15 17 Other edible 1 1 2 2
products 1 2
^ Census started reporting annual tables on a marketing year (Oct.-Sept.) basis in 1978/79.
^ Less than 0.5 percent. Source: {55, 65).
rise throughout the marketing year. The monthly change in farm prices throughout the rest of the year usually reflects the carrying charge. The carrying charge includes the physical costs of storage, inter- est, taxes, insurance, and risk premiums (22). Changes in market information (for example, informa- tion concerning the size of the Brazilian soybean crop) will affect the current price and prices in subse- quent months of the marketing year.
18

Although prices are tied together by storage within the crop year, prices between crop years do not usu- ally reflect carrying charges. Thus, there is little eco- nomic incentive to hold stocks into the new crop year except for pipeline purposes; that is, for normal oper- ating inventories and quantities in transit.
Table 24 shows the intraseasonal price movements during marketing years 1960/61-85/86. Monthly prices generally rise over the marketing year by ap- proximately equal amounts; however, there are impor- tant exceptions. Marked changes in seasonal prices of soybeans occurred during most years of the 1970*s, reflecting the large shocks in foreign supply and export demand. The largest change occurred during the 1972/73 marketing year when soybean prices rose from $3.13 per bushel in October 1972 to a record high $10 in June 1973 (table 24). Prices fell the following month to $6.69 per bushel in response to the embargo placed by President Nixon on soy- bean exports (53).
Discounts and Premiums. Grade standards provide the market with a method of describing selected char-
acteristics of a quantity of soybeans (app. B). The market assigns values to these factors in the form of discounts and premiums. Price differentials are based on supply and demand conditions, costs in changing the grade, and estimated value of end use. Quality discounts may adjust to changing conditions and hence vary over time and between localities (26).
Price discounts are established for each factor and applied whenever a sample of soybeans fails to meet the quality of the base price grade. The base grade for soybeans is No. 1.
Hill found that price discounts vary from firm to firm and do not necessarily correspond to grade standards {26). Grade standards allow for 10 percent splits (soybeans with more than a fourth of the bean removed), but only one-third of the firms in Hiirs sur- veys reported discounts for splits. Firms compensate for moisture content above 13 percent by a combina- tion of shrink tables or discount as a percentage of price. Firms reported that they reduce the purchase price (dockage) when foreign material exceeds 1 percent.
Table 24— Monthly and annual U.S. average soybean prices received, by farmers
Year beginning Sept. Oct. Nov. Dec. Jan. F=èb. Mar. Apr. May June July Aug. Average ^
September 1
D ollars per bushel
1960/61 1.97 1.94 1.96 1.99 2.23 2.48 2.68 3.02 2.96 2.60 2.48 2.49 2.13 1961/62 2.24 2.20 2.27 2.30 2.32 2.32 2.34 2.38 2.36 2.34 2.35 2.33 2.28 1962/63 2.25 2.23 2.30 2.35 2.41 2.50 2.51 2.45 2.47 2.48 2.44 2.45 2.34 1963/64 2.44 2.56 2.66 2.58 2.65 2.57 2.55 2.45 2.36 2.35 2.34 2.35 2.51 1964/65 2.51 2.55 2.57 2.71 2.73 2.81 2.85 2.85 2.72 2.74 2.69 2.53 2.62
1965/66 2.35 2.31 2.36 2.48 2.67 2.77 2.71 2.78 2.90 3.04 3.37 3.49 2.54 1966/67 2.97 2.78 2.80 2.82 2.77 2.71 2.74 2.71 2.69 2.71 2.66 2.56 2.75 1967/68 2.53 2.44 2.43 2.48 2.53 2.57 2.57 2.56 2.58 2.54 2.52 2.51 2.49 1968/69 2.40 2.32 2.40 2.42 2.46 2.48 2.48 2.51 2.56 2.52 2.52 2.51 2.43 1969/70 2.28 2.23 2.30 2.30 2.36 2.40 2.42 2.48 2.52 2.60 2.72 2.65 2.35
1970/71 2.66 2.77 2.86 2.77 2.86 2.92 2.91 2.80 2.85 2.98 3.18 3.09 2.85 1971/72 2.95 2.96 2.84 2.93 2.92 3.00 3.20 3.37 3.35 3.32 3.34 3.36 3.03 1972/73 3.26 3.13 3.38 3.95 4.11 5.49 6.04 6.14 8.27 10.00 6.69 8.99 4.37 1973/74 5.81 5.63 5.14 5.65 5.87 6.07 5.96 5.15 5.21 5.13 6.11 7.55 5.68 1974/75 7.32 8.17 7.44 7.03 6.30 5.72 5.31 5.60 5.00 4.90 5.28 5.80 6.64
1975/76 5.32 4.92 4.45 4.28 4.46 4.50 4.46 4.52 4.87 6.16 6.73 6.07 4.92 1976/77 6.65 5.90 6.11 6.56 6.81 7.06 7.83 9.05 9.24 8.13 6.52 5.48 6.81 1977/78 5.17 5.28 5.61 5.68 5.75 5.53 6.20 6.49 6.77 6.69 6.40 6.21 5.88 1978/79 6.20 6.26 6.41 6.49 6.58 6.99 7.16 7.06 7.06 7.36 7.36 7.07 6.66 1979/80 6.81 6.35 6.30 6.27 6.39 6.20 5.94 5.63 5.76 5.91 6.75 7.18 6.28
1980/81 7.59 7.68 8.18 7.80 7.80 7.50 7.59 7.60 7.40 7.05 7.13 6.71 7.57 1981/82 6.21 6.06 6.03 6.00 6.13 6.04 5.99 6.17 6.27 6.12 5.99 5.59 6.04 1982/83 5.22 5.06 5.34 5.46 5.56 5.66 5.82 6.09 6.06 5.90 6.27 7.57 5.69 1983/84 8.28 7.96 7.81 7.75 7.85 7.28 7.68 7.83 8.12 7.99 6.95 6.50 7.81 1984/85 6.09 6.07 6.01 5.82 5.91 5.77 5.88 5.88 5.70 5.62 5.42 5.10 5.78
1985/86 4.99 4.85 4.92 5.01 5.16 5.18 5.23 5.23 5.25 5.19 5.11 4.99 5.04
^ Season average price received by farmers weighted by the estimated percentage of the crop sold each month. Source: (55, 61).
19

Despite variations in oil and meal content of soybeans, these factors are not included in grade standards. Prices paid for soybeans, however, are discounted in certain areas, such as the northern growing areas, because buyers know these soybeans usually contain less oil. Although these factors are not reflected in official grades, new quality standards reflecting oil and protein content may emerge as equipment is developed.
Regional Price Differences. Prices vary by region depending on local market conditions, quality of prod- uct, and transportation and handling costs. Regional price differentials are usually minor, although the prices in the Northern and Southern Plains (North and South Dakota, Nebraska, Kansas, Oklahoma, and Texas) tend to be lower than in other regions (table 25). In the 1985/86 marketing year, for exam- ple, farm prices of soybeans averaged $5.12 per bushel in the Delta, $5.05 in the Corn Belt, $4.92 in the Lake States, $5.04 in the Southeast, $5.19 in Ap- palachia, $4.71 in the Southern Plains, and $4.86 in the Northern Plains.
¡Market/Farm Price Reiationships. Soybean prices were relatively stable during the 1960's; however, the situation reversed during the 1970's when prices in-
creased sharply and fluctuated widely from year to year. The sharp upward trend in soybean prices be- ginning in 1970 followed 4 years of declining prices. F=ör example, cash prices at Illinois processors dropped from $2.91 per bushel in 1965 to $2.53 in 1969. But, after that decline, prices rose to $3.00 per bushel in 1970, $5.26 in 1975, and $7.86 in 1983 be- fore declining to $5.30 in 1985 (table 26). Season av- erage farm prices usually change in the same direc- tion as prices in the central market. However, the magnitude of the price changes differ from year to year, as evidenced by the variability in the market/ farm price spread. For example, the large spread in 1972 reflects the fact that dramatic price rises occurred in the latter portion of the year after most farmers had already sold their crop.
Soybean prices have exceeded price support loan rates for most years since soybeans first came under Government price supports. Nevertheless, the loan program has been used by soybean producers as a financial mechanism at harvesttime to obtain cash. The producers can redeem their loans prior to matu- rity and take advantage of market prices higher than the loan value. In the event of an unexpected price decline, producers can forfeit their soybeans to the Commodity Credit Corporation (CCC).
^ Average of States within region. ^ Year beginning September 1. ^ Season average price received by farmers weighted by the estimated percentage of the crop sold each month. Source: {50).
Table 25—Season average price of soybeans received, by farmers by region '
Year 2 Uke states
Corn Belt Southeast Delta Southern
Plains Northern
Plains Appalachia United States ^
Don ars per bushel
1965/66 2.56 2.55 2.47 2.48 2.28 2.44 2.45 2.54 1966/67 2.71 2.75 2.82 2.81 2.64 2.65 2.79 2.75 1967/68 2.47 2.50 2.50 2.50 2.37 2.43 2.45 2.49 1968/69 2.39 2.42 2.45 2.45 2.31 2.36 2.42 2.43 1969/70 2.35 2.34 2.38 2.39 2.18 2.25 2.34 2.35
1970/71 2.79 2.85 2.89 2.89 2.64 2.74 2.86 2.85 1971/72 3.06 3.04 2.91 3.02 2.89 2.97 2.93 3.03 1972/73 4.54 4.41 3.98 4.07 4.18 4.27 4.07 4.37 1973/74 5.64 5.72 5.66 5.67 5.27 5.50 5.55 5.68 1974/75 6.31 6.63 6.96 7.01 6.55 6.28 6.80 6.64
1975/76 4.89 5.00 4.66 4.76 4.38 4.88 4.56 4.92 1976/77 7.05 6.89 6.68 6.44 6.28 6.74 6.95 6.81 1977/78 5.63 5.82 5.97 6.04 5.35 5.68 5.95 5.88 1978/79 6.60 6.71 6.70 6.63 6.33 6.54 6.69 6.66 1979/80 5.82 6.22 6.40 6.41 5.95 5.91 6.40 6.28
1980/81 7.32 7.57 7.74 7.68 7.52 7.22 7.84 7.57 1981/82 5.90 5.14 6.14 6.25 5.70 5.72 6.15 6.04 1982/83 5.63 5.70 5.50 5.70 5.30 5.51 5.65 5.69 1983/84 7.69 7.88 7.83 7.83 7.52 7.60 7.87 7.81 1984/85 5.60 5.78 6.05 6.00 5.55 5.57 5.97 5.78
1985/86 4.92 5.05 5.04 5.12 4.71 4.86 5.19 5.04
20

Soybean Pricing System
The pricing system incorporates three important char- acteristics of soybeans and soybean products in the market process (27, p. 54):
• Soybean meal and oil are joint products of the soybean crushing industry, yet there is very little year-to-year change in the quantity of meal and oil produced from a bushel of beans.
• Soybeans, as well as the meal and oil compo- nents, have domestic use, export, and inventory demand components. Except for small quanti- ties used for seed and feed, the domestic soy- bean use is for crushing.
• The prices of soybeans, meal, and oil and the allocation of available supplies among market alternatives are simultaneously determined due to the joint-product relationship.
The pricing system for soybeans is complex because it involves interactions between the markets for soy-
beans, soybean oil, and soybean meal {1, 41, 42). The intersection of total soybean demand and total soybean supply determines the price of soybeans. The total supply of soybeans is simply the current year's production plus carryin stocks from earlier years. But, underlying total soybean demand are de- mands for crushing (to produce oil and meal), exports, and stocks of soybeans. Underlying the de- mand for crushing are the demands for soybean oil and meal. There are domestic use, export, and stock demands for both soybean oil and soybean meal. The domestic use demand for soybean oil is affected by the prices of competing vegetable oils and animal fats. The domestic demand for soybean meal depends upon the livestock feed demand and the prices of competing protein meals. Prices of soybean oil and meal are linked in the crush sector, where the supplies of soybean oil and soybean meal are deter- mined by the quantity of soybeans crushed. Higher soybean oil and meal prices increase the total de- mand for soybeans, but these higher prices simulta- neously reduce the market demands for oil and meal.
Relationships to Other Pricing Systems
Table 26—Annual market/farm price relationships for soybeans
Average Season Price Market/farm Year' cash market
price ^ average
farm price support loan rate
price spread
Dollars pi >r bushel
1965/66 2.91 2.54 2.25 0.37 1966/67 2.86 2.75 2.50 .11 1967/68 2.61 2.49 2.50 .12 1968/69 2.55 2.43 2.50 .12 1969/70 2.53 2.35 2.25 .18
1970/71 3.00 2.85 2.25 .15 1971/72 3.24 3.03 2.25 .21 1972/73 6.22 4.37 2.25 1.85 1973/74 6.12 5.68 2.25 .44 1974/75 6.33 6.16 2.25 .17
1975/76 5.26 5.06 3 .20 1976/77 7.33 7.11 2.50 .22 1977/78 6.14 5.88 3.50 .26 1978/79 7.11 6.66 4.50 .45 1979/80 6.51 6.28 4.50 .23
1980/81 7.67 7.57 5.02 .10 1981/82 6.26 6.04 5.02 .22 1982/83 6.12 5.65 5.02 .47 1983/84 7.86 7.81 5.02 .05 1984/85 5.98 5.78 5.02 .20
1985/86 5.30 5.04 5.02 .26
' Year beginning September for soybeans and October for price support loan.
^ No. 1 Yellow soybeans, Illinois processor. ^ Price support loans were not authorized in 1975. Source: (55).
The pricing system for soybeans is closely linked to pricing systems for other oil crops and animal fats through the close substitutability of soybean oil with other fats and oils and soybean meal with other pro- tein meals. Other factors which affect the price of soybeans are macroeconomic factors such as interest rates, exchange rates, and Government programs for other commodities.
The Market for Fats and Oils. The vegetable oil and animal fats market is large and complex. Soybean oil is the dominant oil in this market but it competes with many other vegetable oils and animal fats (76, 20, 23, 36, 39, 40, 69, 73). The soybean oil link to the pricing systems of other vegetable oils comes mainly through the demand for bulk refined edible oil (10, 11). A mi- nor amount of soybean oil is used for industrial proc- esses or products, but this demand is largely inde- pendent of other oils. Another demand for soybean oil might be classified as refined oil demand for specific uses. Manufacturers use ingredient and price formu- las to produce end products such as baking and fry- ing fats, cooking and salad oils, and margarine and other spreads. These formulas often call for certain amounts of several different refined oils in fairly fixed portions, reflecting complementarity among the oils for these specific demands within a given product (66). Once the specific formula demands have been fulfilled for a product, the rest of the refined edible oil demand can be met by any minimum quality refined oil. This demand can be classified as the bulk or price-sensitive market for refined oil. Oils entering this
21

highly competitive marl^et are substitutes for each other. Thus, the demand for soybean oil use in the domestic market can be broken into bulk markets, markets for specific industrial uses, and markets for specific refined uses.
Analysis of the relationship among various vegetable oils found that prices for soybean oil, cottonseed oil, and, to a lesser extent, peanut oil, were highly related to one another. Soybean oil and cottonseed oil are abundant enough in the United States to satisfy their specific demands and still leave adequate quantities to compete in the bulk market. Coconut oil, palm oil, and rapeseed oil prices were only slightly related to the rest of the oils (77).
Fryar analyzed the relationship of the U.S. and Euro- pean vegetable oil markets (70). Using three different measures of integration between the markets—aver- age prices, correlation and coherency squared, and elasticity of price transmission—he found that the U.S. and European markets for soybean oil, cotton- seed oil, peanut oil, and coconut oil appear to be highly integrated, especially for annual or longer inter- vals. He found that the U.S. and European markets for palm oil and coconut oil were only moderately in- tegrated.
The Market for Protein Meal. A similar approach also illustrates the interrelationship of the soybean meal pricing system with other meal pricing systems (67). Soybean meal is used mainly as high-protein livestock feed, with only minor amounts currently be- ing used as protein products for human consumption. Feed rations usually include a certain amount of soy- bean meal because of the favorable amino acid con- tent. Once this specific demand is met, the rest of the soybean meal competes in the bulk market as a pro- tein source. Wendland and Hoskin found that, in the short run (less than 3 months), livestock producers do very little substitution between soybean meal and cot- tonseed, fish, and sunflowerseed meals {67), When price changes last longer than 3 months, users of meal become more sensitive to the prices of soybean, cottonseed, fish, and meat meal.
Response to Macroeconomic Factors. Soybean prices are affected by a variety of external factors in- cluding exchange rates, interest rates, and Govern- ment programs for competing crops. Exchange rates affect the local price paid by importing countries (5, 13, 70). If the value of the dollar increases in relation to a local currency, the relative price of U.S. soybeans rises proportionately. Recent estimates suggest that a 10-percent devaluation in the value of the dollar could cause U.S. soybean exports to rise as much as 7.8 percent (5).
Interest rates affect production and storage decisions. A rise in interest rates increases the cost of borrowing capital, hence raising production costs. Lowry and others have demonstrated how an increase in interest rates can affect the intraseasonal storage pattern of soybeans (37). A rise in interest rates will cause more soybeans to be marketed early in the year, thus low- ering prices early in the season and raising them at the end.
Soybeans compete for acreage with other crops in- cluding corn and cotton (8, 72, 74, 35, 68). Changes in Government programs for these crops can cause farmers to shift their acreage from soybeans to corn or cotton (or vice versa). Lee and Helmberger have shown how soybean producers in the Corn Belt are affected as much by the price support and deficiency payment programs for corn as they are by soybean prices (35).
Value of Soybean Products
The value of soybeans depends on their oil and meal content and the price of these two products. The oil and protein contents of soybeans are inversely re- lated. Soybeans having a higher percentage of oil will generally have a lower percentage of protein and vice versa. In the United States, the oil content tends to increase while the protein content tends to decrease as soybeans are grown in progressively warmer cli- mates {29, 44). The oil and meal content of soybeans varies not only from region to region, but also from State to State and even from farm to farm because of differences in both geography and cultivation prac- tices.
The amount of meal obtained from processing a bushel of soybeans greatly exceeds the amount of oil. Since 1975, meal yields have averaged more than 3.4 times that of oil. During 1985/86, for example, na- tional oil yields averaged 11.01 pounds per bushel of soybeans compared with 47.27 pounds of meal. How- ever, during the same period, soybean oil averaged 18.7 cents a pound compared with only 7.6 cents a pound for soybean meal (table 27). Oil usually sells at a higher price per pound than meal. Since 1975, soy- bean oil has accounted for, on average, 38.2 percent of the total product value obtained from a bushel of soybeans, and soybean meal has accounted for 61.8 percent of the value. For most other oilseeds, the meal represents a much smaller percentage of the total value for two reasons: first, most oilseeds con- tain a higher percentage of oil than the 18 percent in soybeans and, second, soybean meal commands a higher price than other oilseed meals because of its higher protein content (44 percent) and higher quality of protein.
22

Oil yield per bushel of soybeans grew from 8.5 pounds in 1932 to 9.5 pounds in 1947 and 11.0 pounds in 1953, where it has remained. This upward trend resulted primarily from changing processing techniques from hydraulic presses to screw presses and then to using a solvent to extract the oil. The in- crease was also partly due to the development and cultivation of soybeans containing greater quantities of oil.
Despite this trend of obtaining more oil from soybeans crushed, which means a lower yield of meal per bushel, the value of the meal has increased more than the oil. During 1940-49, soybean oil and soybean meal each contributed about 50 percent of the value of soybeans. By 1969, the values of soy- bean oil and meal were about 40 and 60 percent, re- spectively, and they remained near these levels through the 1970's. During the early 1980's, the value of oil declined to about one-third and meal increased to two-thirds. This change in the value of soybean products was caused by the greatly increased pro-
duction of oils (particularly palm oil) in the edible oils market and the large displacement of fats and oils for industrial uses by petroleum-based synthetics. Other factors included increased demand and higher prices for protein meals to feed the increased number of livestock more nutritionally balanced diets. The value of oil rose to over 50 percent in 1984/85, but then de- creased. A world surplus of edible oils and a strong demand for soybean meal during the 1986/87 market- ing year caused the value of soybean meal to rise to 70 percent of the total value.
Pfocessing Margins
The difference between the value of soybean prod- ucts and the price of soybeans is called the process- ing margin. Spot (cash) processing margins fluctuate widely A number of factors influence these margins. The buying practices of the processor depend partly on the processor's buying area. Also, the price the processor pays for soybeans varies considerably ac- cording to location, size of the mill, and the extent of
Table 27—Annual value of products per bushel of soybeans processed and spot price spread
Value of products per bushel Share of total value Price * No. 1
YeJIow
Spread between value of products
and soybean price Year^ Soybean oil Soybean meal Total
value Soybean oil
Soybean meal Yield 2 Price 3 Value Yield 2 Price ^ Value
Pounds
10.69
Genfs
11.8
Dollars
1.26
Pounds
47.53
Cents
4.02
Dol
1.91
fnr^. .. . . Onw^AM* —Dollars
0.26 1965/66 3.17 40 60 2.91 1966/67 10.70 10.4 1.11 47.66 3.98 1.90 3.01 37 63 2.86 .15 1967/68 10.57 8.6 .91 47.71 3.82 1.82 2.73 33 67 2.61 .12 1968/69 10.61 8.2 .87 47.43 3.76 1.67 2.66 33 67 2.55 .11 1969/70 10.66 11.0 1.17 47.36 3.89 1.84 3.01 39 61 2.53 .48
1970/71 10.83 12.8 1.38 47.39 3.96 1.88 3.26 43 58 3.00 .26 1971/72 10.98 11.5 1.26 47.43 4.36 2.07 3.33 38 62 3.24 .09 1972/73 10.59 15.2 1.62 47.04 11.03 5.19 6.81 24 76 6.22 .59 1973/74 10.76 30.2 3.25 47.18 7.61 3.59 6.84 48 52 6.12 .72 1974/75 10.51 32.1 3.37 47.48 6.56 3.12 6.49 52 48 6.33 .16
1975/76 10.94 18.5 2.02 47.27 7.20 3.40 5.42 37 63 5.26 .16 1976/77 11.09 24.1 2.67 47.81 10.14 4.85 7.52 36 64 7.33 .19 1977/78 10.88 23.8 2.59 47.33 8.13 3.85 6.44 40 60 6.14 .30 1978/79 11.06 27.0 2.99 47.51 9.40 4.47 7.46 40 60 7.11 .35 1979/80 10.74 24.6 2.64 48.01 8.90 4.27 6.91 38 62 6.51 .40
1980/81 11.09 23.3 2.58 47.93 11.09 5.32 7.90 33 67 7.67 .23 1981/82 10.72 19.1 2.04 47.86 9.25 4.43 6.47 32 68 6.26 .21 1982/83 10.76 19.2 2.07 47.88 9.06 4.33 6.40 32 68 6.12 .28 1983/84 11.26 31.1 3.50 47.36 9.78 4.63 8.13 43 57 7.86 .27 1984/85 11.05 30.0 3.31 47.15 6.33 2.99 6.30 53 47 5.98 .32
1985/86 11.01 18.7 2.06 47.27 7.60 3.59 5.65 36 64 5.30 .35
^ Year beginning September 1. ^ Actual production of oil and meal as calculated from Bureau of the Census reports. ^ Simple average of monthly cash prices per pound using the following quotations: soybean oil, crude, tank cars, f.o.b. Decatur, IL; soybean
meal, bulk, 44-percent protein, Decatur, IL. ^ Simple average of monthly prices, Illinois processors. Source: {55).
23

competition for soybean purchases. Another factor which varies widely among mills is product yields from a bushel of soybeans. The total net value of products from a bushel of soybeans depends not only on product yields but also on transportation costs to the markets and the sales price of soybean products which reflects conditions at the time of sale (4),
The annual average processing margin (based on spot prices) varied between 9 cents per bushel in 1971/72 and 72 cents in 1973/74 (table 27). The aver- age margin for the decade was 32 cents per bushel, double the average for the decade of the 1960's. Low processing margins generally reflect excess crushing capacity. In the mid-1980's, a processing margin of less than 15 cents per bushel has been considered unprofitable.
Soybean processors attempt to "lock in," through use of the futures market, as much crush as possible when processing margins are favorable and as little as possible when margins are unfavorable. When the demand for soybean oil and meal is greater than pro- duction and the supply of soybeans is ample, soybean products sell high in relation to the cost of soybeans. This relationship means good processing margins and gives the processor a strong incentive to crush. Con- versely, if the demand for soybean oil or soybean meal or both is weak or if soybeans are in short sup- ply, the processing margins will probably be poor, re- ducing the incentive to crush. The seasonal pattern of soybean prices favors crush at the beginning of the crop year when soybean prices are low and the de- mand for millfeeds is high (due to colder weather, lack of grazing, and increased animal feed requirements). As the crop year progresses, the incentive to crush declines because of rising soybean prices and the weakening of the demand for millfeeds (6).
Futures and Options Markets
The price of soybeans fluctuates widely during a pro- duction season. This price variability places produc- ers in a risky and uncertain position with respect to expected income. If prices drop significantly before the crop can be sold, the producer may face substan- tial financial losses.
Futures, options, and cash forward contracts enable farmers to reduce the risk that the price they receive for their crop might not cover the cost of their inputs. A futures contract specifies a standard grade of the commodity which must be delivered in fulfillment of the contract at some future date. In an option con- tract, the seller grants the buyer the right, for a lim- ited period of time, to buy or sell a futures contract at a set price. The buyer pays a premium for this right
but incurs no obligation. Both futures and options contracts can be canceled any time before they ma- ture through offsetting trades on the exchange. For- ward commitments executed outside of organized commodity exchanges are called cash forward con- tracts and often are based on an underlying futures or option contract (45).
The primary U.S. market for trading soybean futures and options contracts is the Chicago Board of Trade (CBT). Soybean futures have been traded continu- ously on the CBT since 1947. Futures trading in soy- bean oil began in 1950 with soybean meal added in 1951 (70). Options trading for soybean futures began in late 1984. The Commodity Futures Trading Com- mission approved trading of options for soybean oil and meal futures in 1986. Soybean futures and op- tions contracts are also traded at the MidAmerica Commodity Exchange (MCE). Although more than 95 percent of the average daily volume is traded at the CBT, the MCE offers small lot contracts (1,000 bush- els) to traders who may not produce enough to fulfill the terms of a 5,000-bushel contract at the CBT. The delivery months for futures and options contracts for soybeans are January, March, May, July, August, September, and November. Delivery months for soy- bean oil and meal are January, March, May, July, Au- gust, September, October, and December.
Marketing Strategies
Sharp fluctuations in soybean prices during the last decade have heightened producer interest in alterna- tive methods and strategies that may be used to es- tablish the price of their production. This section sum- marizes the methods used by producers to establish the price in 21 major soybean-producing States. The data are from surveys of soybean producers in the spring of 1983 and 1984 (54, 1984). The marketing season for each crop year provides some unique pric- ing opportunities depending upon expectations con- cerning supply and demand conditions for a particu- lar crop. Therefore, caution must be exercised in comparing survey data from Southern States (1982 crop) with those from Midwestern States (1983 crop) and in comparing these survey findings with current marketing opportunities (table 28).
Marketing Methods
Producers participating in the surveys were asked about the disposition of the crop harvested the previ- ous fall. First, they were asked how many bushels they sold directly from the field to a buyer who pro- vided transportation. Second, they were asked how many bushels they delivered to off-farm destinations
24

(such as elevators or processors) at harvest and what disposition was made of those deliveries. Third, they were asked how many bushels were stored onfarm following harvest and what proportion of that total had been sold before the survey was conducted in the spring.
Pricing Arrangements
Producers who indicated that soybeans had been sold directly from the field, sold at time of delivery to an off-farm destination, or sold from onfarm storage facilities were asked to identify the pricing arrange- ment used to establish the price received. Producers specified the percentage of each type of sale they priced through (1) cash fonvard, (2) cash market of- fers, and (3) deferred pricing contracts.
The cash forward contract arranges the quantity to be delivered and the price that will be received in ad- vance of the delivery date. These contracts may spec-
Table 28—Proportion of soybean crop sold directly from the field and pricing arrangement used ^
Region Proportion of crop
sold infield
Pricing arrangement
and State Cash fonft^ard
contract Cash
bid Deferred pricing
Midwestern States: Percent
Illinois 1.3 8.0 92.0 — Indiana 2.2 14.8 85.2 — Iowa 1.3 47.5 42.1 10.4 Kansas 1.4 — 100.0 — Michigan Minnesota
2.7 2.0
100.0 92.1
— 7.9
Missouri 0 — — — Nebraska 3.2 24.5 75.5 — Ohio 0 — — — South Dakota .2 100.0 — — Wisconsin 6.8 69.6 30.4 —
11 States 1.5 38.7 58.3 3.0
Southern States:
Alabama 6.1 — 100.0 — Arkansas 4.2 17.2 56.7 26.1 Georgia 18.9 12.8 81.5 5.7 Kentucky Louisiana
0 10.8 25.9 71.1
—
Mississippi North Carolina
8.0 14.0
14.5 85.3 100.0
.2
South Carolina 10.7 — 100.0 — Tennessee 5.2 33.0 33.0 34.0 Virginia
10 states 3.4 8.4
50.0 14.2
50.0 80.1 5.7
21 states 3.4 22.1 73.1 4.8
— = Not used. ^ Producers in the Midwestern States and Kentucky were contacted
during the spring of 1984 concerning the marketing of the 1983 crop. Producers in other Southern States were contacted during the spring of 1983 concerning the marketing of their 1982 crop.
ify delivery from the field at harvest or from farm stor- age at a later date. The cash market offer is the tradi- tional arrangement where the producer accepts the buyer's offer or bid price on the date the soybeans are delivered and title is transferred to the buyer. Un- der a deferred pricing contract, the producer delivers the soybeans and transfers title to the buyer but de- fers the establishment of a price until a later date.
Deferred pricing contracts are generally accomplished through one of two ways (77). A deferred pricing con- tract specifies the price received will be the cash market price offered by the buyer, less a specified service charge, on the day the producer chooses to price the soybeans. The buyer receives title to the soybeans on the day the contract is drawn. A second method involves a "basis" contract where the price will be the price of a specified futures contract at the time chosen by the seller, minus the basis that exists at the time the contract is drawn. A basis is the differ- ence between the price for a futures contract and the price for the same or similar commodity for spot de- livery at a particular location (46). Again, the buyer receives title to the soybeans when the contract is drawn. The seller usually receives about 80 percent of the cash price at the time of delivery, with final settlement at the time the seller elects to price the soybeans.
Pricing Soybeans Sold Directly from the Field
When soybeans are sold directly from the field, the buyer sends a truck to the field and takes title to the soybeans when they are transferred from the com- bine. The proportion handled by this arrangement ranged from zero in Kentucky, Missouri, and Ohio to a high of 19 percent in Georgia (table 28). Selling di- rectly from the field was more common in the South- ern States.
The cash market offer was the most popular pricing arrangement in 11 States and was more common in the Southern States. Cash forward contracts were the predominant pricing arrangement in five States and were generally more common in Midwestern States. Deferred pricing contracts were used to price more than 25 percent of the soybeans sold directly from the field in Arkansas and Tennessee. Producers in only six States used deferred pricing contracts to es- tablish the price for soybeans sold directly from the field.
Pricing Soybeans Delivered Off-Farm at Harvest
Delivery to off-farm destinations was the predominant handling method in all Southern States, and Arkan-
25

sas producers delivered over 90 percent of production at harvest (table 29). In contrast, producers in 5 of the 11 Midwestern States delivered less than 50 percent of their 1983 production to off-farm destinations at harvest.
Producers who delivered soybeans off farm at harvest were asked what proportion was sold at time of deliv- ery (table 29). Producers in Southern States generally sold a larger proportion of harvesttime deliveries than did their counterparts in the Midwest. Producers in Iowa, Kansas, and Nebraska sold at delivery less than half of the soybeans delivered to off-farm desti- nations. Producers who sold soybeans at delivery also provided information on how those sales were priced (table 29). These data show substantial varia- tion among States in the extent to which different pricing arrangements were used. The cash market bid was the predominant pricing arrangement in all
Table 29—Proportion of soybean crop delivered off-farm at harvest, proportion sold at time of delivery, and
pricing arrangement used ^
Region and
State
Proportion of crop
delivered off farm
Proportion sold at time of delivery
Pricing arrangement
Cash fonivard contract
Cash bid
Deferred pricing
Midwestern States: PB rcent
lllinois 44.5 55.8 51.4 46.7 1.9 Indiana 38.1 79.6 38.8 58.7 2.5 Iowa 48.6 42.9 41.7 55.0 3.3 Kansas 69.8 43.4 11.2 88.8 — Michigan 82.6 62.6 48.6 47.0 4.4 Minnesota 39.2 54.3 52.3 38.1 9.6 Missouri 52.8 69.9 24.4 72.5 3.1 Nebraska 57.1 45.3 35.3 54.5 10.2 Ohio 59.3 59.9 43.9 48.6 7.5 South Dakota 66.1 83.0 31.3 67.6 1.1 Wisconsin 40.2 64.1 30.5 61.4 8.1
11 states 48.8 56.9 40.9 55.5 4.1
Southern states:
67.9 88.1 3.6 94.7 1.7 Arkansas 90.6 55.5 5.6 91.8 2.7 Georgia 53.5 78.0 10.8 84.1 5.1 Kentucky 53.9 81.5 32.1 62.1 5.8 Louisiana 58.5 64.5 7.8 78.3 13.9 Mississippi 69.8 64.4 14.2 74.0 11.8 North Carolina 60.0 79.7 — 99.4 .6 South Carolina 54.5 65.6 — 93.5 6.5 Tennessee 63.1 89.2 23.7 75.3 1.0 Virginia 72.3 69.2 2.8 92.5 4.7
10 states 66.4 70.7 10.5 84.0 5.5
21 states 53.6 61.3 29.2 66.1 4.7
— = Not used. ^ Producers in the Midwestern States and Kentucky were contacted
during the spring of 1984 concerning the marketing of the 1983 crop. Producers in other Southern States were contacted during the spring of 1983 concerning the marketing of their 1982 crop.
States except Illinois, Michigan, and Minnesota, and producers in those three States priced about half of the harvesttime sales using cash forward contracts. In contrast to producers in other Midwestern States, Kansas producers priced a significantly smaller pro- portion of harvesttime sales with cash forward con- tracts. Furthermore, Kansas was the only State where deferred pricing contracts were not used to price har- vesttime sales.
Producers in North Carolina and South Carolina did not use cash forward contracts to price soybeans in 1982/83. The greater reliance on cash market bids to establish prices in the Southern States may reflect greater involvement of cooperatives in the marketing of soybeans in several of those States. Kentucky and Tennessee were the only Southern States where cash forward contracting accounted for more than 20 per- cent of the volume sold at time of delivery at harvest- time.
Pricing Soybeans Sold from Onfarm Storage
At the time the surveys were conducted in the spring of 1983 and 1984, the pricing and marketing of the crop harvested the preceding fall were incomplete. The surveys were conducted around April 1 each year, so about 5 months of the marketing season re- mained (April-August).
The extent to which producers in various States use onfarm storage in their marketing plan is influenced by the number of farms that have storage facilities suitable for storing soybeans, and the prospects for price gains as the upcoming marketing season progresses. The share of production stored onfarm ranged from a low of about 5 percent in Arkansas to a high of almost 61 percent in Minnesota (table 30). Except in Michigan, many soybean producers in the Midwest owned onfarm storage facilities. Those pro- ducers relied more heavily on farm storage as a mar- keting and pricing strategy and generally stored a larger share of production at harvesttime.
The amount of farm-stored soybeans that had been sold before the springtime surveys varied greatly by State, ranging from 14 percent in Tennessee to 72 percent in Louisiana. Less than 50 percent of the quantity stored had been sold in 15 of the 21 States where surveys were conducted.
The strategy used to price soybeans sold from on- farm storage also varied greatly (table 30). Producers in all Midwestern States, except Kansas, used cash forward contracting extensively in pricing farm-stored soybeans; it was the predominant pricing arrange- ment in 6 of the 11 Midwestern States. In contrast.
26
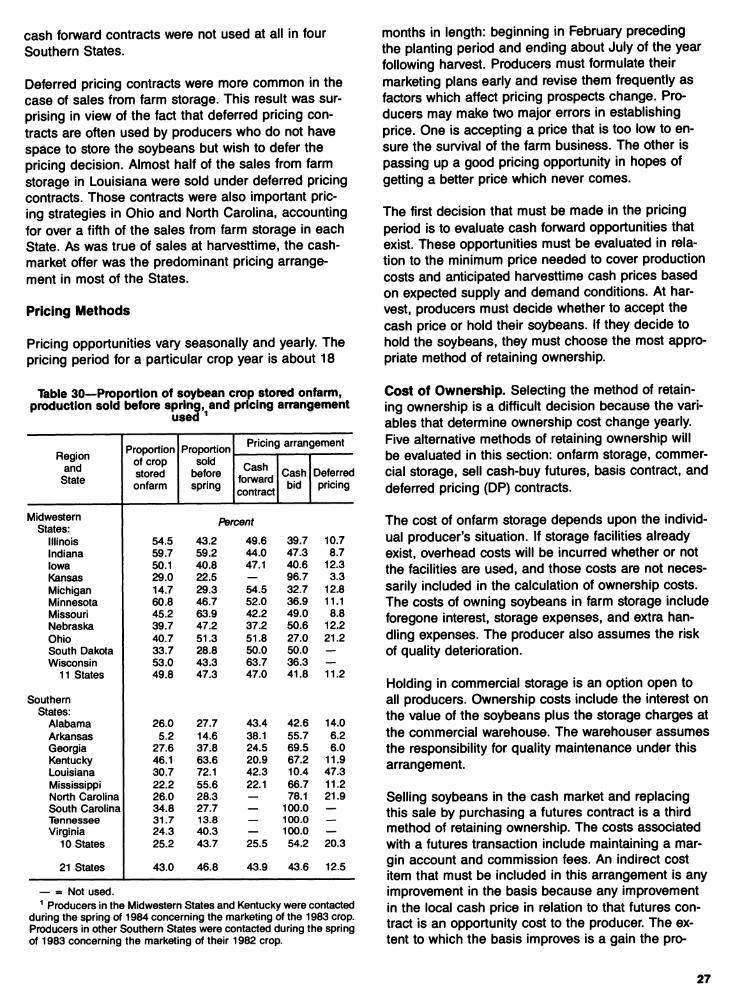
cash forward contracts were not used at all in four Southern States.
Deferred pricing contracts were more common in the case of sales from farm storage. This result was sur- prising in view of the fact that deferred pricing con- tracts are often used by producers who do not have space to store the soybeans but wish to defer the pricing decision. Almost half of the sales from farm storage in Louisiana were sold under deferred pricing contracts. Those contracts were also important pric- ing strategies in Ohio and North Carolina, accounting for over a fifth of the sales from farm storage in each State. As was true of sales at harvesttime, the cash- market offer was the predominant pricing arrange- ment in most of the States.
Pricing Methods
Pricing opportunities vary seasonally and yearly. The pricing period for a particular crop year is about 18
Table 30—Proportion of soybean crop stored onfarm, production sold before spring, and pricing arrangement
used ^
Region and
State
Proportion of crop stored onfarm
Proportion sold
before spring
Pricing arrangement
Cash forward contract
Cash bid
Deferred pricing
Midwestern Per cent states:
Illinois 54.5 43.2 49.6 39.7 10.7 Indiana 59.7 59.2 44.0 47.3 8.7 Iowa 50.1 40.8 47.1 40.6 12.3 Kansas 29.0 22.5 — 96.7 3.3 Michigan 14.7 29.3 54.5 32.7 12.8 Minnesota 60.8 46.7 52.0 36.9 11.1 Missouri 45.2 63.9 42.2 49.0 8.8 Nebraska 39.7 47.2 37.2 50.6 12.2 Ohio 40.7 51.3 51.8 27.0 21.2 South Dakota 33.7 28.8 50.0 50.0 — Wisconsin 53.0 43.3 63.7 36.3 —
11 states 49.8 47.3 47.0 41.8 11.2
Southern states:
Alabama 26.0 27.7 43.4 42.6 14.0 Arkansas 5.2 14.6 38.1 55.7 6.2 Georgia 27.6 37.8 24.5 69.5 6.0 Kentucky 46.1 63.6 20.9 67.2 11.9 Louisiana 30.7 72.1 42.3 10.4 47.3 Mississippi 22.2 55.6 22.1 66.7 11.2 North Carolina 26.0 28.3 — 78.1 21.9 South Carolina 34.8 27.7 — 100.0 — Tennessee 31.7 13.8 — 100.0 — Virginia 24.3 40.3 — 100.0 —
10 States 25.2 43.7 25.5 54.2 20.3
21 States 43.0 46.8 43.9 43.6 12.5
— = Not used. ^ Producers in the Midwestern States and Kentucky were contacted
during the spring of 1984 concerning the marketing of the 1983 crop. Producers in other Southern States were contacted during the spring of 1983 concerning the marketing of their 1982 crop.
months in length: beginning in February preceding the planting period and ending about July of the year following harvest. Producers must formulate their marketing plans early and revise them frequently as factors which affect pricing prospects change. Pro- ducers may make two major errors in establishing price. One is accepting a price that is too low to en- sure the survival of the farm business. The other is passing up a good pricing opportunity in hopes of getting a better price which never comes.
The first decision that must be made in the pricing period is to evaluate cash forward opportunities that exist. These opportunities must be evaluated in rela- tion to the minimum price needed to cover production costs and anticipated harvesttime cash prices based on expected supply and demand conditions. At har- vest, producers must decide whether to accept the cash price or hold their soybeans. If they decide to hold the soybeans, they must choose the most appro- priate method of retaining ownership.
Cost of Ownership. Selecting the method of retain- ing ownership is a difficult decision because the vari- ables that determine ownership cost change yearly. Five alternative methods of retaining ownership will be evaluated in this section: onfarm storage, commer- cial storage, sell cash-buy futures, basis contract, and deferred pricing (DP) contracts.
The cost of onfarm storage depends upon the individ- ual producer's situation. If storage facilities already exist, overhead costs will be incurred whether or not the facilities are used, and those costs are not neces- sarily included in the calculation of ownership costs. The costs of owning soybeans in farm storage include foregone interest, storage expenses, and extra han- dling expenses. The producer also assumes the risk of quality deterioration.
Holding in commercial storage is an option open to all producers. Ownership costs include the interest on the value of the soybeans plus the storage charges at the commercial warehouse. The warehouser assumes the responsibility for quality maintenance under this arrangement.
Selling soybeans in the cash market and replacing this sale by purchasing a futures contract is a third method of retaining ownership. The costs associated with a futures transaction include maintaining a mar- gin account and commission fees. An indirect cost item that must be included in this arrangement is any improvement in the basis because any improvement in the local cash price in relation to that futures con- tract is an opportunity cost to the producer. The ex- tent to which the basis improves is a gain the pro-
27

ducer would have realized by retaining ownership of the actual soybeans.
The ownership cost associated with a basis contract is similar to retaining ownership by buying futures. The major cost item is the basis improvement after the contract is made. Interest cost on the portion of the cash value not covered by the advanced payment and any service charges assessed by the buyer for this pricing alternative must be included in the analy- sis. This charge is generally assessed by fixing the basis in the contract at a few cents a bushel less than the current basis.
The ownership cost of a deferred pricing contract in- cludes interest on the value of the soybeans at time of delivery plus the service charge assessed by the buyer. In this case, the buyer will earn interest on the value of the soybeans but will lose the basis improve- ment. Consequently, a positive service charge will be assessed when the potential basis improvement ex- ceeds the interest earned.
Estimating the potential basis improvement is the most difficult part of the decision process. Producers must have a good knowledge of past basis patterns if they are to make informed decisions regarding the relative merits of deferred pricing arrangements and ownership through futures transactions. Retaining ownership of soybeans beyond harvest is a specula- tive decision. Price gains in the cash market or fu- tures market will not necessarily exceed ownership cost. However, once the decision is made to retain ownership following harvest, the producer should de- velop sound estimates of the relative cost of owner- ship for each alternative and choose the least expen- sive method.
Government Programs for Soybeans
Before World War II, the United States imported about 40 percent of its fats and oils, largely from In- donesia, China, and the Philippines. The increasing need for larger supplies of agricultural commodities, including soybeans, to satisfy wartime demands led to a shift from programs restricting production to pro- grams emphasizing production expansion. In July 1941, existing legislation was amended to increase the loan rates for basic commodities and to provide price supports at not less than 85 percent of parity for the nonbasic commodities (including soybeans for oil) if designated by the Secretary of Agriculture for in- creased production (56).
The first price support program for soybeans was au- thorized for the 1941 crop. The national average loan rate for the 1941 crop of soybeans was set at $1.05
per bushel. Price supports have been available every year since 1941 except 1975. Loans were not author- ized for soybeans in 1975 because of the relatively high price and expectations for continued strong de- mand (56).
Price supports were made available to participants in the program through nonrecourse loans by the Com- modity Credit Corporation (CCC). Farm storage loans were made on a note and chattel mortgage basis. Warehouse loans were available on a note and loan agreement basis with warehouse receipts serving as collateral.
The season average price of soybeans has exceeded the price support level for most years since 1941 (fig. 4). Nevertheless, substantial quantities of soybeans were often placed under price supports, particularly during years when high production led to relatively low prices. For example, the production in 1954 led to lower prices, and farmers reacted to the price decline by placing 41.4 million bushels of soybeans under price supports.
Production was even larger in 1958 when the quantity of soybeans under price supports increased to 140.1 million bushels. Faced with the possibility of having to acquire large quantities of soybeans under price sup- port loans, CCC offered, for the first time, a reseal program for farm-stored soybeans from the 1958 crop. Under this program, farms in designated areas could extend their farm storage loans or convert their purchase agreements to loans for an additional year following the loan maturity date. Large amounts of soybeans have often been placed under price sup- ports, but CCC acquisitions of soybeans have been relatively small in most years (table 31).
Acreage allotments or marketing quotas have not been used to restrict soybean production. However, programs for feed grains, cotton, and wheat often in- cluded provisions for the substitution of soybeans for one or more of these crops on their allotted acreages. These programs sometimes restricted the acreage a farmer could plant to soybeans. In 1961, for example, soybeans eligible for price supports were restricted to farms where the 1959-60 average acreage of con- serving and idle land had been maintained. This re- quirement was included to ensure that increases in soybean production came from acreages used for crops in abundant supply (wheat, cotton, and corn) rather than idle and conserving use land. Although the cross-compliance provisions of these programs may have affected the acreage planted to soybeans, adjustments in soybean production have been attempted largely through changes in price support loan rates and program provisions for competing
28
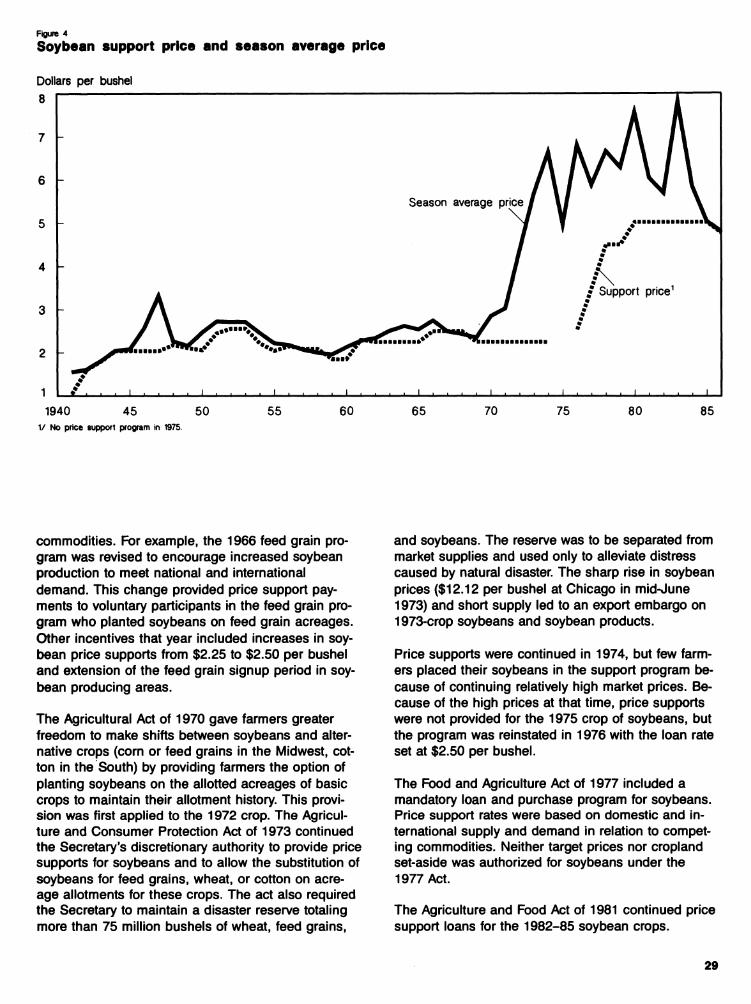
Figure 4
Soybean support price and season average price
Dollars per bushel 8
6
5
/ Support prlce^
I > I 1 I I J^ 1 1940 45 50
1/ No price support program in 1975.
■ I I I I
55 60 65 70 75 80 85
commodities. For example, the 1966 feed grain pro- gram was revised to encourage increased soybean production to meet national and international demand. This change provided price support pay- ments to voluntary participants in the feed grain pro- gram who planted soybeans on feed grain acreages. Other incentives that year included increases in soy- bean price supports from $2.25 to $2.50 per bushel and extension of the feed grain signup period in soy- bean producing areas.
The Agricultural Act of 1970 gave farmers greater freedom to make shifts between soybeans and alter- native crops (corn or feed grains in the Midwest, cot- ton in the South) by providing farmers the option of planting soybeans on the allotted acreages of basic crops to maintain their allotment history. This provi- sion was first applied to the 1972 crop. The Agricul- ture and Consumer Protection Act of 1973 continued the Secretary's discretionary authority to provide price supports for soybeans and to allow the substitution of soybeans for feed grains, wheat, or cotton on acre- age allotments for these crops. The act also required the Secretary to maintain a disaster reserve totaling more than 75 million bushels of wheat, feed grains.
and soybeans. The reserve was to be separated from market supplies and used only to alleviate distress caused by natural disaster. The sharp rise in soybean prices ($12.12 per bushel at Chicago in mid-June 1973) and short supply led to an export embargo on 1973-crop soybeans and soybean products.
Price supports were continued in 1974, but few farm- ers placed their soybeans in the support program be- cause of continuing relatively high market prices. Be- cause of the high prices at that time, price supports were not provided for the 1975 crop of soybeans, but the program was reinstated in 1976 with the loan rate set at $2.50 per bushel.
The Food and Agriculture Act of 1977 included a mandatory loan and purchase program for soybeans. Price support rates were based on domestic and in- ternational supply and demand in relation to compet- ing commodities. Neither target prices nor cropland set-aside was authorized for soybeans under the 1977 Act.
The Agriculture and Food Act of 1981 continued price support loans for the 1982-85 soybean crops.
29

Although the 1977 Act left the loan rate to the discre- tion of the Secretary of Agriculture, the 1981 legisla- tion required the Secretary to establish the rate for soybeans at 75 percent of the simple average price of soybeans received by farmers over the preceding 5 marketing years (excluding the high and low years) but not less than $5.02 per bushel. The act did not require reductions in soybean acreages as a condi- tion of eligibility for price support loans.
Soybeans are usually grown as part of a crop mix on individual farms, especially with corn, wheat, and cot-
ton. Thus, farmers growing soybeans must consider the effects on soybeans of other Government programs. Although soybeans were not covered in the 1983 payment-in-kind (PIK) program, soybean acreage declined because soybeans were not allowed to be planted on conservation use acres, such as those set aside in the wheat PIK program. This provi- sion reduced the amount of double-cropped wheat and soybeans. The PIK program improved the market prospects for corn, wheat, rice, and cotton, and farm- ers shifted some soybean acreage to the allowed acreage of those crops.
Table 31—Price supports, season average prices, and quantities of production under price support program
Support price Season average
Put under support Acquired by CCC under
support Year^
Per Percentage Percentage Owned by CCC
bushel of price Quantity of Aug. 31 parity production program
Dollars Percent Dollars 1,000 bushels
14.967
Percent ■f nnn K«. M».^IA
1950 2.06 80 2.47 5.0 29 1 1951 2.45 90 2.73 11,133 3.9 57 1 1952 2.56 90 2.72 14,100 4.7 3,858 1.980 1953 2.56 90 2.72 31,790 11.8 7 13 1954 2.22 80 2.46 41,413 12.1 15,550 6.570
1955 2.04 70 2.22 30,133 8.1 2 17 1956 2.15 75 2.18 65,729 14.6 27,315 5,166 1957 2.09 70 2.07 90,552 18.7 44,509 13.882 1958 2.09 70 2.00 140,215 24.2 87,253 44,240 1959 1.85 64 1.96 52.386 9.8 3,844 9,665
1960 1.85 64 2.13 25,617 4.6 7 0 1961 2.30 80 2.28 132,465 19.5 60.506 42,517 1962 2.25 76 2.34 68,780 10.3 1,186 1,654 1963 2.25 75 2.51 72.835 10.4 12.191 3.039 1964 2.25 74 2.62 28,573 4.1 8 9
1965 2.25 74 2.54 86,573 10.2 29 9 1966 2.50 78 2.75 153,521 16.5 26.421 7,340 1967 2.50 76 2.49 201,371 20.6 84,361 29,435 1968 2.50 74 2.43 340,271 30.8 170.102 171,423 1969 2.25 62 2.35 179,499 15.9 232 150,191
1970 2.25 60 2.85 146,420 13.0 83 2,500 1971 2.25 56 3.03 168,204 14.3 111 1 1972 2.25 54 4.37 90,555 7.1 36 0 1973 2.25 45 5.68 124,177 8.0 52 0 1974 2.25 37 6.64 34,554 2.8 7 0
1975 2 0 4.92 0 0 0 0 1976 2.50 34 6.81 22,471 1.7 2 0 1977 3.50 46 5.88 97.548 5.5 104 0 1978 4.50 51 6.66 64.173 3.4 179 0 1979 4.50 45 6.28 122.084 5.4 275 1
1980 5.02 43 7.57 133.209 7.4 3.412 76 1981 5.02 40 6.04 221,486 11.1 23.319 512 1982 5.02 39 5.69 396.564 18.1 245 20,851 1983 5.02 39 7.81 100.210 6.1 410 700 1984 5.02 39 5.78 278.296 15.0 151,000 4,400
1985 5.02 40 5.04 515,000 24.5 291,000 131.300
^ Year beginning September 1. ^ Price supports were not authorized for the 1975 crop. Source: {50, 51).
30

The Food Security Act of 1985 set the loan rate for 1986 and 1987 at $5.02 per bushel (75). For 1988-90, loan rates will be based on 75 percent of the average price received by producers in the preceding 5 mar- keting years disregarding the high and low years, with declines limited to 5 percent per year and a floor of $4.50 per bushel. In all 5 years, the Secretary has the authority to reduce the loan rate an additional 5 per- cent if necessary to make soybeans competitive in the world market while maintaining the $4.50 floor. The Secretary used this authority to set the loan rate for 1986 at $4.77 per bushel. Under provisions of the Balanced Budget and Emergency Deficit Control Act of 1985 (better known as Gramm-Rudman-Hollings), the effective loan rate was reduced to $4.56 per bushel. In addition, if soybeans remain uncompetitive in world markets, the Secretary may initiate a market- ing loan program where a producer could repay the loan at the prevailing world market price, as deter- mined by the Secretary. As in earlier acts, participa- tion in acreage reduction programs is not required as a condition of eligibility for price supports for soybeans. Under the 1985 Act, the planting for har- vest of soybeans on reduced acreage or acreage set aside or diverted from production under any other program is prohibited.
Soybean Processing
Soybean processing has expanded from a relatively small operation in the early 1920's to become the leading U.S. oilseed processing industry. The early pioneers of soybean processing used small-scale hy- draulic or screw presses which were often associated with cottonseed operations (9). Marked improvements in processing methods and facilities since that time have increased processing efficiency and enhanced industry growth.
Development of Processing
Both mechanical and solvent methods can be used for extracting soybean oil. Most soybean processing plants used the hydraulic press method prior to 1920. As soybean crushing operations progressed in the United States, hydraulic presses quickly gave way in the late 1920's to the more efficient screw presses when separate soybean processing facilities were built. The screw press method reached its peak in 1939 when about 75 percent of the soybeans proc- essed were crushed by this method (31). The Hilde- brandt solvent extraction process was introduced in the United States in 1934 (38). In subsequent years, all the larger new plants used the solvent extraction process. By 1959, about 93 percent of the soybean crush was processed by the solvent extraction method (47). Analyses of the soybean oil extraction
processes indicate that the larger the mill the greater the advantage of the solvent extraction method over the screw press operation. Because greater efficiency was required, the screw press soybean oil mills, when worn out or fully depreciated, were replaced with larger solvent extraction mills. There are indications that investment requirements per bushel decline more rapidly for the solvent process than for the screw proc- ess. Solvent mills are also more efficient in both oil yield and labor requirements. Virtually all soybean processing in the United States today uses the sol- vent extraction process (30, 31, 71).
A variant of the solvent extraction method of process- ing oilseeds is the prepress solvent extraction proc- ess. This process is a combination of the screw press and solvent methods. In this process, oilseeds are first put through the screw press extraction unit, and the resulting meal is subjected to the solvent extrac- tion process. The prepress method of solvent extrac- tion is used primarily on oilseeds containing over 20 percent oil such as sunflower seeds, safflower seeds, and flaxseeds. Oil mills of this type have more flexi- bility in the kinds of oilseeds processed. Some soy- beans and some other oilseeds are also processed by this type oil mill.
Soybean Oil IMills
The number of soybean oil mill establishments rose from 102 in 1963 to 121 in 1977 and then declined to 114 in 1982 (table 32) (63). A dramatic concentration of companies occurred between 1977 and 1982 when the number of companies fell from 65 to 34. The larg- est numbers of establishments are in Iowa and Illi- nois, 29 percent of all such facilities in both 1977 and 1982.
Soybean oil mills specialize in the production of their primary products, soybean oil and meal; relatively little mill activity involves other products such as cooking oil, shortening, and animal feeds. The spe- cialization ratio, which measures the value of ship- ments of primary products divided by the value of shipments of primary products plus secondary prod- ucts, has remained high and fairly constant over the Census of Manufactures Surveys from 1963 to 1982. Virtually all soybean oil and meal is shipped from mills specializing in soybean processing. The cover- age ratio measures the value of shipments of primary products made by this industry divided by the value of shipments of the primary products made in all in- dustries. This ratio has ranged between 95 and 98 percent since 1963. Other industries that shipped soybean oil and meal were cottonseed mills, wet corn mills, and prepared feeds manufacturers, not else- where classified.
31

Year
1963 1967 1972 1977 1982
Table 32—Soybean oil mills
Companies Establishments
Number-
68 60 54 65 34
Source: (63).
102 102 94
121 114
Employees
All Production workers
6.5 8.0 9.1 9.4 8.9
'Thousands-
4.6 5.5 6.6 6.6 6.2
Value added
Value of shipments
-Miliion doiiars-
152.1 215.4 350.0 373.8 678.2
1,473.4 2,148.3 3,357.2 7,580.0 8,603.6
Ratios
Specialization Coverage
-Percent"
86 85 87 88
95 96 96 98 95
Primary products accounted for 80 percent, second- ary products 11 percent, and miscellaneous receipts 9 percent of the value of shipments by the soybean oil mills industry. The major secondary production shipped was shortening and cooking oils, followed by prepared feeds, not elsewhere classified. The bulk of the miscellaneous receipts were sales of products bought and resold without further manufacture, proc- essing, or assembly at the establishment.
The size of the establishments was broken down by number of employees (table 33). The 1982 distribu- tion of number of establishments is similar to the 1977 distribution with the largest number of establish- ments being in the 50-99 employee bracket. The dis- tribution of the value of shipments also remained fairly constant between 1977 and 1982 with a slight percentage increase in the 250-499 employee bracket in 1982, compared with 1977, offsetting a similar decrease in the 100-249 employee bracket.
Processing Steps
During the soybean harvesting season, processors generally receive soybeans as fast as facilities will permit. Each lot of soybeans is tested for moisture and oil content upon its arrival at the processing plant. Lots are then segregated by putting all beans with higher moisture content and, thus, more suscep- tible to spoilage, in a separate bin. To prevent loss, soybeans with the highest moisture content (over 14 percent) are usually either processed immediately or dried to a safe storage level. They may be cleaned before drying, particularly if the beans contain a high level of foreign material. Soybean lots are blended (to make the plant flow as homogeneous as possible) and then stored until processing. Recleaning the beans before processing to remove foreign material remaining in the lot is a common practice.
In the actual processing, soybeans are first cracked (which breaks them into small pieces), conditioned
Table 33—Distribution of soybean oil mills by size
Numl)er of employees
Establishments Value added by manufacture
Value of shipments
1982 1977 1982 1977 1982 1977
—Number—
30 34 21 22 38 37 17 21 8 8 0 1
kÂillir^n Mr^llt^rt,
1-19 20-49 50-99 100-249 250-499 500-999
5.2 60.8
236.6 208.6 167.5
0
2.0 46.3 67.5
196.0 66. V
2
51.5 987.2
3,514.7 2.079.0 1,970.8
0
66.6 839.3
3,217.2 2,027.6 1,429.0^
2
^ Includes data for establishments with 500-999 employees. ^ Withheld to avoid disclosing operations of individual companies.
Source: (63).
with heat, and then put through the flaking rolls. Cracking rolls gradually reduce particle size and also remove the hulls, which are then suctioned off. IHulls are added back to the meal after processing. The hy- draulic press consists of a series of rectangular steel boxes which are perforated on the bottom and placed one on top of another. A quantity of heat-conditioned soybean flakes is wrapped in press cloth and placed in each box. The oil is then pressed from the flakes by gradually increasing the vertical pressure. In the screw press method of oil extraction, the heat- conditioned soybean flakes are continuously under pressure created by a revolving screw inside a cylin- der which presses out the oil. Both mechanical proc- esses are carried out under elevated temperatures. Hydraulic presses and screw presses are both usually arranged in batteries in a plant to facilitate feeding the machines and removing the oil and meal.
In the solvent method of extraction, the heat- conditioned soybean flakes enter the extraction col- umn and are mixed with solvent (almost always hex- ane) which separates the oil and carries it off. After the solvent is removed, the oil is stored in tanks. After the solvent is also removed from the remaining meal,
32

the meal is toasted and cooled. It is then screened, ground, and stored in bins.
Soybean meal must be heated sufficiently to inacti- vate the antinutritional factors but not enough to dam- age the protein. In solvent processing, the meal is not heated sufficiently to accomplish this change and must be toasted. Toasting screw press meal is not necessary because of the higher operating tempera- tures. However, care must be taken not to damage the protein.
The amount of soybean hulls returned to the meal depends on the protein guarantee of the meal. If hulls are not returned, 49-percent protein soybean meal is produced with a maximum of 3-percent fiber. Regular soybean meal, with the hulls returned, contains 44- percent protein and a maximum of 7-percent fiber. Futures contracts call for 44-percent protein soybean meal.
Soybean hulls, in addition to being returned to the meal, are marketed as soybean hull meal which con- tains not less than 11-percent protein and no more than 35-percent fiber. The hulls are also marketed in soybean mill feed which is a mixture of soybean hulls and mill tailings from the manufacture of soy flour or grits containing not less than 13-percent protein and not more than 32-percent fiber.
After processing soybeans into oil and meal, proces- sors sell the oil to refiners, exporters, and manufac- turers of consumer or industrial products. Soybean oil is primarily used in edible products, such as salad and cooking oils, margarine, shortening, and salad dressings. Some soybean oil is used in industrial products such as paints, plasticizers, and fatty acids. Processors sell the meal to feed manufacturers or to exporters. Feed manufacturers use the soybean meal as a high-protein ingredient in their prepared feeds for the livestock and pet food industries. They also sell soybean meal to farmers for use in feeding livestock.
Soybean Receipts and Holdings
Soybean processors usually receive the largest vol- ume of beans during harvest when prices usually fall to a seasonal low. Receipts are highest during Octo- ber. During the 1980-84 crop years, processing plants on average received over a third of the year's soybeans by the end of November, over half by the end of January, and over two-thirds by the end of March (64).
Based on average holdings for the 1980-84 crop years, the volume of soybeans at mills reaches its
seasonal peak in November and then trends down- ward the rest of the marketing year.
Soybean Crushings
In contrast to the soybean receipt pattern of mills, soybean crushings are relatively stable throughout the year, with about 8 percent of the year's total crushed each month {64), Soybeans store well for an extended period of time, making this pattern possible. The stable crushing pattern reflects the relatively even year-round demand for soybean oil and meal products and the efficiency of operating solvent ex- traction plants at a steady output.
During the 1980-84 crop years, the soybean process- ing industry's average monthly crush ranged from a low of 7.3 percent to a high of 9.6 percent. Before the arrival of a new crop of soybeans, mills usually cease operations for repairs and maintenance. Therefore, July to September are the low months for crushings. The highest average monthly crushing is normally in December. However, the peak month varies from year to year. Usually slightly over a third of the annual crush occurs by the end of December, and slightly over two-thirds by the end of April. One can usually estimate total soybean crush quite accurately from these benchmarks because of the relatively small de- viations from the cumulative season pattern.
Refining
The refining industry is made up of plants that con- duct one or more processing operations used to re- fine and further prepare crude fats and oils. The refin- ing is carried out by one of three methods: alkali, steam, or miscella. Alkali refining is the most widely used process.
The steam method is used for refining lard and edible tallow, and the miscella method is used for cotton- seed oil. Refining removes undesirable constituents of crude oil such as free fatty acids, color bodies or pigments, water, and nonfatty material such as gums. After refining, the oil may be further processed de- pending on the end use for which it is intended. Re- fining of crude soybean oil is usually carried out by combining it with an alkali, usually caustic soda (lye). The refined soybean oil is drawn off and the remain- ing material is called soybean soapstock or foots which may be used to make soap, fatty acids, and glycerine or may be added to livestock feeds to in- crease the energy content and to impart other desir- able characteristics to mixed feeds.
The Economic Research Service conducted a survey to determine the U.S. edible fats and oil refining ca-
33

pacities in 1982/83 (71). Industry responses came from 58 plants operated by 29 companies. These plants refined 88 percent of the reported total edible vegetable oils production in 1982/83. The survey highlighted the fact that the refining industry has be- come more concentrated since a similar survey was taken in 1975 when 97 refineries operated by 49 com- panies, representing 100 percent of the industry, re- sponded (32). Concentration increased among the alkali refineries, which accounted for over 95 percent of the total refining capacity, with the 14 largest plants accounting for nearly 60 percent of the reported capacity compared with 41 percent in 1975.
Total refining capacity was 16.9 billion pounds in 1982/83, up 17 percent from the refining capacity re- ported in the 1975 survey. Plants operated at 76 per- cent of capacity in 1982/83, up somewhat from 71 percent in 1975. Respondents reported no current or planned capacity expansion of their plants. Soybean oil accounted for nearly 75 percent of the total refined output of fats and oils. Corn oil ranked second at 7 percent of all fats and oils, slightly above cottonseed oil in the survey.
Plants engaged in refining operations vary widely in size with a large proportion performing additional steps in fats and oils processing. A profile of the 47 alkali refineries in the 1983 survey showed the 14 largest plants (350-1,100 million pounds) held nearly 60 percent of the alkali-refining capacity. The 14 larg- est alkali refineries in 1975 ranged in size from 350-750 million pounds of maximum capacity and held 41 percent of the total alkali-refining capacity. Eight plants had alkali-refining capacity between 250-350 million pounds in 1982/83. These plants ac- counted for 16.5 percent of the total, barely half that reported in 1975. The largest proportion of the alkali refineries had capacities of 125-250 million pounds. Yet, these 16 plants held only 22 percent of the re- ported capacity. The nine smallest plants ranged in size from 10-125 million pounds and claimed less than 4 percent of the reported alkali-refining capacity.
Edible fats and oils refineries are located in large metropolitan consuming centers and in oilseed pro- duction areas. In the past, refineries were primarily located in the large cities where they received crude soybean oil, refined it, and manufactured edible fat products which were marketed in nearby markets. The trend in recent years has been for companies with large soybean oil mills, located in the soybean producing areas, to construct refineries adjacent to these oil mills. This arrangement provides more flexi- bility in marketing their soybean oil. They are no longer restricted to selling only crude oil to refiners but can sell refined oil to the many manufacturers of
edible fat products. Most refiners also produce fin- ished products such as salad and cooking oils, short- ening, and margarine, and package them in a wide variety of containers.
The 58 processors of edible fats and oils responding for the survey were located in 21 States. Over half of the refiners were concentrated in four States: Illinois, 10 plants; California, 9 plants; Texas, 8 plants; and Tennessee, 4 plants. With the addition of three plants each in New Jersey, Georgia, Ohio, and Iowa, 75 per- cent of the plants were in only eight States. Forty- three percent of the reported refined output of fats and oils came from 16 plants in the regional grouping of Minnesota, Wisconsin, Michigan, Illinois, Indiana, and Ohio.
Storage and Handling
The orderly movement of soybeans to oil extraction plants and overseas port terminals from farms usually involves storage at several locations along the way. Soybeans may be stored on the farm where they were produced or off the farm in commercial storage facilities (table 34). Soybeans enter the marketing system on delivery to country elevators and other marketing firms for storage (27). Soybeans are then moved to terminal markets for further storage or deliv- ery to more distant terminals. From these terminals, the soybeans go into export trade or to extraction plants where they are stored until crushed. Some- times one or more of these intermediate stages may be bypassed.
Farm Storage
The percentage of soybeans stored on the farm has increased since the 1960's (table 34). Some portion of this increase is due to Government-sponsored stor- age construction programs, but the increase also re- flects the desire of soybean farmers to take advan- tage of the marketing flexibility that storage offers.
Onfarm drying and storage generally requires facili- ties with enough capacity for 1 year's production. Other requirements include access to roads and elec- tric power and a layout to facilitate loading and un- loading of bins.
Farmers must decide on the best time to market their soybeans for maximum returns. Soybeans may be sold prior to harvest on a cash contract, at harvest- time, or they may be stored and sold at a later date (see "Marketing Strategies" on page 24). Because most soybeans are crushed at off-farm commercial facilities, onfarm storage is primarily for speculative purposes. When deciding whether or not to store soy-
34

Table 34—U.S. soybean stocks: Onfarm, off-farm, and total all positions
Date Onfarm Off-farm Total Date Onfarm Off-farm Total
1,000 bushels 7,000 bushels 1965: 1976: Jan. 1 1.096.000 334.820 525.548 Jan. 1 590,926 665.689 1,256,615 Apr. 1 98.002 249.035 347.037 Apr. 1 411,535 456.283 867,818 July 1 22.982 108.465 131.447 Junel' 254,029 300.938 554,967 Sept. 1 7,568 22,132 29.700 Sept. 1 86,159 158,781 244,940
1966: 1977: Jan. 1 284.312 334,554 618.866 Jan. 1 473,405 559,045 1,032,450 Apr.1 149.747 225.888 37.563 Apr.1 227,794 390,214 618,008 July 1 19.155 114.867 134.022 Junel 92,400 243,335 335,735 Sept. 1 4.412 31.227 35.639 Sept. 1 32.756 70,168 102,924
1967: 1978: Jan. 1 344,394 377.041 721.435 Jan. 1 674,550 652.400 1,326.950 Apr. 1 217.411 240,500 457.911 Apr. 1 394,405 455.448 849,853 July 1 84.611 114,170 198.781 June 1 207,541 298.815 506,356 Sept. 1 41.626 48,511 90.137 Sept. 1 59,132 102.044 161,176
1968: 1979: Jan. 1 350.816 432,333 783.149 Jan. 1 699.556 692.534 1,392,090 Apr. 1 235.842 301.182 537,024 Apr. 1 412.570 467,646 880.216 July 1 120.620 164.389 284,991 June 1 241.255 284.850 526.105 Sept. 1 60.709 105.618 166.327 Sept. 1 61.509 112.579 174.088
1969: 1980: Jan. 1 410,168 550.329 960.497 Jan. 1 892,934 877.896 1.770,830 Apr. 1 276,930 452,343 729.273 Apr. 1 602,779 580.322 1.183,101 July 1 141,360 316,815 458,175 June 1 396,650 378.152 774.802 Sept. 1 71,852 254.992 326.844 Sept. 1 128.888 229.880 358.768
1970: 1981: Jan. 1 372,069 683.425 1.055.494 Jan. 1 730.157 790.300 1,520,437 Apr. 1 209,236 525.001 734.237 Apr. 1 533.082 469,619 1,029,701 July 1 78,711 324.676 403,387 June 1 362.266 317,156 679,422 Sept. 1 40.580 189.256 229,836 Sept. 1 159.029 159.276 318,305
1971: 1982: Jan. 1 391.960 553.012 944,972 Jan. 1 901,145 743.188 1.644.333 Apr. 1 246.491 369.063 615.554 Apr. 1 591,073 459.361 1.050.414 July 1 90,595 190.832 281.427 June 1 366,549 291.921 658.470 Sept.1 20,554 78.225 98.779 Sept. 1 131,921 136,571 268.492
1972: 1983: Jan. 1 397,631 491.387 889,018 Jan. 1 1,008,139 757.560 1.762.699 Apr. 1 218.618 333,677 552,295 Apr. 1 643,143 504,529 1.147,663 July 1 58.440 174,832 232,834 June 1 424,658 365,966 790,624 Sept. 1 11.779 60.183 71,962 Sept. 1 118.574 226,060 344.634
1973: 1984: Jan. 1 428.798 437,924 866,722 Jan. 1 620.171 670,384 1,290.555 Apr. 1 145.261 358.372 503.633 Apr. 1 374.237 415.765 790.002 July 1 33,847 145.352 179,199 June 1 179.601 292.085 471.686 Sept.1 9.412 50.2?? 59.634 Sept. 1 67.912 107.784 175,696
1974: 1985: Jan. 1 607.233 552.756 1,159,989 Jan. 1 766.335 655.724 1,422,059 Apr. 1 331.221 405.943 737.154 Apr. 1 487.369 408,632 896,001 July 1 150,738 190.865 341,603 June 1 326.596 281.821 608,417 Sept. 1 64.414 106.337 170.751 Sept. 1 143,221 172.836 316,057
1975: 1986: Jan. 1 484,978 505,392 990,370 Mar. 1^ 699.339 671,929 1.371,300 Apr. 1 411.535 323,317 655,413 June 1 411.740 437,186 848,926 July 1 165,597 191,704 357,301 Sept. 1 167.090 369,275 536.365 Sept. 1 78,229 109.922 188,151 Dec. 1 1.086.000 895,437 1.981.437
^ Reporting date changed from July 1 to June 1 in 1976. ^ Reporting dates changed to March 1, June 1, September 1. and December 1. Source: {50, 59).
35

beans, a farmer must consider several factors: (1) availability of storage space, (2) cost involved in stor- ing, (3) possible losses due to damage caused by insects, rodents, shrinkage, and spoilage, and (4) possible changes in price. Prices generally rise dur- ing the storage period because a temporary glut usu- ally occurs at harvesttime; but the main question is whether prices will increase enough to cover all of the storage costs. The average onfarm storage period is 4-5 months (25).
Onfarm soybean storage does not necessarily guar- antee extra profits. However, seasonal price move- ments are often large enough for growers to realize extra income by storing their soybeans. The 1984/85 season was an exception, however. Soybean prices not only failed to increase, but steadily dropped from $6.01 per bushel in November to $5.70 per bushel in May.
Farmers with onfarm soybean drying and storage fa- cilities have certain advantages over other soybean producers because they can harvest their soybeans earlier when moisture content is high and thus re- duce yield losses. These producers also have greater flexibility in scheduling harvest when storage space is readily available. They can also dispose of their soy- bean crop at any time suitable to them, and they can participate in the soybean loan program without hav- ing to secure storage space in commercial elevators.
The Government encourages storage of soybeans through its nonrecourse loan program and through its farm facility loan program. However, onfarm drying and storage may not be profitable for all soybean production situations, especially for small farm operations.
Commercial Storage
Soybeans compete with wheat, corn, and other feed grains for bin space (45). The total off-farm storage capacity for grains was estimated at about 8.29 billion bushels (58). Commercial storage rates are generally higher than onfarm storage costs.
All commercial storage facilities, whether located at the country elevator, terminal elevator, or processing plant, are equipped with facilities to protect and main- tain the quality of soybeans. Normally, elevators have their own cleaning equipment. The usual practice is to clean soybeans on arrival at the elevator in order to remove high-moisture weed seeds and trash, re- ducing the risk of mold growth and heat deterioration.
Moisture is a major factor in the safe storage of soy- beans. In general, the higher the moisture and tem-
perature, the shorter the permissible storage period. These two conditions influence mold development and the resultant spoilage of soybeans in storage (2, Z 28). Soybean drying is accomplished by forcing warm air through the soybeans in the storage bin to remove excess moisture. To safely store soybeans for long periods of time, the moisture content of the beans should be reduced to 12 percent or even 11 percent (2, 43, 49). Mold growth is greatly reduced when moisture falls to these levels or below. There are also disadvantages when moisture content of soy- beans is too low. Storage handling of beans contain- ing 8- to 9-percent moisture frequently results in split- ting, mechanically damaging the beans to the extent that they are lowered one or more market grades (49). The temperature of soybeans is lowered by aera- tion. The aeration is accomplished by using a fan to force air through bins of beans. Cooling the beans helps retard the growth of mold and reduces insect activity (72).
Shrinkage occurs during the storage period due to loss of moisture and the actual loss from rodents, in- sects, and handling operations. One-quarter of 1 per- cent appears to be a reasonable shrinkage allowance for each handling operation in storing soybeans on farms, or 0.5 percent for in-and-out handling (49).
Country Elevators. Farmers normally sell about 80 percent of their soybean crop to country elevators ei- ther at harvesttime or after a period of farm or com- mercial storage. Soybean producers sell about 3 per- cent of total production directly to soybean proces- sors. Country elevators sell their soybeans to dealers in terminal markets, domestic processors, and export- ers. Those soybeans purchased by terminal market firms are then sold to domestic processors or to ex- porters.
Storage at Feed and Oil Mills. Storage of soybeans at feed and oil mills is usually in facilities similar to those found at country or terminal elevators. These storage facilities usually consist of several large round silos. Facilities are available for unloading both trucks and railroad cars (many mills can also unload barges) and for cleaning and drying soybeans received at the processing plant. Soybean processing plants usually have facilities to store enough soybeans for 80-100 days of operation (3).
Because soybean oil and soybean meal stocks are more perishable than soybean stocks, inventory hold- ers prefer to hold soybeans for speculative purposes. Oil and meal inventories remain relatively constant throughout the crop year, reflecting the amount of crush and pipeline demands for the products (tables 35 and 36).
36

Market Flow Patterns and Transportation Modes
Marketing U.S. soybeans involves moving large quan- tities of soybeans from production areas to process- ing and export points. These movements require a large transport capacity involving different modes of transportation. This section provides information on
the movement of soybeans from production areas to processing and export points.
Although the marketing of soybeans involves many interregional movements, nearly 80 percent of all U.S. soybean exports pass through ports on the Gulf of Mexico. The inland waterway system is a vital link to gulf ports.
Table 35^U.S. soybean oil factory and warehouse stocks, total crude and refined, end of month
Year October November December January February March April May June July August September
1970 1971 1972 1973 1974
1975 1976 1977 1978 1979
1980 1981 1982 1983 1984
1985
1,000 pounds
527,277 717,631 755,691 751,778 787,824 755,971 765,751 757,951 719.026 745,336 819,209 772,564 725.883 808.669 802,206 782,834 847,085 881,171 952,671 944,966 824,656 .854,068 841,639 785.182 806.191 839.113 896.503 948.588 966,480 920,539 1,004.830 900,096 822.696 748,718 620,052 515.535 531.531 599.918 690.503 623.251 642,446 626.028 726.267 765.131 708.599 702.713 777,152 793,529 734.687 681,511 673.611 689.587 633,747 647.358 662,215 606,683 530,617 544,303 567,109 560.557
567,955 657.652 799.873 844,788 931.245 946.065 1.060.933 1.108.603 1,274,500 1.229.867 1,294,573 1.250.605 1.350.561 1,431,985 1.488.132 1.599,495 1,609,404 1,486,351 1,478,879 1.354.996 1,168.358 1,031,993 937,294 771,100
752,100 766.548 859,223 913,834 856,505 803,775 822.179 828.717 834.434 820,805 777,488 728.628 813,426 837.091 970,555 932,217 942,820 1.004.182 987.290 1,042,967 922,910 914.790 815,068 775,758 819,786 867.324 1.030,142 1,115,190 1.204,539 1,175,879 1.183.687 1,144,814 1.225.892 1,305.029 1,262,971 1,210,170
1,373,856 1,677.251 1.737,787 1,900,067 1,976,281 2.016,674 2,118,480 2,166,299 2,138,559 2.024.412 1,783,122 1,736,118 1,790,191 1,884,443 2,023.748 2,159,951 2,140,591 2,141.371 2,111,639 2,017.694 1,889,417 1,647,378 1,397,445 1,102,548 1,207,784 1,304,666 1.568,625 1,713.377 1,700.332 1.841,770 1,600.436 1,551.879 1,545.932 1.411.385 1,407.568 1.260.946 1.453.436 1.660.587 1.919,206 1,907.038 1.582.883 1.519.623 1,380,110 1.209.713 1.011.811 989,601 871,091 720,509
597,196 580,123 777,058 883.572 723.898 715,583 665.952 706,746 731,959 724,199 715,742 640,071
636,080 810.380 969,431 1.167.396 1.181.063 1.246,599 1,219.263 1.360,161 1.225.218 1,320,820 1,152,197 946.593
Source: (55).
Table 36—U.S. soyt>ean cake and meal: Stocks, end of month
Year October November December January February March April May June July August September
1 ,000 tons
1965 131.2 133.4 95.6 123.4 131.0 151.6 138.5 181.5 174.5 218.7 149.1 131.6 1966 149.0 146.1 136.1 151.5 126.6 101.6 163.4 129.5 144.0 167.6 131.7 137.7 1967 178.7 186.1 214.3 155.8 171.8 214.7 172.5 148.9 185.4 177.5 148.7 145.1 1968 155.7 153.4 197.2 228.4 216.5 184.8 181.3 193.6 168.1 178.4 176.3 156.8 1969 159.1 173.2 131.6 135.8 154.3 149.8 156.9 233.5 213.1 164.3 207.0 137.0
1970 168.8 182.7 129.7 185.5 189.3 153.2 168.1 219.3 169.1 215.0 215.4 145.8 1971 205.2 192.8 144.3 153.9 135.5 160.5 218.0 186.7 189.1 243.2 221.6 191.7 1972 185.7 170.7 217.9 193.3 210.0 206.3 213.5 203.4 204.5 214.4 212.8 183.2 1973 234.3 242.2 284.6 249.0 281.1 361.6 348.0 427.9 514.3 475.9 535.4 507.3 1974 508.2 563.7 529.0 541.0 540.0 556.7 470.5 448.1 421.7 394.8 404.5 358.3
1975 396.1 441.4 371.4 378.1 419.5 358.3 358.8 462.8 369.8 406.9 350.5 354.9 1976 423.5 427.7 353.9 384.7 429.9 412.6 449.0 408.3 390.7 399.0 270.4 228.3 1977 270.0 304.3 244.6 251.7 239.7 227.3 298.5 263.3 191.1 262.6 234.1 242.9 1978 239.5 205.9 289.1 242.2 225.0 238.2 264.7 237.2 239.0 262.3 173.7 267.4 1979 234.3 195.2 240.5 184.3 191.3 251.1 226.1 299.0 302.1 267.8 262.1 225.6
1980 242.4 381.4 249.7 243.5 248.1 271.4 211.7 287.6 241.1 188.8 233.8 162.7 1981 309.2 314.8 279.4 315.7 324.9 190.3 172.1 309.3 224.9 209.1 189.7 175.2 1982 342.8 349.6 332.3 400.2 422.8 341.0 356.1 341.5 272.3 365.2 378.5 474.1 1983 419.3 466.8 391.1 475.8 446.7 460.7 418.6 427.2 391.2 355.5 242.7 255.4 1984 236.1 285.7 336.8 319.6 334.1 444.6 429.8 495.8 569.6 562.5 458.0 386.9
1985 318.4 369.2 358.4 372.4 281.3 386.6 300.8 282.4 278.7 250.6 298.3 211.7
Source: (55).
37

The soybean processing industry, which is the major domestic outlet for soybeans, has accounted for 55 percent of total soybean disappearance on average for the last 5 years. Soybean processing plants are located in 21 States.
The following discussion is based on data from 1977, the last year for which comprehensive soybean ship- ment figures are available (34). Specific values may have changed since then, but the overall market flow patterns probably remain valid.
Shipments by Region
Grain marketing firms in the United States reported shipping about 1.7 billion bushels of soybeans in 1977 (table 37). A portion of those shipments included the same soybeans transported by several firms at different points along the way. In Illinois, for example, about two-thirds of the soybeans handled by river elevators were shipped from country elevators. The remainder was moved directly from farms.
About 49 percent of the total volume was transported to destinations within the region in which the ship- ments originated. These movements were predomi- nantly shipments from country elevators to river eleva- tors, terminal elevators, and processors located in the same region. Soybean processing plants have tradi- tionally been located in production areas; thus, most soybeans for crushing are purchased from nearby sources.
In the Southeast regions (Mid-South, South Atlantic, and Mid-Atlantic), several large processing plants proc- ess more soybeans than can be produced locally. At the same time, local export firms compete with proc- essors for soybeans produced in many of these States. Thus, southeastern processors often purchase soybeans from sources in the Corn Belt, and south- eastern marketing firms ship locally produced beans to export points. Interregional shipments of soybeans totaled 231 million bushels in 1977 (table 37). About three-fourths of these movements originated in the Corn Belt.
Grain marketing firms shipped about 630 million bushels of soybeans to U.S. ports in 1977 (table 37). Firms in Illinois were the most important source for soybeans moving to port. They shipped over 126 mil- lion bushels, 20 percent of the total, to port destina- tions. Ohio, Louisiana, Iowa, and Arkansas rank sec- ond through fifth, in terms of volume shipped to port locations with each State shipping more than 50 mil- lion bushels. In total, firms in the Corn Belt and Delta originated 80 percent of U.S. soybean exports in 1977.
The volume of soybean shipments to various export locations varies markedly from region to region (table 38). Ports located on the gulf coast were the destina- tions for 485 million bushels, 77 percent of the U.S.
Table 37—U.S. shipments of soybeans to domestic destinations and export regions, 1977
Originating Domestic destination^
Export Total region ^ Within Outside regions
region region
Million bushels Northeast 0 4 1 5 Mid-Atlantic 30 1 8 39 South Atlantic 17 2 7 26 Lake States 75 9 53 137 Corn Belt 493 164 345 1,002
Mid-South 77 15 43 135 Delta 100 14 156 270 Northern Plains 38 19 5 62 Southern Plains 1 3 12 16 Mountain 0 0 0 0 Pacific 0 0 0 0
Total 831 231 630 1.692
^ states included in each region are Northeast (NJ, NY, and PA); Mid-Atlantic (DE, MD, NO, VA, and WV); South Atlantic (FL, GA, and SC); Lake States (Ml, MN, and Wl); Corn Belt (IL, IN, lA, MO, and OH); Mid-South (AL, KY, and TN); Delta States (AR, LA, and MS); Northern Plains (KS, NE, ND, and SD); and Southern Plains (OK and TX).
^ Survey data from several States were aggregated to avoid disclosure of individual firm data. Consequently, movements between Alabama and Tennessee, between Kansas and Nebraska, among States in the Mid-Atlantic region, and among States in the South Atlantic region are shown as intrastate movements.
Source: {33).
Tabie 38—U.S. shipments of soybeans to export regions, 1977
Originating region
Great Lakes
Atlantic coast
Gulf coast
Pacific coast Total
1, 000 bushe is
Northeast Mid-Atlantic South Atlantic Lake States Corn Belt
0 0 0
18,594 54,711
1,263 7,546 3,490 4,055
53,768
0 0
3.165 29,922
235,900
0 0 0
539 295
1.263 7,546 6,655
53,110 344.674
Mid-South Delta Northern Plains Southern Plains Mountain Pacific
0 0 0 0 0 0
0 0
0 0 0
43,112 156,479
4,685 12,002
0 0
0 0
469 0 0 0
43.112 156,479
5,154 12,002
0 0
Total 73,305 70,122 485,265 1,303 629,995
Share Percent
of total 11.7 11.1 77.0 .2 100.0
Source: (33).
38

total. The balance of shipments were shared about equally by Great Lake and Atlantic ports. Most of the shipments moving to Great Lake ports originated in States adjacent to these port locations; thus, the ship- ments moved relatively short distances. Although some shipments to Atlantic ports originated at nearby points, the predominant origins for soybeans moving to Atlantic ports were Ohio and Indiana. Marketing firms in these two States originated about 70 percent of the soybeans shipped to Atlantic ports in 1977.
Firms in the Corn Belt shipped 236 million bushels to gulf ports in 1977, almost 50 percent of shipments to port elevators in the gulf coast region. The Delta, also an important source, shipped 156 million bushels, 32 percent of total soybean shipments, to gulf ports. Shipments to the Pacific region amounted to only 1.3 million bushels, mostly from Iowa, Kansas, Minne- sota, and Nebraska.
Regional Destinations and Transportation IModes
In 1977, marketing firms and processors received 272 million bushels of soybeans from interregional origins (table 39). About 231 million bushels of soybeans from that total were shipped by marketing firms to interregional domestic destinations. Trucks hauled the balance directly from farmers located in adjacent States. The Corn Belt led all regions in terms of the volume received from interstate origins (table 39). About 50 percent of the Corn Belt total originated in Indiana, Iowa, and Missouri. Illinois, the leading soybean-producing State, led all States in the quan- tity of soybeans received from other States. Firms in northwestern Iowa received large shipments from
Table 39—U.S. soybean receipts in domestic regions from interregional origins, by transportation modes,
1977
Destination Quantity Modal share
region received Rail Truck Barge Farm truck
7,000 bushels Pai cenf
Northeast 0 0 0 0 0 Mid-Atlantic 20,091 61.3 20.6 0 18.1 South Atlantic 15,408 94.5 5.5 0 0 Lake States 21,409 3.0 86.4 0 10.6 Corn Belt 103.883 17.3 63.3 0 19.4
Mid-South 53,473 44.7 24.7 26.9 3.7 Delta 31,287 28.0 35.1 13.1 23.8 Northern Plains 22.836 30.2 47.4 0 22.4 Southern Plains 3,139 60.5 35.9 0 3.6 West 0 0 0 0 0
U.S. total 271,526 32.0 46.2 6.8 15.0
Minnesota and South Dakota. Kansas and Nebraska processors received large quantities from Iowa and Missouri.
Processors and other marketing firms located in the Mid-South represent a sizable domestic market for Midwest soybeans. In 1977, the firms in that region received 53 million bushels from interstate origins. The Mid-South was the primary domestic destination for soybeans shipped by barge. In the Delta, Arkan- sas processors were the predominant destination.
Trucks were the main mode of transport for inter- regional domestic shipments of soybeans, accounting for 46 percent of the total volume shipped from eleva- tors. The remainder was transported by rail, barge, and trucks originating on the farm (farm trucks) which accounted for 32, 7, and 15 percent of the total, respectively.
The quantity of soybeans received at Great Lakes ports in 1977 totaled 77 million bushels; 80 percent of the total was shipped by truck from nearby origins (table 40). Atlantic ports received 71 million bushels, 85 percent of which moved by rail. Most rail move- ments were unit trains originating in Ohio, Indiana, and eastern Illinois.
The gulf coast was the main destination of soybean shipments to export points. Barge transportation ac-
Table 40—Soybeans received at various port areas and shares transported by different modes, 1977
Export region Quantity received
Modal share
and port area Rail Truck Barge Farm
truck
Great Lakes region Chicago area Toledo area Saginaw area
Atlantic region North Atlantic South Atlantic
Gulf region East gulf Louisiana gulf North Texas gulf
Pacific region Columbia River Puget Sound California
Total received
1,000 bushels Percent
77,434 13 80 2 5 29,491 21 72 4 3 46,795 9 84 0 7
1.148 0 100 0 0
70,922 85 7 7 1 14,140 92 10 0 0 56,782 84 6 9 1
486,115 15 7 78 0 71.122 45 7 47 1
387,502 8 3 89 0 27,491 39 61 0 0
1.303 78 22 0 0 565 94 6 0 0 443 43 57 0 0 295 100 0 0 0
635,774 23 15 61 1
Source: {33). Source: (33).
39

counted for 78 percent of the volume received at gulf ports, illustrating the importance of the inland water- way system in moving soybeans into export channels. The barge was the predominant mode of transport at all gulf port areas except the northern Texas gulf coast area where truck transportation accounted for about 60 percent of the soybeans received at that location.
Changes in Domestic IMarlceting Patterns
Market flow patterns change in response to changes in quantities produced and processed in various re- gions, the volume and location of exports, and the transportation rate structure.
The South has been a deficit feed grain area with a large grain-consuming poultry industry. The manufac- turing of poultry feed in this region uses large vol- umes of soybean meal produced mostly at soybean crushing plants in the South. Soybean production in the South has expanded rapidly in recent years. The quantity produced exceeds processing requirements in several Southern States, but the location of a siz- able proportion of the production in this region favors transporting soybeans to Atlantic and gulf ports rather than to local processors. Consequently, southern proc- essors must fill some of their soybean requirements from sources outside the region.
In contrast, production in the eastern Corn Belt region greatly exceeds the requirements of local processors. Marketing firms in that region depend on markets out- side the local area. An increasing share of these sur- pluses has been moving to export points in recent years. However, the South historically has been an important market for soybeans produced in the east- ern Corn Belt because of the close proximity and ex- isting transportation network.
The eastern Corn Belt has been an important source of supply for processing plants in the South, but the increased export activity has altered the trading pat- tern between these two regions. In 1970, for example, 68 million bushels were shipped to Southern States from eastern Corn Belt origins; by 1977 the volume had declined to about 62 million bushels. Although the total volume remained fairly stable, trading pat- terns shifted noticeably. In 1970, Illinois was the pre- dominant supplier of soybeans for the southern mar- ket, accounting for almost 82 percent of the movements from eastern Corn Belt origins. The Illi- nois share dropped to 49 percent by 1977. The de- cline in shipments by Illinois firms was due largely to a sharp drop in the volume shipped to Mississippi processors. The rapid expansion in soybean exports from gulf ports was also an important factor. Transpor-
tation considerations give Illinois an advantage in shipping soybeans by barge to the gulf; however, shippers in Indiana and Ohio are competitive in the southeastern markets served by rail transportation. The volumes shipped from Indiana and Ohio to port regions also increased substantially between 1970 and 1977.
The Alabama-Tennessee area was the most important destination in the South. Shipments from the eastern Corn Belt totaled 27 million bushels in 1977; Illinois shipments accounted for almost 86 percent of the to- tal. Kentucky, Georgia, and South Carolina remained important markets for eastern Corn Belt soybeans even though the volume shipped to those markets declined between 1970 and 1977. The South will probably continue to be an important market for soy- beans produced in the Midwest because of the siz- able movement of southern production into export markets.
World Production and Trade
Oilseed crops are the most valuable agricultural com- modities produced in many regions of the world. Soy- beans are a major share of oilseed production, nearly 50 percent of total world production in 1985.
l-ocation of Production
The United States continues to be the leading pro- ducer of soybeans; however, the U.S. share of world production dropped from 74 percent in 1967-69 to 56 percent in 1984-86 (table 41). China's share also dropped substantially during that period. In contrast, Brazil and Argentina significantly increased their share of world production from about 3 percent in 1967-69 to more than 24 percent in 1984-86.
World Production Trends
World production of soybeans has grown markedly since the early 1970's (table 42). Production rose in
Table 41—Share of world soybean production by major producers for selected periods
Share of world production Country
1967-69 1984-86
Percent United States 74.4 56.0 Brazil 2.7 17.0 China 16,7 10.9 Argentina .1 7.4 Paraguay .1 .8 Other 6.0 7.9
Source: {59).
40

most soybean-producing regions, but the United States, Brazil, and Argentina have accounted for al- most 85 percent of the increase in world production since 1970. Production in South America grew much more rapidly than in other major soybean-producing regions.
The growth in world production came from increased yields and increased area planted in soybeans. The area harvested worldwide rose about 90 percent from 1967/68 to 1985/86 (table 43). Soybean acreage grew most rapidly in South America. After increasing soy- bean acreage in the early 1970's, China, the third leading producer of soybeans, has reduced acreage to near the levels of the late 1960's.
Soybean yields have trended upward in all major soy- bean regions during the last 15 years or more (table 44). The increases, on average, were largest in Ar- gentina and Brazil.
The soybean industry should continue growing, but at a much slower pace. Much of the growth in U.S. soy- bean use has come from foreign trade. The U.S. dominance of the world market has eroded recently because of competition from South American soy- bean production; increased foreign production of tree oils, especially palm oil; expanded European oilseed production, especially rapeseed; and unfavorable for- eign trade policies. Foreign markets are vital to the future of the U.S. soybean industry.
World Trade
Soybeans and their products dominate U.S. exports of oilseeds and oilseed products, comprising 87 per- cent of oilseed export earnings and 20 percent of to- tal U.S. agricultural export sales in the 1980's. The U.S. soybean industry has become increasingly de- pendent on the export market. About 42 percent of the U.S. soybean crop was exported as beans in the early 1980's, compared with 24 percent in the early 1960's and 37 percent in the early 1970's. The United States exported 25 percent of its soybean meal pro- duction and 15 percent of its soybean oil production in the 1980's.
Soybean trade. Three Western Hemisphere coun- tries, the United States, Argentina, and Brazil, ac- counted for 95 percent of total soybean exports for the 1981/82-85/86 marketing years (table 45). The U.S. share of the soybean export market was 78 per- cent in 1980/81. This share rose to 86 percent in the next 2 marketing years, then fell for 3 years, ending at n percent in 1985/86. Trade data for 1985/86 show that U.S. soybean exports returned to 1983/84 levels. The rate of increase in soybean exports during the last decade was significantly larger in the South American countries than in other exporting countries, including the United States.
Japan is the leading importer of soybeans, account- ing for 15-19 percent of the total world imports for
Table 42—Soybean production by country
Marketing year^
United states Brazil China Argentina Paraguay Other World
total
7,000 metric tons
1967/68 26,575 654 6.950 22 14 2,239 36.454 1968/69 30,127 1,057 6.480 32 45 2.399 40,140 1969/70 30,839 1,509 6,200 27 52 2.410 41.037 1970/71 30,675 2,077 6.900 59 75 2.623 42.409 1971/72 32.009 3,666 7,900 78 97 2.667 46.417 1972/73 34,581 5.012 8.700 272 122 2,746 51.433 1973/74 42,118 7,876 10,000 496 181 3.283 63.954 1974/75 33,102 9,892 9,500 485 220 3.394 56.593 1975/76 42,139 11,227 10,000 695 284 3,954 68.299 1976/77 35,070 12.513 6,650 1,400 377 3,393 59.403
1977/78 48,097 9,541 7,250 2,700 333 4,204 72.125 1978/79 50,859 10,240 7,565 3,700 549 4,454 77,367 1979/80 61.525 15.156 7,460 3,600 575 5.192 93.705 1980/81 48,921 15,200 7.940 3.500 600 4,774 80.786 1981/82 54,135 12,835 9,325 4.150 600 4,947 86,292 1982/83 59,610 14,750 9,030 4.200 520 5,324 93,434 1983/84 44,518 15,541 9,760 7,000 550 5,710 83,080 1984/85 50.644 18,278 9,030 6.750 950 6.560 92,630 1985/86 57,113 14,100 10,500 7.300 600 7.260 96,880
^ The marketing year begins in September for the United States and China, February for Brazil (April for 1976 and before), and April for Argentina and Paraguay.
Source: (59).
41

Table 43—Harvested area of soybeans by country
Marketing year^
United States Brazil China Argentina Paraguay Other World
total
1,000 hectares
1967/68 16,109 722 8,180 20 14 2,826 27,871 1968/69 16.751 906 8,000 28 28 2.769 28,482 1969/70 16.729 1,319 8.000 26 40 2,956 29,070 1970/71 17.098 1,716 8,000 36 54 2.971 29,875 1971/72 17.282 2,840 8,300 68 76 3.055 31,621 1972/73 18,488 3,615 9,100 157 81 3.239 34.680 1973/74 22,528 5,143 9.100 344 127 3.545 40,787 1974/75 20,777 5,824 8,800 356 151 3,584 39,492 1975/76 21,698 6,417 9,100 434 173 3,362 41,184 1976/77 19,992 7,070 6,690 660 229 3,357 37.998
1977/78 23,403 7,782 6,850 1,250 272 3,657 43.214 1978/79 25.764 8,256 7,144 1,600 360 3,983 47.107 1979/80 28,467 8,774 7,247 2,030 400 4,314 51,232 1980/81 27,443 8,501 7,226 1,740 400 4,151 49.461 1981/82 26,776 8.202 8,024 1,986 400 4,543 49.931 1982/83 28,102 8,136 8.414 2,281 360 4.983 52.266 1983/84 25,303 9,421 7,567 2.910 420 4.794 50,415 1984/85 26.755 10,153 7,290 3,269 550 5,876 53,893 1985/86 24,922 9,450 7,720 3,350 550 6,010 52,000
^ The marketing year begins in September for the United States and China, February for Brazil (April for 1976 and before), and April for Argentina and Paraguay.
Source: {59).
1980/81-85/86 (table 46). Half of the world soybean imports went to the European Community (EC) coun- tries in 1985/86. This share is larger than the 40 per- cent which typically goes to the EC. Within the EC, the primary soybean importers are the Netherlands and the Federal Republic of Germany. These coun- tries ship soybeans and soybean products to the rest of the EC.
Japan is the single biggest customer for U.S. soy- beans. About 19 percent of U.S. exports during 1980/81-85/86 were sold to Japan. This figure is smaller than the 25 percent that went to Japan in the 1960's and 1970's. Between 50 and 60 percent of U.S. exports go to European nations. Spain, the Fed- eral Republic of Germany, and the Netherlands are the United States' primary European markets. Mexico and Taiwan were minor markets in the 1960's, but each now accounts for 7 percent of U.S. exports.
Soybean meal trade. The United States and Brazil are the leading exporters of soybean meal, account- ing for 56 percent of world soybean meal exports in 1984/86 (table 45). The U.S. and Brazilian share has declined from 74 percent they had in the late 1970's and early 1980's because of substantial growth in Ar- gentine exports. Some EC countries import soybeans, crush them for oil and meal, and then ship much of the meal produced to other EC countries (table 47). This activity and direct imports of soybean meal make
Table 44~Soybean yields in major producing countries
Periods United States Brazil China Argentina Paraguay Other World
1967-71 1972-76 1977-81 1982-86
Bushels per acre
26.6 17.8 12.6 18.2 19.8 12.6 20.9 26.9 24.6 15.6 25.5 23.1 14.6 23.0 29.8 24.1 16.3 30.3 21.5 16.6 25.4 30.8 25.5 19.2 31.3 22.0 16.9 26.6
Source: (59).
the EC both a major importer and a major exporter of soybean meal. EC and other European nations are the major importers of soybean meal and the primary destinations for U.S. soybean meal exports.
Soybean oil trade. Brazil, the United States, and the EC are the leading exporters of soybean oil, account- ing for 75 percent of world soybean oil exports (table 45). Argentina has expanded soybean oil exports from less than 2 percent to over 12 percent of the world total. Soybean oil imports are distributed more evenly among a larger number of countries than ei- ther soybeans or soybean meal (table 48). Major im- porters of soybean oil include the EC, India, Pakistan, Eastern European nations, and Mideast/North Africa countries. Pakistan is the leading recipient of U.S. soybean oil exports. Other important destinations for U.S. soybean oil are India, Mexico, and South Ameri- can countries, except Brazil and Argentina.
42

Table 45—Exports of soybeans and soybean products
Product and country Marketing years
1980/81 1981/82 1982/83 1983/84 1984/85
1,000 metric tons Soybean exports:
United States 19,712 25,285 24,634 20,215 16,279 Brazil 1,798 858 1,320 1,591 3,476 Argentina 2,700 1.876 1.417 2,970 3,292 Paraguay 630 830 610 430 845 Other 503 474 596 879 1,349
Total 25.343 29.323 28,577 26,085 25,241
Soybean meal exports: United States 6,154 6.266 6.449 4,862 4.460 Brazil 7,740 8.347 8.239 7,709 8,441 Argentina 408 736 1,547 2,117 2,875 EC-10^ 3,811 4,261 5,302 4,586 4,537 Other 736 1,114 1,685 2,018 1,976
Total 18,849 20.724 23.222 21,292 22,889
Soybean oil exports: United States 740 942 918 827 753 Brazil 1.153 852 1.020 990 985 Argentina 64 120 274 427 510 EC-10^ 865 948 946 981 937 Spain 411 478 420 538 265 Portugal 18 57 65 NA 106 Other 92 103 128 208 108
Total 3,343 3,500 3.771 3,971 3.664
NA = Not available. Note: Individual marketing years, except for Argentina and Brazil which are converted to an October-September basis. For Northern
Hemisphere countries, marketing years begin in the first year shown, and Southern Hemisphere countries begin in the second year. ^ EC-10 = Belgium, Denmark. Federal Republic of Germany, France, Greece, Ireland, Italy, Luxembourg, Netherlands, and the United
Kingdom. Source: (58).
Table 46—Soybean imports
Country/region Marketing year
1980/81 1981/82 1982/83 1983/84 1984/85
7,000 metric tons
European Community total 13,216 15,962 15.569 12,724 12,751 Germany, Fed. Rep. 3,080 3,680 3.525 2,353 2,874 Netherlands 2.938 3,105 2,960 2,800 2,831 Spain 2,790 3,196 3,040 2,600 1,939 Italy 1,131 1.460 1.584 1,087 1,374 Belgium-Luxembourg 1,098 1.510 1,601 1.530 1,312 Portugal 250 414 735 812 1,013 France 509 878 941 664 576 United Kingdom 1,022 1.288 672 500 485 Denmark 205 206 200 156 99
Eastern Europe 517 481 662 842 583 Soviet Union 1.476 1.485 992 950 850 Japan 4,213 4.486 4,871 4,728 4.611 Taiwan 1.075 1.170 1,272 1.360 1,467 South Korea 529 541 695 712 809
Mexico 1.370 566 1,070 1.442 1,430 Canada 401 424 410 280 229 Other 3,644 4,122 2,507 2,162 2,590
Total 26,441 29,237 28,048 25.200 25,320
Source: {58).
43

Table 47—Soybean meal Imports
Country/region Marketing year
1980/81 1981/82 1982/83 1983/84 1984/86
1,000 metric tons
European Community total Mexico Japan Soviet Union Eastern Europe Other
9,915 150 290
1,055 4,297 3,552
12,153 41
103 1,211 3,263 4,171
12.408 180 177
2,550 2,878 4,572
12,452 50
181 830
3,507 4,780
13,383 78 94
550 3,500 5.185
Total 19,259 20,942 22.765 21.800 22.790
Source: (58).
Table 48-Soybean oil imports
Country/region Marketing year
1980/81 1981/82 1982/83 1983/84 1984/85
7,000 metric tons
European Community
Mexico Brazil India Pakistan China
456 25
0 595 219
73
522 80 12
419 304
31
518 26 10
500 310
20
569 67 50
808 285
0
518 49
160 418 189
10
Soviet Union Eastern Europe Mideast/
112 202
192 127
230 218
100 181
325 199
North Africa Other Latin
735 790 758 749 786
America Other
457 426
472 497
503 552
464 607
455 481
Total 3,302 3,446 3,645 3,880 3,590
Source: (58).

References
(1) Ash, M. S., and W. M. Meyers. "The U.S. and Iowa Soybeans Markets: Implications to Iowa Soybean Producers." Contributed paper to NCR-134 Conference on Applied Commodity Analysis, St. Louis, 1986.
(12) Gallagher, P., and R. C. Green. A Cropland Use Model. Staff Report AGES840410, U.S. Dept. Agr., Econ. Res. Serv., 1984.
(13) Gardiner, W. H., and R M. Dixit. Price Elasticity of Export Demand. Staff Report AGES860408. U.S. Dept. Agr., Econ. Res. Serv., 1986.
(2) Barre, H. J. "Storage and Quality Control of Soybeans on the Farm," World Soybean Re- search. Danville, IL: The Interstate Printers and Publishers, Inc., 1976, pp. 734-44.
(3) Brewster, J. M., and J. M. Mitchell. Size of Soy- bean Oil Mills and Returns to Growers. MRR-121. U.S. Dept. Agr, 1956.
(4) Brorsen, B. W., and others. "Spatial and Tem- poral Relationships Among Selected U.S. Grain Markets," North Central Journal of Agricultural Economics, Vol. 7 (1985), pp. 1-10.
(5) Chambers, R. G., and R. E. Just. "Effects of Exchange Rate Changes on U.S. Agriculture: A Dynamic Analysis," American Journal of Agricul- tural Economics, Vol. 63 (1981), pp. 32-46.
(6) Chicago Board of Trade. Commodity Trading Manual. Chicago, 1985.
(7) Christensen, C. M. "Maintaining Quality of Soy- beans During Storage," World Soybean Research. Danville, IL: The Interstate Printers and Publishers, Inc., 1976, pp. 724-30.
(14) Gardner, B. L. "Futures Prices in Supply Analy- sis," American Journal of Agricultural Econom- ics, Vol. 58 (1976), pp. 81-84.
(15) Glaser, Lewrene. Pro\/lslons of the Food Security Act of 1985. AIB-498. U.S. Dept. Agr, Econ. Res. Serv., Apr. 1986.
(16) Glauber, J. W. "The Role of Price Expectations in the Intertemporal Allocation of Soybeans." Ph.D. dissertation. Univ. of Wisconsin-Madison, 1984.
(17) Good, Darrel. Deferred Pricing Alternatives for Grain, Producer Marketing Management-Fact Sheet #2. N.C.R. Ext. Pub. No. 217, Univ. of Illinois at Urbana/Champaign, 1985.
(18) . Illinois Regional Basis, Corn and Soybeans, 1980-84. AE-4590. Coop. Ext. Serv., Univ. of Illinois at Urbana/Champaign, Mar. 1985.
(19) Gordon, J. D. The Distribution of Daily Changes in Commodity Futures Prices. TB-1702. U.S. Dept. Agr, Econ. Res. Serv., 1985.
(8) Food and Agricultural Policy Research Institute. "Marketing Loan Option for the U.S. Soybean Industry: Economic Evaluation Through 1990/91." Ames: Iowa State Univ., 1986.
(20) "A Study of International Soy- bean Production, Trade, and Storage, and the Prospects for Price Stabilization." Ph.D. disser- tation. Univ. of Pennsylvania, 1982.
(9) Free, W. J. "Location, Type, and Size of the U.S. Soybean Processing Industry." World Soy- bean Research. Danville, IL: The Interstate Printers and Publishers, Inc., 1976, pp. 715-23.
(10) Fryar, Ed. "Edible Vegetable Oil Prices in the United States and World Markets." Ph.D. dis- sertation. Univ. of Minnesota, Dept. Agr. Econ., 1982.
(21) Guilfoy, Robert F The Physical Distribution Sys- tem for Grain. AIB-457. U.S. Dept. Agr., Off. of Transportation, Oct. 1983.
(22) Helmberger, R G., and V. Akinyosoye. "Com- petitive Pricing and Storage Under Uncertainty with an Application to the U.S. Soybean Market," American Journal of Agricultural Eco- nomics, Vol. 66 (1984), pp. 119-30.
(11) , and Roger Hoskin. "U.S. Vegeta- ble Oil Price Relationships," Oil Crops Outlook and Situation Report. OCS-9. U.S. Dept. Agr., Econ. Res. Serv., 1985, pp. 21-29.
(23) Henry, R. R. "Short-Run Price Formation in the International Soybean Complex: A Dynamic Econometric Analysis." Ph.D. dissertation. Univ. of California-Davis, 1981.
45

(24) Hexern, Roger W., and Robert F. Boxiey. Trends in Double Cropping. AER-553. U.S. Dept. Agr., Econ. Res. Serv., June 1986.
(25) Hieronymous, T. A. Economics of Futures Trad- ing. New York: Commodity Research Bureau, Inc., 1980.
(26) Hill, L. D. "Improving Grades and Standards for Soybeans," Worid Soybean Research Confer- ence II: Proceedings. Ed. Frederick T. Corbin. Boulder, CO: Westview Press, 1980, pp. 823-30.
(27) Houck, James R, Mary E. Ryan, and Abraham Subotnik. Soybeans and Their Products — Mar- kets, Models, and Policy. Minneapolis, MN: Univ. of Minnesota Press, 1972.
(28) Kaufman, Henry H. "Commercial Storage and Handling of Soybeans," World Soybean Research. Danville, IL: The Interstate Printers and Publishers, Inc., 1976, pp. 731-33.
(36)
(37)
Lowry, M. N. "Rational Price Expectations in Models of Markets for Storable Field Crops: Theoretical Foundations with an Application to the U.S. Soybean Market." Ph.D. dissertation. Univ. of Wisconsin-Madison, 1984.
, and others. "Pricing and Storage of Field Crops: A Quarterly Model with Applica- tion to Soybeans." Staff paper 237. Univ. of Wisconsin, 1985.
(38) Markley, K. S. Soybeans and Products. New York: Interscience Publisher, Inc., 1951, p. 543.
(39) Meiike, K. D., L. Young, and D. Miller. "A Quar- terly Forecasting Model of the Canadian Soy- bean Sector." Working paper no. !>. School of Agr. Econ. and Ext. Ed., Univ. of Guelph, 1980.
(40) Meiike, Myles J. Argentine Agricultural Policies in the Grain and Oilseed Sectors. FAER-206. U.S. Dept. Agr, Econ. Res. Serv., 1984.
(29) Kromer, G. W. "Factors Affecting Soybean Oil and Meal Yields," The Fats and Oils Situation. FOS-236. U.S. Dept. Agr., Econ. Res. Serv., Jan. 1967.
(41) Meyers, W. H., and D. Hacklander. An Econo- metric Approach to the Analysis of Soybean and Soybean Product Markets. Staff Report. U.S. Dept. Agr, Econ. Res. Serv., June 1979.
(30)
(31)
(32)
. "U.S. Soybean Processing Ca- pacity Expanding," The Fats and Oils Situation. FOS-255. U.S. Dept. Agr, Econ. Res. Serv., Nov. 1970.
., and C. B. Gilliland. Processing
(42) M. Helmar, and S. Devadoss.
the Three Major Oilseeds. MRR-58. U.S. Dept. Agr, Agr. Mktg. Serv., 1954.
, and S. A. Gazelle. U.S. Edible Fats and Oils Refining Capacity. ERS-621. U.S. Dept. Agr., Econ. Res. Serv., 1975.
(33) Leath, M. N. "Soybean Marketing Patterns in the United States," Fats and Oils Outlook and Situation. FOS-306. U.S. Dept. Agr, Econ. Res. Serv., Feb. 1982, pp. 21-24.
(34) , L. D. Hill, and S. W. Fuller. Soy- bean Movements in the United States. Bui. 766. Agr. Exp. Sta., Univ. of Illinois, Jan. 1981.
(35) Lee, D. R., and R G. Helmberger. "Estimating Supply Response in the Presence of Farm Programs," American Journal of Agricultural Economics, Vol. 67 (1985), pp. 193-203.
(43)
(44)
"FAPRI Trade Model for the Soybean Sector: Specification, Estimation, and Validation." FAPRI Staff Report 86-SR02. Ames: Iowa State Univ., 1986.
Morrison, W. R. Cost and Use of Storage for Soybeans, Oats, and Wheat in Arkansas. Bui. 562. Agr. Exp. Sta., Univ. of Arkansas, 1955.
Pahigian, Noriar. Marketing Study of the Oil Content of Soybeans as Related to Production Areas and Climate. U.S. Dept. Agr., Prod, and Mktg. Adm., 1950.
(45) Paul, A. B. "The Pricing of Binspace — A Con- tribution to the Theory of Storage," American Journal of Agricultural Economics, Vol. 52 (1970), pp. 1-12.
(46) Paul, A. B., R. G. Heifner, and J. D. Gordon. Farmers' Use of Cash Forward Contracts, Fu- tures Contracts, and Commodity Options. AER-533. U.S. Dept. Agr., Econ. Res. Serv., May 1985.
46
(47) Peier, J. D., and C. B. Gilliland. Capacity and Processing Trends in tlie l=ats and Oils Industry. MRR-360. U.S. Dept. Agr, Agr. Mktg. Serv., 1959.
(48) Plato, Gerald. "Valuing American Options on Commodity Futures Contracts," Agricultural Economics Research, Vol. 37, No. 2 (Spring 1985), pp. 1-15.
(49) Rollefson, A. M., D. B. Agnew, and C. H. Keistead. impro\/ing Soyt^an Marketing Through Farm Storage. AIB-57. U.S. Dept. Agr, Prod, and Mktg. Adm., 1951.
(50) U.S. Department of Agriculture. Agricultural Sta- tistics. Annual issues, 1950-85.
(51)
(52)
(53)
(54)
(55)
(56)
(57)
(58)
_, Agricultural Stabilization and Conservation Service. Farm Commodities and Related Programs. AH-345. Rev. Mar. 1976.
., Economic Research Service. Economic Indicators of the Farm Sector: Costs of Production, 1985. ECIFS 5-1, Aug. 1986.
., Economic Research Service. Em- bargoes, Surplus Disposal, and U.S. Agriculture. AER-564. Dec. 1986.
., Economic Research Service. Feed Situation and Outlook Report. Various is- sues, 1965-86.
., Economic Research Service. Oil Crops Situation and Outlook Report. Various issues, 1960-86.
., Economic Research Service. Soyt)eans: Background for 1985 Farm Legisla- tion. AIB-472. Sept. 1984.
., Federal Grain Inspection Service. Grain Inspection Handtxx>k. 1985.
, Foreign Agricultural Service. For- eign Agriculture Circular: Oilseeds and Products. Various issues, 1967-86.
(59)
(60)
(61)
. National Agricultural Statistics Service. Grain Stocks. Various issues, 1965-87
, Statistical Reporting Service. Crop Production 1985 Summary. Feb. 1986.
, Statistical Reporting Service. Crop Values. Various issues, 1965-85.
(62) U.S. Department of Commerce, Bureau of the Census. 7982 Census of Agriculture. Volume 1, State and County Data. 1984.
(63)
(64)
, Bureau of the Census. 7982 Cen- sus of Manufactures. MC82-I-20G Industry Se- ries, Fats and Oils. Mar. 1985.
., Bureau of the Census. Current
(65)
Industrial Reports, Fats and Oils — Oilseed Crushing. M20J Series. Various issues, 1960-86.
, Bureau of the Census. Current Industrial Reports, Fats and Oils, Production, Consumption, and Factory and Warehouse Stocks. M20K Series. Various issues, 1960-86.
(66) Weiss, Theodore J. Food Oils and Their Uses. Westport, CT: AVI Publishing Co., 1983.
(67) Wendland, Bruce, and Roger Hoskin. "U.S. High Protein Meal Price Relationships," Oil Crops Outlook and Situation Report. OCS-10. U.S. Dept. Agr., Econ. Res. Serv., Mar. 1986, pp. 16-19.
(68) Westcott, R C, and D. B. Hull. A Quarterly Forecasting Model for U.S. Agriculture. TB-1700. U.S. Dept. Agr, Econ. Res. Serv., May 1985.
(69) Williams, G. W. "The U.S. and World Oilseeds and Derivative Markets: Economic Structure and Policy Interventions." Ph.D. dissertation. Purdue Univ., 1981.
(70) Williams, G. W., and R. L. Thompson. The Bra- zilian Soybean Industry. FAER-200. U.S. Dept. Agr., Econ. Res. Serv., 1984.
(71) Willimack, Diane K. "U.S. Edible Fats and Oils Refining Capacities, 1983," Oil Crops Outlook and Situation Report. OCS-7. U.S. Dept. Agr., Econ. Res. Serv., May 1985.
(72) Withers, R. E. "On Farm Stored Grain Must Hold Quality," Southwest Farm Press, May 1981, p. 18.
(73) Womack, A. W., and others. "An Analysis of the Food Security Act of 1985." FAPRI Staff Report 1-86. Ames: Iowa State Univ., 1986.
47

Appendix A: Soybean Acreage, Yield, and Production Trends
these means is measured by the coefficients of varia- tion shown in appendix table 3.
Soybean planted acreage, yield, and production have increased over time. We used ordinary least squares regression to measure this upward trend. Results of this statistical procedure are shown in appendix table 1 and appendix figures 1-3. Significant positive trends were found in planted acres, yield, and pro- duction. The trend in planted acres was 1.68 million acres per year. The trend in production was 55.94 million bushels per year, and the trend in yield was 0.32 bushel per acre per year.
The upward trend in soybean acreage, yield, and pro- duction is also revealed in appendix table 2 which shows the means for different periods. The variability of planted acres, yield, and production in relation to
Appendix table l 1—Trend regression results
Dependent variable
Trend coefficient ^
Intercept R-square
Million planted acres 1.68 (.06)
-3.265 0.95
Million bushels produced 55.94 (2.65)
-108,986 .93
Bushels per acre .32 (.03)
-595 .79
Note: Data are U.S. annual figures, 1950-86. The independent variable is the four-digit year.
^ Standard error of the coefficient is in parentheses.
Appendix figure 1
Soybean yield
Bushels per acre
36
32
28
24
20
16
Reported yield
■ ' '
1950 55 60 65 70 75 80 85
48

Appendix figure 2
Soybean planted acres
Million acres
80
70
60 h
50
40
30
20
10
/•-...A„
''■■■'
1960 56 60 65 70 75 80 85
Appendix figure 3
Soybean production
Billion bushels
2.5
2.0
1.5
1.0
0.5 -
I I I
1950 55
A A
7
^^0"""^^
N 1 Fitted productiofT^^^i!^
i:f Reported production •••♦^
60 -. L-
65 70 '
75 80 85
49

Appendix table 2- -Means for U.S. soybeans
Period Means
Planted acres Yield^ Production
Million acres Bushels per acre Million bushels
1950-85 41.2 25.5 1,079
1950-59 19.6 21.4 391 1960-69 34.1 24.9 829 1970-79 54.3 28.1 1.508 1980-86 66.2 30.0 1,931
1950-54 16.7 20.3 298 1955-59 22.6 22.6 484 1960-64 28.5 24.0 661 1965-69 39.6 25.7 998 1970-74 48.5 26.7 1,268 1975-79 60.0 29.4 1,748 1980-84 68.0 28.5 1,896
Appendix tabie 3—Coefficients of variation for U.S. soybeans
Period Coefficient of variation
Planted acres Yield Production
1950-85 0.4470 0.1421 0.5660
1950-59 .1700 .0815 .2729 1960-69 .1805 .0528 .2282 1970-79 .1590 .0800 .2319 1980-86 .0541 .0900 .0985
1950-54 .0717 .0567 .0806 1955-59 .0780 .0646 .1462 1960-64 .0814 .0328 .0819 1965-69 .0730 .0456 .1085 1970-74 .1078 .0582 .1165 1975-79 .1239 .0678 .1873 1980-84 .0358 .0727 .0993
^ Unweighted arithmetic mean of annual data.
50

Appendix B: U.S. Standards for Soybeans
There are two classes of soybeans: Yellow soybeans and Mixed soybeans. There are no soybean subclasses. Yellow soybeans is the class most com- monly exported by the U.S. market. Each class is di- vided into four U.S numerical grades and U.S. Sam- ple grade. Special grades emphasize special qualities or conditions affecting the value of the soybean. These special grades are a part of the grade designa- tion but do not affect the numerical or Sample grade designation. The at-par deliverable grade for futures contracts at the Chicago Board of Trade and the MidAmerica Commodity Exchange is No. 2 Yellow with substitution at differentials established by the exchanges.
Definitions for Standards
• Test weight per bushel is a determination of the number of pounds of soybeans in a Winchester bushel.
• Moisture is the water content of grain as deter- mined by an approved electronic moisture meter. Effective September 9, 1985, the percent- age of moisture in a sample does not affect the numerical grade.
Splits are soybeans with more than one-fourth of the bean removed and which are not damaged.
Damaged kernels are soybeans and pieces of soybeans which are badly ground damaged, badly weather damaged, diseased, frost dam- aged, heat damaged, insect bored, mold dam- aged, sprout damaged, stinkbug stung, or other- wise materially damaged.
Heat-damaged kernels are soybeans and pieces of soybeans which are materially discolored and damaged by heat.
Foreign material is all matter, including soybeans and pieces of soybeans, which will readily pass through an 8/64-inch sieve and all matter other than soybeans remaining on the sieve after siev- ing.
Soybeans of other colors are soybeans which have green, black, brown, or bicolored seed coats. Before September 9, 1985, this factor was called "brown, black, and/or bicolored soy- beans in yellow or green soybeans."
Appendix table 4—U.S. standards for soybeans
Grade
U.S. No. 1 U.S. No. 2 U.S. No. 3 2 U.S. No. 4 3
Minimum test
weight per
bushel
Maximum limits of —
Splits
Damaged kernels
Total Heat damaged
Foreign material
Pounds
56 54 52 49
-Percent-
10 20 30 40
U.S. Sample grade: U.S. Sample grade shall be soybeans which —
2 3 5 8
0.2 .5
1.0 3.0
(a) (b)
(c) (d)
Soybeans of other colors ^
1 2 5
10
Do not meet the requirements for U.S. Nos. 1, 2, 3, or 4; or Contain 8 or more stones which have an aggregate weight in excess of 0.2 percent of the sample weight, 2 or more pieces of broken glass, 3 or more crotalaria seeds {Crotalaria spp.), 2 or more castor beans (Ricinus communis), 4 or more pieces of an unknown substance(s) or a commonly recognized harmful or toxic substance(s). 10 or more pieces of rodent pellets, bird droppings, or an equivalent quantity of other animal filth per 1,000 grams of soybean; or Have a musty, sour, or commercially objectionable foreign odor (except garlic odor); or Are heating or otherwise of distinctly low quality.
^ Soybeans which are purple mottled or stained shall be graded not higher than U.S. No. 3. ^ Soybeans which are materially weathered shall be graded not higher than U.S. No. 4. ^As of September 9, 1985, moisture is no longer a grading factor for soybeans, although it is required to be shown on the certificate. Also, on
the same date the factor "brown, black, and/or bicolored soybeans in yellow or green soybeans" was changed to "soybeans of other colors '" In Mixed soybeans, the factor is disregarded.
Source: (57).
«U. S. COVERNWCNT PRINTING OFF ICE : 1988-201-089iaai74/LRS 51


![AOF New developments in soybean industry G Mills [Read-Only]](https://static.fdocuments.net/doc/165x107/6192d3491a76492f775534ab/aof-new-developments-in-soybean-industry-g-mills-read-only.jpg)