-Reminding “Mottainai” for food- - OECD.org 6_Ryoko Kawai.pdf · -Reminding “Mottainai” for...
14
“Loss-non” Promotion of NO-FOODLOSS PROJECT and food recycling -Reminding “Mottainai” for food- June 2016 Environmental Policy Office Biomass Policy Division Food Industry Affairs Bureau Ministry of Agriculture Forestry and Fisheries (MAFF), JAPAN
-
Upload
truongdung -
Category
Documents
-
view
218 -
download
0
Transcript of -Reminding “Mottainai” for food- - OECD.org 6_Ryoko Kawai.pdf · -Reminding “Mottainai” for...

“Loss-non”
P romot ion o f NO-FOODLOSS PROJECT and food recyc l ing
-Reminding “Mot ta ina i” fo r food-
June 2016
Environmental Policy Office B iomass Po l icy D iv i s ion Food Industry Affairs Bureau M i n i s t r y o f A g r i c u l t u r e F o r e s t r y a n d F i s h e r i e s
(MAFF), JAPAN

Usage situation of food waste generation (FY2013)〈Conceptual diagram〉
Main users of food resource
Business waste (8.06 m tons)
Valuable byproducts
[e.g. Soybean meal] (9.01 m tons)
1) Food-related business operators Food
manufacturers Food
wholesalers Food retailers Restaurant
industry
Household waste (8.70 m tons) Edible portion
leftovers, excess removed, direct
disposal (3.02 m tons)
Food waste generation under Food recycling Law
Food supply (83.39 m tons)
Food waste generation under Waste Management Law
2) Households
Business waste +
Valuable byproducts
(19.27 m tons)
Edible portion unsold/returned
products, leftovers
(3.30 m tons)
Recycled: 13.36 m tons feed: 9:75 m tons fertilizer: 2.49 m tons other: 1.12 m tons Thermal recovery: 0.45 m tons
Reduced: 2.20 m tons
Appropriate disposal: 3.26 m tons
Incineration, landfill: 8.13 m tons
Food waste (27.97 m tons)
Edible portion So-called [food loss]
6.32 m tons
Recycled: 0.57 m tons (fertilizer, methanation)
1

Food loss generation in Japan
2
Food loss generated in Japan (6.32 million tons) is about twice the food assistance amount in the whole world.
Weight of food loss per person per day in Japan is about a bowl of rice.
Businesses Edible portion(3.30 million tons)
Households Edible portion(3.02 million tons)
Food loss generation in Japan (FY2013)
(6.32 million tons) Food assistance amount
in the whole world (2014) about 3.20 million tons.
Weight of food loss per person per day
about 136g (about a bowl of rice)

The amount of food business waste (FY2013)
3
The total amount of food waste from the food-related industry was 19.27 million tons (FY2013). Manufacturers accounted for 83% of this.
The of edible portion was 3.30 million tons (FY2013). Manufacturers accounted for 43%, restaurants accounted for 35% of this.
(FY2013) Total amount
19.27Mt
Manufacturers 15.94Mt (83%)
Restaurants 1.88Mt (10%) Retailers
1.24Mt (6%)
Wholesalers 0.21Mt (1%)
Restaurants 1.17Mt (35%)
Retailers 0.6Mt (18%)
Wholesalers 0.1Mt (4%)
Manufacturers 1.42Mt (43%)
(FY2013) Total amount
3.30Mt
◆ Food waste generation ◆ Edible portion (food loss)
4
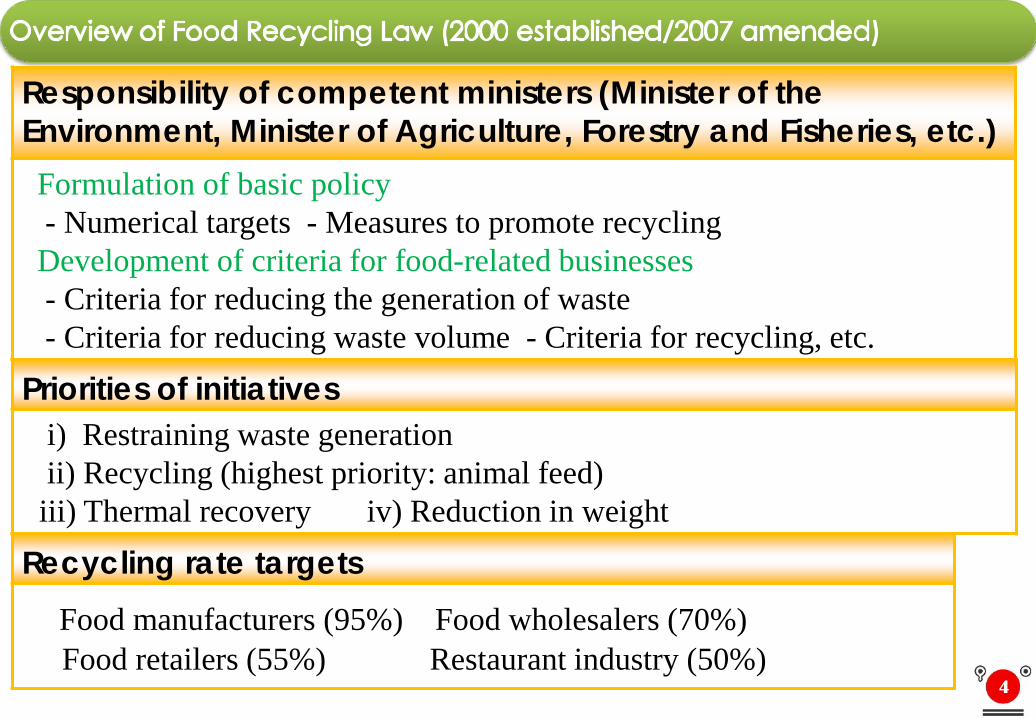
Priorities of initiatives i) Restraining waste generation ii) Recycling (highest priority: animal feed) iii) Thermal recovery iv) Reduction in weight
Recycling rate targets Food manufacturers (95%) Food wholesalers (70%) Food retailers (55%) Restaurant industry (50%)
Responsibility of competent ministers (Minister of the Environment, Minister of Agriculture, Forestry and Fisheries, etc.) Formulation of basic policy - Numerical targets - Measures to promote recycling Development of criteria for food-related businesses - Criteria for reducing the generation of waste - Criteria for reducing waste volume - Criteria for recycling, etc.

5
Promotion of 3R ●Set targets on food waste reduction for each industry group. E.g. Meat product manufacturing industry: 113kg/1 million Yen of sales. ●Mandatory regular reporting of the amount of food waste. From food-related businesses which produce large quantities of food waste (100 tons of
food waste or more in the previous year) to the competent minister ●Promote recycling by the private sector. Foster recycling business operators through the “Registered Recycling Business
Operator System” Formulate good practices (Food recycling loop) through the “Recycling Business
Plan Approval System”
Role of national government ● To all food-related business operators Guidance and advice
● To operators of recycling who generate food waste over 100t Advice, announcements, orders, penalties

Business type Target Business type Target Business type Target Meat product manufacturers
113kg/1 million yen of sales
Prepared food manufacturers
403kg/1 million yen of sales Miscellaneous restaurants 108kg/1 million
yen of sales
Milk/dairy product manufacturers
108kg/1 million yen of sales
Sushi/lunchbox/sandwich manufacturers
224kg/1 million yen of sales
Takeout/delivery food service(other than school lunch, etc.)
184kg/1 million yen of sales
Canned/bottled seafood manufacturers
480kg/1 million yen of sales
Food/drink wholesalers(mainly drinks)
14.8kg/1 million yen of sales Wedding halls 0.826kg/
1 person (user) Vegetable pickles manufacturers
668kg/1 million yen of sales Various food retailers 65.6kg/1 million
yen of sales Hotels 0.777kg/1 person (user)
Miso manufacturers 191kg/1 million yen of sales Snack/bread retailers 106kg/1 million
yen of sales Soy sauce manufacturers
895kg/1 million yen of sales Convenience stores 44.1kg/1 million
yen of sales
Sauce manufacturers 59.8kg/1 ton of product
Dining/restaurants (mainly offering noodles)
175kg/1 million yen of sales
Bread manufacturers 194kg/1 million yen of sales
Dining/restaurants (other than those mainly offering noodles)
152kg/1 million yen of sales
Noodle manufacturers 270kg/1 million yen of sales Bars, etc. 152kg/1 million
yen of sales Tofu/fried tofu manufacturers
2,560kg/1 million yen of sales Cafés 108kg/1 million
yen of sales Precooked frozen packed food manufacturers
363kg/1 million yen of sales Fast food stores 108kg/1 million
yen of sales
■ Targets for the control of food waste generation (April 2014 - March 2019)
■New targets(July 2015)
Business type Target
Miscellaneous livestock product manufacturers
501kg/1 ton of sales
Vinegar manufacturers 252kg/1 million yen of sales
Confectionary manufacturers
249kg/1 million yen of sales
Coffee drinks and juice manufacturers
429kg/1 ton of product
School lunch and hospital food, etc.
332kg/1 million yen of sales
Targets for the control of food waste generation
6

The so-called “one-third rule” is one of the factors that create food loss.
Conceptual diagram of deadline set by so-called “one-third rule” (in the case of expiration date 6 months)
Consumer
Selling at store
2 months 2 months 2 months
Production date
Wholesaler
Manufacturer
Disposed / Returned from wholesaler and
retailer to manufacturer:
82.1 billion yen/year
Disposed / Returned from retailer to
wholesaler: 43.2 billion yen/year
● International comparison
Country Delivery deadline (Expiration date base)
USA Leaving 1/2 France 1/3 Italy 1/3 Belgium 1/3 Japan Leaving 2/3
on average
Efforts of the food industry (1) Review of delivery deadline
7
Delivery deadline Sell deadline Expiration
date
Grocery store

Confectionary Soft drinks
2months Production date Delivery deadline Sell deadline Expiration date
Manufacturer
3months
Monitoring delivery, expired stocks, returned, disposal
and transfer
Monitoring sales, expired stocks
Monitoring returned, non-shipped and
disposal
Monitoring buying behavior
consumers
Modified delivery deadline of soft drinks and confectionary in demonstration projects. Total food loss in the supply chain decreased drastically.
Wholesaler Grocery store Selling at store
Removal and disposal (or sell at a discount)
Sell deadline set by retailers
3months
Current
Pilot project
(Expiration date 6 months)
Efforts of the food industry (1) Review of delivery deadline
8
Manufacturer Wholesaler
Returned(disposal)
Returned(disposal)
Expiration date Delivery deadline Production date
2months 2months
Grocery store

Extending the expiration date Changing display from expiration date to expiration month
Efforts of the food industry (2) Review of Expiration date
○January 2009 – October 2013 Extending 958 items ○November 2013 – October 2014 Extending 199 items ○November 2014 – October 2015 Extending 163 items ○Future plans Extending 587 items
○January 2009 – October 2013 Switching 50 items ○November 2013 – October 2014 Switching 159 items ○November 2014 – October 2015 Switching 115 items ○future plans Switching 107 items
After Before
Instant noodles in bag packing Expiration date: 6 months 8 months
Cup noodles Expiration date: 5 months 6 months
Best Before 01/24/2019
Best Before January 2019
9

Before
Efforts of the food industry (3) Improved packaging
10
PE
Oxygen Barrier
Layer
PE
Oxygen Barrier Layer
PE
After
PE
Oxygen Barrier Layer
Oxygen Absorbing
Layer
Oxygen Barrier Layer
PE
Oxygen
Oxygen
Inside
Outside
Outside
Inside
By using a bottle with high oxygen barrier properties, the expiration date of mayonnaise can be
extended from 7 months to 12 months.

5114 6443
4525
0
1000
2000
3000
4000
5000
6000
7000
2011 2012 2013Data: MAFF (FY 2013)
Amount of Food loss reduction by food banks(tons)
Food bank activity in Japan Effectively utilize food as much as possible by donating food to welfare facilities. Donated food is mislabeled food, dented cans and products nearing expiration, etc. In Japan, Food banks have a relatively short history. There are about 40 organizations. NPO “Second Harvest Japan” is the largest food banking organization. (1,689 tons in 2011)
11

Both the public and private sectors are promoting the NO-FOODLOSS PROJECT toward
raising public consciousness and encouraging action by supporting activities in each stage of the food chain.
Japan publicizes its activities to the world as the ”Mottainai” origin country.
Promote useful and effective use of resources across the whole food chain.
Raise public consciousness
and encourage action
【Households・Consumers】 Strategic communication by stores, mass media, SNS, etc. (E.g. Promote understanding of expiration date labeling, eco
cooking )
【Manufacturers / Distributors / Retailers】 ・Pilot project for reviewing commercial custom ・Support of food bank activity ・Campaign of “Mottainai” 【Restaurants】 ・Call for “no leftovers” ・Change serving size ・Promoting doggy bags
Promotion of “NO-FOODLOSS PROJECT “
~NO-FOODLOSS PROJECT~
12
“Loss-non” the PR
character