, Raquel Garzon 1, Farid Zaidi , Cristina M....
23
1 Raw and processed chickpea flours effect on instrumental, nutritional and sensory properties of gluten free breads Meriem Ouazib 1,2 , Raquel Garzon 1 , Farid Zaidi 2 , Cristina M. Rosell 1 * 1 Food Science Department, Institute of Agrochemistry and Food Technology (IATA-CSIC), P.O. Box 73, 46100 Burjassot, Valencia, Spain 2 Department of Food Science, Faculty of Nature and Life Sciences, Abderrahmane Mira University. Route Targa-Ouzemour, Bejaia 06000, Algeria *Corresponding author. Tel.: +34 96 390 0022; fax: +34 96 363 6301. E-mail address: [email protected] (C.M. Rosell). 1 ABSTRACT 2 The effect of processing (germination, toasting and cooking) of chickpea beans was investigated 3 on the resulting flours characteristics and their potential for obtaining gluten free breads. 4 Rheological properties of dough were recorded using Mixolab ® and breads were analyzed for 5 their instrumental quality, nutritional and sensory properties. Chickpea based doughs showed 6 low consistency and their rheological behavior was defined by the starch gelatinization and 7 gelification. The bread made with cooked chickpea flour exhibited the lowest specific volume 8 (0.58 mL/g), brightest crumb (L*= 76.20) and softest texture, but cooking decreased the content 9 of carbohydrates, ashes and proteins, although increased the protein digestibility. The highest 10 specific volume was obtained in bread made with toasted chickpea flour, although crumb 11 hardness was higher. Overall, processing of chickpea beans, concretely toasting and cooking led 12 to flours that could be used for obtaining gluten free breads with the nutritional characteristics of 13 the legumes and acceptable sensory characteristics. 14
-
Upload
phungthien -
Category
Documents
-
view
216 -
download
0
Transcript of , Raquel Garzon 1, Farid Zaidi , Cristina M....
1
Raw and processed chickpea flours effect on instrumental, nutritional and sensory
properties of gluten free breads
Meriem Ouazib1,2, Raquel Garzon 1, Farid Zaidi2 , Cristina M. Rosell1*
1Food Science Department, Institute of Agrochemistry and Food Technology (IATA-CSIC), P.O.
Box 73, 46100 Burjassot, Valencia, Spain
2 Department of Food Science, Faculty of Nature and Life Sciences, Abderrahmane Mira
University. Route Targa-Ouzemour, Bejaia 06000, Algeria
*Corresponding author. Tel.: +34 96 390 0022; fax: +34 96 363 6301.
E-mail address: [email protected] (C.M. Rosell).
1
ABSTRACT 2
The effect of processing (germination, toasting and cooking) of chickpea beans was investigated 3
on the resulting flours characteristics and their potential for obtaining gluten free breads. 4
Rheological properties of dough were recorded using Mixolab® and breads were analyzed for 5
their instrumental quality, nutritional and sensory properties. Chickpea based doughs showed 6
low consistency and their rheological behavior was defined by the starch gelatinization and 7
gelification. The bread made with cooked chickpea flour exhibited the lowest specific volume 8
(0.58 mL/g), brightest crumb (L*= 76.20) and softest texture, but cooking decreased the content 9
of carbohydrates, ashes and proteins, although increased the protein digestibility. The highest 10
specific volume was obtained in bread made with toasted chickpea flour, although crumb 11
hardness was higher. Overall, processing of chickpea beans, concretely toasting and cooking led 12
to flours that could be used for obtaining gluten free breads with the nutritional characteristics of 13
the legumes and acceptable sensory characteristics. 14

2
Keywords: 15
Chickpea, Processing, Mixolab, Gluten free bread, In vitro protein digestibility, Chemical 16
composition. 17
18
1. Introduction 19
Legumes (pea, lentils, beans, soybean and chickpea) are one of the most important crops owing 20
to their nutritional quality. Legume seeds and flours are important sources of protein, 21
carbohydrates, vitamins, minerals and dietary fibre (Almeida-Costa et al. 2006; Baljeet et al. 22
2014; Rachwa-Rosiak 2015). Legumes are usually consumed as cooked meal form or in the dry 23
seed form after toasting as snack food (Rachwa-Rosiak 2015). In addition, legumes are also used 24
as nutritional additives or for replacing part of the wheat flour in baked products due to its 25
chemical composition (de la Hera et al. 2012; Petitot et al. 2010). 26
Chickpea (Cicer arietinum L.) is the third important legume of the world on the basis of total 27
production after soybean and bean, which is mainly grown in the hot climates of India, Pakistan, 28
Iran, Ethiopia, Mexico, and the Mediterranean area (FAO 2013). Chickpea is a protein (19–29 29
g/100 g) and carbohydrates (60–65 g/100 g) rich legume (Boye et al. 2010) and it is a source of 30
B complex vitamins and minerals (Seena et al. 2005). These nutritional properties can be even 31
improved using processing methods like germination, cooking or toasted that increase the 32
protein digestibility (Almeida Costa et al. 2006; Xu et al. 2014). 33
Taking advantage of chickpea nutritional properties, it has been proposed the application of 34
chickpea flour as functional ingredient in some bakery gluten free foods such as breads, cakes 35
and snacks. In fact, Han et al. (2010) developed 100% chickpea-based cracker snacks, which 36
fulfilled consumer demands providing health benefits. Gluten free breads have been produced 37
with chickpea flour with acceptable loaf specific volume and good sensory acceptance (Aguilar 38
et al. 2015; Miñarro et al. 2012). Even cakes have been developed by Gularte et al. (2012), who 39
studied the influence of incorporation of different pulses like chickpea on gluten free cakes (rice 40
3
flour/legume flour, 50:50), which resulted with higher total protein, available proteins, minerals 41
and fat. However the complete substitution of wheat flour by 100% of chickpea flour is difficult 42
to achieve in bakery products especially in bread where the gluten is responsible of its texture 43
quality. 44
Despite that processing methods have been applied to improve nutritional properties of chickpea 45
beans, scarce information exits about the use of the resulting flours for producing bakery 46
products. The objective of this study was to investigate the impact of processing treatments 47
(germination, toasting, cooking) on rheological properties of chickpea flours using Mixolab, as 48
well as to study the effect of replacing the wheat flour by 100% of raw and treated (germinated, 49
toasted and cooked) chickpea flour on quality, nutritional and sensory properties of final breads. 50
51
2. Material and methods 52
2.1. Material 53
Chickpea was grown in winter 2013 and harvested in June 2013, in the region of Merj-Ouamane, 54
commune of Amizour, wilaya of Bejaia; Algeria. Wheat flour was supplied by Harinera La 55
Meta, (Lleida,Spain), dry baker’s yeast (Lesaffre, France) and salt were purchased from the local 56
market. Freshbake improver Hydroxypropylmethyl cellulose K4M (HPMC K4M) was from 57
Dow Chemical, USA. 58
2.2. Methods 59
2.2.1. Preparation of legume´s flour 60
Four types of chickpea flour were compared: raw chickpea, germinated chickpea, cooked and 61
toasted chickpea. 62
Germinated chickpea flour: Chickpea seeds were soaked in tap water for 12 h, at room 63
temperature (22 °C ± 2) and kept in the dark. Then seeds were germinated between two sheets of 64

4
wet filter papers for 48 h at room temperature in the dark (22 °C ± 2). Germinated seeds were 65
dried overnight in stove at 60 °C. 66
To obtain cooked chickpea flour, chickpea seeds were soaked in tap water (1:10 w/v) for 12 h at 67
22 °C ± 2 in a dark room and then cooked in boiling tap water using a seed-to-water ratio of 68
(1:10 w/v). Samples were cooked for 15 min until reaching soft texture when pressing between 69
the fingers. Cooked seeds were rinsed with tap water, drained and dried overnight at 60 °C. 70
Toasted chickpea flour was obtained by toasting cleaned chickpea seeds in a stove (Bergstr.14D-71
78532, Tuttlingen) at 180 °C for 20 min. 72
All the processed chickpea seeds and the raw chickpea seeds were ground into flour with a 73
mortar and a pestle and then with a coffee grinder. The obtained powder was passed through a 74
0.5 mm screen to remove particle clumps and then flours were stored in air-tight plastic 75
containers and held at 4°C until further analysis. 76
2.2.2. Flour hydration properties 77
Water binding capacity (WBC) defined as the amount of water retained by the sample under 78
low-speed centrifugation was determined as described the standard method (AACCI 2010). 79
Samples (1.000 g ±0.001 g) were mixed with distilled water (10 mL) and centrifuged at 2000×g 80
for 10 min. WBC was expressed as grams of water retained per gram of solid. Three replicates 81
were made for each analysis. 82
Water absorption of the flours was determined in a Farinograph (Brabender® GmbH & Co, 83
Duisburg, Germany) equipped with a 300 g bowl, following the standard method (AACCI 84
2010). The water absorption was used for further rheological analysis and breadmaking process. 85
2.2.3. Mixolab measurements 86
Mixing and pasting behaviour of the legume based recipes were studied using the Mixolab® 87
(Chopin, Tripette et Renaud, Paris, France), which allows mixing the dough under controlled 88

5
temperature and also a temperature sweep until 90 °C followed by a cooling step. It measured in 89
real time the torque (expressed in Newton meters) produced by passage of dough between the 90
two kneading arms, thus allowing the study of its physicochemical behavior. Recipes, with the 91
exception of yeast, were used for analysis instead of flours, to identify the rheological profile of 92
the chickpea based doughs and to be as close as possible of breadmaking process. Samples for 93
Mixolab® analysis included based on % of flour basis: 1.63% salt, 4% sugar, 2% vegetable oil, 94
2% HPMC K4M and the amount of water varied depending on the type of flour. The amount of 95
water for raw, germinated, toasted and cooked flours was 120, 141, 141 and 205%, respectively, 96
which corresponded to the water absorption previously determined, to ensure complete 97
hydration of flours constituents. Total weight for each analysis was 90 grams. All ingredients 98
were introduced into the Mixolab® bowl and mixed. The settings used in the test were 8 min for 99
initial mixing, temperature increase at 4 °C/min until 90 °C, 7 min holding at 90 °C, temperature 100
decrease at 4 °C/min until 50 °C, and 5 min holding at 50 °C; and the mixing speed during the 101
entire assay was 80 rpm. Parameters that were used to characterize dough behavior included: 102
peak torque or the maximum torque during the heating stage (C3), the minimum torque during 103
the heating period (C4) and the torque obtained after cooling at 50 °C (C5), all of them 104
expressed in Newton meters (Matos and Rosell 2013). Two replicates were carried out for each 105
formulation. 106
2.2.4. Bread making process 107
Bread formulation based on % of flour basis were 1.63% salt, 0.6% dry baker´s yeast (Saf- 108
instant, Lesaffre Group, France), 4% sugar, 2% vegetal oil, 2% HPMC K4M. The amount of 109
water was variable depending on the water absorption of the flours. Water, flour and oil were 110
mixed in Brabender Farinograph bowl at low speed for 40 s. After this period, the other 111
ingredients were added and mixed again at speed 2 for 6 min. Then 100 g of dough pieces were 112
transferred into baking pans and proofed for 40 min at 35 ºC in a fermentation cabinet (Salva, 113
Spain). The baking process was performed at fixed oven temperature of 180 °C for 15 min 114
6
except for the bread made with cooked chickpea floor, where the time was extended to 25 min. 115
After baking, bread loaves were rested for 30 min at room temperature to cool down. 116
2.2.5. Instrumental Quality Parameters 117
The breads were weighed (using a digital balance with 0.01 g accuracy) and loaf volume was 118
determined by rapeseed displacement method (10-05.01 AACCI Method). Specific volume was 119
calculated as the ratio between the volume of the bread and its weight. Three measurements 120
were carried out for each batch. 121
Color parameters of the bread slices (10 mm thickness) were measured at three different 122
locations by using a Minolta colorimeter (Chroma Meter CR-400/410, Konica Minolta, Japan) 123
after standardization with a white calibration plate (L* =96.9, a* = -0.04, b* =1.84). The color 124
was recorded using CIE-L* a* b* uniform color space (CIE-Lab), where L* indicates lightness, 125
a* indicates hue on a green (-) to red (+) axis, and b* indicates hue on a blue (-) to yellow (+) 126
axis. 127
Crumb texture was measured using a Texture Analyzer TA-XTPlus (Stable Microsystems, Surrey, 128
UK) equipped with a 30 kg load cell and cylindrical stainless steel probe (diameter 25 mm). The 129
Texture Profile Analysis (TPA) used double compression test up to 50% penetration of its 130
original height, with a test speed of 1 mm/s, and a 30 s delay between the first and second 131
compressions. Hardness, cohesiveness, springiness, chewiness and resilience were calculated 132
from the TPA plot. Measurements were made on four central slices from each batch of bread. 133
2.2.6. Chemical composition of breads 134
Chemical composition was determined following ICC standard methods (1994) for moisture 135
(ICC 110/1), fat (ICC 136), and crude protein (ICC 105/2). The UNE-EN ISO 2171:2010 136
modified method was followed to measure ash content. Carbohydrates were determined by 137
difference. Chemical composition values are the mean of two determinations. 138

7
In vitro protein digestibility of the bread samples was determined following the methods of Hsu 139
et al. (1977) and Bilgiçli et al. (2007), with some modifications. Briefly, 1 mL of aqueous 140
protein suspension having 6.25 mg protein/mL was prepared. Samples were placed at 37°C in a 141
compact thermomixer (Eppendorf, USA) and pH was adjusted to 8.00 using 0.1 N NaOH or 0.1 142
N HCl. Then, 0.1 mL of trypsin solution (13,766 BAEE units/mg proteins, 1.6 mg/mL at pH 8.0) 143
was added to the protein suspension, which was continuously stirred at 37°C. The pH drop was 144
recorded 15 s after enzyme addition and at 1-min intervals for 10 min. The enzyme solution was 145
always freshly prepared before each series of experiments. The percent protein digestibility (Y) 146
was calculated by using (Hsu et al. 1977): Y =210,464 – 18,1x Where x is the change in pH after 147
10 min. 148
2.2.7. Sensory analysis 149
A descriptive sensory analysis was performed for evaluating the sensory characteristics of the 150
bread samples. Bread slices, including crust and crumb, were presented (1 cm thick) on plastic 151
dishes coded and served in randomized order. A quantitative descriptive sensory analysis was 152
carried out by nine panelists with a panel of descriptors under normal lightening conditions and 153
at room temperature. Attribute intensity was scored on a scale varying from 1 to 9 (1: dislike 154
extremely, 2: dislike very much, 3: dislike moderately, 4: dislike slightly, 5: neither like nor 155
dislike, 6: like slightly, 7: like moderately, 8: like very much, 9: like extremely). The attributes 156
assessors finally agree were appearance (by observing the product slice), flavor, color and taste. 157
2.2.8. Statistical analysis 158
One-Way analysis of variance (ANOVA) and multiple sample comparison were used for the 159
statistical analysis of the results, which was performed by using Statgraphics Centurion XV 160
(Statpoint Technologies, Warrenton, USA). Fisher’s least significant differences (LSD) test was 161
used to describe means with 95% confidence. 162
2. Results and discussion 163
8
2.1. Flour hydration properties 164
Water absorption and water binding capacity were selected to determine the hydration properties 165
of raw and processed chickpea flours (Table 1). The processing of chickpea significantly 166
(P<0.05) increased the water absorption ability. The highest effect was observed with the cooked 167
chickpea, which showed a significant increase of the water absorption and the WBC. Toasted 168
and germinated chickpea flours showed similar hydration. Padmashree et al. (1987) reported that 169
polar amino acids of a protein have an affinity for water and denatured protein binds more water. 170
Cooking and also toasting might have caused the denaturation of protein, explaining the results 171
obtained for those flours. This is in accordance with results found by Obatolu et al. (2001) in 172
boiled and roasted yam bean. Regarding germination, the hydrolysis induced by enzymes 173
activation could also increase the amount of polar compounds enhancing the ability to bond 174
water molecules, as has been observed in germinated legumes (Benitez et al. 2013). Hydration 175
properties of raw materials are decisive when developing gluten free baked goods, especially 176
bread because the specific volume is positively dependent on the dough hydration (de la Hera et 177
al. 2014; Marco and Rosell 2008). Therefore, it should be expected that flour from processed 178
chickpea would improve the quality of gluten free breads. 179
180
2.2. Mixolab measurements: 181
Figure 1 shows the curves obtained from the Mixolab® corresponding to the four formulations. 182
The initial profile (first 10 min), corresponding to mixing stage, showed rather low consistency, 183
which agrees with the batter consistency that usually show gluten free doughs (Matos and Rosell 184
(2013). Dough containing germinated flour led the highest consistency during mixing, likely the 185
hydrolysis products resulting from the germination are responsible for this behaviour. During 186
heating, consistency increased due to starch gelatinization, which was followed by a cooling 187
stage with further rose of consistency that reflected the starch properties of tested formulations 188
(Figure 1). Only parameters defining that behavior were assessed (C3, C4, C5) (Table 1), 189

9
because it have been reported that they were significantly positively correlated with crumb 190
hardness, and thus to gluten free bread quality (Matos and Rosell 2015). The consistency at C3 191
that reflects starch gelatinization was significantly reduced when cooked chickpea flour was 192
used, which was attributed to the previous starch gelatinization occurred on chickpea during 193
cooking process. Also it must remark that water absorption was much higher for cooked 194
chickpea flour, thus starch dilution could not be disregarded. C4 and C5 decreased significantly 195
(P<0.05) in treated seeds (germinated and toasted), which partly was explained by starch 196
dilution because higher amount of water was needed to hydrate all compounds, compared to 197
dough containing raw chickpea flour. Nevertheless, the difference in the pattern plot suggested 198
additional changes in the doughs containing germinated and toasted chickpea flours. 199
Presumably, activation of enzymes during germination might explain the decrease in C4 and C5 200
observed in germinated doughs, as has been reported for rice flours (Cornejo and Rosell 2015; 201
Charoenthaikij et al. 2009) and oat flour due to increase in the α-amylase, proteolytic and 202
lipolytic activities (Makinen et al. 2013). Results obtained for dough containing toasted chickpea 203
flour suggested that thermal treatment modified flour compounds despite the limited amount of 204
water, as confirmed results obtained with the hydration properties. Similar behavior has been 205
reported for toasted yam bean (Obatolu et al. 2001). 206
207
2.3. Quality properties of breads: 208
Pictures of bread slices made with differently processed chickpea flours are illustrated in Figure 209
2. It must be remark that the recipe, and specially the amount of water added (defined using the 210
water absorption of the flours), allowed obtaining acceptable breads with even porous crumbs. 211
The most noticeable changes were observed on the crumb color that varied significantly 212
depending on the chickpea treatment. The specific volume (Table 2) of breads was significantly 213
higher for toasted chickpea bread (1.79 mL/g), followed by raw chickpea and germinated 214
chickpea breads, whereas cooked chickpea flour yielded the lowest specific volume. It was 215

10
expected that the bread made with germinated flour had higher specific volume, due to the 216
increase in protein solubility, resulting in better emulsifying capacity and foaming properties 217
during germination (Aguilar et al. 2015; Mostafa et al. 1987), but it has been also described that 218
excessive germinated flours resulted in lower specific bread volume (Cornejo and Rosell 2015). 219
Bread made with cooked chickpea flour had the lower specific volume (0.58 mL/g) that might 220
be ascribed to the reduction of protein solubility caused by denaturation during heating and also 221
to the released of water soluble compounds to the boiling water. This result is in accordance with 222
findings of Shin et al. (2013), where breads made with heat-treated soy flours had lower specific 223
loaf volume than breads prepared by raw and germinated soy flours. The moisture content of 224
breads was rather high because very high hydration was used for obtaining better shaped breads. 225
The moisture content of the breads followed the trend of the water added for breadmaking 226
process, thus bread containing cooked flour showed the highest moisture content (Table 2). De 227
la Hera et al. (2014) reported that the moisture content in gluten free bread was related with the 228
amount of water added in the recipe. Regarding color the germinated chickpea bread showed the 229
darkest crumb, while cooked chickpea bread was the lightest (L*=66.17 and L*=76.20, 230
respectively), the reddish value (a*) was higher in germinated chickpea bread and lowest in 231
cooked chickpea bread (a*=3.89 and a*= -0.46 respectively); whereas the yellowish value was 232
higher in toasted chickpea bread followed by raw chickpea bread (b*=31.37 and b*=29.62 233
respectively). 234
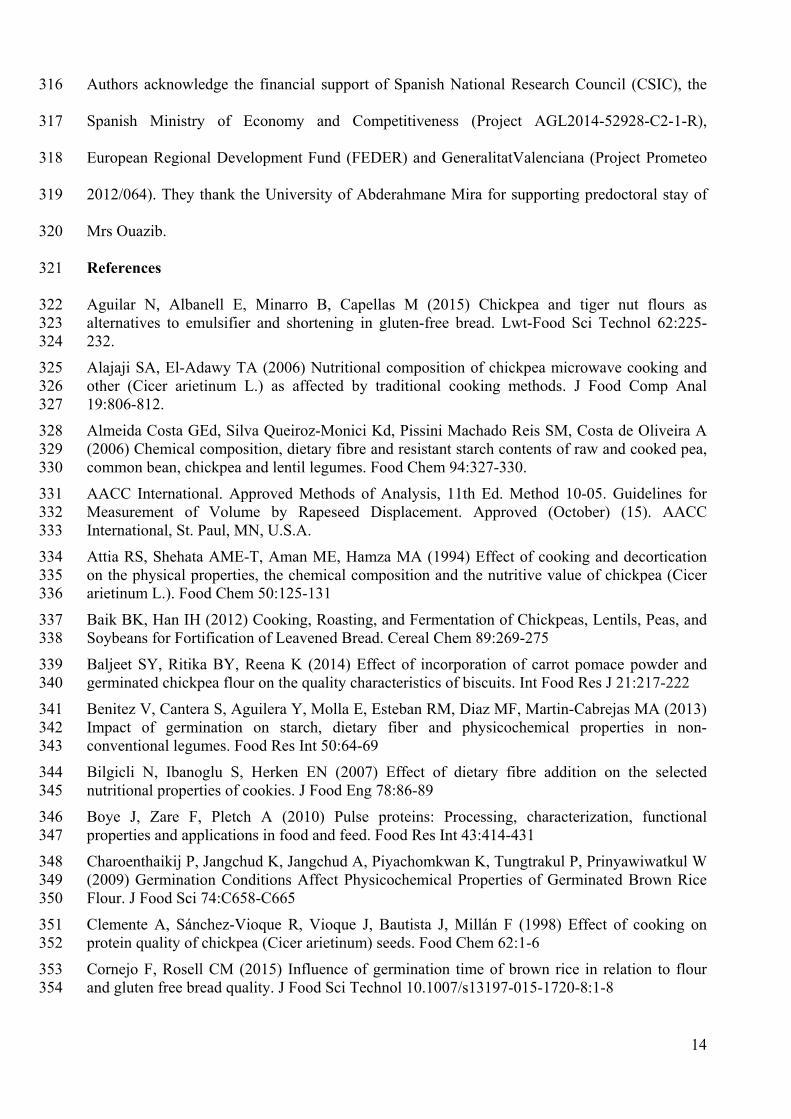
The texture profile including firmness, springiness, cohesiveness, chewiness and resilience of 235
the different breads is presented in Table 3. The hardness of germinated chickpea bread tended 236
to be higher (2837 g) compared with raw chickpea bread (2460 g). Conversely, breads made 237
with pre-heated chickpea flour (toasted or cooked) were softer, especially the one made with the 238
cooked chickpea flour (794 g). The high amount of water absorbed during dough mixing might 239
contribute to this behavior (de la Hera et al. 2014). No significant differences (P>0.05) were 240
observed for the crumb springiness. The cohesiveness, which quantifies the internal resistance or 241
11
cohesion of food structure, significantly (P <0.05) increased in breads made with raw and 242
germinated chickpea flour comparing with those made with pre-heated chickpea flours. The 243
same trend was observed regarding resilience. Bread with high cohesiveness is desirable because 244
it forms a bolus rather than disintegrates during mastication, whereas low cohesiveness indicates 245
increased susceptibility of the bread to fracture or crumble (Onyango et al. 2011). In addition, 246
chewiness was more pronounced in breads made with raw and germinated chickpea flour (1067 247
and 1145 g respectively) compared to the low values exhibited by the breads made with pre-248
heated chickpea flour. These low chewing values would indicate easy break of the bread in the 249
mouth. 250
2.4. Nutritional properties of breads 251
The proximate composition of breads comprises the estimation of ash, fat, proteins and 252
carbohydrates (Table 4). All these parameters varied significantly (P <0.05) among chickpea 253
based breads. Ash content decreased highly in breads made with toasted and cooked chickpea 254
flour (-13% and -38% respectively). A slight decrease was observed in bread made with 255
germinated chickpea flour compared to that made with raw flour, probably caused by leaching of 256
minerals during soaking and cooking. Similar trend in the reduction of ash content induced by 257
cooking and germination was observed by Baik and Han (2012) and Mittal et al. (2012), 258
respectively, in chickpea flour. 259
Concerning fat, a significant (P <0.05) decrease was observed when germinated chickpea flour 260
(3.37%) was used. Likely due to the use of fat as energy during the germination process (Mittal 261
et al. 2012). However, a significant (P<0.05) increase was noticed in breads made with toasted 262
and cooked chickpea flour, which should be attributed to the concentration of fat after leaching 263
out other water soluble constituents in the cooking or soaking water. Regarding the crude protein 264
content, again there was a significant (P <0.05) decrease among breads made with toasted and 265
cooked chickpea flours. This reduction in protein content was reported previously by Clemente 266

12
et al. (1998) and Attia et al. (1994) in cooked chickpea, owing to the leaching of protein into 267
cooking water. Similar pattern was observed in the protein content, obtained after removing 268
TCA-soluble compounds containing nitrogen, although the amount was lower due to the 269
removal of soluble nitrogen, amino acids and peptides. Also carbohydrate decreased 270
significantly (P <0.05) in bread made with processed chickpea flours and the highest reduction 271
was observed with cooked chickpea flour (25%). Since the carbohydrate content was calculated 272
by difference, this variation was due to the differences in the contents of other constituents. 273
The in vitro protein digestibility (IVPD) values were not affected among breads made with 274
germinated and toasted chickpea flour compared with bread made with raw chickpea flour 275
(Figure 3). However, a significant (P <0.05) decrease in IVPD was observed in bread made with 276
cooked chickpea flour (79.51%). The improvement in digestibility might result from the 277
denaturation of protein, destruction of the trypsin inhibitor or reduction of tannins and phytic 278
acid in cooked chickpea flour. Processing can improve the digestibility of proteins by destroying 279
protease inhibitors and opening the protein structure through denaturation (Hsu et al. 1977). An 280
improved IVPD of cooked chickpea flour was also reported by Baik and Han (2012) and Alajaji 281
and El-Adawy (2006). A rapid decline in pH (Figure 3) was observed in bread made with 282
cooked chickpea floor, followed by ones made with toasted, germinated and raw chickpea flour 283
respectively. This decline in pH was caused by the release of carboxyl groups during enzymatic 284
digestion of the protein Hsu et al. (1977). Protein digestibility is indicative of its amino acids 285
availability for evaluating the nutritive quality of a protein. 286
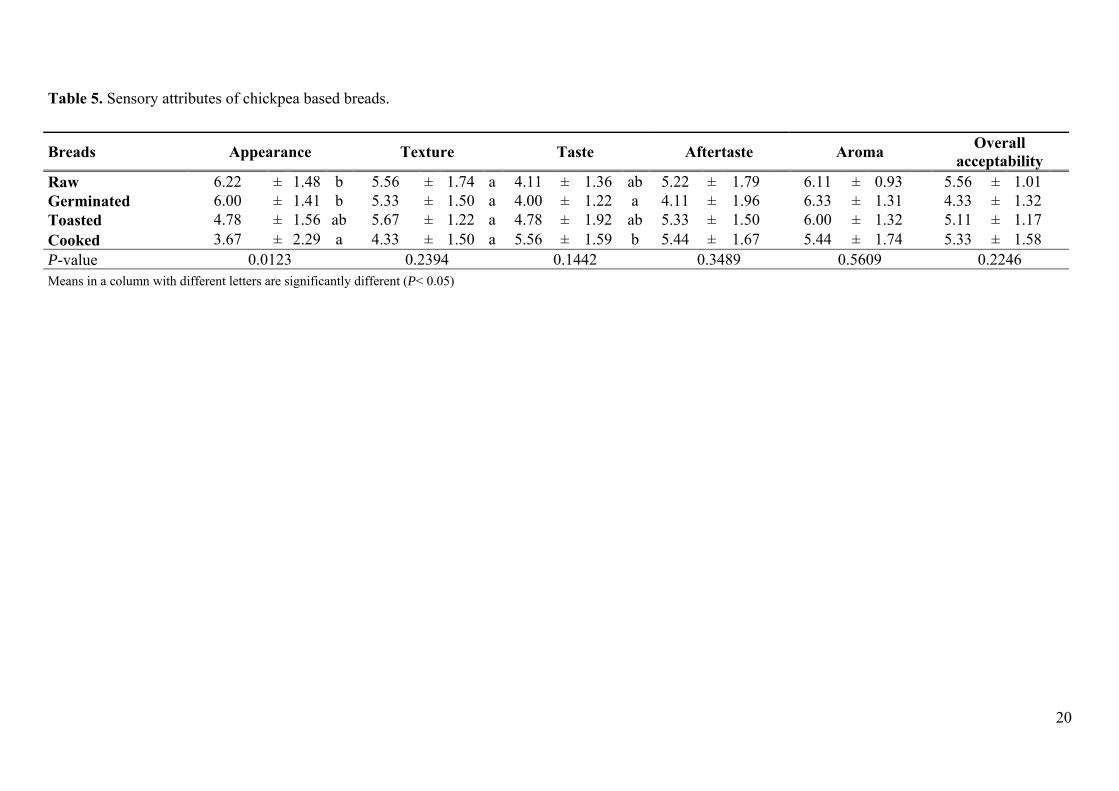
2.5. Sensory characteristics of breads 287
The collected scores for each sample are listed in Table 6. Panelist evaluated all the attributes 288
very low, this may be due to the unexpected type of breads, since legume breads are not very 289
common. Only the appearance showed significant difference (P <0.05), specifically breads made 290
with raw and germinated chickpea flour had higher score (6.22 and 6.00, respectively), 291
13
suggesting that panelists like slightly the appearance of these two breads compared with those 292
made with toasted and cooked chickpea flour. For the bread made with cooked chickpea flour, 293
the appearance was the most undesirable attribute (score 3.67). For the texture, breads scored 294
between 4.33 for the bread made with cooked chickpea flour and 5.67 for the bread made with 295
toasted chickpea flour. Bread made with cooked chickpea flour was tastier than other breads. 296
Regarding the aftertaste, scores ranged between 4.11 and 5.44, which meant that panelists dislike 297
the beany taste that persisted in mouth after tasting the breads. Panelists appreciated the aroma 298
of breads made with raw, germinated and toasted chickpea flours and were indifferent about the 299
bread made with cooked chickpea flour. 300
3. Conclusion: 301
Chickpea beans subjected to germination, toasting or cooking provided flours with high water 302
binding capacity and, with exception of the cooked flour, their rheological profile (measured 303
with the Mixolab) was predominantly determined by starch properties. Chickpea breads were 304
developed using different chickpea flours (germinated, toasted and cooked). The chickpea bread 305
quality differed depending on the previous process of the bean. The highest specific volume was 306
obtained in bread made with toasted chickpea flour. However, the softest texture was noticed in 307
bread made with cooked chickpea flour. On other hand, the bread made with germinated 308
chickpea scored the lowest overall acceptability concerning the sensory properties. Regarding 309
the nutritional quality, the bread made with raw chickpea flour had the highest content of 310
protein, but the bread made with cooked chickpea flour showed the highest in vitro protein 311
digestibility. Overall, processing of chickpea beans, concretely toasting and cooking led to flours 312
that could be used for obtaining gluten free breads with the nutritional characteristics of the 313
legumes and acceptable sensory characteristics. 314
Acknowledgements 315
14
Authors acknowledge the financial support of Spanish National Research Council (CSIC), the 316
Spanish Ministry of Economy and Competitiveness (Project AGL2014-52928-C2-1-R), 317
European Regional Development Fund (FEDER) and GeneralitatValenciana (Project Prometeo 318
2012/064). They thank the University of Abderahmane Mira for supporting predoctoral stay of 319
Mrs Ouazib. 320
References 321
Aguilar N, Albanell E, Minarro B, Capellas M (2015) Chickpea and tiger nut flours as 322 alternatives to emulsifier and shortening in gluten-free bread. Lwt-Food Sci Technol 62:225-323 232. 324
Alajaji SA, El-Adawy TA (2006) Nutritional composition of chickpea microwave cooking and 325 other (Cicer arietinum L.) as affected by traditional cooking methods. J Food Comp Anal 326 19:806-812. 327
Almeida Costa GEd, Silva Queiroz-Monici Kd, Pissini Machado Reis SM, Costa de Oliveira A 328 (2006) Chemical composition, dietary fibre and resistant starch contents of raw and cooked pea, 329 common bean, chickpea and lentil legumes. Food Chem 94:327-330. 330
AACC International. Approved Methods of Analysis, 11th Ed. Method 10-05. Guidelines for 331 Measurement of Volume by Rapeseed Displacement. Approved (October) (15). AACC 332 International, St. Paul, MN, U.S.A. 333
Attia RS, Shehata AME-T, Aman ME, Hamza MA (1994) Effect of cooking and decortication 334 on the physical properties, the chemical composition and the nutritive value of chickpea (Cicer 335 arietinum L.). Food Chem 50:125-131 336
Baik BK, Han IH (2012) Cooking, Roasting, and Fermentation of Chickpeas, Lentils, Peas, and 337 Soybeans for Fortification of Leavened Bread. Cereal Chem 89:269-275 338
Baljeet SY, Ritika BY, Reena K (2014) Effect of incorporation of carrot pomace powder and 339 germinated chickpea flour on the quality characteristics of biscuits. Int Food Res J 21:217-222 340
Benitez V, Cantera S, Aguilera Y, Molla E, Esteban RM, Diaz MF, Martin-Cabrejas MA (2013) 341 Impact of germination on starch, dietary fiber and physicochemical properties in non-342 conventional legumes. Food Res Int 50:64-69 343
Bilgicli N, Ibanoglu S, Herken EN (2007) Effect of dietary fibre addition on the selected 344 nutritional properties of cookies. J Food Eng 78:86-89 345
Boye J, Zare F, Pletch A (2010) Pulse proteins: Processing, characterization, functional 346 properties and applications in food and feed. Food Res Int 43:414-431 347
Charoenthaikij P, Jangchud K, Jangchud A, Piyachomkwan K, Tungtrakul P, Prinyawiwatkul W 348 (2009) Germination Conditions Affect Physicochemical Properties of Germinated Brown Rice 349 Flour. J Food Sci 74:C658-C665 350
Clemente A, Sánchez-Vioque R, Vioque J, Bautista J, Millán F (1998) Effect of cooking on 351 protein quality of chickpea (Cicer arietinum) seeds. Food Chem 62:1-6 352
Cornejo F, Rosell CM (2015) Influence of germination time of brown rice in relation to flour 353 and gluten free bread quality. J Food Sci Technol 10.1007/s13197-015-1720-8:1-8 354

15
de la Hera E, Rosell CM, Gomez M (2014) Effect of water content and flour particle size on 355 gluten-free bread quality and digestibility. Food Chem 151:526-531 356
de la Hera E, Ruiz-París E, Oliete B, Gómez M (2012) Studies of the quality of cakes made with 357 wheat-lentil composite flours. LWT - Food Sci Technol 49:48-54 358
FAOSTAT DATA. 2013. Agricultural Production and Production Indices Data: Crop Primary. 359 http://faostat3.fao.org/home/E 360
Gularte M, Gómez M, Rosell CM (2012) Impact of Legume Flours on Quality and In Vitro 361 Digestibility of Starch and Protein from Gluten-Free Cakes. Food Bioprocess Technol 5:3142-362 3150 363
Han J, Janz JAM, Gerlat M (2010). Development of gluten-free cracker snacks using pulse 364 flours and fractions. Food Res Int 43:627-633 365
Hsu HW, Vavak DL, Satterlee LD, Miller GA (1977). Multienzymatic technique for estimating 366 protein digestibility J Food Sci 42:1269-1273 367
ICC. International Association for Cereal Chemistry (ICC) 1994.Standard No 110/1, 136 368
Makinen OE, Zannini E, Arendt EK (2013) Germination of Oat and Quinoa and Evaluation of 369 the Malts as Gluten Free Baking Ingredients. Plant Foods Human Nutr 68:90-95 370
Marco C, Rosell CM (2008) Breadmaking performance of protein enriched, gluten-free breads. 371 Eur Food Res Technol 227:1205-1213 372
Matos ME, Rosell CM (2013) Quality Indicators of Rice-Based Gluten-Free Bread-Like 373 Products: Relationships Between Dough Rheology and Quality Characteristics. Food 374 Bioprocess Technol 6:2331-2341 375
Matos ME, Rosell CM (2015) Understanding gluten-free dough for reaching breads with 376 physical quality and nutritional balance. J Sci Food Agric 95:653-661 377
Miñarro B, Albanell E, Aguilar N, Guamis B, Capellas M (2012). Effect of legume flours on 378 baking characteristics of gluten-free bread. J Cereal Sci 56:476-481 379
Mittal R, Nagi H, Sharma P, Sharma S (2012) Effect of processing on chemical composition and 380 antinutritional factors in chickpea flour. J Food Sci Eng 2:180 381
Mostafa MM, Rahma EH, Rady AH (1987) Chemical and nutritional changes in soybean during 382 germination. Food Chem 23:257-275 383
Obatolu VA, Fasoyiro SB, Ogunsumi L (2001) Effect of processing on functional properties of 384 yam beans ( Sphenostylisstenocarpa). Food Sci Technol Res 7:319-322 385
Onyango C, Mutungi C, Unbehend G, Lindhauer MG (2011) Modification of gluten-free 386 sorghum batter and bread using maize, potato, cassava or rice starch. LWT - Food Sci Technol 387 44:681-686 388
Padmashree TS, Vijayalakshmi L, Puttaraj S (1987) Effect of traditional processing on the 389 functional properties of cowpea (Vigna catjang) flour. vol 24. vol 5. Association of Food 390 Scientists and Technologists, Mysore, INDE. 391
Petitot M, Boyer L, Minier C, Micard V (2010) Fortification of pasta with split pea and faba 392 bean flours: Pasta processing and quality evaluation. Food Res Int 43:634-641 393
Rachwa-Rosiak D, Nebesny E, Budryn G (2015) Chickpeascomposition, nutritional value, 394 health benefits, application to bread and snacks: a review. Critical Rev Food Sci Nutr 55:1137-395 1145 396
Seena S, Sridhar KR (2005) Physicochemical, functional and cooking properties of under 397 explored legumes, Canavalia of the southwest coast of India. Food Res Int 38:803-814 398

16
Shin D-J, Kim W, Kim Y 2013. Physicochemical and sensory properties of soy bread made with 399 germinated, steamed, and roasted soy flour. Food Chem 141:517-523 400
UNE-EN ISO 2171:2010. Cereals, pulses and by-products - Determination of ash yield by 401 incineration (ISO 2171:2007) 402
Xu YX, Thomas M, Bhardwaj HL (2014) Chemical composition, functional properties and 403 microstructural characteristics of three kabuli chickpea (Cicer arietinum L.) as affected by 404 different cooking methods. Int J Food Sci Technol 49:1215-1223 405
406
FIGURE CAPTIONS 407
Fig 1: Mixolab® curves of raw (R), germinated (G), toasted (T) and cooked (C) chickpea flours. 408
Fig 2: Cross section of the gluten free breads slices. 409
Fig 3: In vitro digestibility of protein in gluten free breads 410

17
Table 1. Hydration properties of the chickpea flours and rheological parameters of gluten free doughs determined using the Mixolab®. 411
Chickpea type Water
Absorption Water Binding
Capacity C3 C4 C5
% g/g Nm Nm Nm
Raw 120 ± 4 a 1.35 ± 0.02 a 0.42 ± 0.01 b 0.41 ± 0.01 c 0.67 ± 0.01 cGerminated 141 ± 3 b 1.81 ± 0.04 b 0.42 ± 0.00 b 0.32 ± 0.00 b 0.61 ± 0.01 bToasted 141 ± 3 b 1.87 ± 0.01 b 0.35 ± 0.00 a 0.28 ± 0.05 a 0.53 ± 0.04 aCooked 205 ± 5 c 2.69 ± 0.07 c n.d. n.d. n.d. P- value 0.0402 0.0000 0.0123 0.0034 0.0142 Means in a column with different letters are significantly different (P< 0.05)
412
Table 2. Effect of chickpea processing on the specific volume, moisture content and color parameters of chickpea based breads. 413
Breads Specific volume
(mL/g) Moisture
(%) L* a* b*
Raw 1.72 ± 0.04 c 49.24 ± 0.05 a 71.66 ± 0.56 b 0.43 ± 0.13 b 29.62 ± 0.85 b
Germinated 1.53 ± 0.02 b 51.34 ± 0.04 b 66.17 ± 0.53 a 3.89 ± 0.28 d 28.84 ± 0.44 ab
Toasted 1.79 ± 0.05 d 52.41 ± 0.05 c 71.00 ± 1.26 b 1.57 ± 0.59 c 31.37 ± 1.56 c
Cooked 0.58 ± 0.02 a 60.58 ± 0.01 d 76.20 ± 0.99 c -0.46 ± 0.22 a 27.64 ± 1.83 a
P-value 0.0000 0.0000 0.0000 0.0000 0.0000
Means in a column with different letters are significantly different (P< 0.05)
414
18
Table 3. Effect of chickpea processing on the texture parameters of chickpea based breads. 415
Breads Firmness (N) Springiness Cohesiveness Chewiness
(N) Resilience
Raw 251 ± 5 c 0.848 ± 0.018 a 0.51 ± 0.02 c 109 ± 4 c 0.22 ± 0.01 cGerminated
289 ± 13 d 0.742 ± 0.046 a 0.54 ± 0.02 c 117 ± 10 c 0.23 ± 0.01 c
Toasted 167 ± 9 b 0.704 ± 0.02 a 0.43 ± 0.04 b 50 ± 8 b 0.18 ± 0.02 bCooked 81 ± 3 a 1.754 ± 2.329 a 0.3 ± 0.02 a 14 ± 1 a 0.07 ± 0.05 a
P-value 0.0000 0.5524 0.0000 0.0000 0.0000 Means in a column with different letters are significantly different (P< 0.05).

19
Table 4. Chemical composition of chickpea based breads
Breads Ash content
(% as is) Fat content
(% as is) Protein content
(% as is) Carbohydrate*content
(% as is)
Raw 2.17 ± 0.00 d 3.73 ± 0.00 b 11.16 ± 0.18 c 33.70 ± 0.18 d Germinated 2.11 ± 0.01 c 3.37 ± 0.06 a 11.22 ± 0.07 c 31.96 ± 0.12 c Toasted 1.89 ± 0.01 b 4.33 ± 0.06 c 10.14 ± 0.02 b 31.23 ± 0.07 b Cooked 1.35 ± 0.00 a 4.41 ± 0.01 c 8.66 ± 0.05 a 25.00 ± 0.06 a
P-value 0.0000 0.0000 0.0000 0.0000 Means in a column with different letters are significantly different (P< 0.05) *Carbohydrate content was calculated by difference
20
Table 5. Sensory attributes of chickpea based breads.
Breads Appearance Texture Taste Aftertaste Aroma Overall
acceptability Raw 6.22 ± 1.48 b 5.56 ± 1.74 a 4.11 ± 1.36 ab 5.22 ± 1.79 6.11 ± 0.93 5.56 ± 1.01 Germinated 6.00 ± 1.41 b 5.33 ± 1.50 a 4.00 ± 1.22 a 4.11 ± 1.96 6.33 ± 1.31 4.33 ± 1.32 Toasted 4.78 ± 1.56 ab 5.67 ± 1.22 a 4.78 ± 1.92 ab 5.33 ± 1.50 6.00 ± 1.32 5.11 ± 1.17 Cooked 3.67 ± 2.29 a 4.33 ± 1.50 a 5.56 ± 1.59 b 5.44 ± 1.67 5.44 ± 1.74 5.33 ± 1.58 P-value 0.0123 0.2394 0.1442 0.3489 0.5609 0.2246 Means in a column with different letters are significantly different (P< 0.05)

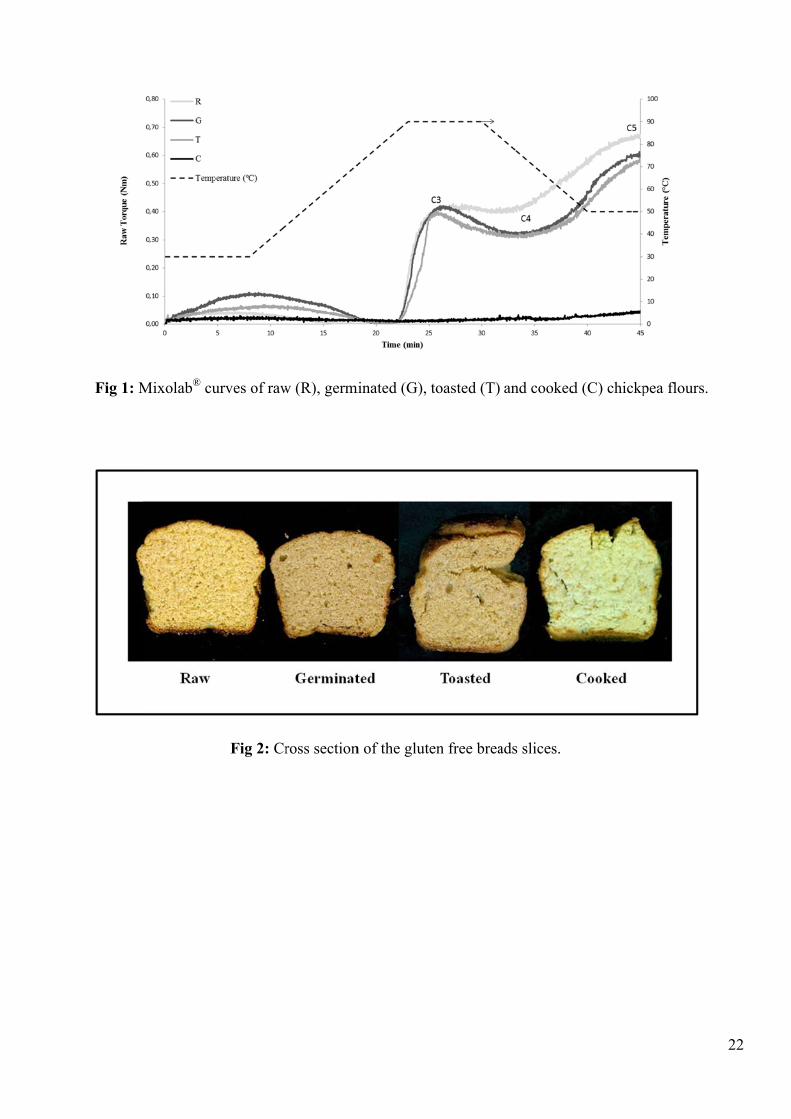
Fig 1: MMixolab® cuurves of raw
Fig 2: Cr
w (R), germ
ross section
minated (G),
n of the glut
toasted (T)
en free brea
and cooked
ads slices.
d (C) chickp
pea flours.
22
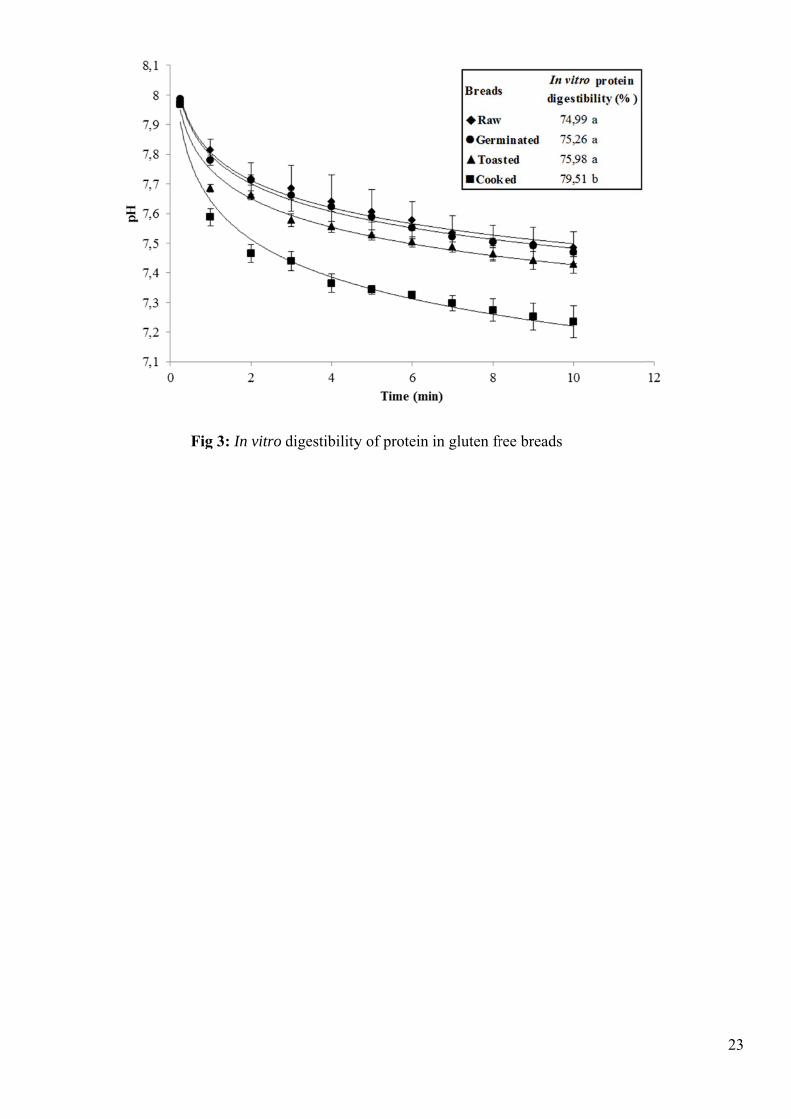
Fig 3: In vitro digestibilityy of protein in gluten frree breads
23


![Bulletin of the JSME Journal of Fluid Science and Technology · 4 Ohta, Iguchi and Onaru, Journal of Fluid Science and Technology, Vol.9, No.1 (2014) [DOI: 10.1299/jfst.2014jfst0009]](https://static.fdocuments.net/doc/165x107/5fb155424ed9ff16bf5d784c/bulletin-of-the-jsme-journal-of-fluid-science-and-technology-4-ohta-iguchi-and.jpg)