% Proficient/Advanced at the 60 School’s % Proficient ... AEC... · MGP at the 60th percentile...
22
CDE Improvement Planning Template for Alternative Education Campuses (Version 3.3 -- Last updated: December 14, 2012) 1 Colorado’s Unified Improvement Plan for Alternative Education Campuses for 2012-13 Organization Code: 2405 District Name: Fort Morgan Re-3 School Code: 5180 School Name: Lincoln High School SPF Year: 2012 Section I: Summary Information about the School Directions: This section summarizes your school’s performance on the federal and state accountability measures in 2011-12. For federal accountability, Alternative Education Campuses (AECs) may be accountable to certain requirements for programs (e.g., Title I, TIG grant). For state accountability, AECs have a modified state AEC SPF report that uses AEC norms to focus on the key performance indicators of Achievement, Growth, Student Engagement and Postsecondary and Workforce Readiness. Where there are required state measures, these are noted below, but AECs may also have optional supplemental measures. AECs will need to complete the table to reflect their results on both required federal and state measures and any optional supplemental measures. This summary should accompany your improvement plan. Student Performance Measures for State and Federal Accountability Performance Indicators Measures/ Metrics 2011-12 Federal and State Expectations 2011-12 School Results Meets Expectations? Academic Achievement (Status) State Required Measure: TCAP/CSAP, CoAlt,/CSAPA, Lectura, Escritura Description: % P+A in reading, writing, math and science. Expectation: %P+A is at/above the 60 th percentile for AECs. R % Proficient/Advanced at the 60 th percentile for AECs School’s % Proficient/Advanced Overall AEC Rating for Academic Achievement: Approaching Elem MS HS HS 29.4% 21.44% 35.4% 23.1% (does not meet) M 15.5% 9.96% 4.4% 3.9% (approaching) W 14.3% 16.68% 14.6% 11.5% (approaching) S 37.04% 12.12% 16.4% 11.8% (approaching) Optional Supplemental Measures n/a n/a Academic Growth State Required Measure: Median Student Growth Percentile (MGP) Description: Growth in TCAP/TCAP for reading, writing and math. Expectation: Median Student Growth Percentile (MGP) at/above the 60 th percentile for AECs. R MGP at the 60 th percentile for AECs School’s MGP Overall AEC Rating for Academic Growth: Approaching Elem MS HS HS - 43.2 46.8 35 (does not meet) M - 31.8 42 35 (approaching) W - 35.8 43.4 55 (meets) Optional Supplemental Measures n/a n/a
Transcript of % Proficient/Advanced at the 60 School’s % Proficient ... AEC... · MGP at the 60th percentile...

CDE Improvement Planning Template for Alternative Education Campuses (Version 3.3 -- Last updated: December 14, 2012) 1
Colorado’s Unified Improvement Plan for Alternative Education Campuses for 2012-13
Organization Code: 2405 District Name: Fort Morgan Re-3 School Code: 5180 School Name: Lincoln High School SPF Year: 2012
Section I: Summary Information about the School
Directions: This section summarizes your school’s performance on the federal and state accountability measures in 2011-12. For federal accountability, Alternative Education Campuses (AECs) may be accountable to certain requirements for programs (e.g., Title I, TIG grant). For state accountability, AECs have a modified state AEC SPF report that uses AEC norms to focus on the key performance indicators of Achievement, Growth, Student Engagement and Postsecondary and Workforce Readiness. Where there are required state measures, these are noted below, but AECs may also have optional supplemental measures. AECs will need to complete the table to reflect their results on both required federal and state measures and any optional supplemental measures. This summary should accompany your improvement plan.
Student Performance Measures for State and Federal Accountability
Performance Indicators Measures/ Metrics 2011-12 Federal and State
Expectations 2011-12 School Results Meets Expectations?
Academic Achievement (Status)
State Required Measure: TCAP/CSAP, CoAlt,/CSAPA, Lectura, Escritura Description: % P+A in reading, writing, math and science. Expectation: %P+A is at/above the 60th percentile for AECs.
R
% Proficient/Advanced at the 60th percentile for AECs School’s % Proficient/Advanced
Overall AEC Rating for Academic Achievement:
Approaching
Elem MS HS HS
29.4% 21.44% 35.4% 23.1% (does not meet)
M 15.5% 9.96% 4.4% 3.9% (approaching)
W 14.3% 16.68% 14.6% 11.5% (approaching)
S 37.04% 12.12% 16.4% 11.8% (approaching)
Optional Supplemental Measures n/a n/a
Academic Growth
State Required Measure: Median Student Growth Percentile (MGP) Description: Growth in TCAP/TCAP for reading, writing and math. Expectation: Median Student Growth Percentile (MGP) at/above the 60th percentile for AECs.
R
MGP at the 60th percentile for AECs School’s MGP
Overall AEC Rating for Academic Growth:
Approaching
Elem MS HS HS - 43.2 46.8 35 (does not meet)
M - 31.8 42 35 (approaching)
W - 35.8 43.4 55 (meets)
Optional Supplemental Measures n/a n/a

CDE Improvement Planning Template for Schools (Version 3.2 -- Last updated: July 9, 2012) 2
Student Performance Measures for State and Federal Accountability (cont.)
Performance Indicators Measures/ Metrics 2011-12 Federal and State
Expectations 2011-12 School Results Meets Expectations?
Student Engagement
State Required Measure: Average Daily Attendance
Description: Total days attended out of total days possible to attend. Expectation: At/above the 60th percentile of all AECs.
86.46% 87.67% (meets)
Overall AEC Rating for Growth Gaps:
Meets
State Required Measure: Truancy Rate Description: Total days unexcused absent out of total days possible to attend. Expectation: At/above the 60th percentile of all AECs.
7.69% 6% (meets)
Optional Supplemental Measures: Returning Student Rate 80% 78.6% (meets)
Post Secondary/ Workforce Readiness
State Required Measure: Completion Rate Description: % of students completing. Expectation: At/above the 60th percentile of all AECs using 4-year, 5-year, 6-year or 7-year completion rate.
Completion Rate at/above 60th percentile for AECs School’s Completion Rate
Approaching
Overall AEC Rating for
Post Secondary Readiness:
Approaching
55.8% 54.5%
State Required Measure: Dropout Rate Description: % of students dropping out. Expectation: At/below the 60th percentile of all
AECs.
Dropout Rate at/above 60th percentile for AECs School’s Dropout Rate Approac
hing 11.3% 12.4%
State Required Measure: ACT Composite Score Description: Mean ACT composite score. Expectation: At/above the 60th percentile of all
AECs.
Mean ACT Comp. Score at/above 60th percentile for AECs School’s ACT Composite Score
Approaching 15.5 15.3

CDE Improvement Planning Template for Schools (Version 3.2 -- Last updated: July 9, 2012) 3
Accountability Status and Requirements for Improvement Plan
Program Identification Process Identification for School Directions for Completing Improvement Plan
State Accountability
Preliminary Recommended Plan Type
Plan assigned based on school’s overall school performance framework score (achievement, growth, growth gaps, postsecondary and workforce readiness)
2012 AEC Improvement
ESEA and Grant Accountability
Title I Formula Grant
Program's resources are allocated based upon the poverty rates of students enrolled in schools and districts and are designed to help ensure that all children meet challenging state academic standards.
n/a n/a
Title I Focus School
Title I school with a (1) low graduation rate (regardless of plan type), and/or (2) Turnaround or Priority Improvement plan type with either (or both) a) low-achieving disaggregated student groups (i.e., minority, ELL, IEP and FRL) or b) low disaggregated graduation rate. This is a three-year designation.
n/a n/a
Tiered Intervention Grant (TIG)
Competitive grant (1003g) for schools identified as 5% of lowest performing Title I or Title I eligible schools, eligible to implement one of four reform models as defined by the USDE.
n/a n/a
Improvement Support Partnership (ISP) or TDIP
Competitive Title I grant to support district improvement through a diagnostic review (i.e., facilitated data analysis, SST) or an implementation focus (i.e., Best First Instruction, Leadership, Climate and Culture).
TDIP – April 2010
CDE Improvement Planning Template for Schools (Version 3.2 -- Last updated: July 9, 2012) 4
Section II: Improvement Plan Information
Directions: This section should be completed by the school or district.
Additional Information about the School Improvement Plan Information
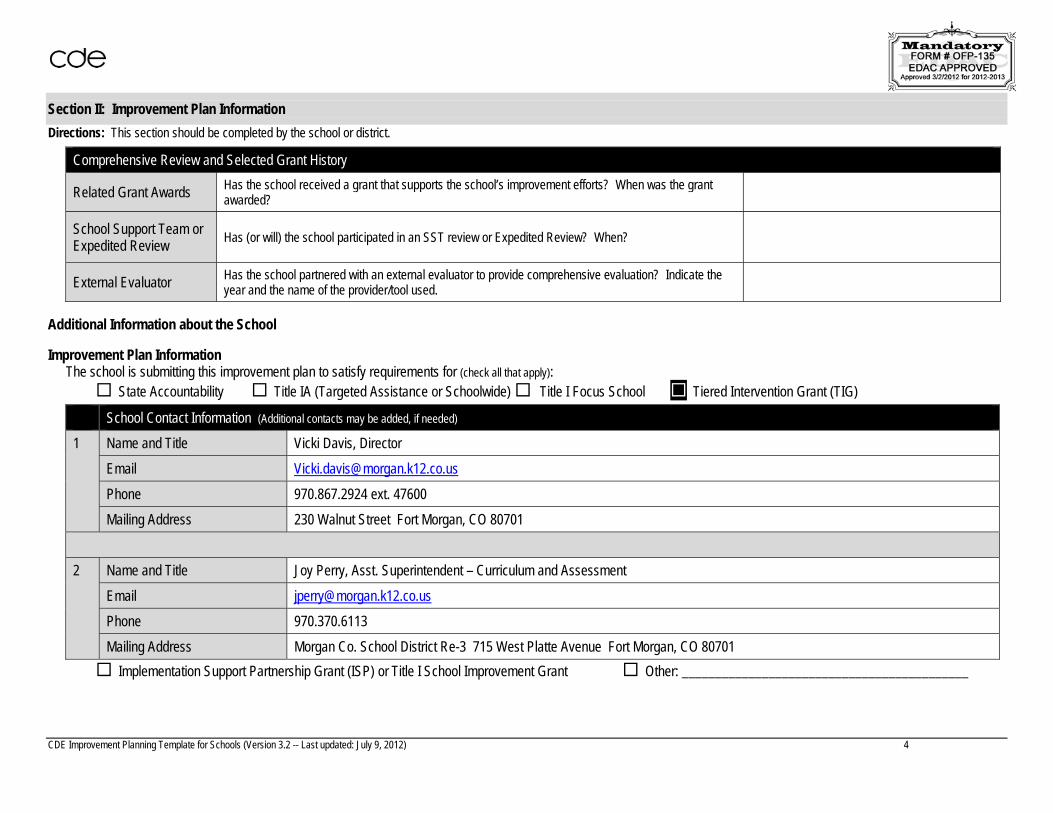
The school is submitting this improvement plan to satisfy requirements for (check all that apply): State Accountability Title IA (Targeted Assistance or Schoolwide) Title I Focus School Tiered Intervention Grant (TIG)
Implementation Support Partnership Grant (ISP) or Title I School Improvement Grant Other: ___________________________________________
Comprehensive Review and Selected Grant History
Related Grant Awards Has the school received a grant that supports the school’s improvement efforts? When was the grant awarded?
School Support Team or Expedited Review Has (or will) the school participated in an SST review or Expedited Review? When?
External Evaluator Has the school partnered with an external evaluator to provide comprehensive evaluation? Indicate the year and the name of the provider/tool used.
School Contact Information (Additional contacts may be added, if needed) 1 Name and Title Vicki Davis, Director
Email [email protected]
Phone 970.867.2924 ext. 47600 Mailing Address 230 Walnut Street Fort Morgan, CO 80701
2 Name and Title Joy Perry, Asst. Superintendent – Curriculum and Assessment
Email [email protected] Phone 970.370.6113
Mailing Address Morgan Co. School District Re-3 715 West Platte Avenue Fort Morgan, CO 80701
CDE Improvement Planning Template for Schools (Version 3.2 -- Last updated: July 9, 2012) 5
Section III: Narrative on Data Analysis and Root Cause Identification
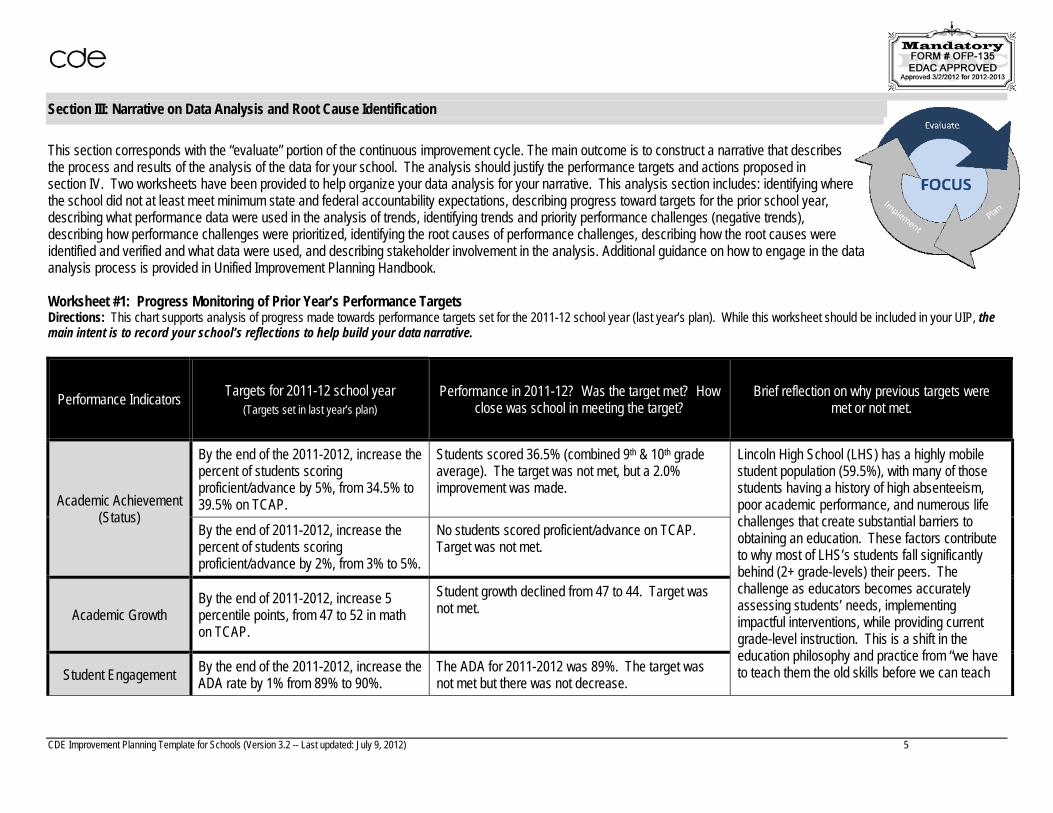
This section corresponds with the “evaluate” portion of the continuous improvement cycle. The main outcome is to construct a narrative that describes the process and results of the analysis of the data for your school. The analysis should justify the performance targets and actions proposed in section IV. Two worksheets have been provided to help organize your data analysis for your narrative. This analysis section includes: identifying where the school did not at least meet minimum state and federal accountability expectations, describing progress toward targets for the prior school year, describing what performance data were used in the analysis of trends, identifying trends and priority performance challenges (negative trends), describing how performance challenges were prioritized, identifying the root causes of performance challenges, describing how the root causes were identified and verified and what data were used, and describing stakeholder involvement in the analysis. Additional guidance on how to engage in the data analysis process is provided in Unified Improvement Planning Handbook. Worksheet #1: Progress Monitoring of Prior Year’s Performance Targets Directions: This chart supports analysis of progress made towards performance targets set for the 2011-12 school year (last year’s plan). While this worksheet should be included in your UIP, the main intent is to record your school’s reflections to help build your data narrative.
Performance Indicators Targets for 2011-12 school year (Targets set in last year’s plan)
Performance in 2011-12? Was the target met? How close was school in meeting the target?
Brief reflection on why previous targets were met or not met.
Academic Achievement (Status)
By the end of the 2011-2012, increase the percent of students scoring proficient/advance by 5%, from 34.5% to 39.5% on TCAP.
Students scored 36.5% (combined 9th & 10th grade average). The target was not met, but a 2.0% improvement was made.
Lincoln High School (LHS) has a highly mobile student population (59.5%), with many of those students having a history of high absenteeism, poor academic performance, and numerous life challenges that create substantial barriers to obtaining an education. These factors contribute to why most of LHS’s students fall significantly behind (2+ grade-levels) their peers. The challenge as educators becomes accurately assessing students’ needs, implementing impactful interventions, while providing current grade-level instruction. This is a shift in the education philosophy and practice from “we have to teach them the old skills before we can teach
By the end of 2011-2012, increase the percent of students scoring proficient/advance by 2%, from 3% to 5%.
No students scored proficient/advance on TCAP. Target was not met.
Academic Growth By the end of 2011-2012, increase 5 percentile points, from 47 to 52 in math on TCAP.
Student growth declined from 47 to 44. Target was not met.
Student Engagement By the end of the 2011-2012, increase the ADA rate by 1% from 89% to 90%.
The ADA for 2011-2012 was 89%. The target was not met but there was not decrease.

CDE Improvement Planning Template for Schools (Version 3.2 -- Last updated: July 9, 2012) 6
Performance Indicators Targets for 2011-12 school year (Targets set in last year’s plan)
Performance in 2011-12? Was the target met? How close was school in meeting the target?
Brief reflection on why previous targets were met or not met.
By the end of 2011-2012, decrease the truancy rate by 1%, from 5.5% to 4.5%.
The truancy rate increased to 7%. Target was not met. There was a 1.5% decrease.
them the new ones.” In math, basic math skills are assessed and taught as a remedial class only when significant skills are universally missing, otherwise those skills are taught as a supplement along side of the appropriate level of algebra or geometry for 9th and 10th graders. Higher levels of mathematics have also been introduced, such as Algebra II, Trigonometry, and Calculus for 11th and 12th graders, especially if they are college-bound. This is the first year of this shift in educational practice and too early to determine the impact it will have on increasing TCAP and ACT scores. As a staff, we continue to struggle to find a manageable and accurate way to assess and progress monitor a student’s individual or collective growth. For many students, growth has been made but not enough to impact students’ TCAP scores, one snapshot of a student’s ability that many of our students have little investment. LHS’s ADA stabilized from 2011 to 2012, while the truancy rate increased. An analysis of LHS’s attendance policy to determine if it was “pushing students out,” found that if modified or relaxed, students with a long standing history of truancy were just as apt to continue to violate any attendance parameters set for them. In fact, there was an increase in the number of tardies that occurred. While it kept some students in school, thus decreasing the dropout rate, the trade off was an increase in truancy.
Post Secondary Readiness
By the end of 2011-2012, increase the combined graduation/completion rate by 2%, from 38.9% to 40.9%.
The combined graduation/completion rate was 36.4%. Target was not met. There was a 2.5% decrease.
By the end of 2011-2012, decrease the dropout rate by 3.6%, from 18.5% to 14.9%.
The dropout rate was 12.4. This was a 6.1% decrease. Target was met.
By the end of 2011-2012, increase the mean ACT Composite Score by 1.5%, from 15.2 to 16.7.
The ACT Composite Score was 15.3. This was only a 0.1 increase. Target was not met.

CDE Improvement Planning Template for Schools (Version 3.2 -- Last updated: July 9, 2012) 7
Performance Indicators Targets for 2011-12 school year (Targets set in last year’s plan)
Performance in 2011-12? Was the target met? How close was school in meeting the target?
Brief reflection on why previous targets were met or not met.
Very few LHS students ever graduate with their on-time cohort. The majority of LHS students are over-aged and under-credited putting them behind when they enter the program. For some of these students, the main focus is on obtaining basic skill in order to prepare them for obtaining their GED because they will turn 21 and age out before they can obtain a high school diploma. This impacts both our dropout rate and graduation rates. In some instances, there are students who prolong finishing classes so they don’t have to graduate.
Worksheet #2: Data Analysis Directions: This chart supports planning teams in recording and organizing observations about school-level data in preparation for writing the required data narrative. Planning teams should describe positive and negative trends for all of the four performance indicators using at least three years of data and then prioritize the performance challenges (based on notable trends) that the school will focus its efforts on improving. The root cause analysis and improvement planning efforts in the remainder of the plan should be aimed at addressing the identified priority performance challenge(s). A limited number of priority performance challenges is recommended (no more than 3-5); a performance challenge may apply to multiple performance indicators. At a minimum, priority performance challenges must be identified in any of the four performance indicator areas where minimum state and federal expectations were not met for accountability purposes. Furthermore, schools are encouraged to consider observations recorded in the “last year’s targets” worksheet. Finally, provide a brief description of the root cause analysis for any priority performance challenges. Root causes may apply to multiple priority performance challenges. You may add rows, as needed.
Performance Indicators Description of Notable Trends (3 years of past state and local data)
Priority Performance Challenges Root Causes

CDE Improvement Planning Template for Schools (Version 3.2 -- Last updated: July 9, 2012) 8
Performance Indicators Description of Notable Trends (3 years of past state and local data)
Priority Performance Challenges Root Causes
Academic Achievement (Status)
TCAP scores document that gaps exist between Lincoln High School students and Re-3 students and state-wide student scores, but is comparable to other Alternative Education Campuses. 9th Grade Reading (% P/A): 2010 – 17 (N=6); 2011 – 40 (N=5); 2012 – 40 (N=2); 3 yr. ave. = 32% 9th Grade Writing (% P/A):: 2010 – 0 (N=0); 2011 – 20 (N=5); 2012 – 0 (N=5); 3 yr. ave.= 7% 9th Grade Math (% P/A): 2010 - 0 (N=6); 2011 - 0 (N=5); 2012 – 0 (N=5); 3 yr. ave.= 0 10th Grade Reading (% P/A): 2010- 18 (N=11); 2011 – 29 (N=7); 2012 – 33 (N=9); 3 yr. ave.=27% 10th Grade Writing (% P/A): 2010 – 27 (N=11); 2011 – 0 (N=7); 2012 – 11 (N=9); 3 yr. ave.= 13% 10th Grade Math (% P/A): 2010-9 (N=11); 2011 – 0 (N=7); 2012 – 0 (N=9); 3 yr. ave.= 3% 10th Grade Science (% P/A): 2010-18 (N=11); 2011 – 0 (N=7); 2012 – 0 (N=9); 3 yr. ave.= 6%
Improve student reading, writing, and math skills. Essential Learning Targets and formative assessments. Increase student engagement and post-secondary readiness.
Students come to Lincoln High School with significant gaps in their academic skills. Lack of Essential Learning Targets (ELT’s) in reading, writing, and math and formative assessments (CBQM’s) that align with ELT’s where data is used to drive instruction. Lack of consistent grading practices and expectations. Reading, writing, and math are not emphasized consistently in all curricular areas. Lack of sufficient preparation forTCAP testing. Lack of intervention strategies, especially in reading and math. Lack of reliable progress monitoring to accurately assess student progress.

CDE Improvement Planning Template for Schools (Version 3.2 -- Last updated: July 9, 2012) 9
Performance Indicators Description of Notable Trends (3 years of past state and local data)
Priority Performance Challenges Root Causes
Academic Growth
Reading: 2010 – 38(N= 9); 2011 – 74 (N=12); 2012 – 43 (N=12)
Improve student reading, writing, and math skills. Essential Learning Targets and formative assessments. Increase student engagement and post-secondary readiness.
Students come to Lincoln High School with significant gaps in their academic skills. Lack of Essential Learning Targets (ELT’s) in reading, writing, and math and formative assessments that align with ELT’s where data is used to drive instruction. Lack of consistent grading practices and expectations. Reading, writing, and math are not emphasized consistently in all curricular areas. Lack of intervention strategies, especially in reading and math. Lack of reliable progress monitoring to accurately assess student progress.
Writing: 2010 – 67 (N= 9); 2011 – 49 (N=12); 2012 – 33 (N=12)
Math: 2010 – 28 (N= 9); 2011 – 28 (N=12); 2012 – 44 (N=12)
Student Engagement
Truancy Rate: 2010 – 4.7%; 2011 – 5.5%; 2012 – 7%; 3 yr. ave. = 5.7%
Improve student reading, writing, and math skills. Essential Learning Targets and formative assessments. Increase student engagement and post-secondary readiness.
Students come to Lincoln High School with significant gaps in their academic skills and are behind their cohorts for on-time graduation. Lack of Essential Learning Targets (ELT’s) in reading, writing, and math and formative assessments that align with ELT’s where data is used to drive instruction. Students have lost hope that they can graduate, let alone go to college. Students do not see the relevance of an education to post-secondary options.
Attendance Rate: 2010- 90.0%; 2011 – 89%; 2012 – 89%; 3 yr. ave.=89.3%
Post Secondary & Workforce Readiness
Completion/Graduation Rate: 2010– 34.1%; 2011 – 50%; 2012 – 36.4%; 3 yr. ave. = 40.17%
Improve student reading, writing, and math skills. Essential Learning
Lack of sufficient preparation for ACT testing. Students come to Lincoln High School with significant gaps in their academic skills and are behind their cohorts for on-time graduation, for some 2 – 3 years behind.
Dropout Rate: 2010 – 15.1%; 2011 – 18.5%; 3 yr. ave.=22.5%

CDE Improvement Planning Template for Schools (Version 3.2 -- Last updated: July 9, 2012) 10
Performance Indicators Description of Notable Trends (3 years of past state and local data)
Priority Performance Challenges Root Causes
Mean ACT Composite Score: 2010 – 15.1; 2011 – 15.2; 2012 – 15.3; 3 yr. ave.= 15.2
Targets and formative assessments. Increase student engagement and post-secondary readiness. .
Lack of Essential Learning Targets (ELT’s) in reading, writing, and math and formative assessments that align with ELT’s where data is used to drive instruction. Students have lost hope that they can graduate, let alone go to college. Students do not see the relevance of an education to post-secondary options. Lack of reliable progress monitoring to accurately assess student progress.
CDE Improvement Planning Template for Schools (Version 3.2 -- Last updated: July 9, 2012) 11
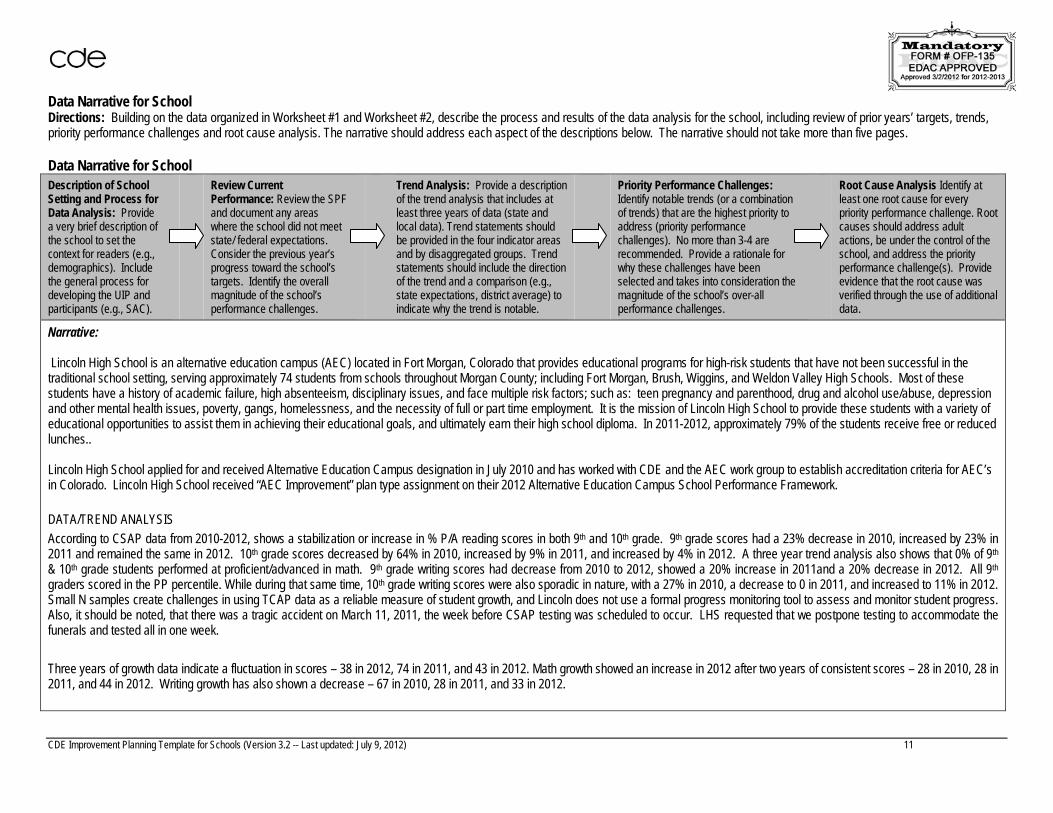
Data Narrative for School Directions: Building on the data organized in Worksheet #1 and Worksheet #2, describe the process and results of the data analysis for the school, including review of prior years’ targets, trends, priority performance challenges and root cause analysis. The narrative should address each aspect of the descriptions below. The narrative should not take more than five pages. Data Narrative for School Description of School Setting and Process for Data Analysis: Provide a very brief description of the school to set the context for readers (e.g., demographics). Include the general process for developing the UIP and participants (e.g., SAC).
Review Current Performance: Review the SPF and document any areas where the school did not meet state/ federal expectations. Consider the previous year’s progress toward the school’s targets. Identify the overall magnitude of the school’s performance challenges.
Trend Analysis: Provide a description of the trend analysis that includes at least three years of data (state and local data). Trend statements should be provided in the four indicator areas and by disaggregated groups. Trend statements should include the direction of the trend and a comparison (e.g., state expectations, district average) to indicate why the trend is notable.
Priority Performance Challenges: Identify notable trends (or a combination of trends) that are the highest priority to address (priority performance challenges). No more than 3-4 are recommended. Provide a rationale for why these challenges have been selected and takes into consideration the magnitude of the school’s over-all performance challenges.
Root Cause Analysis Identify at least one root cause for every priority performance challenge. Root causes should address adult actions, be under the control of the school, and address the priority performance challenge(s). Provide evidence that the root cause was verified through the use of additional data.
Narrative: Lincoln High School is an alternative education campus (AEC) located in Fort Morgan, Colorado that provides educational programs for high-risk students that have not been successful in the traditional school setting, serving approximately 74 students from schools throughout Morgan County; including Fort Morgan, Brush, Wiggins, and Weldon Valley High Schools. Most of these students have a history of academic failure, high absenteeism, disciplinary issues, and face multiple risk factors; such as: teen pregnancy and parenthood, drug and alcohol use/abuse, depression and other mental health issues, poverty, gangs, homelessness, and the necessity of full or part time employment. It is the mission of Lincoln High School to provide these students with a variety of educational opportunities to assist them in achieving their educational goals, and ultimately earn their high school diploma. In 2011-2012, approximately 79% of the students receive free or reduced lunches.. Lincoln High School applied for and received Alternative Education Campus designation in July 2010 and has worked with CDE and the AEC work group to establish accreditation criteria for AEC’s in Colorado. Lincoln High School received “AEC Improvement” plan type assignment on their 2012 Alternative Education Campus School Performance Framework. DATA/TREND ANALYSIS According to CSAP data from 2010-2012, shows a stabilization or increase in % P/A reading scores in both 9th and 10th grade. 9th grade scores had a 23% decrease in 2010, increased by 23% in 2011 and remained the same in 2012. 10th grade scores decreased by 64% in 2010, increased by 9% in 2011, and increased by 4% in 2012. A three year trend analysis also shows that 0% of 9th & 10th grade students performed at proficient/advanced in math. 9th grade writing scores had decrease from 2010 to 2012, showed a 20% increase in 2011and a 20% decrease in 2012. All 9th graders scored in the PP percentile. While during that same time, 10th grade writing scores were also sporadic in nature, with a 27% in 2010, a decrease to 0 in 2011, and increased to 11% in 2012. Small N samples create challenges in using TCAP data as a reliable measure of student growth, and Lincoln does not use a formal progress monitoring tool to assess and monitor student progress. Also, it should be noted, that there was a tragic accident on March 11, 2011, the week before CSAP testing was scheduled to occur. LHS requested that we postpone testing to accommodate the funerals and tested all in one week. Three years of growth data indicate a fluctuation in scores – 38 in 2012, 74 in 2011, and 43 in 2012. Math growth showed an increase in 2012 after two years of consistent scores – 28 in 2010, 28 in 2011, and 44 in 2012. Writing growth has also shown a decrease – 67 in 2010, 28 in 2011, and 33 in 2012.

CDE Improvement Planning Template for Schools (Version 3.2 -- Last updated: July 9, 2012) 12
Few of Lincoln High School graduates finish with their four-year cohort group. Lincoln’s 3 year average graduation rate is 38.79%, but of those that do graduate, approximately 75% either pursue post-secondary education options or are gainfully employed. Lincoln also has a 3 year dropout rate of 22.5%, with the lowest point being in 2012 with 12.4%. The mean ACT composite score for 11th graders is consistently below state average, with a 3 year average of 15.6, with the lowest sub-test scores being in English and reading. Lincoln average daily attendance rate has remained stable from 2010 to 2012 at 89%. ROOT CAUSE ANALYSIS Students come to Lincoln High School with significant gaps in their academic skills and are behind their cohorts for on-time graduation. Lack of Essential Learning Targets (ELT’s) in reading, writing, and math and formative assessments that align with ELT’s where data is used to drive instruction. Lack of consistent grading practices and expectations. Reading, writing, and math are not emphasized consistently in all curricular areas. Lack of intervention strategies, especially in reading and math. Lack of reliable progress monitoring to accurately assess student progress. Lack of sufficient preparation for CSAP and ACT testing. Students have lost hope that they can graduate, let alone go to college. Students do not see the relevance of an education to post-secondary options. PRIORITY NEEDS Improve students’ reading, writing, and math skills. Increase student engagement and post-secondary readiness. Essential Learning Targets and formative assessments.

CDE Improvement Planning Template for Schools (Version 3.2 -- Last updated: July 9, 2012) 13
Section IV: Action Plan(s)
This section addresses the “plan” portion of the continuous improvement cycle. First, you will identify your annual performance targets and the interim measures. This will be documented in the required School Target Setting Form below. Then you will move into action planning, which should be captured in the Action Planning Form. School Target Setting Form Directions: Complete the worksheet below. While schools may set targets for all performance indicators, at a minimum, they must set targets for those priority performance challenges identified in Section III (e.g., by disaggregated student groups, grade levels, subject areas). Schools are expected to set their own annual targets for academic achievement, academic growth, academic growth gaps and postsecondary and workforce readiness. At a minimum, schools should set targets for each of the performance indicators where state expectations are not met – in each area where a priority performance challenge was identified; targets should also be connected to prioritized performance challenges. Consider last year’s targets (see Worksheet #1) and whether adjustments need to be made. For each annual performance target, identify interim measures that will be used to monitor progress toward the annual targets at least quarterly during the school year.

CDE Improvement Planning Template for Schools (Version 3.2 -- Last updated: July 9, 2012) 14
School Target Setting Form
Performance Indicators
Measures/ Metrics
Priority Performance Challenges
Annual Performance Targets Interim Measures for 2012-13 Major Improvement
Strategy 2012-13 2013-14
Academic Achievement
(Status)
TCAP, CoAlt, Lectura, Escritura
R
Completing and implementing ELT’s. Providing appropriate interventions for struggling students.
By the end of the 2012-2013, increase the percent of student scoring proficient/advanced by an additional 5%, from 39.5% to 44.5%.
By the end of 2013-2014, increase the percent of students scoring proficient/advance by 5%, from 36% to 41%.
Decrease in weekly unsatisfactory progress reports.
Identify and implement Essential Learning Targets for Reading and Math that align horizontally and vertically with state standards. Utilize CBQM data to identify needed interventions. Provide additional support (RtI) for students struggling in reading and math.
M
Completing and implementing ELT’s. Providing appropriate interventions for struggling students.
By the end of the 2012-2013, increase the percent of students scoring proficient/advanced an additional 2%, from 5% to 7%.
By the end of 2013-2014, increase the percent of students scoring proficient/advance by 3%, for 0% to 3%.
Decrease in weekly unsatisfactory progress reports.
Identify and implement Essential Learning Targets for Reading and Math that align horizontally and vertically with state standards. Provide additional support (RtI) for students struggling in reading and math.
W S
Optional Supplemental Measure(s)
Academic Median R

CDE Improvement Planning Template for Schools (Version 3.2 -- Last updated: July 9, 2012) 15
Growth Student Growth Percentile (TCAP)
M
Completing and implementing ELT’s. Providing appropriate interventions for struggling students.
By the end of 2012 – 2013, increase an additional 8 percentile points from 52 to 60.
By the end of 2013-2014, increase an additional 7 percentile points from 45 to 52.
Decrease in weekly unsatisfactory progress reports.
Identify and implement Essential Learning Targets for Reading and Math that align horizontally and vertically with state standards. Provide additional support (RtI) for students struggling in reading and math.
W Optional Supplemental Measure(s)
Student Engagement
Attendance Rate
Current attendance procedures state, “Anyone exceeding his/her allotted number of absences, may be dropped from enrollment, or transferred to other District programs.” This policy is meant to motivate students but at times “pushes them out”.
By the end of the 2012-2013, increase the ADA rate an additional 2% from 90% to 92%.
By the end of the 2013-2014, increase the ADA by an additional 2% from 89% to 91%.
Monthly monitoring of ADA rate.
Evaluate the current attendance procedures for effectiveness and make changes that would improve attendance and engagement. Increase student engagement and post secondary readiness.
Truancy Rate
Current attendance procedures state, “Anyone exceeding his/her allotted number of absences, may be dropped from enrollment, or transferred to other District programs. This policy is meant to motivate students but at
By the end of 2012-2013, decrease the truancy rate by another 1%, from 4.5% to 3.5%.
By the end of the 2013-2014, decrease the truancy rate by 3%, from 7% to 4%.
Monitor student absences. File a truancy petition with the court for students under the age of 17 to leverage attendance.
Evaluate the current attendance procedures for effectiveness and make changes that would improve attendance and engagement. Increase student engagement and post

CDE Improvement Planning Template for Schools (Version 3.2 -- Last updated: July 9, 2012) 16
times “pushes them out”. secondary readiness.
Optional Supplemental Measure(s)
Post Secondary & Workforce Readiness
Completion Rate Motivating students to remain engaged in their education.
By the end of 2012-2013, increase the combined graduation/completion rate by an additional 3%, from 40.9% to 42.9%.
By the end of 2013-2014, increase the combined graduation rate by 3%, from 36.4% to 39.4%.
Monitoring of yearly and monthly student goals and credit completion.
Increase student engagement and post secondary readiness.
Dropout Rate
Current attendance procedures state, “Anyone exceeding his/her allotted number of absences, may be dropped from enrollment, or transferred to other District programs. This policy is meant to motivate students but at times “pushes them out”.
By the end of 2012-2013, decrease the dropout rate by an additional 3.6%, from 14.9% to 11.3%.
By the end of 2013-2014, decrease the dropout rate to 13%, a 10% decrease.
Monthly dropout reports.
Increase student engagement and post secondary readiness. Evaluate the current attendance procedures for effectiveness and make changes that would improve attendance and engagement.
Mean ACT Composite Score
Completing and implementing ELT’s. Providing appropriate interventions for struggling students
By the end of 2012-2013, increase the mean ACT Composite Score by an additional 1%, from 16.7 to 17.6.
By the end of 2013-2014, increase the mean ACT Composite Score by 1% from 15.2 to 16.2.
Practice ACT tests available from www.act.org or www.collegeincolorado.org
Identify and implement Essential Learning Targets for Reading and Math that align horizontally and vertically with state standards. Provide additional support (RtI) for students struggling in reading and math.

CDE Improvement Planning Template for Schools (Version 3.2 -- Last updated: July 9, 2012) 17
Action Planning Form for 2012-13 and 2013-14 Directions: Identify the major improvement strategy(s) for 2012-13 and 2013-14 that will address the root causes determined in Section III. For each major improvement strategy, identify the root cause(s) that the action steps will help to dissolve. Then, indicate which accountability provision or grant opportunity it will address. In the chart below, provide details about key action steps necessary to implement the major improvement strategy. Details should include the action steps that will be taken to implement the major improvement strategy, a general timeline, resources that will be used to implement the actions, and implementation benchmarks. Add rows in the chart, as needed. While space has been provided for three major improvement strategies, the school may add other major strategies, as needed. Major Improvement Strategy #1: Provide additional support for students struggling in reading and math. Root Cause(s) Addressed: Students come to Lincoln High School with significant gaps in their academic skills and are behind their cohorts for on-time graduation. Lack of intervention strategies, especially in reading and math. Lack of reliable progress monitoring to accurately assess student progress. Accountability Provisions or Grant Opportunities Addressed by this Major Improvement Strategy (check all that apply):
School Plan under State Accountability Title I Schoolwide or Targeted Assistance plan requirements Title I Focus School Plan requirements Application for a Tiered Intervention Grant (TIG) Improvement Support Partnership (ISP) or School Improvement Grant
Description of Action Steps to Implement the Major Improvement Strategy
Timeline (2012-13 and 2013-2014)
Key Personnel* Resources
(Amount and Source: federal, state, and/or local)
Implementation Benchmarks
Status of Action Step* (e.g., completed, in progress, not begun)
Continue to utilize Professional Learning Communities to analyze student data and identify students in need of intervention strategies.
On-going All staff Parents Students
None Students are identified and receiving targeted interventions in reading and math.
On-going – Bi-monthly PLC meetings
Send one staff member to the Simplifying RtI Institute.
June 26-28, 2013
Director TDIP Professional Development monies: approximately $700
Director will implement professional development for staff to identify and implement the proper intervention strategies to be used with students.
Not begun
All staff will participate in the Simplifying RtI Workshop.
August 2013 All staff TDIP Professional Development monies: approximately $800
Staff will utilize new information to analyze existing practices and identify intervention strategies that need to be implemented with students.
Not begun
CDE Improvement Planning Template for Schools (Version 3.2 -- Last updated: July 9, 2012) 18
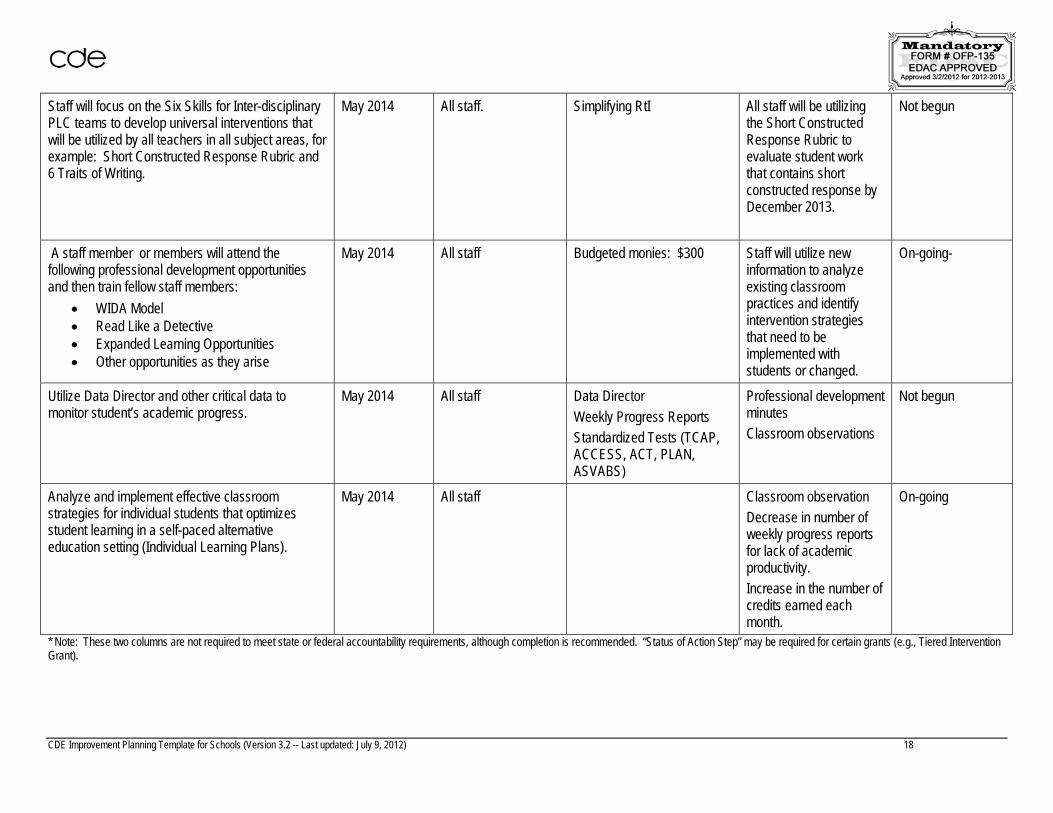
Staff will focus on the Six Skills for Inter-disciplinary PLC teams to develop universal interventions that will be utilized by all teachers in all subject areas, for example: Short Constructed Response Rubric and 6 Traits of Writing.
May 2014 All staff. Simplifying RtI All staff will be utilizing the Short Constructed Response Rubric to evaluate student work that contains short constructed response by December 2013.
Not begun
A staff member or members will attend the following professional development opportunities and then train fellow staff members:
WIDA Model Read Like a Detective Expanded Learning Opportunities Other opportunities as they arise
May 2014 All staff Budgeted monies: $300 Staff will utilize new information to analyze existing classroom practices and identify intervention strategies that need to be implemented with students or changed.
On-going-
Utilize Data Director and other critical data to monitor student’s academic progress.
May 2014 All staff Data Director Weekly Progress Reports Standardized Tests (TCAP, ACCESS, ACT, PLAN, ASVABS)
Professional development minutes Classroom observations
Not begun
Analyze and implement effective classroom strategies for individual students that optimizes student learning in a self-paced alternative education setting (Individual Learning Plans).
May 2014 All staff Classroom observation Decrease in number of weekly progress reports for lack of academic productivity. Increase in the number of credits earned each month.
On-going
* Note: These two columns are not required to meet state or federal accountability requirements, although completion is recommended. “Status of Action Step” may be required for certain grants (e.g., Tiered Intervention Grant).

CDE Improvement Planning Template for Schools (Version 3.2 -- Last updated: July 9, 2012) 19
Major Improvement Strategy #2: Increase student engagement and post-secondary readiness. Root Cause(s) Addressed: Students have lost hope that they can graduate, let alone go to college or technical school. Students do not see the relevance of an education to post-secondary options. Accountability Provisions or Grant Opportunities Addressed by this Major Improvement Strategy (check all that apply):
School Plan under State Accountability Title I Schoolwide or Targeted Assistance Plan requirements Title I Focus School Plan requirements Application for a Tiered Intervention Grant (TIG) Improvement Support Partnership (ISP) or School Improvement Grant
Description of Action Steps to Implement the Major Improvement Strategy
Timeline (2012-13 and 2013-2014)
Key Personnel* Resources
(Amount and Source: federal, state, and/or local)
Implementation Benchmarks
Status of Action Step* (e.g., completed, in progress, not begun)
Students will develop an ICAP on the College in Colorado website.
On-going Director Counselor Staff Parents Students
www.collegeincolorado.org Completion of assigned grade level activities.
On-going
Plan opportunities for students to connect their need for an education to post-secondary options.
On-going All staff Community members College and military representatives Work Force Center Job Shadowing Experiences
PoWeR Up for Success! College and Career Fair evaluations College and career assembly evaluations Advisement period activities
On-going
Provide professional development opportunities for staff that assists them in improving student motivation, understanding challenging behaviors, student learning styles, implementing engagement strategies, and student mentoring.
December 2014
All staff Professional development trainings (Wired Differently, Mean Girls, etc.) - Budget $200.
Increase in ADA. On-going
Provide tutoring and intervention opportunities for students struggling academically. Opportunities can be with either a teacher or a peer tutor.
May 2014 All staff Staff Peer Tutors Community Members
Tutoring will be offered on a weekly basis, either during an advisement period or after-school.
In-progress

CDE Improvement Planning Template for Schools (Version 3.2 -- Last updated: July 9, 2012) 20
Students who are not making adequate academic progress and experiencing attendance difficulties will participate in the Why Try Program.
May 2014 Director Counselor Community agency support
Workbooks Community agencies
90% of the students that participate in the Why Try program will increase their attendance and amount of academic productivity.
Not begun

CDE Improvement Planning Template for Schools (Version 3.2 -- Last updated: July 9, 2012) 21
Major Improvement Strategy #3: Identify and implement Essential Learning Targets for Reading and Math that align horizontally and vertically with state standards. Root Cause(s) Addressed: Lack of Essential Learning Targets (ELT’s) in reading, writing, and math and formative assessments that align with ELT’s where data is used to drive instruction. Lack of reliable progress monitoring to accurately assess student progress. Reading, writing, and math are not emphasized consistently in all curricular areas. Students come to Lincoln High School with significant gaps in their academic skills and are behind their cohorts for on-time graduation. Accountability Provisions or Grant Opportunities Addressed by this Major Improvement Strategy (check all that apply):
School Plan under State Accountability Title I Schoolwide or Targeted Assistance plan requirements Title I Focus School Plan requirements Application for a Tiered Intervention Grant (TIG) Improvement Support Partnership (ISP) or School Improvement Grant
Description of Action Steps to Implement the Major Improvement Strategy
Timeline (2012-13 and 2013-2014)
Key Personnel* Resources
(Amount and Source: federal, state, and/or local)
Implementation Benchmarks
Status of Action Step* (e.g., completed, in progress, not begun)
Complete the development of Essential Learning Targets (ELT’s) for reading and math that align horizontally and vertically with state standards.
May 2014 All certified staff Director
District established ELT’s Colorado State Standards Data Director Classroom materials
Completed ELT templates
In progress
Incorporate fundamental reading, writing and math skills cross curricular, targeting ELT’s that have been developed, such as a Short Constructed Response Rubric and the 6 Traits of Writing.
May 2014 All certified staff Director
District established ELT’s Colorado State Standards Data Director Classroom materials
Completed ELT templates PLC Minutes
In progress
Implement ELT’s for reading and math that align horizontally and vertically with state standards
May 2014 All certified staff Director
District established ELT’s Colorado State Standards Data Director Classroom materials
Completed ELT templates
In progress
Create/modify formative assessments that appropriately measure and monitor the essential learning targets that have been established and taught.
May 2014 All certified staff Director
District established ELT’s Colorado State Standards Data Director Classroom materials
Completed formative assessments PLC agendas and minutes
Not begun

CDE Improvement Planning Template for Schools (Version 3.2 -- Last updated: July 9, 2012) 22
Section V: Appendices
Some districts/consortia will need to provide additional forms to document accountability or grant requirements:
Title I Schoolwide Program (Required) Title I Targeted Assistance Program (Required) Additional Requirements for Turnaround Status Under State Accountability (Required)