KenYakenyare.co.ke/pdfs/Kenya_Insurance_Report_Q1_2012.pdf · others being South Africa, Egypt and...
54
Q1 2012 www.businessmonitor.com INSURANCE REPORT ISSN 2044-561X Published by Business Monitor International Ltd. KENYA INCLUDES BMI'S FORECASTS
Transcript of KenYakenyare.co.ke/pdfs/Kenya_Insurance_Report_Q1_2012.pdf · others being South Africa, Egypt and...

Q1 2012www.businessmonitor.com
insurance report
issn 2044-561Xpublished by Business Monitor international Ltd.
KenYaINCLUDES BMI'S FORECASTS
Business Monitor International 85 Queen Victoria Street London EC4V 4AB UK Tel: +44 (0) 20 7248 0468 Fax: +44 (0) 20 7248 0467 Email: [email protected] Web: http://www.businessmonitor.com
© 2012 Business Monitor International. All rights reserved. All information contained in this publication is copyrighted in the name of Business Monitor International, and as such no part of this publication may be reproduced, repackaged, redistributed, resold in whole or in any part, or used in any form or by any means graphic, electronic or mechanical, including photocopying, recording, taping, or by information storage or retrieval, or by any other means, without the express written consent of the publisher.
DISCLAIMER All information contained in this publication has been researched and compiled from sources believed to be accurate and reliable at the time of publishing. However, in view of the natural scope for human and/or mechanical error, either at source or during production, Business Monitor International accepts no liability whatsoever for any loss or damage resulting from errors, inaccuracies or omissions affecting any part of the publication. All information is provided without warranty, and Business Monitor International makes no representation of warranty of any kind as to the accuracy or completeness of any information hereto contained.
KENYA INSURANCE REPORT Q1 2012 INCLUDES 5-YEAR FORECASTS TO 2016
Part of BMI’s Industry Report & Forecasts Series
Published by: Business Monitor International
Copy deadline: December 2011

Kenya Insurance Report Q1 2012
© Business Monitor International Ltd Page 2

Kenya Insurance Report Q1 2012
© Business Monitor International Ltd Page 3
Contents Executive Summary ......................................................................................................................................... 5
Table: Total Premiums, 2009-2016 ....................................................................................................................................................................... 5 Key Insights And Key Risks ......................................................................................................................................................................................... 5
SWOT Analysis ................................................................................................................................................. 7 Kenya Insurance Industry SWOT ........................................................................................................................................................................... 7 Kenya Political SWOT ........................................................................................................................................................................................... 8 Kenya Economic SWOT ......................................................................................................................................................................................... 8 Kenya Business Environment SWOT ...................................................................................................................................................................... 9
Life Sector ....................................................................................................................................................... 10 Africa Life Sector Overview ...................................................................................................................................................................................... 10
Table: Middle East And Africa Life Premiums, 2008-2016 (US$mn) .................................................................................................................. 10 Kenya Life Sector Update ......................................................................................................................................................................................... 11 Life Industry Forecast Scenario ................................................................................................................................................................................ 12
Table: Life Premiums, 2009-2016 ........................................................................................................................................................................ 12 Growth Drivers And Risk Management Projections ................................................................................................................................................. 13
Population ........................................................................................................................................................................................................... 13 Table: Insurance Key Drivers – Demographics, 2009-2016 ................................................................................................................................ 13
Non-Life Sector ............................................................................................................................................... 15 Africa Non-Life Sector Overview .............................................................................................................................................................................. 15
Table: Middle East And Africa Non-Life Premiums, 2008-2016 (US$mn)........................................................................................................... 15 Kenya Non-Life Sector Update ................................................................................................................................................................................. 16
Table: Breakdown Of Non-Life Premiums, 2008-2009 (KESmn) ......................................................................................................................... 16 Non-Life Industry Forecast Scenario ........................................................................................................................................................................ 18
Table: Non-Life Premiums, 2009-2016 ................................................................................................................................................................ 18 Growth Drivers And Risk Management Projections ................................................................................................................................................. 19
Macroeconomic Outlook ...................................................................................................................................................................................... 19 Table: Kenya Economic Activity, 2001-2016 ....................................................................................................................................................... 21 Political Stability Outlook .................................................................................................................................................................................... 21 Healthcare ........................................................................................................................................................................................................... 24 Health Insurance ................................................................................................................................................................................................. 26 Epidemiology ....................................................................................................................................................................................................... 28 Table: Insurance Key Drivers – DALYs 2009-2016 ............................................................................................................................................. 35 Motor ................................................................................................................................................................................................................... 37 Islamic Finance ................................................................................................................................................................................................... 38
Insurance Risk/Reward Ratings ................................................................................................................... 39 Table: Middle East And Africa Insurance Risk/Reward Ratings .......................................................................................................................... 39
Competitive Landscape ................................................................................................................................. 40 Major Players In Kenya’s Insurance Sector ............................................................................................................................................................. 40
Table: Non-Life Companies’ Premiums And Market Share, 2008-2009 .............................................................................................................. 41 Table: Life Companies’ Market Shares, 2009 (KESmn) ...................................................................................................................................... 43
Company Profiles ........................................................................................................................................... 44 APA Insurance ..................................................................................................................................................................................................... 44 Apollo .................................................................................................................................................................................................................. 45 Blue Shield Insurance .......................................................................................................................................................................................... 46 Jubilee Holdings .................................................................................................................................................................................................. 47 Kenindia .............................................................................................................................................................................................................. 47

Kenya Insurance Report Q1 2012
© Business Monitor International Ltd Page 4
Pan Africa ............................................................................................................................................................................................................ 48
BMI Methodology ........................................................................................................................................... 49 Insurance Risk/Reward Ratings ................................................................................................................................................................................ 51
Table: Insurance Risk/Reward Indicators And Rationale .................................................................................................................................... 52 Table: Weighting Of Indicators ........................................................................................................................................................................... 53

Kenya Insurance Report Q1 2012
© Business Monitor International Ltd Page 5
Executive Summary
Table: Total Premiums, 2009-2016
2009 2010 2011e 2012f 2013f 2014f 2015f 2016f
Total premiums, KESmn 64,470 79,060 90,233 108,281 127,669 148,459 170,904 195,318
Total premiums, KES , % change y-o-y 16.8 22.6 14.1 20.0 17.9 16.3 15.1 14.3
Total premiums, KES per capita 1,634 1,951 2,169 2,533 2,907 3,290 3,689 4,107
Total premiums, % of GDP 2.7 3.1 3.2 3.0 3.1 3.1 3.1 3.1
Total premiums, US$mn 835 998 1,003 1,237 1,395 1,571 1,753 1,943
Total premiums, US$, % change y-o-y 5.4 19.5 0.5 23.4 12.8 12.6 11.6 10.9
Total premiums, US$ per capita 21 25 24 29 32 35 38 41
Total premiums, EURmn 597 752 701 897 1,073 1,257 1,402 1,555
Total premiums, EUR, % change y-o-y 10.7 26.1 -6.8 27.9 19.7 17.1 11.6 10.9
Total premiums, EUR per capita 15 19 17 21 24 28 30 33
e/f = BMI estimate/forecast. Source: Insurance Regulatory Authority (IRA), Association of Kenyan Insurers (AKI)
Key Insights And Key Risks
The long-term achievements of the various protagonists – the trade association, the regulator and the
insurance companies themselves – are real and substantial. In spite of Kenya’s well publicised economic,
social and political problems, non-life insurance penetration has risen to around 2% of GDP – a
remarkably high figure given the overall income level in Kenya. We think this is a reflection of the
innovativeness of many of Kenya’s indigenous non-life insurers, most of which are small organisations
by most standards. The insurers understand the needs of the clients and are responding accordingly.
Examples that have been publicised in recent months include agricultural risk products that cover farmers
against the impact of natural disaster, facilities to pay premiums via mobile phones and takaful. Another
indicator of the potential for the non-life segment is that Kenya is one of only four countries in Africa (the
others being South Africa, Egypt and Uganda) in which global property and casualty insurance giant
Chartis has an on-the-ground presence.
In a country where many households are too poor to consider saving for the future, Kenya’s life insurers
have still managed to develop a segment that accounts for about a third of all premiums written in the
insurance sector as a whole. In other words, they have collectively built sufficient trust among those

Kenya Insurance Report Q1 2012
© Business Monitor International Ltd Page 6
Kenyans who can save for the long-term. Given the country’s tendency for high(ish) inflation, this is very
much to their credit. Unlike in some Eastern European countries, the development of the segment has not
been driven entirely by multinational giants. South Africa’s Metropolitan Life has a subsidiary in Kenya.
Sanlam, another South African major, has a strategic relationship with Pan Africa, as well as its own
subsidiary in African Insurance. However, the local life companies have also been key players in the
segment’s evolution. Life density is low by many standards but is clearly growing rapidly.
We remain optimistic about the prospects for Kenya’s insurance sector, including in our projections
through to 2016.

Kenya Insurance Report Q1 2012
© Business Monitor International Ltd Page 7
SWOT Analysis
Kenya Insurance Industry SWOT
Strengths Kenya’s insurance industry is resilient. Despite the country’s various economic and political problems, the industry has shown it can survive and thrive.
Particularly encouraging is the development of a local life insurance industry, which accounts for about a third of total premiums.
Local groups are engaged in insurance, as are foreign insurers to a lesser extent. The industry is represented by a well organised trade body and overseen by a
relatively new and empowered regulator (at least in theory). The non-life segment has moved beyond motor insurance. Micro-insurance products are developing and are ready for the regulatory and
economic environment to improve their selling potential. Insurance companies are grouping themselves together in an effort to build
economies of scale.
Weaknesses No insurer is large, except in a local context, and there are few actual economies of scale.
Past restrictions and a generally challenging business environment in a small economy have limited the involvement of foreign insurers.
Poverty and lack of awareness appear to be major constraints. State-owned enterprises, potentially substantial users of insurance, have financial
problems. HIV/AIDS limits the potential for health insurance and life insurance. Insurers have been overly dependent on traditional products and distribution channels According to the Insurance Regulatory Authority, fraud and corruption have been
significant problems. The regulatory structure has limited the sales of micro-insurance and this needs to be
rectified.
Opportunities It seems reasonable to expect a continuation of double-digit growth in both segments. Some insurers may boost economies of scale through further consolidation. Investment by and partnerships with Indian and South African insurers indicate that
Kenyan insurers have access to foreign capital and know-how. The East African Community (EAC) common market, which came into effect in July
2010, may provide opportunities for Kenyan insurers. Kenyan insurers have demonstrated that they understand micro-insurance, are
innovative and can receive payments through mobile phone-based networks. The development of takaful products may open up a previously untapped market. Agricultural insurance may develop rapidly off an extremely low base.
Threats Deterioration of political conditions could hamper the development of the insurance sector.
High inflation represents a challenge to the long-term development of the life segment.

Kenya Insurance Report Q1 2012
© Business Monitor International Ltd Page 8
Kenya Political SWOT
Strengths The government is credibly committed to market-based economic reform. Allied with the US in the strategically important Horn of Africa region.
Weaknesses Perceptions of corruption are a hindrance to the government’s image at home and abroad.
The ethnic backdrop to Kenya’s political scene is a major source of tension, as demonstrated by the post-election violence in early 2008.
Opportunities Growing ties with China could give Kenya greater influence on the global stage. Constitutional reform is pending.
Threats Security risks presented by its border with Somalia, where instability could prompt further refugee inflows and drain government resources.
The structure of the coalition government augurs for political infighting, which could ultimately prompt a break-up of the coalition before the 2012 elections.
Kenya Economic SWOT
Strengths Increasing diversification away from the agricultural sector is making the country less sensitive to exogenous shocks.
Kenya benefits from a strategically advantageous location in the EAC. Increasing ties with China bode well for trade and investment.
Weaknesses Entrenched perceptions of corruption make for a substandard business environment. Unemployment and crime levels are rising.
Opportunities Amid the economic recovery, there is an opportunity and challenge to increase capacity in order to accelerate growth.
Kenya can benefit from the increasing integration of the EAC, primarily through growing intra-regional trade.
Threats The risk of drought is a constant threat to the economy, affecting inflation and export revenue, as well as the humanitarian consequences.
Kenya’s lacklustre productivity gains mean the country risk losing its export competitiveness.
Ethnic tensions highlighted by unrest surrounding the December 2007 presidential election could deter international investors for some time.
Kenya Insurance Report Q1 2012
© Business Monitor International Ltd Page 9
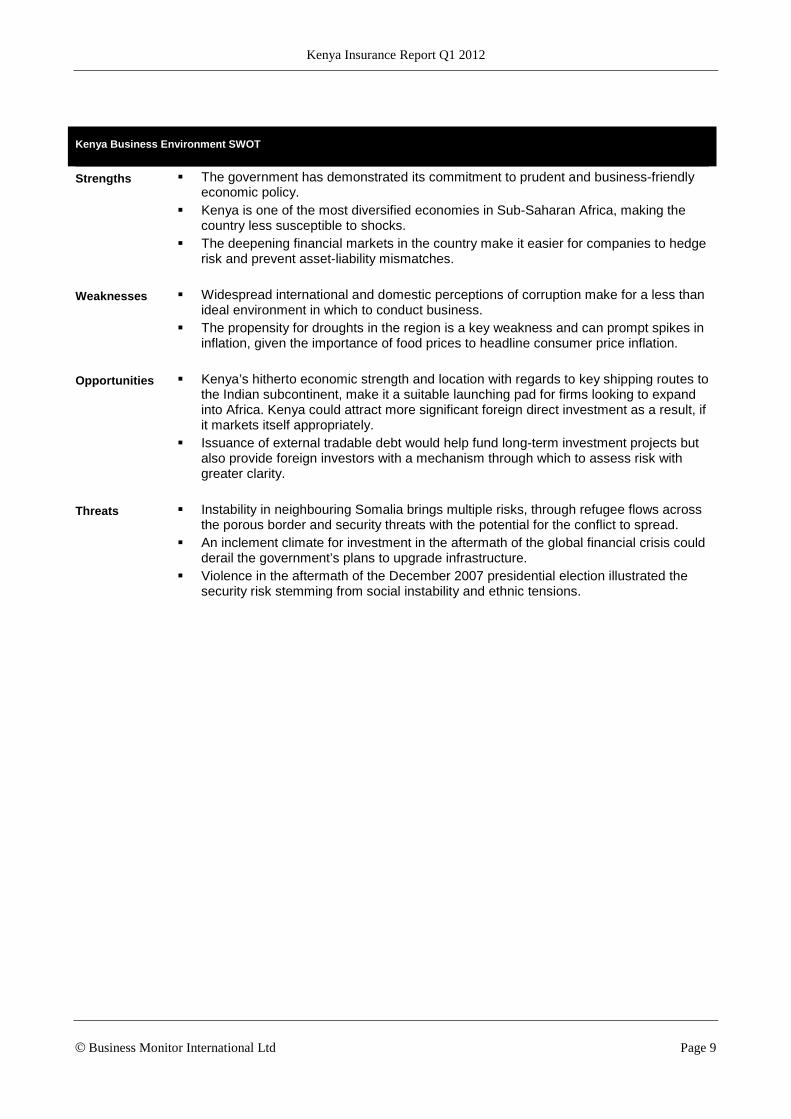
Kenya Business Environment SWOT
Strengths The government has demonstrated its commitment to prudent and business-friendly economic policy.
Kenya is one of the most diversified economies in Sub-Saharan Africa, making the country less susceptible to shocks.
The deepening financial markets in the country make it easier for companies to hedge risk and prevent asset-liability mismatches.
Weaknesses Widespread international and domestic perceptions of corruption make for a less than ideal environment in which to conduct business.
The propensity for droughts in the region is a key weakness and can prompt spikes in inflation, given the importance of food prices to headline consumer price inflation.
Opportunities Kenya’s hitherto economic strength and location with regards to key shipping routes to the Indian subcontinent, make it a suitable launching pad for firms looking to expand into Africa. Kenya could attract more significant foreign direct investment as a result, if it markets itself appropriately.
Issuance of external tradable debt would help fund long-term investment projects but also provide foreign investors with a mechanism through which to assess risk with greater clarity.
Threats Instability in neighbouring Somalia brings multiple risks, through refugee flows across the porous border and security threats with the potential for the conflict to spread.
An inclement climate for investment in the aftermath of the global financial crisis could derail the government’s plans to upgrade infrastructure.
Violence in the aftermath of the December 2007 presidential election illustrated the security risk stemming from social instability and ethnic tensions.

Kenya Insurance Report Q1 2012
© Business Monitor International Ltd Page 10
Life Sector
Africa Life Sector Overview
Table: Middle East And Africa Life Premiums, 2008-2016 (US$mn)
2008 2009 2010 2011e 2012f 2013f 2014f 2015f 2016f
Algeria 73.30 76.72 94.87 101.05 107.60 114.52 121.84 129.57 137.73
Egypt 1,063.11 1,077.21 1,229.04 1,155.51 1,175.42 1,255.06 1,339.57 1,429.09 1,523.85
Kenya 262.81 276.69 337.07 374.49 427.49 483.16 541.45 602.32 665.78
Libya 7.36 8.77 10.67 0.77 0.78 0.78 0.79 1.11 1.57
Morocco 852.44 830.15 790.55 798.50 806.56 814.65 822.69 830.60 838.37
Nigeria 247.36 262.02 310.12 365.75 375.11 384.73 394.60 404.74 415.14
South Africa 22,695.77 21,814.15 28,220.08 36,230.26 40,073.07 44,291.34 45,822.36 47,403.11 49,039.28
Tunisia 92.66 99.97 113.18 114.40 115.60 116.77 117.92 119.06 120.19
Bahrain 137.93 152.21 135.28 225.00 258.85 293.70 331.75 375.50 426.37
Iran 220.25 323.81 361.93 420.86 489.25 568.55 660.42 766.73 889.70
Israel 5,154.13 5,035.30 5,799.29 6,579.11 7,096.02 7,643.19 8,227.04 8,853.84 9,527.42
Jordan 50.65 49.41 53.62 55.96 58.23 60.45 62.71 65.04 67.46
Kuwait 152.45 152.43 185.25 190.76 195.73 200.30 204.66 208.96 213.23
Oman 106.50 101.30 106.49 108.93 111.15 113.19 115.14 117.06 118.96
Qatar 58.25 58.09 59.58 53.69 56.11 58.57 61.05 63.57 66.08
Saudi Arabia 158.61 267.82 259.55 318.65 390.86 479.07 586.85 718.54 732.86
UAE 724.21 890.95 1,089.18 1,200.93 1,286.58 1,377.52 1,474.07 1,576.53 1,685.07
e/f = BMI estimate/forecast. Source: BMI, national insurance regulators/associations
Across Sub-Saharan Africa (SSA), it is useful to consider South Africa separately from the other
countries. South Africa has developed a substantial life insurance segment of world class sophistication.
This is because, for all its problems in the past decades, there has been sufficient economic and financial
stability (together with law enforcement and competent regulators) for households to trust local financial
institutions with their long-term savings. Separately, life insurance has been boosted by the presence of a
sufficiently large and wealthy minority in the country who have been able to recognise the benefits of life
insurance and afford to pay for it. One of the opportunities for the South African life insurance segment is
the products that it offers for first-time users.

Kenya Insurance Report Q1 2012
© Business Monitor International Ltd Page 11
For a long-time, South Africa’s financial institutions were hard pressed to gain capital except from each
other because of political sanctions. As a result, the life segment is dominated by four large financial
services complexes – each of which includes a bank and a life company. Nevertheless, there are other
substantial life companies that are not affiliated with one of the majors. The cross shareholdings and
corporate relationships in general have been beneficial in that they have facilitated the use of bank
networks to sell insurance products in South Africa.
Outside South Africa, life insurance is very underdeveloped. In this respect, SSA is not dissimilar to the
Middle East and North Africa (MENA). However, there is a crucial difference. In the MENA region, life
insurance is often shunned because adequate social security is available from generous government
programmes. Not coincidentally, life insurance is a more important part of the overall life sector in
countries such as Morocco and Egypt than it is in the wealthy Gulf Cooperation Council states. In SSA,
life insurance has failed to flourish because people are too poor to be able to worry about long-term
savings and/or because they do not trust local institutions.
Partly for this reason, SSA has not been a priority area for most multinational companies. If there is an
exception, it is the South African majors, which have sufficient appetite for risk, an understanding of how
to develop life insurance markets from scratch and access to global capital markets.
Kenya Life Sector Update
Kenya’s life insurance sector is quite unusual. In terms of absolute premiums written, it is tiny. Density
(ie: premiums per capita) is low by all standards other than those of Africa (except South Africa).
Transparently, a sizeable percentage of all households are too poor to be able to consider saving for their
long-term futures via life insurance. Nevertheless, the rapid growth in density, and the fact that the
segment accounts for a significant portion (approximately a third) of all activity in the insurance sector, is
very encouraging.
As of late 2011, there are several other reasons for confidence in relation to the life segment in Kenya.
The first is that the country is of interest to foreign majors. Pan Africa Life has a strategic relationship
with South African giant Sanlam. Metropolitan Life, another major South African firm, has set up a
subsidiary in Kenya. A second reason is that, as is the case in the non-life segment, Kenyan companies
are innovative. Kenyan consumers are able insurance premium payments from their ‘virtual wallets’ on
their mobile phones through platforms such as Kilimo Salama. Third, the Association of Kenya Insurers
(AKI) has published a strategic plan to promote the development of the overall insurance sector. Given
the structure of the industry, this is likely to have greater benefit to providers of non-life insurance than
life insurers but the latter should also benefit.
Most importantly, there is net investment in the industry. In mid-2011, LeapFrog Investments invested
KES1.15bn (US$14mn) in Apollo Investment, which includes APA Insurance, Apollo Life Assurance,
Apollo Asset Management and Gordon Court. LeapFrog is the world’s largest investment fund focused
Kenya Insurance Report Q1 2012
© Business Monitor International Ltd Page 12
on insurance to underserved people and markets. Its capital and global insurance expertise should help
Apollo become a pre-eminent regional player in insurance in East Africa, including in micro-insurance.
Around the same time, Apollo said it had exercised its pre-emptive rights to buy the 39.97% stake in APA
that had previously owned by Pan Africa Insurance Holdings.
Life Industry Forecast Scenario
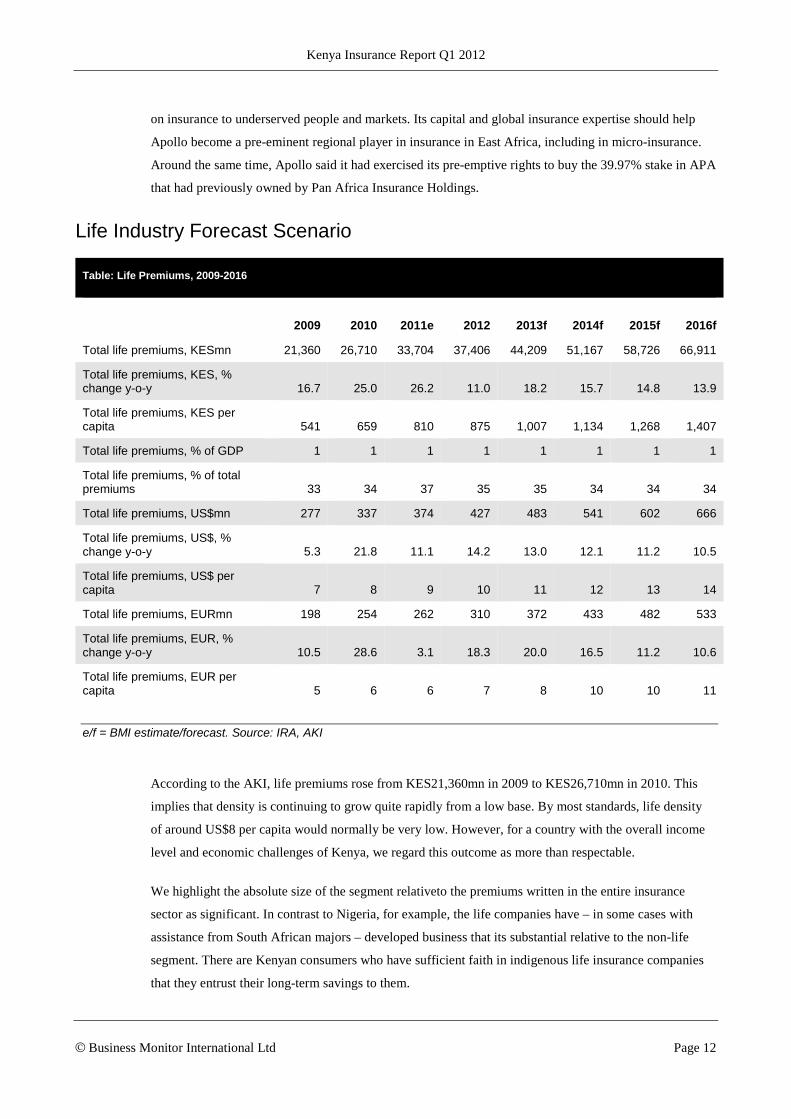
Table: Life Premiums, 2009-2016
2009 2010 2011e 2012 2013f 2014f 2015f 2016f
Total life premiums, KESmn 21,360 26,710 33,704 37,406 44,209 51,167 58,726 66,911
Total life premiums, KES, % change y-o-y 16.7 25.0 26.2 11.0 18.2 15.7 14.8 13.9
Total life premiums, KES per capita 541 659 810 875 1,007 1,134 1,268 1,407
Total life premiums, % of GDP 1 1 1 1 1 1 1 1
Total life premiums, % of total premiums 33 34 37 35 35 34 34 34
Total life premiums, US$mn 277 337 374 427 483 541 602 666
Total life premiums, US$, % change y-o-y 5.3 21.8 11.1 14.2 13.0 12.1 11.2 10.5
Total life premiums, US$ per capita 7 8 9 10 11 12 13 14
Total life premiums, EURmn 198 254 262 310 372 433 482 533
Total life premiums, EUR, % change y-o-y 10.5 28.6 3.1 18.3 20.0 16.5 11.2 10.6
Total life premiums, EUR per capita 5 6 6 7 8 10 10 11
e/f = BMI estimate/forecast. Source: IRA, AKI
According to the AKI, life premiums rose from KES21,360mn in 2009 to KES26,710mn in 2010. This
implies that density is continuing to grow quite rapidly from a low base. By most standards, life density
of around US$8 per capita would normally be very low. However, for a country with the overall income
level and economic challenges of Kenya, we regard this outcome as more than respectable.
We highlight the absolute size of the segment relativeto the premiums written in the entire insurance
sector as significant. In contrast to Nigeria, for example, the life companies have – in some cases with
assistance from South African majors – developed business that its substantial relative to the non-life
segment. There are Kenyan consumers who have sufficient faith in indigenous life insurance companies
that they entrust their long-term savings to them.

Kenya Insurance Report Q1 2012
© Business Monitor International Ltd Page 13
Looking forward, our forecasts are based on further steady growth in density as insurers reach first-time
users and/or develop innovative new products. Our projections for the medium term are marginally more
optimistic than are those of the AKI.
Growth Drivers And Risk Management Projections
Population
Population data is a crucial growth indicator for the life insurance sector: key demographic trends show
not only specific areas of growth potential, but can also highlight liability imbalances, and reveal
impending growth limitations when viewed in conjunction with penetration figures. Favourable
demographics, such as a large youth population, are indicative of promising growth potential, whereas an
ageing population or dwindling birth rate can signal curtailment of growth momentum for the sector.
Table: Insurance Key Drivers – Demographics, 2009-2016
2009 2010 2011e 2012f 2013f 2014f 2015f 2016f
Population, mn 39.46 40.51 41.61 42.75 43.92 45.12 46.33 47.56
Population, % change y-o-y 2.6 2.7 2.7 2.7 2.7 2.7 2.7 2.6
Population, total, male, ‘000 19,708 20,234 20,827 21,395 21,981 22,577 23,182 23,792
Population, total, female, ‘000 19,754 20,279 20,783 21,354 21,943 22,544 23,151 23,763
Population by age group, total, ‘000
Population, 0-4 yrs, total, ‘000 6,516 6,664 6,805 6,967 7,141 7,310 7,460 7,620
Population, 5-9 yrs, total, ‘000 5,548 5,715 5,888 6,049 6,196 6,334 6,473 6,632
Population, 10-14 yrs, total, ‘000 4,699 4,821 4,960 5,117 5,287 5,462 5,629 5,785
Population, 15-19 yrs, total, ‘000 4,281 4,314 4,362 4,431 4,519 4,627 4,751 4,887
Population, 20-24 yrs, total, ‘000 4,077 4,137 4,172 4,185 4,189 4,203 4,238 4,285
Population, 25-29 yrs, total, ‘000 3,448 3,563 3,675 3,784 3,886 3,971 4,035 4,069
Population, 30-34 yrs, total, ‘000 2,701 2,823 2,949 3,074 3,198 3,320 3,440 3,550
Population, 35-39 yrs, total, ‘000 2,001 2,095 2,203 2,318 2,439 2,564 2,691 2,815
Population, 40-44 yrs, total, ‘000 1,503 1,553 1,620 1,695 1,778 1,869 1,969 2,075
Population, 45-49 yrs, total, ‘000 1,221 1,247 1,278 1,312 1,350 1,396 1,450 1,512
Population, 50-54 yrs, total, ‘000 1,018 1,039 1,062 1,085 1,110 1,136 1,163 1,192
Population, 55-59 yrs, total, ‘000 822 853 880 904 925 946 968 987
Population, 60-64 yrs, total, ‘000 577 614 648 684 719 752 783 806
Population, 65-69 yrs, total, ‘000 385 400 419 445 476 509 542 572
Population, 70-74 yrs, total, ‘000 304 307 307 306 308 315 329 346
Population, 75+, total, ‘000 361 367 382 394 403 409 411 422

Kenya Insurance Report Q1 2012
© Business Monitor International Ltd Page 14
Table: Insurance Key Drivers – Demographics, 2009-2016
2009 2010 2011e 2012f 2013f 2014f 2015f 2016f
Dependent and active population
Dependent population, total, ‘000 17,813 18,275 18,761 19,278 19,811 20,338 20,845 21,378
Active population, % of total 55 55 55 55 55 55 55 55
Active population, total, ‘000 21,649 22,238 22,849 23,472 24,113 24,783 25,488 26,178
Youth population, total, ‘000 16,764 17,200 17,653 18,133 18,624 19,105 19,562 20,038
Pensionable popn. total, ‘000 1,050 1,074 1,108 1,145 1,186 1,232 1,283 1,340
Life expectancy
Life expectancy at birth, male, years 53.96 56.7
Life expectancy at birth, female, years 55.93 59.16
Urban/rural split
Urban popn. % of total 21.9 22.1 22.5 22.8 23.2 23.5 23.9 24.3
Rural popn. % of total 78.2 77.9 77.5 77.2 76.8 76.5 76.1 75.7
Urban popn, total, ‘000 8,622 8,953 9,346 9,755 10,182 10,621 11,073 11,575
Rural popn, total, ‘000 30,840 31,559 32,264 32,994 33,742 34,500 35,259 35,981
e/f = BMI estimate/forecast. Source: UN Population Division, BMI

Kenya Insurance Report Q1 2012
© Business Monitor International Ltd Page 15
Non-Life Sector
Africa Non-Life Sector Overview
Table: Middle East And Africa Non-Life Premiums, 2008-2016 (US$mn)
2008 2009 2010 2011e 2012f 2013f 2014f 2015f 2016f
Algeria 1,016.17 993.42 997.15 901.28 1,005.09 1,031.40 1,074.34 1,131.43 1,194.95
Egypt 767.91 855.93 918.09 907.39 864.50 1,085.80 1,398.06 1,687.07 1,999.20
Kenya 529.68 558.44 660.63 628.10 810.00 912.12 1,029.54 1,150.54 1,277.68
Libya 234.86 286.36 381.31 19.85 26.33 33.27 49.92 69.24 95.85
Morocco 1,693.67 1,757.05 1,806.06 1,859.42 2,011.30 2,214.52 2,410.46 2,605.62 2,817.00
Nigeria 1,020.67 1,081.16 1,093.37 816.88 981.48 1,188.69 1,395.25 1,631.27 1,885.44
South Africa 7,470.88 8,090.40 9,302.75 10,377.70 9,611.15 10,482.57 11,500.24 12,631.49 13,865.27
Tunisia 686.75 659.82 672.77 710.47 803.19 889.31 954.91 1,028.21 1,111.67
Bahrain 358.42 379.33 421.75 270.70 283.39 303.54 331.23 357.82 383.16
Iran 4,002.14 4,368.33 4,882.57 5,598.65 6,378.91 7,309.50 8,361.00 8,926.40 9,513.04
Israel 5,198.21 4,910.59 5,229.85 5,755.23 6,080.89 6,540.38 7,016.12 7,538.35 8,110.05
Jordan 419.36 465.87 523.55
Kuwait 516.86 519.66 610.55 647.92 681.99 704.39 719.95 754.66 796.90
Oman 444.20 516.91 545.46 638.93 695.24 744.38 793.67 840.49 884.42
Qatar 934.19 925.55 957.42 1,061.97 1,265.40 1,482.00 1,675.57 1,877.75 2,030.22
Saudi Arabia 2,757.09 3,633.38 4,116.15 5,537.44 6,068.88 6,632.95 7,285.05 7,960.92 8,635.79
UAE 4,251.33 4,565.28 4,887.68 5,330.30 5,831.97 6,274.66 6,802.77 7,406.17 8,036.47
e/f = BMI estimate/forecast. Source: BMI, national insurance regulators/associations
The insurance markets of SSA are not easily categorised. By far the largest market in the region is South
Africa. Decades of relative stability, a well developed financial system and a critical mass of households
and businesses that can afford to buy coverage for risks have meant South Africa’s non-life segment
shares many characteristics with its peers in developed countries – notwithstanding that claims and
damages resulting from motor accidents are much higher than they would be in Western Europe or North
America. Partly because of the peculiar capital structure of the largest South African financial services
groups, which is the consequence of isolation from global capital prior to 1990, South Africa’s non-life
segment is concentrated.
Most other countries in the region have non-life segments that look very different to those of South
Africa. Typically, non-life penetration is very low and the absolute number of people who actually use

Kenya Insurance Report Q1 2012
© Business Monitor International Ltd Page 16
non-life insurance is limited by poverty. In a minority of cases, insurance is rendered unavailable or
irrelevant because of longstanding economic or political turmoil. As is the case in much of the MENA
region, most national non-life markets in SSA are fragmented and are dominated by comparatively large
numbers of local companies, almost all of which lack scale by any standards other than those of their own
country. Unlike in the Middle East, major multinationals are largely absent from the region. This is
sometimes because of legal restrictions on foreign insurers and sometimes because the opportunities are
perceived as being too small. The main exception is Allianz, which has a presence in Francophone
countries that were previously served by its semi-autonomous French-based affiliate AGF, which has
since been rebranded as Allianz.
Kenya Non-Life Sector Update
Table: Breakdown Of Non-Life Premiums, 2008-2009 (KESmn)
2008 2009
Motor commercial 9,322.4 11,255.0
Personal accident 7,069.5 8,393.4
Motor private 6,102.7 7,306.8
Fire/industrial 4,322.7 4,419.0
Work Injury Benefits Act/employers’ liability 2,145.0 3,092.5
Theft 1,765.0 2,003.8
Marine 1,735.7 1,704.2
Miscellaneous 1,242.6 1,411.2
Engineering 1,274.4 1,317.4
Liability 918.1 940.8
Fire/domestic 672.1 785.0
Aviation 325.0 479.4
Source: AKI
Non-life penetration in Kenya is low in comparison with the developed world but compares favourably
with most of Africa. Kenya’s penetration in 2009 was 1.8%, whereas Egypt had just 0.4% and Nigeria
0.5%. However, South Africa had 2.6% penetration for the same period.
In April 2011, the AKI released its strategic plan for 2011-2015. The association hopes to work with key
stakeholders to promote the industry, with the result that premiums rise to KES200bn by 2015. The AKI
advocates: product simplification and innovation; activities to promote the image of the insurance sector;
customer education; modernisation of the Insurance Act; further market research; improvement in the
processes and systems of member companies. The AKI said that over the previous five years, the entire

Kenya Insurance Report Q1 2012
© Business Monitor International Ltd Page 17
industry had been growing by around 16% per annum. A continuation of this expansion would lead to
premiums of KES150bn in 2015. The AKI therefore must hope its initiatives will result in the generation
of an additional KES50bn in premiums that would otherwise not be written. As of December 2011, BMI
forecasts for non-life premiums of around KES112bn by 2015.
Looking back at the first 11 months of 2011, we suggest the main trend was the continuation of
innovation. The discussion of health insurance products later in this report explains how, over the last few
years, Kenyan insurers have developed innovative products, some of which can be described as micro-
insurance products. At the end of H111, APA Insurance said it had paid claims on an innovative index-
based weather insurance (IBWI) product that it had developed in conjunction with the World Bank, the
UK’s Department for International Development, the Rockefeller Foundation, the Financial Sector
Deepening Trust and the Kenyan Meteorological Office. The product covers farmers for the loss of crops
as a result of bad weather. As a result, it is much easier for them to access funds from specialist lenders
such as the Agriculture Finance Corporation of Kenya or from other sources. APA also launched an
innovative comprehensive motor cover product. It includes cover for hospitalisation in case of accident
and income loss. Premiums can be paid monthly and through electronic platforms such as M-PESA,
Airtel Money and PesaPoint.
Takaful Insurance of Africa, the country’s first fully fledged takaful operator began operations in
February 2011 and offers a wide variety of general takaful products.

Kenya Insurance Report Q1 2012
© Business Monitor International Ltd Page 18
Non-Life Industry Forecast Scenario
Table: Non-Life Premiums, 2009-2016
2009 2010 2011e 2012f 2013f 2014f 2015f 2016f
Total non-life premiums, KESmn 43,110 52,350 56,529 70,875 83,459 97,292 112,178 128,407
Total non-life premiums, KES, % change y-o-y 16.8 21.4 8.0 25.4 17.8 16.6 15.3 14.5
Total non-life premiums, KES per capita 1,092 1,292 1,359 1,658 1,900 2,156 2,421 2,700
Total non-life premiums, % of GDP 1.8 2.1 2.0 2.0 2.0 2.0 2.0 2.0
Total non-life premiums, % of total premiums 66.9 66.2 62.6 65.5 65.4 65.5 65.6 65.7
Total non-life premiums, US$mn 558 661 628 810 912 1,030 1,151 1,278
Total non-life premiums, US$, % change y-o-y 5.4 18.3 -4.9 29.0 12.6 12.9 11.8 11.1
Total non-life premiums, US$ per capita 14 16 15 19 21 23 25 27
Total non-life premiums, EURmn 399 498 439 587 702 824 920 1,022
Total non-life premiums, EUR, % change y-o-y 10.7 24.9 -11.8 33.6 19.5 17.4 11.8 11.1
Total non-life premiums, EUR per capita 10 12 11 14 16 18 20 21
e/f = BMI estimate/forecast. Source: IRA, AKI
According to the AKI, non-life premiums rose from KES43,110mn in 2009 to KES52,350mn in 2010.
This outcome reinforces a trend of fairly steady increases in non-life penetration that has been in place
since 2005, if not before. Given that a non-life penetration rate of just under 2% of GDP is high for a
country of Kenya’s per capita GDP, we suggest this outcome highlights the resilience and, in terms of the
development of new products, inventiveness of Kenya’s non-life segment.
Predicting how non-life penetration develops from what appears to be quite a high level is problematic.
For the time being, we assume non-life penetration will remain broadly unchanged. In the fragmented

Kenya Insurance Report Q1 2012
© Business Monitor International Ltd Page 19
Kenyan non-life market, it is more likely that pricing pressures will be downwards rather than upwards.
However, premiums should grow as a result of the promotion of micro-insurance, the development of
takaful and product innovation.
Growth Drivers And Risk Management Projections
Macroeconomic Outlook
Developments in the financial market are of great concern to insurers who are susceptible to risk from the
rest of the financial sector. The exposure of insurers to the risks of economy fluctuation – where
sensitivities include exchange rates, inflation and interest rates – is manifested in two ways: asset value
and subsequent capital base and solvency levels, and commercial product and premium development.
Insurers are major asset managers and as they are exposed to recession, they are also naturally likely to
benefit from recovery. Historic data and forecasts illustrate economic trends via labour market and
macroeconomic indicators which can highlight areas of growth returns and limitation, as well as
contextualised market potential for line diversification. Income protection insurance may well see a rise in
demand.
Economic Growth To Ride Out The Storm
BMI View: Although the Kenyan economy will be adversely affected by the subdued outlook for
European demand, we believe brighter prospects in regional trade partners, combined with improving
domestic economic conditions, should see the economy expand by 5.0% in 2012, up from an estimated
4.1% in 2011. Major risks come from the weather and the approach of elections scheduled for the second
half of the year.
After slowing to an estimated 4.1% in 2011, we expect that Kenyan real GDP growth will rebound to
5.0% in 2012. We believe that the year will be characterised by improving domestic and regional
economic conditions, which will help to bolster growth in the face of deteriorating demand from
international trade partners, particularly in Europe.
The major risk to the economy emanates from the weather as poor rains would not only disrupt output in
the important agriculture industry, but also keep inflation high and the currency weak, having a negative
impact on non-agricultural segments of the economy. Political risk should also not be underestimated.
Elections are scheduled to be held in August 2012, although there is a campaign to have these delayed
until December, and there are concerns that there could be a repeat of the violence seen following the
presidential election in 2007
European Concerns
The latest growth data available from the National Bureau of Statistics (NBS) show the economy grew by
4.1% year-on-year (y-o-y) in the second quarter of 2011, down from 4.8% in Q111.

Kenya Insurance Report Q1 2012
© Business Monitor International Ltd Page 20
Looking at a breakdown of the figures, the agricultural sector, which accounts for about 20% of the
economy, was major driver, expanding by 5.2%, with horticulture the primary engine of this growth. We
doubt horticulture will continue to have such a positive impact on agricultural and headline growth. Much
of Kenya’s horticulture produce is exported to the eurozone and the UK. BMI’s Europe team has
downwardly revised 2012 real GDP growth to 1.2% in the EU and 1.6% in the UK, from 1.7% and 2.2%
previously. Most of Kenya’s tourists come from Europe so we also expect a slowdown in the important
tourism sector in 2012.
Light At The End Of The Tunnel
While the bearish outlook for European demand raises questions about certain segments of the Kenyan
economy, we expect that improving domestic and regional dynamics should help to offset this. Kenya’s
main trading partner is Uganda, which absorbs about 14% of exports, while Tanzania accounts for just
over 8%. The East African Community (EAC), which also includes Burundi, Rwanda, Tanzania and
Uganda, accounts for over a quarter of Kenyan exports. We are generally upbeat about the prospects for
EAC economies in 2012, with Uganda and Tanzania expected to grow by 8.8% and 6.5% respectively.
This should support demand for manufactured goods in particular.
In addition to an upbeat outlook for regional economies, we believe domestic economic conditions should
gradually improve from the start of 2012. In particular, we expect inflation, which surged to 17.3% in
September 2011 from a cyclical low of 3.1% in October 2010, topped out in the final months of 2011 and
will head lower during of 2012. There are several considerations underpinning our belief that inflation is
close to topping out, including base effects, improving weather and much anticipated decisive action on
by the Kenyan monetary authorities (see our online service, October 6 2011, ‘Long-Awaited Aggressive
Monetary Tightening Is Here’).
Improving weather and the onset of monetary tightening should also provide support to the Kenyan
shilling, which was hammered in 2011 by a perfect storm of adverse trade account dynamics, global risk
aversion and an inadequate policy response. Falling inflation and stabilisation of the currency, if not
recovery, will improve the environment for domestic producers and consumers and should mean domestic
demand slowly regains momentum.
Risks To Outlook
The major risk to our outlook comes from the weather. Meteorologists have warned that there is a strong
possibility that La Niña will reoccur in 2012 and this could lead to a resumption of the drought that has
been a major factor in rising inflation and a weakening currency. Another risk comes from the health of
the global economy. Our forecasts for Kenya already take into account near-stagnation in Europe and the
US and a relatively sharp slowdown in Chinese growth. However, if things turn out to be worse in China,
the US or Europe than we anticipate, our current growth forecasts for Kenya would be overly optimistic.
On the other hand, if the global economy stages a miraculous recovery, our expectations for Kenya could
turn out to be too pessimistic.

Kenya Insurance Report Q1 2012
© Business Monitor International Ltd Page 21
Risks to our economic forecasts also emanate from the domestic political scene. The new constitution
requires that a vote be held on the third Tuesday of August 2012. Some members of the government argue
that a vote in August is not practical given the logistical challenges and they want to have the vote
delayed to December. Added to the uncertainty about timing, there are fears that there could be a repeat
of violence seen at the last election. Thrown into the mix is the fact that several leading politicians are on
trial in The Hague for their alleged roles in the violence that followed the 2007 polls, adding further
reason to believe political tensions could boil over and hamper domestic and international confidence in
the Kenyan economy.
Table: Kenya Economic Activity, 2001-2016
2011e 2012f 2013f 2014f 2015f 2016f
Nominal GDP, KESbn 1 2,998.2 3,670.5 4,338.0 5,040.8 5,787.7 6,594.3
Nominal GDP, US$ bn 2 33.3 39.7 48.2 56.0 64.3 73.3
Nominal GDP Growth, % change y-o-y 1 4.1 5.0 5.9 5.8 5.6 5.3
GDP per capita, US$ 2 801 928 1,097 1,241 1,388 1,541
Population, mn 3 41.6 42.7 43.9 45.1 46.3 47.6
e/f = BMI estimate/forecast. Source: 1 Central Bank of Kenya, 2 Central Bank of Kenya/BMI, 3 World Bank/BMI
Political Stability Outlook
The unprecedented instability in the MENA region during 2011 is likely to signal a change in pricing and
appetite for political risk and terrorism insurance, business interruption insurance and other related lines
on a global scale.
As perceived need for asset and property protection is likely to increase not only domestically, but also
amongst the international commercial and industrial communities; this presents a new challenge and
opportunity for insurers to address: not only to satisfy the increased demand for coverage with improved
and tailored products; but also for improved risk premium calculation to ensure profitable underwriting.
BMI’s security risk ratings and political stability outlook provide a guide to country specific and regional
threats, highlighting both potential opportunities and liabilities for the (re) einsurance community.
Political Risks On The Rise
BMI View: Rising prices, the implementation of the new constitution and the trials of key politicians at
the International Criminal Court (ICC) all pose risks to Kenya’s political stability. However, we maintain
our view that the biggest challenge comes from the approach of elections in 2012.

Kenya Insurance Report Q1 2012
© Business Monitor International Ltd Page 22
We have previously written about the major political challenges facing Kenya (see ‘Assessing The
Medium Term Political Risks’, July 5 2011). The major ones are rising prices, the slow implementation of
the new constitution, the ICC trials of several influential politicians and the elections scheduled for
August 2012. Here, we provide updates on the latest developments in relation to all of these issues and
seek to assess whether the threat has grown, receded or is unchanged since July 2011.
Inflation Still On The Up, But Maize Prices Falling
With respect to prices, headline inflation has continued to move higher, coming in at 16.7% y-o-y in
August 2011, up from a cyclical low of 3.2% in October 2010. The main drivers of rising headline price
growth have been food and fuel, which constitute 36% and 18% of the consumer price basket
respectively. There is a contrasting outlook for these two components. Encouragingly, following
improved rains in the latter part of the long rains season, food production and prices have begun to
improve. Prices of the staple maize in the main urban centres have been decreasing since July 2011. The
bulk of the long rains harvest should reach the market in November 2011, auguring for further food price
declines.
The outlook for fuel prices is less encouraging. Although global oil prices have moderated in recent
weeks (Brent crude was trading at US$106 a barrel (bbl) on September 28 2011, down from US$127/bbl
in April), the abysmal performance of the Kenyan currency means oil prices in shilling terms are far
higher than they were when oil peaked at US$145/bbl back in 2008. The monetary authorities have been
unable and at times seemed unwilling to enact policies to support the currency. Until there are signs that
the Central Bank of Kenya (CBK) is committed to supporting the beleaguered shilling, we believe
imported inflation will continue to exert upward pressure in the cost of living.
Although Kenya has so far avoided the cost of living-inspired popular protests experienced by neighbours
Tanzania and Uganda, we believe the threat is growing. Although a continuation of the fall in staple food
prices will help to ease tensions, this will be counteracted by poor policy decisions. Apart from the
aforementioned monetary policy failures, the introduction of ill-conceived regulations allowing the
government to cap the prices of essential commodities is only likely to lead to shortages, which will
exacerbate the tension from rising prices.
Political Risk Threat Level: High and rising.
Constitution Implementation
The passing of laws necessary to implement the new document has been a slow process. There are
encouraging signs, such as the agreement on the appointment of a new chief justice, that the rival factions
of President Mwai Kibaki and Prime Minister Raila Odinga are starting to work together and this bodes
well for the process to continue. However, there have been setbacks. One of the central objectives of the
new body of laws, the fight against corruption, appeared to suffer a blow when the controversial head of
the anti-corruption agency, Patrick Lumumba, was removed from his post by parliamentary consensus.

Kenya Insurance Report Q1 2012
© Business Monitor International Ltd Page 23
Lumumba’s fiery rhetoric against allegedly corrupt officials was seen by some as a diversion from getting
the job done and this seems to be the justification for his removal. However, critics of his sacking argue
that his bold oration was an indication that he was willing to take on the political elite and his removal
was really about politicians protecting themselves.
Political Risk Threat Level: Moderate and stable.
ICC Trials
The pre-trial hearings of the people accused of organising and encouraging post-election violence in 2008
started in The Hague in September 2011 after the Kenyan government failed in its attempt to have the
process suspended and replaced by domestic arbitration. Broadly, Kenyans appear in favour of the trials
being handled internationally so the process does not present real risks to stability. Furthermore, we have
argued in the past that because the suspects are from across Kenya’s political and ethnic spectrum, there
has been little risk that the process would fan ethnic or political tension due to perceptions that one group
had been singled out. However, all of this could change when verdicts are reached. If some of the
suspects are found guilty while others are set free, that would risk fanning tensions, especially if the
guilty/innocent outcome is split along political or ethnic lines. Guilty verdicts would also test the
authorities’ commitment to cooperate with the ICC as it would require Kenya, as a signatory of the Rome
Treaty, to make arrests.
Political Risk Threat Level: Moderate-high and rising.
Elections Are Still Key
Topping the list of threats to Kenya’s political stability is the next election. For one thing, there is a lack
of consensus on when the vote will actually take place. Some MPs argue that this should happen exactly
five years after they were sworn in January 2008, as opposed to the constitutional requirement to hold an
election every five years that would mean that elections would have to take place before the end of 2012.
Many of the issues outlined above are underpinned by electoral motivations. Price controls, for example,
are seen as a means of gaining short-term favour ahead of the vote. Also, much of the controversy
surrounding the ICC trials emanates from the fact that two of the men, William Ruto and Uhuru Kenyatta,
plan to run in the 2012 elections.
As we have highlighted previously, the attempt to move the trials to Kenya was seen by some as an effort
to protect potential presidential candidates who may have damaged reputations or be prevented from
running at all by the ICC process (see ‘Political Tensions To Arise As Elections Approach’, February 24
2011). Much will depend on yet-to-be-agreed alliances (see ‘Presidential Jostling Begins’, August 25
2011). The formation of these coalitions will involve horse trading and posturing, which is likely to raise
tensions further. At this early stage, opinion polls suggest that Odinga is favourite to win and we concur
that the balance looks to be tipped in his favour. However, with so many variables and the negative
precedent set by the violence in 2007, this could easily change.

Kenya Insurance Report Q1 2012
© Business Monitor International Ltd Page 24
Political Risk Threat Level: High and rising.
Healthcare
Private health insurance is a key area of growth for the industry due to universal demand and need for
coverage. Economic developments have a major impact upon the provision of healthcare and the
availability of health insurance. Hospitalisation remains a major cause of indebtedness across all socio-
economic sectors of society where a robust public health insurance system is not in place, therefore
perceived need is also very much on the rise.
As the cost of healthcare rises, so does the need for coverage. Mapping the progress of public healthcare
developments is a vital indicator for the private health insurance sector as emerging, frontier and
developed markets each have their own growth opportunities and risk management rationale.
The Ministry of Health operates approximately 50% of health facilities, with the remainder run by the
private sector, missionary organisations or the Ministry of Local Government. Rural health centres were
to be given greater autonomy in 2008-2009, with direct funding and greater community involvement in
rural healthcare provision.
The quality of healthcare infrastructure suffers major disparities between regions. Only 30% of the rural
population have access to health facilities within 4km of their home, compared with 70% of the urban
population. Residents of the capital, Nairobi, visit hospitals an average of 17.7 times a year, whereas in
coastal provinces, the average is just 7.8 visits a year. This regional disparity is unsurprising given the
uneven distribution of health infrastructure. It is estimated that 25% of households live more than 8km
from any form of health facility, while drug allocation favours larger hospitals. District hospitals are
allocated 38% of the Ministry of Health’s drug procurement budget, provincial hospitals 18% and rural
health facilities 18%. The drug procurement budget itself was only 10.5% of the Ministry of Health’s
total budget for 2005-2006.
Meanwhile, the Kenya National Health Accounts survey, conducted in 2002, found that those in the
poorer income quartiles are more than twice as likely to seek healthcare when ill. The public health
insurance consultation also revealed that those from the lowest social groups made the highest number of
visits to hospitals (an average of 16 a year) but spent the least on healthcare, at just KES1,637 (US$26.60)
a year. This can be explained by the fact that those in low income groups tend to have the poorest health,
but can afford to devote little to treatment, meaning that they are less likely to cure the underlying cause
of their ill health and simply treat symptoms. In contrast, the highest income groups made the fewest
hospital visits (an average of 9.6 a year).
In September 2008, The Nation reported that the Kenya Medical Association (KMA) was worried about
the pace at which the government was moving to act on the problems being faced by the public hospitals.
Kenya Insurance Report Q1 2012
© Business Monitor International Ltd Page 25
The KMA added that immediate steps need to be taken to improve the service delivery in public
healthcare institutions and to provide adequate access to care.
On a positive note, in June 2009, it was revealed that the Kenyan government plans to construct a state-
of-the-art health facility in the country in order to reduce the burden associated with the country’s citizens
seeking treatment abroad. Odinga suggested that the funds for such an institution could easily be realized
via public-private partnership arrangement.
Furthermore, in June 2010, it was revealed that 3,000 nurses have been hired as part of a public healthcare
reform programme (part of the Economic Stimulus Programme) in Kenya, expected to cost KES4bn
(US$48mn). Under the stimulus programme, the ministry of health has been authorised to recruit 4,200
nurses, 20 for each of the 210 constituencies. According to the Ministry of Public Health and Sanitation,
the hiring of an additional 700 nurses has been delayed due to issues with applicants’ academic and
identity documents.
BMI welcomes the employment drive. Like many other African countries, Kenya suffers from inadequate
numbers of healthcare workers, especially in less accessible areas. Kenya currently has around 5,000
doctors, which equates to around one doctor per 6,000 people. Additionally, in October 2009, the
National Nurses Association said that Kenya lags behind the recommended ratio of one nurse per
thousand patients and requires about 24,000 nurses to tackle the shortage.
At present levels, SSA accounts for only 3% of the world’s medical workforce, yet has the highest rates
of HIV/AIDS infection in the world, with some 24.5mn registered cases. Over the years, Kenya has
experienced a brain drain of health workers due to poor pay and poor working conditions, many ending
up in western countries. BMI has believed for some time that while the UK has introduced new laws that
could slow the reported ‘brain drain’ of medical workers from SSA, the Kenyan government also needs to
address the situation. Under the legislation, the UK will grant work permits for foreign nurses only if no
British or EU candidates can be found.
We are therefore positive over the government’s recognition of the fact that in order to provide the
country’s citizens with sufficient care, it needs to hire more staff as well as incentivise medical workers to
work locally. According to the Human Resource Development Sector Report 2010, the new programme
will create 24,000 jobs for health professionals and the government aims to provide doctors, nurses,
medical lab technologists and community health workers with incentives similar to those in the private
sector to enhance morale, productivity and staff retention rates.
In addition to monetary incentives, schemes such as the Health Professionals of the Year Awards, a
nationwide excellence award scheme that recognises various categories of healthcare professionals in the
country, are part of the Human Resources for Health Strategic Plan for 2009-2012 which is looking for
ways to retain health workers.

Kenya Insurance Report Q1 2012
© Business Monitor International Ltd Page 26
Health Insurance
It is our view that the increasing cost of medical care in Kenya has forced health insurance companies
operating in the country to alter their business models to maintain revenues. In addition to pushing up
insurance premiums, health insurance providers are increasingly focusing on the micro-insurance sector
to create a new income stream. Additionally, there are increasing partnerships between companies in
order to provide low cost services.
In September 2010, it was revealed that over a period of three years, medical costs in Kenya had risen at
an average rate of 20% per annum, with the increase attributed to a steep rise in doctors’ fees after the
pricing guidelines developed by the Medical Practitioners and Dentists Board collapsed. Consultation fees
for general practitioners stood at KES1,200 (US$14.823), up from KES900 (US$11.12) in 2009. Fees for
specialists such as gynaecologists, dentists and oncologists were between KES2,000 (US$24.71) and
KES3,000 (US$37.06), up from KES1,500 (US$18.53) in 2009.
In 2011, hit by rising inflation and the increase in the price of medicines and medical devices, the
majority of which are imported, and the subsequent increase in the cost of operations, Kenya’s top
hospitals raised bed and consultation charges. This translates into a 10-40% increase in charges in the last
four months of the year.
According to the Association of Kenya Insurers, only five out of the 16 medical insurance providers in
Kenya made an underwriting profit in 2009, with the loss reaching KES235.8mn (US$3.1mn).
Highlighting continuing operational challenges, the association’s report for 2010 said the medical
insurance sector had the highest loss ratio in the industry of 81.5%. Net earned premiums reached
KES5.9bn (US$74.5mn) and net incurred claims reached KES4.8bn (US$60.6mn). It was followed by
private motor insurance at 74.9% and commercial motor insurance at 58.8%. The loss ratio is the ratio of
what an insurance company pays in benefits and associated expenses (such as adjustments) against what
is collected in premiums, expressed as a percentage.
Referring to the inflationary climate in 2011, Peter Nduati, chief executive of insurance provider
Resolution Health East Africa, said: ‘We are being hit by costs of diagnostic procedures and medicines
that have increased by 40% and 30%. Medical insurance premiums are bound to go up on renewal and
we, in the mean time, expect very high loss ratios for insurers.’ Insurance companies that have been
forced to bear the immediate costs in healthcare have said the cost of health premiums could rise by up to
22%, in line with the pace at which the cost of medical services is rising.
The increase in healthcare costs has forced companies to hike up insurance premiums to maintain
revenues. Firms have also introduced co-payment systems, which require patients to pay for a portion of
their treatment costs.

Kenya Insurance Report Q1 2012
© Business Monitor International Ltd Page 27
Historically, companies have targeted the middle and upper classes who could afford to pay for their
premiums. However, the rising consultation fees, payments for laboratory tests and for drugs have left
many citizens unable to pay the regular and mandatory monthly premiums. In order to retain customers as
well as increase subscription rates, another way in which health insurance companies have tackled the rise
in medical costs is the launch of the more affordable micro-insurance products.
BMI commends this strategy as it is clear that a large proportion of Kenya’s population has extremely
low spending power. In 2009, the poorest 20% of the population’s per-capita spending amounted to
US$166 while the middle 60% amounted to US$486. BMI also believes that while micro-insurance
products are more affordable, their uptake may still be slow. However, with the country’s economy
expected to grow and incomes expected to rise, per-capita spending is also forecast to rise, increasing
demand.
Examples Of Micro-Insurance Products In Kenya’s Health Sector
In August 2008, a micro-insurance package expected to cover around 1mn Kenyans was launched. The
scheme is administered by the Cooperative Insurance Company of Kenya (CIC) and non-governmatal
organisation the Swedish Cooperative Centre. It is being run as a pilot project in Kenya with a view to
expanding to other African countries.
In February 2009, the Kenya Women Finance Trust, the CIC and the National Health Insurance Fund
launched a medical insurance cover, Afya Card, which costs as little as KES10 (US$0.12) a day or
KES3,600 (US$45) a year. The insurance policy underwrites all inpatient expenses for a member’s entire
family, with no exclusion clauses for chronic illnesses and maternity, and also covers surgery costs above
KES15,000 (US$188). The policy restricts payment to expenses incurred in appointed private, public and
mission hospitals for up to 180 days. The premiums are seen as affordable, with most group healthcare
plans covering up to four members of a family averaging between KES750 (US$9) and KES1,000
(US$13) per month.
Simultaneously, a second affordable insurance product, Safari Bima, was launched by Kenya Orient
Insurance. The product allows Kenyans to access personal insurance cover for KES30 (US$0.38) a day.
The personal insurance covers a maximum of KES100,000 (US$1,235) in compensation for injuries
sustained in any accident within 24 hours of payment. Policy holders are required to submit the daily
KES30 (US$0.38) premium when they need the cover through a short messaging service on their mobile
phones.
CFC Life Assurance has also launched a life insurance product, Life Vest. For a minimum of KES2,500
(US$31) a month, an individual can qualify for a compulsory fixed life cover benefit of at least
KES100,000 (US$1,235) and savings benefits, with no strict underwriting or medical examinations. The
Life Vest product is different from other products in Kenya as it provides consumers with the opportunity
to obtain life insurance as well as acting as a savings vehicle to aid financial planning. The new product

Kenya Insurance Report Q1 2012
© Business Monitor International Ltd Page 28
now has two variants, one targeted at middle- and upper-income consumers and the other at lower-income
consumers. Consumers have the choice of investing in low-, medium- and high-risk options which
include money market, balanced and equity funds.
Launched in 2010, the newest product on the Kenyan market is Changamka, a micro-health cover
launched by Changamka Micro-Health. Changamka allows members to receive treatment at designated
hospitals for as little as KES450 (US$5.56) per visit and uses pre-paid smart card technology to allow its
members to access treatment at designated medical outlets. In addition, the Changamka cards can be used
by any member of a family and can be bought for third-party beneficiaries such as parents. The use of the
smart card technology eliminates paperwork, which would otherwise generate additional costs.
In 2010, Eagle Africa Insurance Brokers rolled out Afya Milele, an inpatient and outpatient cover
costing KES35 (US$0.43) per day. The cover takes care of maternity costs, doctors’ fees, daily hospital
charges and drug prescriptions. Eagle Africa allows the members to make payments easily through
mobile money transfer services.
A third way in which insurance companies have dealt with rising healthcare costs is to form partnerships
with other insurance companies and social welfare groups to lower overall costs and increase subscription
rates. For example, the partnership between Changamka Micro-Health and Pumwani Maternity Hospital
has lowered the overall cost of delivery, with expectant mothers paying KES3,000 (US$37.06) – one of
the lowest child delivery charges in Nairobi.
In the meantime, a July 2008 report by local newspaper Business Daily said Kenyan health management
organisations identified collusion between medical personnel and policyholders as the chief cause of
medical insurance fraud. According to insurance industry estimates, about a third of all medical claims
paid in Kenya in 2006 were fraudulent, raising questions over the viability of the expanded coverage.
Epidemiology
Studying health and illness at the population level is key to highlighting regional and demographic
vulnerabilities, opportunities and liabilities in the health insurance sector. Urbanisation, growth in real
incomes and the increased prevalence of lifestyle diseases are all factors that are expected to contribute
strongly to the demand for healthcare and health insurance in the next decade.
BMI’s Burdern of Disease Database (BoDD) records the number of disability-adjusted life years
(DALYs) lost as a result of having or having had a disease. Therefore, our measure of DALYs is a
measure of lost productivity. According to the BoDD the number of DALYs lost to all disease in Kenya is
to increase from 12,823,021 in 2009 to 16,900,141 in 2030. Additionally, according to the BoDD, the
number of DALYs lost to communicable diseases will increase from 9,013,730 in 2009 to 10,888,077 by

Kenya Insurance Report Q1 2012
© Business Monitor International Ltd Page 29
2030. The number of DALYs lost to non-communicable diseases will rise from 2,550,604 in 2009 to
4,116,757 by 2030.
HIV/AIDS
Despite significant disagreement over the number of Kenyans infected by the HIV virus, data from
international agencies and the Kenyan government points to HIV/AIDS being the country’s most pressing
health concern. The UN Development Programme (UNDP) claimed that 16% of adults in Kenya were
infected with HIV in 2006. Meanwhile, the Joint UN Programme on HIV/AIDS (UNAIDS) suggests only
6.1% of adults were infected in 2005.
In 1999, former president Daniel Arap Moi declared HIV/AIDS a national disaster. Since then, the death
toll from HIV/AIDS has continued to rise, overtaking malaria and tuberculosis. HIV/AIDS is one of the
key reasons behind a decline in life expectancy of about 10 years from its peak. That said, the latest
indicators from the UN suggest life expectancy at birth rose to 54 years in 2007, up from 53 years in
2006. It was revealed in February 2009 that the country spends more than KES5bn (US$63mn) on ARVs
annually, the vast majority of which are sourced from China and India.
In a bid to diagnose cases of HIV
early, the Kenyan government is
to launch a house-to-house testing
service. The project is estimated
to cost US$5mn and some funding
is to be provided by the US
government. Henry Chang, vice
president of Impact Initiatives,
said: ‘by offering testing in
individual homes, we are more
likely to diagnose early disease
and provide care that is at once
less expensive and more effective
at keeping those who are HIV
positive from progressing to
advanced disease and death.’ In
December 2009, it was revealed that the US foreign aid programme devoted to single disease, the
president’s Emergency Plan for AIDS Relief, committed US$2.7bn to help fight HIV infection in Kenya.
The money, to be provided over a period of five years, represents a 112% increase in funding for the
program in Kenya and will be used to care for more than 555,000 orphans and vulnerable children as well
as help to manage related co-infections such as tuberculosis.
Burden Of Disease Projection
2005-2030
f = forecast. Source: BMI’s BoDD

Kenya Insurance Report Q1 2012
© Business Monitor International Ltd Page 30
In July 2011, it was revealed that the Kenyan government has assigned KES64bn (US$715.48mn) to the
implementation of its health service plan, according to Finance Minister Uhuru Kenyatta. Of this total,
KES903mn (US$10.1mn) will be directed towards the purchase of anti-retroviral drugs to ensure the
availability of medication for people suffering with HIV.
Tuberculosis
There has been notable success in the treatment of tuberculosis (TB) in Kenya. Following the adoption of
the Directly Observed Treatment Short-Course (DOTS) into national health policy, the treatment’s
success rate had improved by around 80% during 2003. In March 2009, the Karel Styblo Award was
presented to Public Health and Sanitation Permanent Secretary Mark Bor in Nairobi, for Kenya’s efforts
in fighting and controlling the spread of TB. Bor said that the award was in recognition of Kenya’s
achievement of the WHO’s target of TB case detection rate of 70% and treatment success rate of 85%.
However, TB still remains a burden to the country’s healthcare system. Kenya ranks number 13 out of the
22 TB high-burden countries in the world. There were 116,732 new TB cases reported in 2008, of which
12,839 were in children.
In September 2009, it was reported that there were approximately 401 cases of multiple drug resistant-
TB between May 2003 and May 2009. Only three health centres in the country have wards that are able to
treat patients with MDR-TB, however, the government aims to equip each provincial hospital with the
facilities to treat drug resistant patients.
Malaria
Efforts to reduce the burden of malaria received a boost in November 2008. According to a paper
published in The Lancet, a dramatic drop in the prevalence of the disease resulted from the replacement
of chloroquine with sulfadoxine-pyrimethamine in treatment regimes. Other interventions including the
use of insecticide-treated bednets and artemisinin-based therapies could have contributed, researchers
said, but the surge in their use came after the steep fall in transmission of the disease.
In March 2009, it was revealed that low-income Kenyans may be able to access the most effective
malaria drugs at KES70 per dose, down from KES500, before the end of the year. The medicines will be
provided under a highly subsidised programme that aims to ensure anti-malarial drugs are available at all
private pharmacies as well as local kiosks. Although the new artemisinin combination therapies are
already available without a charge at public health institutions, their intake has been low as their
availability has been affected by constant distributions in the supply chain.
As a result, Beth Mugo, Minister of Public Health and Sanitation, called for a meeting between the
pharmaceutical industry and medical products distributors to discuss the modalities. It was expected that
Mugo would have a difficult time convincing commercial distributors to come on board, mainly because
of the government’s poor payment record.

Kenya Insurance Report Q1 2012
© Business Monitor International Ltd Page 31
Furthermore, in April 2009, it was revealed that an international partnership (backed by the UN) called
The Affordable Medicines Facility has been launched to ensure the poor have access to malaria drugs.
Prices of ACTs will be reduced from US$6-10 (KES463-KES771) to US$0.20-0.50. (KES15-KES39)
The programme was developed through Roll-Back Malaria -- a partnership of public and private
organisations that include the Global Fund, the World Bank, the UN Children’s Fund, the Dutch
government, the Bill and Melinda Gates Foundation and the Clinton Foundation. The scheme will be
offered to a number of countries in Africa including Kenya.
In July 2009, it was revealed that despite efforts being made to ensure access to ACTs, just about a third
of patients seeking malaria treatment in the country were being provided with the recommended
medicines, while some people were still being treated with drugs like chloroquine, which were phased out
almost a decade prior. Additionally, it has been reported that at least 61% of Kenyan children do not sleep
under insecticide treated nets, which are recommended for preventing malaria. BMI believes this
highlights the need to raise awareness among the country’s citizens as to which drugs are appropriate and
how the disease can be prevented.
On a positive note, in October 2009, the US government announced a KES200mn grant towards
eradicating malaria in Kenya, which will be channelled through Health Right International (HRI) and
Merlin. HealthRight International will implement a three-year US$1.5mn malaria programme targeting
more than 200,000 children and pregnant women in the North Rift, while Merlin, with a three-year grant
totalling KES112mn will execute a malaria prevention and treatment programme targeting an estimated
220,000 children below five years of age and pregnant women in five malaria epidemic-prone districts of
Nyanza Province.
Both programmes will consist of community education and training activities which will promote
prevention and care-seeking behaviours by strengthening community access to quality malaria prevention
and treatment services. HRI will also build 21 target facilities and five District Health Management
Teams to deliver appropriate prevention, diagnosis, and treatment services and distribute long-lasting
insecticide treated nets. Additionally, Merlin will work with the Ministry of Health and other health
providers to increase community awareness and knowledge on malaria prevention, treatment and
management. The project will promote correct and consistent use of insecticide treatment nets as well as
increase access to intermittent preventive treatment among pregnant women.
Polio
In February 2009, the Kenyan Health Ministry issued a polio alert after a rare case of the disease was
confirmed in a young girl in northern Kenya. It is thought the infection had spread to the country from
neighbouring Sudan where cases of polio had been seen.
Many Kenyan children have not been vaccinated against polio due to the political violence that broke out
in early 2008 following a disputed election. The unrest left more than 1,000 people dead and 600,000
Kenya Insurance Report Q1 2012
© Business Monitor International Ltd Page 32
people displaced from their homes. This had a negative effect on the country’s polio immunisation
campaign, declining from 100% coverage down to 60% coverage. This is far below the 80% coverage
recommended by the WHO.
Shanaz Shariff, director of public health at the Kenyan health ministry, said the government was planning
to conduct an immunisation campaign in northern Kenya immediately, targeting all children under the age
of five. The project is expected to cost KES5mn (US$63,000) and aims to immunise 96,000 children.
Kenya has faced a vaccine shortage since early 2008 and it is reported the country will get doses of the
vaccine from the World Health Organization (WHO), which has stocks in the Democratic Republic of
Congo. WHO Kenya representative David Okello said the outbreak was a major setback as the WHO,
which was planning to certify Kenya as ‘polio free’ within two years, could no longer do so. The key to
stopping polio in its tracks is a comprehensive, coordinated vaccination campaign and cross-border
planning. To this end, Kenya will be working in collaboration with Sudan, Ethiopia and Uganda.
In May 2009, the government launched a door-to-door polio vaccination campaign in parts of Nairobi,
central and Rift Valley provinces. The first round targeted approximately 2mn children under the age of
five. A total of three rounds of vaccinations had taken place by the end of May 2009. Additionally, the
Ministry of Public Health and Sanitation in Kenya began a door-to-door anti-polio vaccination campaign
on June 4 2011. The programme is aimed at vaccinating 1.2mn children at a cost of approximately
KES62mn (US$713.46mn), according to ministry director Shariff Shaanaz. Shaanaz has asked parents of
children under the age of five years to ensure their vaccination. The programme will cover children in 22
high-risk districts in the Nyanza, Western and Rift Valley provinces.
Pneumonia
According to a study published by the WHO in September 2009, Kenya has one of the 10 highest
proportions of childhood pneumonia in the world, killing approximately 30,000 Kenyan children
annually. In areas where malaria is not endemic, pneumonia is the leading killer of children under the age
of five, while it comes second in malaria-endemic areas. The high prevalence of the disease is attributed
to a lack of pneumonia vaccines, a high prevalence of HIV, poor access to medical care and the large
number of undiagnosed and untreated cases of sickle cell anaemia.
BMI therefore welcomed the statement from the national head of immunisation, Dr Tatu Kamau, that by
2010 a pneumonia vaccine would be made available in all public hospitals at no cost. The vaccine is
currently available in the private sector for KES12,000; a price that we consider to be unaffordable for the
majority of the country’s population.
In September 2009, it was revealed that a measles immunisation campaign for children aged below five
years old would be extended after the seven-day emergency KES135mn (US$1.8mn) campaign failed to
provide the intended coverage. The driver of the vaccination campaign was a measles outbreak in the
North Eastern and Rift Valley. BMI welcomes the government’s focus on and investment in containing

Kenya Insurance Report Q1 2012
© Business Monitor International Ltd Page 33
the disease, as no vaccination programmes have been carried out since 2006, when 120 children died due
to the disease. According to government statistics, approximately 1.3mn children are yet to be vaccinated
despite the 2006 immunisation drive.
In February 2011, UK-based GlaxoSmithKline (GSK) announced the incorporation of its pneumococcal
vaccine Synflorix, which protects against 10 strains of the pneumococcus bacteria responsible for most
pneumococcal disease in Kenya and worldwide, into the Kenyan national immunisation programme.
Kenya is the first African country to receive pneumococcal vaccines thanks to the Advance Market
Commitment (AMC), which aims to bring heavily discounted vaccines to children in the world’s poorest
countries. Jean Stephenne, chair and president of GSK Biologicals, said: ‘The architects of the AMC have
delivered on their promise to accelerate access to vaccines for children living in the world’s poorest
countries. Their vision, Kenya’s leadership and the willingness of donors to realise this commitment have
resulted in a genuine breakthrough to global public health.’
Cancer
In February 2009, it was reported that health experts at Nairobi’s Kenyatta National Hospital were
concerned by the increasing number of cancer deaths among the citizens of Kenya. The last recorded
figures showed that 18,000 people died of the disease in 2005, with more than 70% of the total aged
below 70 years old. The three most common cancers in men are those of the throat, prostate and Kaposi’s
sarcoma. Meanwhile, breast cancer is the leading cause of death in women, followed by throat and
cervical cancer.
Dr Kimani, director of medical services, said that Kenyatta National Hospital was the only public health
facility providing comprehensive cancer treatment. He added that this was grossly inadequate as many
patients are put on a waiting list of up to six months, and by the time they get attended to, it is too late. On
a positive note, he said that plans to set up treatment centres in Mombasa and Nyanza provincial hospitals
were in progress.
In October 2009, it was revealed that the Breast Cancer Association and other stakeholders were urging
the government to implement a Cancer Control Bill to improve treatment in the country. The
association’s vice chairman, Newton Siele, said that the Bill would force the government to allocate
resources for an autonomous cancer unit that would deal with the treatment, diagnosis and research into
cancer. Additionally, the Bill would also create an independent cancer institute, which would not have to
rely so heavily on WHO statistics and the Nairobi Council Registry, which collects data only from public
hospitals.
In July 2011, the House Budget committee of the Kenyan Parliament was urged to provide funds for the
purchase of three radiotherapy machines to be used for cancer treatment. Lawyer Mumbi Ngugi of the
Albinism Foundation of East Africa and Kituo Cha Sheria executive director Priscilla Nyokabi presented
a petition to the committee in which they also asked the government to provide sunscreen in public

Kenya Insurance Report Q1 2012
© Business Monitor International Ltd Page 34
hospitals to help patients with albinism. According to Ngugi, cancer patients were required to travel to
Kenyatta National Hospital (KNH) to receive treatment, with most unable to afford it. Ngugi has
suggested the installation of the machines in KNH and provincial hospitals in Nyanza and Coast.
Committee member Julius Kones revealed that the committee would make amendments to the budget to
allocate KES300mn (US$3.37mn) to the purchases
Obesity
A study published in BioMed Central Public Health in December 2009 (‘Overweight and obesity and
urban Africa: A problem of the rich or poor?’) said obesity is on the rise in Africa and may reach
epidemic proportions in the near future. The study examined changes (over a period of 10 years) in the
prevalence of excess weight and obesity among urban adult women in seven Sub-Saharan African
countries (Kenya, Burkina Faso, Ghana, Malawi, Niger, Senegal and Tanzania) and investigated the
extent to which these changes vary according to household wealth and education.
The data showed that over the study period the prevalence of overweight/obesity increased by nearly
35.5%. The study also showed that the prevalence of obesity was as high as 38% in urban Kenya
compared with 18% in rural Kenya; 35% in urban Niger compared with 7% in rural Niger; 35% in urban
Ghana compared with 16% in rural Ghana; 32% in urban Tanzania compared with 12% in rural Tanzania;
29% in urban Senegal compared with 14% in rural Senegal; 28% in urban Burkina Faso compared with
4% in rural Burkina Faso; and 23% in urban in Malawi compared with 12% in rural Malawi.
The findings reinforce the observation that obesity is on the increase in urban areas of Africa, and
supports the WHO warning on an impending dual epidemic of communicable and non-communicable
diseases on the continent in the near future. Focusing on Kenya, BMI notes that our BoDD reveals the
number of DALYs lost to communicable diseases will increase from 9,013,730 in 2009 to 10,888,077 by
2030, equating to a 21% rise in the DALYs lost. Meanwhile, the number of DALYs lost to non-
communicable diseases will rise from 2,613,832 in 2008 to 4,116,757 by 2030, equating to a staggering
57% increase.
Obesity is a widely recognised contributing factor to the development of various chronic diseases such as
cardiovascular diseases and diabetes. According to the BoDD, 48,043 DALYs were lost to diabetes in
Kenya in 2009 and by 2030 this will have increased to 82,064 DALYs -- a 71% increase in the disease
burden. Furthermore, 382,854 DALYs were lost to cardiovascular disease in Kenya in 2009 and this is
expected to rise to 608,717 DALYs by 2030, a 59% increase. BMI believes these figures emphasise the
need for the Kenyan government (as well as the governments of other African nations) to educate its
population about the seriousness of obesity and its effects. Furthermore, we believe that healthcare
services in these nations should prepare themselves for dealing with the changing epidemiological
profiles.

Kenya Insurance Report Q1 2012
© Business Monitor International Ltd Page 35
The study also showed that women of higher socio-economic status (proxied by household wealth and
women’s education) were more likely to be overweight or obese than those that were less well-off.
Additionally, women who were earning an income were more likely to be overweight or obese.
Expanding waistlines are becoming increasingly common in the growing middle and upper classes as
people ditch traditional diets (consisting of unrefined carbohydrates and fresh fruits and vegetables) for
Western-style foods that are high in saturated fats. This trend is coupled with increasingly sedentary
lifestyles.
Table: Insurance Key Drivers – DALYs 2009-2016
2009 2010 2011 2012f 2013f 2014f 2015f 2016f
All diseases and injuries, total, male, 6,502,941 6,601,828 6,701,127 6,800,530 6,900,103 6,999,899 7,099,964 7,200,081
Communicable, maternal, perinatal and nutritional conditions, total, male 4,303,756 4,347,546 4,391,314 4,434,557 4,477,314 4,519,618 4,561,497 4,602,777
Non-communicable diseases, total, male 1,324,990 1,356,701 1,388,497 1,420,627 1,453,109 1,485,957 1,519,183 1,552,744
All diseases and injuries, 0-4 yrs, male 1,919,539 1,905,410 1,887,748 1,870,043 1,852,228 1,834,251 1,816,075 1,802,265
All diseases and injuries, 5-14 yrs, male 531,825 535,162 538,434 541,970 545,679 549,480 553,296 552,666
All diseases and injuries, 15-29 yrs, male 1,260,844 1,283,551 1,296,400 1,309,212 1,321,950 1,334,581 1,347,076 1,355,834
All diseases and injuries, 30-44 yrs, male 1,652,701 1,708,136 1,775,550 1,842,026 1,907,908 1,973,511 2,039,124 2,108,962
All diseases and injuries, 45-59 yrs, male 800,075 823,722 843,726 865,273 888,179 912,258 937,321 959,434
All diseases and injuries, 60-69 yrs, male 206,145 210,340 220,278 229,781 238,998 248,059 257,071 265,216
All diseases and injuries, 70+ yrs, male 131,812 135,507 138,991 142,226 145,161 147,760 150,000 155,703
All diseases and injuries, total, female 6,320,080 6,407,907 6,496,061 6,584,851 6,674,212 6,764,091 6,854,444 6,945,487
Communicable, maternal, perinatal and nutritional conditions, total, female 4,709,974 4,758,246 4,806,261 4,854,521 4,902,989 4,951,630 5,000,417 5,049,521
Non-communicable diseases, total, female 1,288,841 1,321,111 1,354,051 1,387,410 1,421,174 1,455,327 1,489,860 1,524,816

Kenya Insurance Report Q1 2012
© Business Monitor International Ltd Page 36
Table: Insurance Key Drivers – DALYs 2009-2016
2009 2010 2011 2012f 2013f 2014f 2015f 2016f
All diseases and injuries, 0-4 yrs, female 1,618,034 1,603,062 1,585,327 1,567,557 1,549,674 1,531,618 1,513,342 1,498,478
All diseases and injuries, 5-14 yrs, female 447,421 449,718 451,644 453,676 455,748 457,798 459,772 457,416
All diseases and injuries, 15-29 yrs, female 1,584,066 1,607,845 1,619,194 1,630,776 1,642,555 1,654,494 1,666,560 1,673,507
All diseases and injuries, 30-44 yrs, female 1,649,483 1,695,907 1,757,452 1,818,898 1,880,406 1,942,129 2,004,211 2,073,757
All diseases and injuries, 45-59 yrs, female 652,131 671,683 687,124 703,453 720,561 738,335 756,657 772,711
All diseases and injuries, 60-69 yrs, female 215,183 221,106 232,350 243,233 253,902 264,490 275,113 284,017
All diseases and injuries, 70+ yrs, female 153,762 158,585 162,971 167,259 171,367 175,228 178,788 185,601
All causes 12,823,021 13,009,735 13,197,188 13,385,381 13,574,315 13,763,991 13,954,408 14,145,568
Communicable, maternal, perinatal and nutritional conditions 9,013,730 9,105,792 9,197,575 9,289,079 9,380,303 9,471,248 9,561,914 9,652,298
Non-communicable diseases 2,613,832 2,677,812 2,742,547 2,808,037 2,874,283 2,941,285 3,009,043 3,077,560
All diseases and injuries, 0-4 yrs, total 3,537,573 3,508,473 3,473,075 3,437,600 3,401,901 3,365,868 3,329,417 3,300,743
All diseases and injuries, 15-29 yrs, total, 2,844,909 2,891,396 2,915,594 2,939,988 2,964,505 2,989,075 3,013,637 3,029,341
All diseases and injuries, 30-44 yrs, total 3,302,184 3,404,043 3,533,002 3,660,924 3,788,314 3,915,640 4,043,335 4,182,719
All diseases and injuries, 45-59 yrs, total 1,452,206 1,495,406 1,530,850 1,568,726 1,608,740 1,650,593 1,693,978 1,732,144
All diseases and injuries, 5-14 yrs, total 979,245 984,880 990,078 995,646 1,001,427 1,007,278 1,013,068 1,010,083
All diseases and injuries, 60-69 yrs, total 421,328 431,446 452,627 473,013 492,900 512,549 532,184 549,233
All diseases and injuries, 70+ yrs, total 285,575 294,092 301,962 309,485 316,528 322,987 328,788 341,304
f = forecast. Source: BMI’s BoDD

Kenya Insurance Report Q1 2012
© Business Monitor International Ltd Page 37
Motor
As demand for vehicles grows, the correlative scope for insurance growth is large. Monitoring key
indicators, tightening insurance regulations and domestic purchasing power can be crucial in a market
with a short-purchase cycle and high churn rate. Vehicle sales and car ownership statistics are crucial
growth indicators for the motor insurance market. Identifying growth trends for these two indicators has
the dual advantage of highlighting potential areas of growth and the need for line diversification in both
compulsory and non-compulsory motor insurance products.
As growth rates slow in the core private passenger segment, insurance companies look to faster growing
specialty segments for expansion, including motorcycles and HGVs; whose domestic sales statistics also
offer an insight into the potential of the smaller specialist insurance market potential.
Total new vehicle sales in Kenya rose 8.8% y-o-y in the first nine months of 2011, largely thanks to
growth in key industrial sectors, which has driven demand for commercial vehicles. According to data
from Kenya Motor Industry (KMI), growth in the agriculture, manufacturing and trade sectors is driving
demand for pick-up trucks, which accounted for 35% of total vehicle sales in the nine-month period.
Sales of heavy commercial vehicles still account for 26.8% of the market, behind pick-ups. We also
believe that construction projects in the region will fuel sales in the heavier segments over our forecast
period. Further growth in Kenya’s construction sector is forecast over the next two years by BMI’s
Infrastructure team, supporting the favourable conditions for the commercial vehicle segment. BMI
expects growth in construction industry value to remain at roughly the same level as 2010 in 2011 and
2012, with industry value reaching KES159bn (US$2.1bn) by 2012. There could also be good news on
the pricing front if the CBK’s monetary tightening measures result in the shilling’s appreciation.
BMI has previously commented on the effects of a weakening Kenyan shilling on the country’s used car
segment and new data show the extent of the problem, with figures not expected to improve in the short
term. Data from the NBS show that used car sales for the eight months to August 2011 were down 20% y-
o-y to 33,073 units, from 39,790 in the same period of 2010 previous year.
Dealers have reported a 30% increase since the start of 2011 in the charges associated with importing
used cars, including the exchange rate against the yen and US dollar and higher freight costs. The shilling
reached a record low of below KES100.0/US$ on September 26, and the Central Bank of Kenya expects
sustained currency volatility over the next six months. Inflation has exacerbated the situation and,
according to Kwame Owino, chief executive of the Institute of Economic Affairs, this has particularly hit
the middle class, which is the biggest customer base for used cars.
Domestic production is one solution to such issues and Kenya is attracting investment, particularly from
Chinese companies. Commercial vehicle manufacturer Foton Motor launched its first domestically
produced trucks in June 2011, after establishing a local subsidiary in the country in late 2010. The Foton

Kenya Insurance Report Q1 2012
© Business Monitor International Ltd Page 38
Slip Double Cab pick-up truck was assembled at the Kenya Vehicle Manufacturers facility, where it
will be assembled until Foton’s own plant comes onstream. As part of a growing focus on Africa by
Chinese auto companies, the company is building its own vehicle assembly plant, which is scheduled to
begin operations in May 2012. Chery Automobile will be the next Chinese carmaker to invest in Kenya.
According to Justus Nguu, director of Chery’s local franchise holder Stantech Motors, Chery is now in
negotiations with the Chinese government to secure financing of US$50mn for the Kenyan plant, which
the carmaker plans to open in 2013.
Islamic Finance
Takaful In Kenya: Watch That Space…
Takaful arrived in Kenya in February 2011. Takaful Insurance of Africa (TIA), the only fully shari’a-
compliant insurance company in the country began operations, having received its licence from the
Insurance Regulatory Authority (IRA) in January. TIA had been established in 2008. In an interview with
the media in March 2011, TIA’s CEO Hassan Bashir noted that the company hopes to write gross
contributions of KES1,000mn (US$12mn) in its first year of operation. According to him, the
opportunities come from: the overall under-insurance of Kenyans, in that only 2.8% currently have cover;
the fact that 10% of Kenya’s population is Muslim; the attractiveness of takaful to non-Muslims, and; the
integrity and honesty of Takaful. Hassan Bashir hopes to expand operations to Tanzania and Uganda in
due course. TIA’s website indicates that it offers a comprehensive range of general takaful products.
The first office of TIA was established in the Eastleigh district of Nairobi, which has a large Muslim
population. By December 2011, the company had a network of four offices. Press reports indicated that it
had written contributions of US$1mn in its first four months of operations. Meanwhile, Kenya
Reinsurance has indicated an interest in expanding into re-takaful.
As of December 2011, it is not possible to make a meaningful comment on the development of takaful in
Kenya. At this stage, we suspect that the most likely scenario is that TIA comes reasonably close to its
specified premium target – even if it takes the company 18 months rather than 12 to do so. There is also a
significant possibility that takaful languishes. Malaysia is the only other country where a takaful industry
has developed through the sale of products to both Muslims and non-Muslims. The takaful operators there
had the advantages of a significantly richer population and a government (of a predominantly Muslim
country) that was and is absolutely committed to the promotion of Islamic finance. Even then, it was
some time before takaful accounted for a significant percentage of overall premiums. We also note that
there is a small possibility that TIA’s commencement of operations proves to be an important catalyst for
the further development of insurance and Bashir’s target proves to be conservative.

Kenya Insurance Report Q1 2012
© Business Monitor International Ltd Page 39
Insurance Risk/Reward Ratings
The Insurance Risk/Reward Ratings take into account objective measures of the current state and long-
term potential of the non-life and the life segments. It also takes into account an assessment of the
openness of each segment to new entrants and economic conditions. Collectively, these measures enable
an objective assessment of the limits to potential returns across all countries and over a period of time.
The ratings also incorporate an objective assessment of the risks to the realisation of returns. The risk
assessment is based on BMI’s country risk rating. It embodies a subjective assessment of the impact of
the regulatory regime on the development and the competitive landscape of the insurance sector.
Table: Middle East And Africa Insurance Risk/Reward Ratings
Industry Rewards
Industry Rewards
– Non-Life
Industry Rewards
– Life Country
Rewards Rewards Regulatory Framework
Country Risks Risks
Insurance Risk/Reward
Rating Rank
South Africa 73.75 70.00 77.50 75.59 74.48 65.00 60.90 62.54 70.90 1
Israel 56.25 52.50 60.00 73.54 63.16 80.00 68.32 72.99 66.11 2
Bahrain 32.50 35.00 30.00 74.58 49.33 85.00 70.93 76.56 57.50 3
UAE 40.00 50.00 30.00 69.60 51.84 70.00 65.46 67.27 56.47 4
Saudi Arabia 35.00 50.00 20.00 77.36 51.94 60.00 63.46 62.07 54.98 5
Oman 23.75 30.00 17.50 71.64 42.90 65.00 72.67 69.60 50.91 6
Morocco 28.75 37.50 20.00 59.01 40.85 70.00 49.23 57.54 45.86 7
Qatar 18.13 31.25 5.00 70.21 38.96 55.00 65.66 61.40 45.69 8
Kuwait 15.00 20.00 10.00 74.73 38.89 50.00 67.18 60.31 45.32 9
Egypt 27.50 27.50 27.50 58.25 39.80 60.00 54.16 56.50 44.81 10
Jordan 23.75 32.50 15.00 70.00 42.25 70.00 27.57 44.54 42.94 11
Tunisia 21.25 30.00 12.50 60.77 37.06 55.00 46.30 49.78 40.87 12
Kenya 27.50 32.50 22.50 45.90 34.86 45.00 33.92 38.35 35.91 13
Iran 22.50 35.00 10.00 51.71 34.18 20.00 43.10 33.86 34.09 14
Algeria 16.25 22.50 10.00 44.54 27.56 50.00 47.11 48.27 33.77 15
Nigeria 17.50 25.00 10.00 50.81 30.82 25.00 44.59 36.75 32.60 16
Libya 3.75 5.00 2.50 42.00 19.05 30.00 45.00 39.00 25.04 17
Scores out of 100, with 100 the best. Source: BMI

Kenya Insurance Report Q1 2012
© Business Monitor International Ltd Page 40
Competitive Landscape
Major Players In Kenya’s Insurance Sector
Kenya’s insurance sector is regulated by the Insurance Regulatory Authority, which was established
under the Insurance (Amendment) Act of December 2006. The act became effective on May 1 2007. The
IRA formulates and enforces insurance standards, particularly in relation to compulsory lines such as
compulsory third-party motor liability insurance. It also approves tariffs and rates of insurance, deals with
complaints from the public, and monitors the viability of insurers. It monitors and enforces claims
settlement which includes limiting ownership of a single individual shareholder to 25% and increasing the
minimum capital requirement from the KES50mn to KES150mn for life insurers. Prior to 2007, the
insurance sector was regulated by the Office of the Commissioner of Insurance, part of the Ministry of
Finance that was established early 1987. The authority’s website is www.ira.go.ke.
As of late 2011, the IRA listed 44 insurance companies, 141 brokers and 105 licensed insurance
investigators. There are also 23 insurance surveyors, 21 loss adjusters, 14 medical insurance brokers and
75 motor assessors.
In March 2011, the IRA cancelled the licences of 102 brokers for failing to adhere to regulations in a
clean-up of the sector, leaving only 158 firms in business. The regulator also did not renew the operating
licenses of three companies – Blue Shield, Concord and Madison – for compliance failures. The latter
has since been issued a licence. Blue Shield was placed in statutory management by the Commissioner of
Insurance in September 2011.
The trade association is the Association of Kenya Insurers. The AKI was set up in 1987 and is the
umbrella group for the country’s insurers. Its website is www.akinsure.or.ke. Its aims, in broad terms,
include representation of the insurance sector to government and the general promotion of insurance in
Kenya.
In the 1980s legal restrictions required that the insurers be locally owned. These restrictions are not
absolute. Pan Africa, the largest player in the life segment, has a strategic partnership with South
Africa’s African Insurance, which has been a subsidiary of financial services giant Sanlam since 2005.
The Kenyan operations of South Africa’s Old Mutual are among the 10 largest life groups. Also present
is the local subsidiary of South Africa’s Metropolitan Life.
In the non-life segment, Chartis – the rebranded global non-life business of AIG – remains one of the
largest operators. Kenindia is the result of the 1979 merger of the Kenyan subsidiaries of four of India’s
largest insurers – New India Assurance, Oriental Insurance, United India Insurance and Life
Insurance Corporation of India. Kenindia is structured as a joint venture between these companies,
each of which has a 9-10% stake, and prominent members of Kenya’s Indian business community.

Kenya Insurance Report Q1 2012
© Business Monitor International Ltd Page 41
Kenindia’s local partners include Chandaria Foundation/Comcraft Group, the Sansora Group and the
Mahendra Group.
The countries in SSA whose insurance sectors are profiled by BMI are Kenya, Nigeria and South Africa.
Kenya’s insurance sector is similar in structure to Nigeria’s in that is consists of a surprisingly large
number of companies that are, by most standards, very small. As is discussed in the company profiles,
some of the larger companies have operations in neighbouring countries such as Uganda and Tanzania. In
this respect they are similar to their Nigerian peers. There are two main differences, however. First, there
is no Kenyan equivalent of NICON, the former state-owned insurer in Nigeria. Although NICON has lost
ground compared to other insurers over recent years, it is still one of the larger players in Nigeria by most
measures. Second, there is much more significant foreign (particularly South African) presence in Kenya,
especially in the life segment, which is far more developed than Nigeria’s. We also note that the general
level of transparency in the insurance sector Kenya, thanks mostly to the reports published by the AKI, is
much better than the level of transparency in the Nigerian insurance industry.
Table: Non-Life Companies’ Premiums And Market Share, 2008-2009
Premiums, 2008, KESmn Premiums, 2009, KESmn Market share, %
Jubilee 3,109.3 3,690.0 8.6
APA 3,002.9 3,603.6 8.4
UAP 2,465.2 3,062.9 7.1
Kenindia 2,831.7 2,834.0 6.6
Chartis (formerly AIG) 2,084.9 2,066.6 4.8
BlueShield 2,203.2 1,965.2 4.6
Heritage 1,712.2 1,919.0 4.5
Lion 1,597.7 1,740.2 4.0
ICEA 1,416.8 1,653.0 3.8
Cooperative 1,280.7 1,653.0 3.8
First Assurance 1,350.1 1,647.1 3.8
British American 993.0 1,454.0 3.4
Africa Merchant 976.6 1,387.4 3.2
Directline 696.2 1,188.2 2.8
Real 872.3 1,167.6 2.7
General Accident 887.9 1,119.9 2.6
Occidental 874.5 1,028.0 2.4
CFC Life 631.3 848.7 2.0
Fidelity 737.9 796.9 1.8
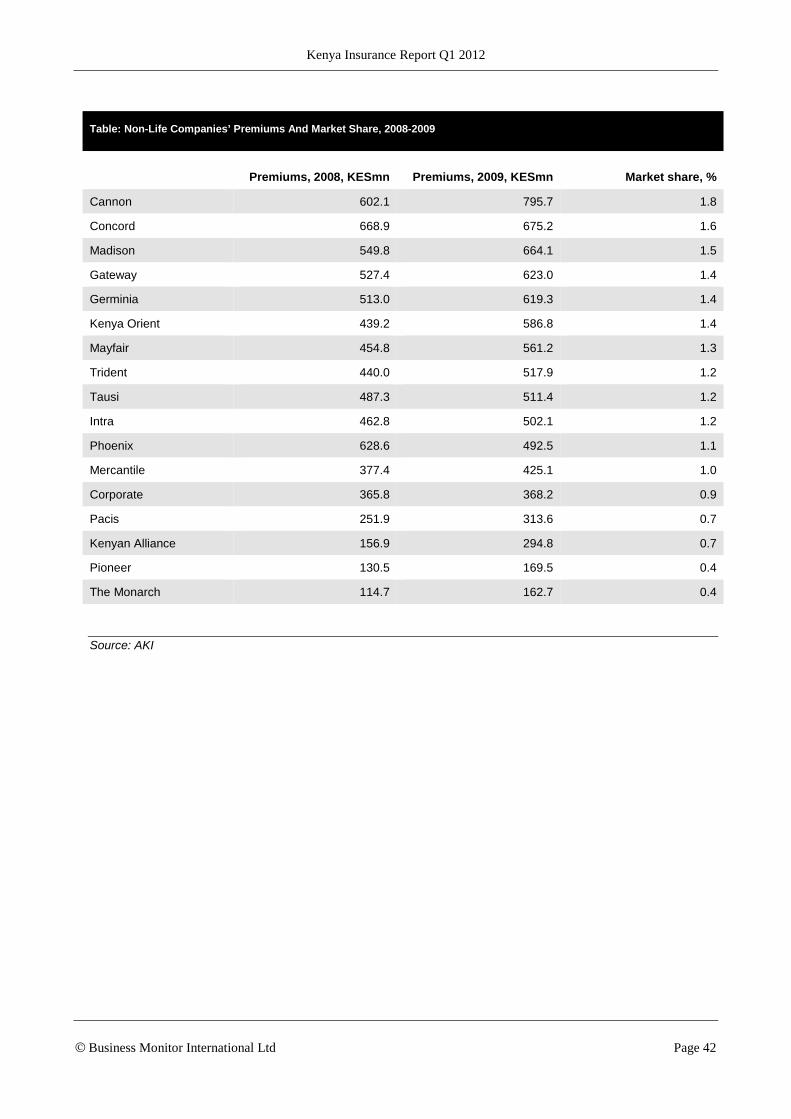
Kenya Insurance Report Q1 2012
© Business Monitor International Ltd Page 42
Table: Non-Life Companies’ Premiums And Market Share, 2008-2009
Premiums, 2008, KESmn Premiums, 2009, KESmn Market share, %
Cannon 602.1 795.7 1.8
Concord 668.9 675.2 1.6
Madison 549.8 664.1 1.5
Gateway 527.4 623.0 1.4
Germinia 513.0 619.3 1.4
Kenya Orient 439.2 586.8 1.4
Mayfair 454.8 561.2 1.3
Trident 440.0 517.9 1.2
Tausi 487.3 511.4 1.2
Intra 462.8 502.1 1.2
Phoenix 628.6 492.5 1.1
Mercantile 377.4 425.1 1.0
Corporate 365.8 368.2 0.9
Pacis 251.9 313.6 0.7
Kenyan Alliance 156.9 294.8 0.7
Pioneer 130.5 169.5 0.4
The Monarch 114.7 162.7 0.4
Source: AKI

Kenya Insurance Report Q1 2012
© Business Monitor International Ltd Page 43
Table: Life Companies’ Market Shares, 2009 (KESmn)
Ordinary premiums Group premiums Total premiums Market share, %
Pan Africa 1,512.2 1,513.0 3,025.2 22.9
British American 1,912.9 589.0 2,501.9 19.0
ICEA 584.0 687.7 1,271.7 9.6
Cooperative 102.6 1,119.1 1,221.6 9.3
Jubilee 482.8 605.0 1,087.8 8.2
CFC Life 926.4 121.1 1,047.5 7.9
Madison 434.6 80.6 515.2 3.9
Old Mutual 378.5 78.1 456.6 3.5
UAP Life 207.9 168.6 376.5 2.9
Kenindia 292.7 56.2 348.9 2.6
Pioneer 290.0 40.6 330.5 2.5
Apollo 35.7 148.1 183.8 1.4
Shield Assurance 131.1 17.1 148.2 1.1
Heritage na 143.1 143.1 1.1
Metropolitan Life 60.0 52.3 112.3 0.9
Corporate 99.1 1.6 100.6 0.8
First Assurance na 98.8 98.8 0.7
Cannon 73.9 4.8 78.7 0.6
Mercantile 34.6 8.1 42.7 0.3
Monarch na 38.3 38.3 0.3
Kenyan Alliance na 34.7 34.7 0.3
Trinity 17.3 na 17.3 0.1
Geminia 13.0 1.4 14.4 0.1
na = not available/applicable. Source: AKI

Kenya Insurance Report Q1 2012
© Business Monitor International Ltd Page 44
Company Profiles
APA Insurance
Website www.apainsurance.org
Overview APA Insurance is the largest insurer in East and Central Africa. It was formed in 2003 by the
merger of Apollo and Pan-Africa General. APA was the first insurance company in Kenya to
undertake HIV/AIDS cover. Premiums in 2010 amounted to around KES4.3bn.
Operations APA has nine regional offices in Kenya. It also has a wholly owned subsidiary company, APA
Insurance (Uganda), which is licensed to operate in that country. The Ugandan business is
crucial to the company in opening up other markets in the region and maintaining a regional
presence. APA is active in exploring other markets and seeking regional expansion. APA also
owns a 46% share of Reliance Insurance Company in Tanzania, which helps to boost its regional
presence.
In April 2011, the company announced LeapFrog Investments injected KES1.15bn (about
US$14mn) into Apollo Investment, which includes APA Insurance, Apollo Life Assurance, Apollo
Asset Management and Gordon Court. LeapFrog is the world’s largest investment fund focused
on insurance to underserved people and markets. Apollo said it would increase its stake in APA
through the acquisition of a 39.97% holding previously owned by Pan Africa Insurance Holdings.
At the end of April 2011, APA announced the launch of a new comprehensive motor product
called BimaBamba. The product includes: KES100,000 of cover for hospitalisation in the wake of
an accident; income supplement of up to KES1,000 per day for up to six days in the event of
hospitalisation; cover for political violence; excess protection, and; a subsidised vehicle tracking
devices. Unusually, premiums may be paid monthly rather than annually and in advance.
Payments may be made by cash, M-PESA, Airtel Money and PesaPoint.
In mid-2011, APA made payment of claims to farmers who had been adversely affected by
weather conditions in the February- May 2011 planting season. It said: ‘Wheat farmers in Narok
were hit by a severe drought occasioning a total crop failure. The month of April was particularly
the worst drought episode in the region for the past 32 years with the exception of the year 1993.
This prompted a compensation payout … of KES10,000 for ever acre covered by APA Insurance,
for the seven (Agricultural Finance Corporation-backed) farmers who collectively covered 336
acres of wheat.
‘The cover provides lump sum payment that will assist the farmers to be ready for the next
season. The availability of such insurance covers will encourage banks, MFIs and specialist
corporations like the AFC to provide loans to farmers, as they will have the insurance which repay
the loan to the financier.’
The new IBWI product has been developed in conjunction with the World Bank, the Rockefeller
Foundation, the Kenya Meteorological Department and the UK Department for International
Development.

Kenya Insurance Report Q1 2012
© Business Monitor International Ltd Page 45
Apollo
Website www.apollo.co.ke
Overview Apollo was first incorporated in 1977. Originally based in Mombasa, its headquarters have been
in Nairobi since 1981. Apollo is focused on delivering life insurance products and related services
throughout Kenya.
As well as its insurance products, Apollo offers a range of saving and investment vehicles.
In February 2010, the company launched a credit life product designed to help poor people live a
life in dignity. The credit life cover insures micro-finance institutions in case of death, permanent
total disability and critical illness of their borrowers, which in turn provides a safeguard to ensure
continuity of business of the borrower by his family.
In April 2011, the company announced that LeapFrog Investments invested KES1.15bn
(US$14mn) in Apollo Investment, which includes APA Insurance, Apollo Life Assurance, Apollo
Asset Management and Gordon Court. LeapFrog is the world’s largest investment fund focused
on insurance to underserved people and markets. Its capital and global insurance expertise
should help Apollo become a pre-eminent regional player in insurance in East Africa, including in
micro-insurance. At about the same time, Apollo announced that it had exercised its pre-emptive
rights to buy the 39.97% stake in APA that had previously owned by Pan Africa Insurance
Holdings.
Operations Apollo operates throughout Kenya, but mainly from its base in Nairobi. It has two offices in the
capital and offices in Mombasa and Nakuru.
It operates through two main divisions: individual solutions and solutions for businesses and
organisations. Apollo also works with agency offices in Eldoret and Kakamega.

Kenya Insurance Report Q1 2012
© Business Monitor International Ltd Page 46
Blue Shield Insurance
Website www.blueshield.co.ke
Overview Blue Shield Insurance was established in 1982 and has a presence across Kenya. The company
is one of the oldest domestically owned insurance companies in Kenya. It offers a wide range of
products tailored to customers’ specific needs. These are split into three main categories: general
insurance products, life insurance products and agriculture insurance products.
Operations Blue Shield Insurance operates as a composite insurer. It is composed of three shareholding
directors and three non-shareholding directors. It is the only Kenyan insurance company with a
woman as chairperson. The company’s head offices are in Nairobi and it has a countrywide
branch network and a strong team of intermediaries including brokers and agents. There are 32
branches across Kenya. The company split its life and general insurance into separate operations
in 2010.
It was established as a composite insurance company in 1982 and has broad asset base of more
than KES3.1bn. Its share capital of KES250mn. The company has an elaborate and well
managed countrywide branches network.
The companyy has authorised share capital of KES250mn and an asset base of over KES3.1bn.
News Blue Shield split its life and general insurance in 2010. This move was designed to make a clear
split between the two divisions – after cash flow deficits in the general business had, apparently,
been covered by funds from the life business.
On September 16 2011, the Commissioner for Insurance placed Blue Shield under statutory
management. The statutory manager imposed a moratorium on payments by the (general)
insurance company to its policy holders for 12 months. The commissioner stressed that the life
business previously written by Blue Shield, and which had been transferred to a vehicle known as
Shield Insurance, has no problems. Blue Shield was unable to meet its obligations to
policyholders and other creditors.
Kenya Insurance Report Q1 2012
© Business Monitor International Ltd Page 47
Jubilee Holdings
Websites www.jubileeholdings.com, www.jubileeinsurance.com
At A Glance Jubilee Insurance is the largest composite insurer in Kenya and East Africa. It focuses on medical
insurance products. The company operates from a strong financial base throughout East Africa.
The group reported gross premiums for 2010 of KES11.5bn, up by 25% from 2009. It also
announced an 84% increase in pre-tax profit for 2010 to KES2,053bn.
Operations Jubilee’s Insurance business is operated through a network of head offices in the East African
capitals of Nairobi, Kampala and Dar es Salaam, along with eight branches across the region. It
has been in operation since 1937 when it was incorporated as The Jubilee Insurance Company,
based in Mombasa.
Jubilee has been listed on the Nairobi Stock Exchange since 1984. In 2005, the company
expanded to cross-list on the Ugandan Securities Exchange and in 2006 on the Dar es Salaam
Stock Exchange. The company has about 400 employees across East Africa.
The company took advantage of strong economic growth in 2010 in East Africa and initiated an
aggressive regional expansion campaign. It launched subsidiaries in Burundi and Mauritius and
plans to enter new markets every year. By 2014, Jubilee expects to be in 14 markets in Africa.
At the end of Q111 the company released its results for 2010, which showed strong growth.
Gross premiums rose by 25% to KES11,484mn. Profit before income tax increased by 84% to
KES2,053mn. Total assets stood at KES31,600mn at the end of last year.
Kenindia
Website www.kenindia.co.ke
At A Glance Kenindia Assurance Company is Kenya’s largest non-life insurer. It was the first insurance
company in Kenya. It has 13 branches in Kenya, and brokers and subsidiary divisions abroad.
Operations Kenindia was formed in 1979 by the merger of four insurers: New India Assurance, Oriental
Insurance, United India Insurance and the Life Insurance Corporation of India.
Kenindia has a presence in the East Africa region through its Tanzanian subsidiary. The
company’s market share for non-life premium in Kenya is above 9%.
Kenindia’s business profile is composed of four main segments:
Fire insurance: 22%
Marine insurance: 12%
Motor insurance: 32%
Other: 35%

Kenya Insurance Report Q1 2012
© Business Monitor International Ltd Page 48
Pan Africa
Website www.pan-africa.com
At A Glance Pan Africa Life Assurance is one of the largest companies in the Kenyan insurance market. It has
been in business since 1947 and is one of only two life insurance companies quoted on the
Nairobi Stock Exchange.
It has more than 338,000 policyholders in Kenya, equating to a market share of 17% of the
Kenyan life insurance market.
Operations Pan Africa conducts business through a network of 15 branches throughout Kenya. It is
headquartered in Nairobi and has offices in Eldoret, Mombasa, Embu, Kisii, Nakuru, Kisumu,
Nyeri, Machakos, Thika, Meru, Naivasha and Westlands.
The company merged parts of its non life insurance business with Apollo insurance in 2003 in
order to form APA insurance. It maintains a strategic partnership with African Life of South Africa,
the. Since 2005 African Life has been a fully owned subsidiary of Sanlam, one of the largest life
companies in South Africa.
Pan Africa can justly claim to be something of a pioneer in Kenya. It was the first company to
introduce individual and group life products without the HIV/AIDS exclusion and the first player to
offer life insurance without a medical test. It ‘remains the only life insurer in Kenya with an entire
portfolio of individual life business that pays claims irrespective of the cause of death, where
death falls outside the prescribed waiting period.’ It was also the first life company to offer unit-
linked products in Kenya.
News At the end of Q111, Pan Africa Insurance Holdings (PAIHL) announced that its subsidiary PA
Securities would sell to Apollo Insurance the 39.97% stake held in APA Insurance. This deal
was consistent with the original agreement reached between PAIHL and Apollo when they
merged their general businesses in 2003 to form APA. It said: ‘The board of Pan Africa has
considered that this investment has served its purpose, having seen it grow and mature. Pan
Africa will continue with its focus on the long-term insurance business. Apollo, being the majority
shareholder in APA will exercise its rights of pre-emption to purchase the Pan Africa
shareholding to allow it flexibility in pursuing the group’s strategy in the region.’
Kenya Insurance Report Q1 2012
© Business Monitor International Ltd Page 49
BMI Methodology
BMI’s insurance reports provide insights into the operating conditions in and prospects for insurance in
over 60 mostly developing countries. The reports incorporate the latest information available from official
sources such as regulators, international associations of regulators and trade associations; comparable
information from other countries; and BMI’s economic and risk data. The reports focus on gross written
premiums in two segments: non-life and life. Unless stated, ‘premiums’ refers to gross written premiums.
In BMI’s reports, non-life insurance includes health insurance premiums if these are normally considered
by industry observers to lie within the mainstream insurance sector. Non-life insurance includes inwards
reinsurance premiums if these would normally and reasonably be considered a significant part of the non-
life segment. In practice, this means that we generally include inwards reinsurance in developed countries
and offshore financial centres that specialise in insurance. We consider outwards reinsurance to be an
expense. Life insurance includes all long-term savings products that are legally structured as insurance
products. Life insurance premiums do not, therefore, include contributions to pension plans and other
long-term savings schemes unless they are legally constituted as being within the insurance sector.
Life Segment
In projecting life premiums, we consider two aspects: the likely development of population and of life
density (life premiums per capita). Typically, we forecast life density for 2016 and assume density
changes evenly from 2012 to 2016. In some cases there will be clear reasons why life density is not likely
to change evenly over time. In such cases, we forecast life density from year to year. Forecasts of life
density for 2016 typically take into account the following factors: life density in 2012; density in nearby
countries at a similar level of development; relative importance of life insurance in terms of overall
retirement savings; and other factors promoting or retarding evolution of the life segment.
Non-Life Segment
In making projections of premiums in the non-life segment, we consider two aspects: the likely
development of nominal GDP and of non-life penetration (non-life premiums as a percentage of GDP).
Typically, we forecast non-life penetration for 2016 (the end of the forecast period) and assume that non-
life penetration changes evenly from 2012 to 2016. However, in some cases, an examination of the
various lines (motor, accident/health, liability etc) that constitute the non-life segment indicates that the
non-life penetration is not likely to change evenly over time. In such cases we forecast the non-life
penetration from year to year. Forecasts of non-life penetration for 2016 typically take into account the
following factors: non-life penetration in 2012; penetration in nearby countries at a similar level of
development; whether or not health insurance is generally considered to be within the insurance sector;
and other factors promoting or retarding evolution of the non-life segment.
Autos
At a general level, we approach our forecasting from both a micro angle and a macro perspective,
Kenya Insurance Report Q1 2012
© Business Monitor International Ltd Page 50
assessing the expansion plans of relevant multinationals/ indigenous firms, while also taking account of
the prevailing economic outlook. In this latter respect, BMI projections for macro variables such as
industrial output, private consumption, government investment, monetary policy and GDP growth play a
key role.
Tourism
There are a number of principal criteria that drive our forecasts for each tourism sector variable. Figures
for the tourism sector data are based, where possible, on industry associations/operators,
government/ministry sources and official data. Where these are unavailable, tourism forecasts are based
on a range of variables:
Government policy, industry trends and expenditure levels stated in international and national press.
Industry trends and expenditure levels stated in tourism company official financial reports or releases.
Likely expenditure and growth patterns owing to international developments/demographic patterns.
Likely alterations in expenditure patterns owing to economic/political activity.
Burden Of Disease
The burden of disease in a country. This is forecasted in DALYs (disability-adjusted life years) using
BMI’s Burden of Disease Database, which is based on the WHO’s burden of disease projections and
incorporates World Bank and IMF data.
Security Risk Ratings
BMI’s Security Ratings service, which integrates closely with our Country Risk service, offer a
comprehensive comparative analysis of security risk across three key areas – interstate conflict, terrorism
and physical safety for expatriate workers – across major states in each region. The ratings are combined
to form a composite security rating to provide an overall guide to long-term trends and risks. Finally, we
integrate our short-term political and economic ratings with the terrorism rating, to indicate a state’s
vulnerability to a sustained terrorist campaign or major terrorist attack. In all instances, the rated period is
two years, with each country assigned a score out of 100, with a low score indicating a high level of risk.
Kenya Insurance Report Q1 2012
© Business Monitor International Ltd Page 51
Insurance Risk/Reward Ratings
BMI’s Insurance Risk/Reward Rating has a threefold approach. First, we assess market attractiveness and
risks to the predictable realisation of profits in each state, capturing operational dangers facing
companies. Second, we identify objective indicators that serve as proxies for issues/trends in the industry
to ensure consistent evaluation across states. Finally, we use BMI’s Country Risk ratings to ensure the
ratings capture broader issues relevant to the industry and that may limit market attractiveness or imperil
returns. The ratings system – which integrates with all industries covered by BMI – offers an industry-
leading insight into prospects/risks for companies. The ratings divide into two distinct areas:
Rewards
Evaluation of the industry’s size and growth potential in each state, and also broader industry/state
characteristics that may inhibit its development.
Risks
Evaluation of industry-specific dangers and those emanating from the state’s political/economic profile
that call into question the likelihood of anticipated returns being realised over the assessed time period.
Indicators
The following indicators have been used. Almost all indicators are objectively based.

Kenya Insurance Report Q1 2012
© Business Monitor International Ltd Page 52
Table: Insurance Risk/Reward Indicators And Rationale
Rewards
Insurance market Rationale
Non-life premiums, 2012 (US$mn) Indicates overall sector attractiveness. Large markets more attractive than small ones.
Growth in non-life premiums, five years to 2016 (US$mn)
Indicates growth potential. The greater the likely absolute growth in premiums the better.
Non-life penetration, % Premiums expressed as % of GDP. An indicator of actual and (to an extent) potential development of non-life insurance. The greater the penetration the better.
Non-life segment measure of openness Measure of market’s accessibility to new entrants. The higher the score the better.
Life premiums, 2012 (US$mn) Indicates overall sector attractiveness. Large markets more attractive than small ones.
Growth in life premiums, five years to end-2016 (US$mn)
Indicates growth potential. The greater the likely absolute growth in premiums the better.
Life penetration, % Premiums as % of GDP. An indicator of actual and (to a certain extent) potential development of life insurance. The greater the penetration the better.
Life segment measure of openness Measure of market’s accessibility to new entrants. The higher the score the better.
Country structure
GDP per capita (US$) A proxy for wealth. High-income states receive better scores than low-income states.
Active population Those aged 16-64 in each state, as a % of total population. A high proportion suggests that market is comparatively more attractive.
Corporate tax A measure of the general fiscal drag on profits.
GDP volatility Standard deviation of growth over 7-year economic cycle. A proxy for economic stability.
Financial infrastructure Measure of financial sector’s development, a crucial structural characteristic given the insurance industry’s reliance on risk calculation.
Risks
Market risks
Barriers to entry Subjectively evaluates de facto/de jure regulations on development of insurance sector.
Regulatory environment Subjectively evaluates impact of regulatory environment on the competitive landscape.
Country risk (from BMI’s Country Risk Ratings)
Short-term financial risk Evaluates currency volatility.
Short-term external risk State’s vulnerability to externally induced economic shock, which tend to be principal triggers of economic crises.
Policy continuity Evaluates the risk of sharp change in broad direction of government policy.
Legal framework Strength of legal institutions. Security of investment key risk in some emerging markets.
Bureaucracy Denotes ease of conducting business in a state.
Source: BMI
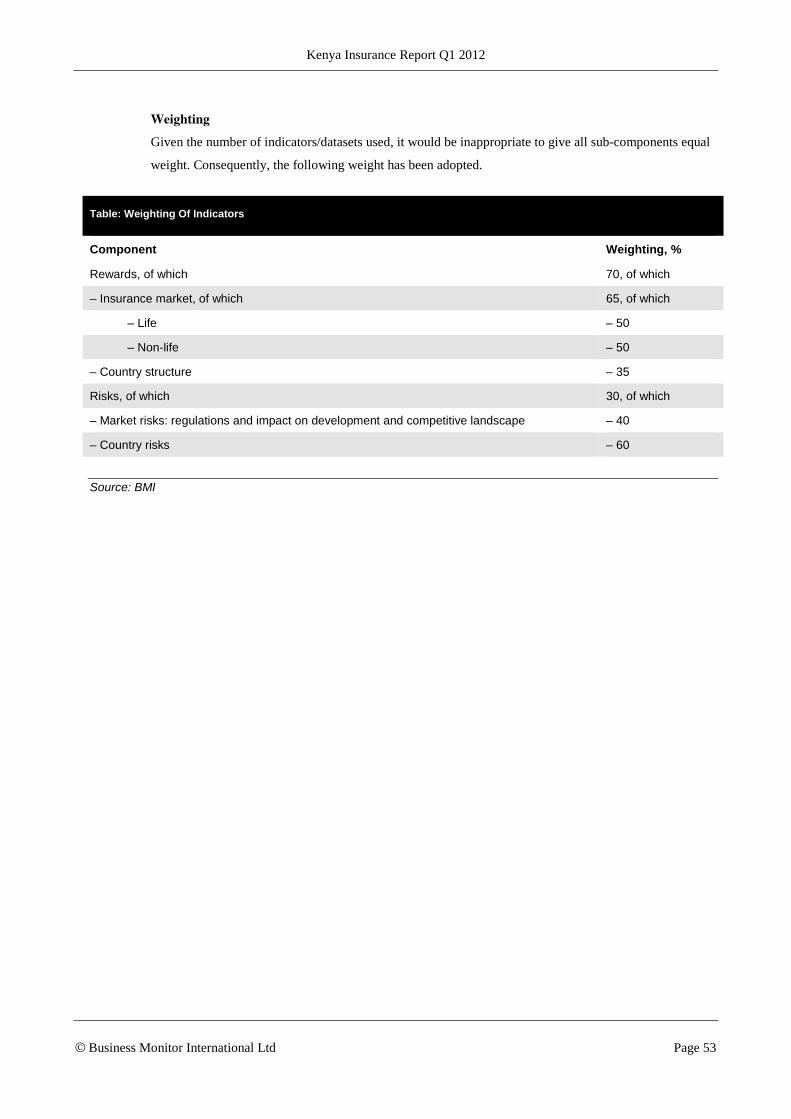
Kenya Insurance Report Q1 2012
© Business Monitor International Ltd Page 53
Weighting
Given the number of indicators/datasets used, it would be inappropriate to give all sub-components equal
weight. Consequently, the following weight has been adopted.
Table: Weighting Of Indicators
Component Weighting, %
Rewards, of which 70, of which
– Insurance market, of which 65, of which
– Life – 50
– Non-life – 50
– Country structure – 35
Risks, of which 30, of which
– Market risks: regulations and impact on development and competitive landscape – 40
– Country risks – 60
Source: BMI