Today’s lesson will focus on Renewable Energy. So, what is Renewable Energy? Renewable Energy 2.
Upload
colin-randallCategory
view
214download
0
© OECD/IEA 2015
Business Models and Smart Policies for Scaling Up Renewable Energy
Dr. Paolo FranklHead, Renewable Energy DivisionInternational Energy Agency
Vienna Energy Forum, High Level Panel III, Vienna 18 June 2015
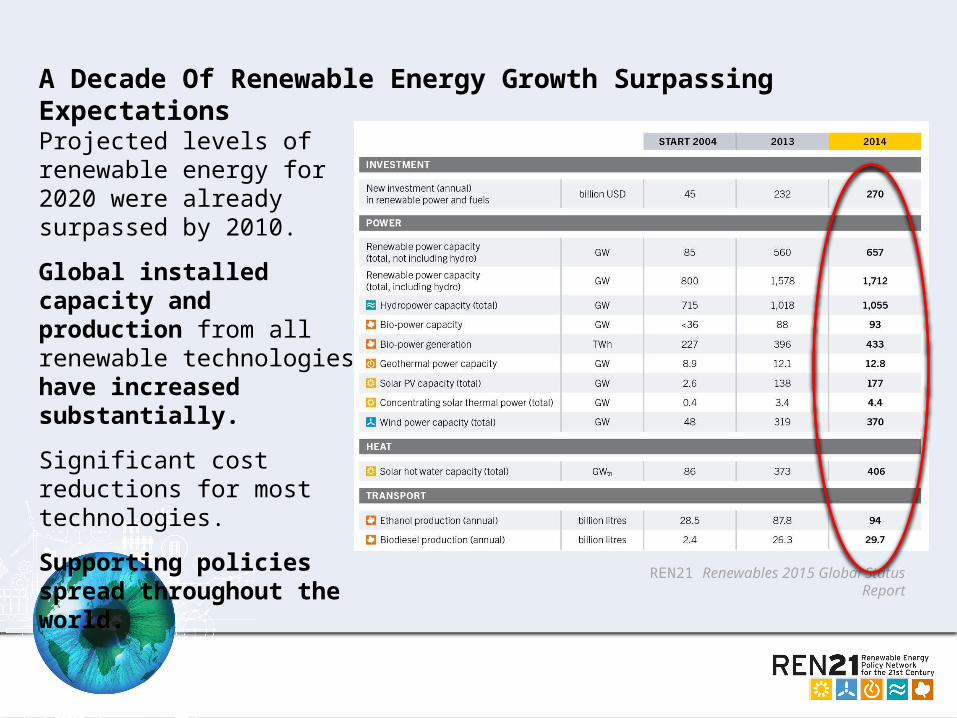
A Decade Of Renewable Energy Growth Surpassing Expectations
Projected levels of renewable energy for 2020 were already surpassed by 2010.
Global installed capacity and production from all renewable technologies have increased substantially.
Significant cost reductions for most technologies.
Supporting policies spread throughout the world.
REN21 Renewables 2015 Global Status Report
© OECD/IEA 2015
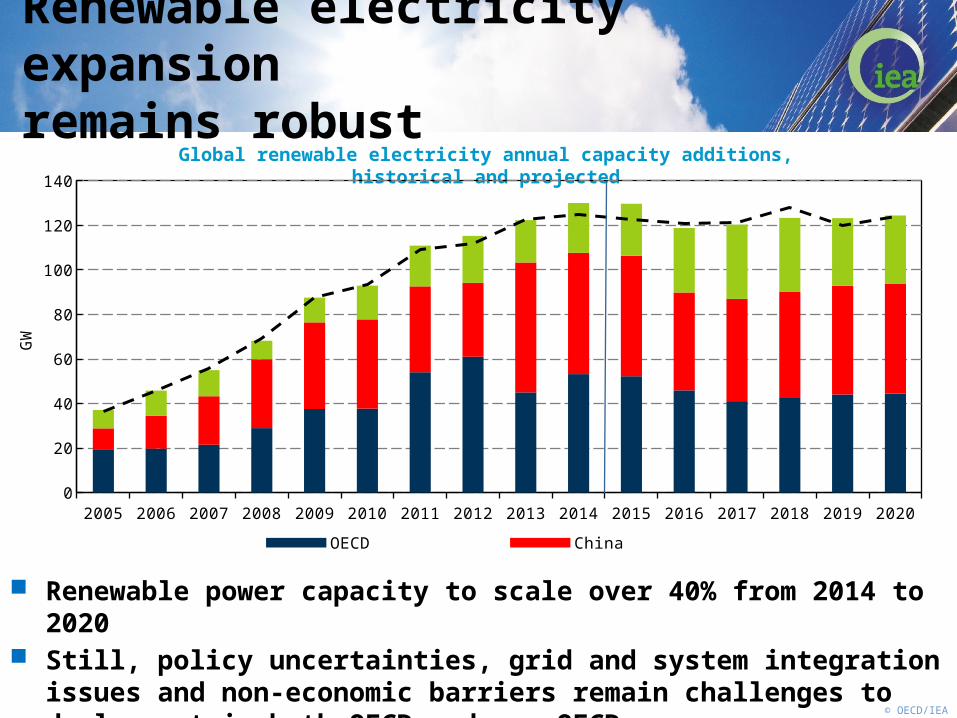
Renewable power capacity to scale over 40% from 2014 to 2020 Still, policy uncertainties, grid and system integration issues and non-economic
barriers remain challenges to deployment in both OECD and non-OECD Non-OECD markets face particular constraints accessing low cost finance
Renewable electricity expansion remains robust
Global renewable electricity annual capacity additions, historical and projected
2005 2006 2007 2008 2009 2010 2011 2012 2013 2014 2015 2016 2017 2018 2019 2020 0
20
40
60
80
100
120
140
OECD China Other non-OECD
GW
© OECD/IEA 2015
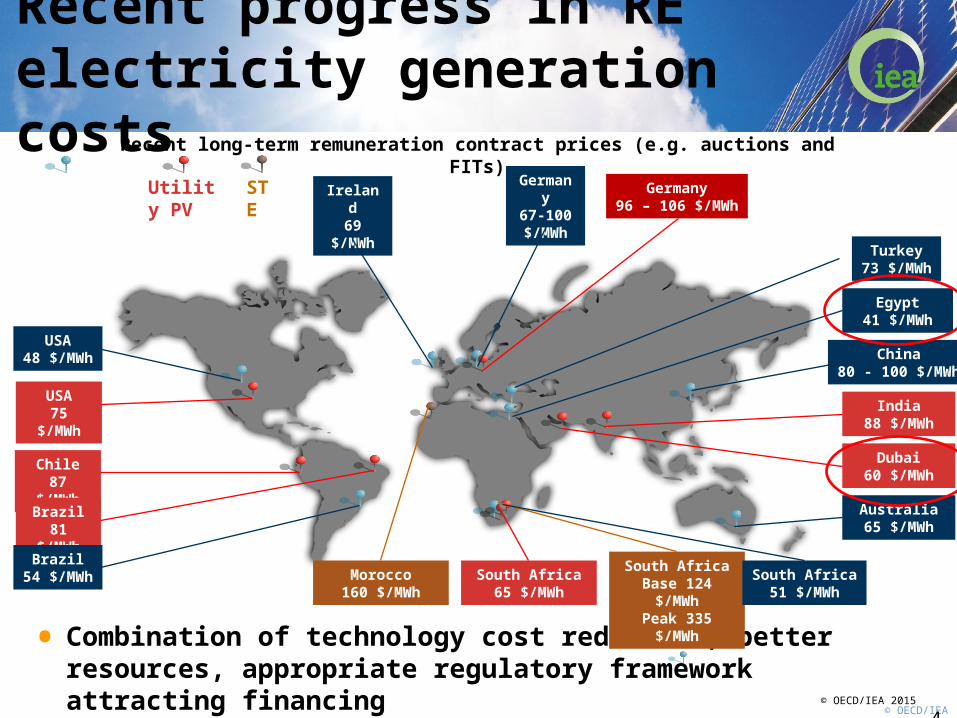
Recent progress in RE electricity generation costs
© OECD/IEA 2015 4
• Combination of technology cost reduction, better resources, appropriate regulatory framework attracting financing
• Long-term PPAs and price competition effective drivers for reducing costs
Utility PV
Recent long-term remuneration contract prices (e.g. auctions and FITs)
STE
India88 $/MWh
Chile87 $/MWh
USA75 $/MWh
South Africa65 $/MWh
Brazil81 $/MWh
Dubai60 $/MWh
Morocco160 $/MWh
South AfricaBase 124 $/MWhPeak 335 $/MWh
South Africa51 $/MWh
USA48 $/MWh China
80 - 100 $/MWh
Brazil54 $/MWh
Turkey73 $/MWh
Germany67-100 $/MWh
Ireland69
$/MWh
Australia65 $/MWh
Egypt41 $/MWh
Germany96 – 106 $/MWh
© OECD/IEA 2015
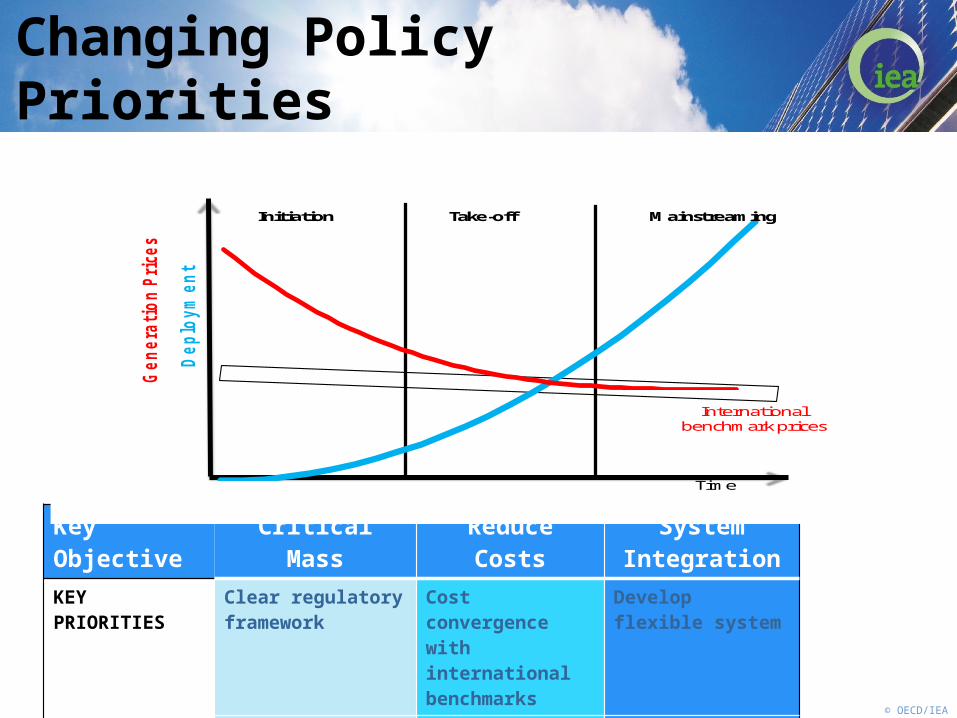
Changing Policy Priorities
• Predictable and rapidly adaptive incentives
• Focus on non-economic barriers
• Manage total support costs
• System integration Market design and expose RE to competition
• Publicacceptance
Time
De
plo
ym
en
t
Initiation Take-off Mainstreaming
Ge
ne
rati
on
Pri
ce
s
International benchmark prices
Key Objective Critical Mass Reduce Costs System Integration
KEY PRIORITIES Clear regulatory framework
Cost convergence with international benchmarks
Develop flexible system
Secure financial support
Introduce competition
Market reform
© OECD/IEA 2015
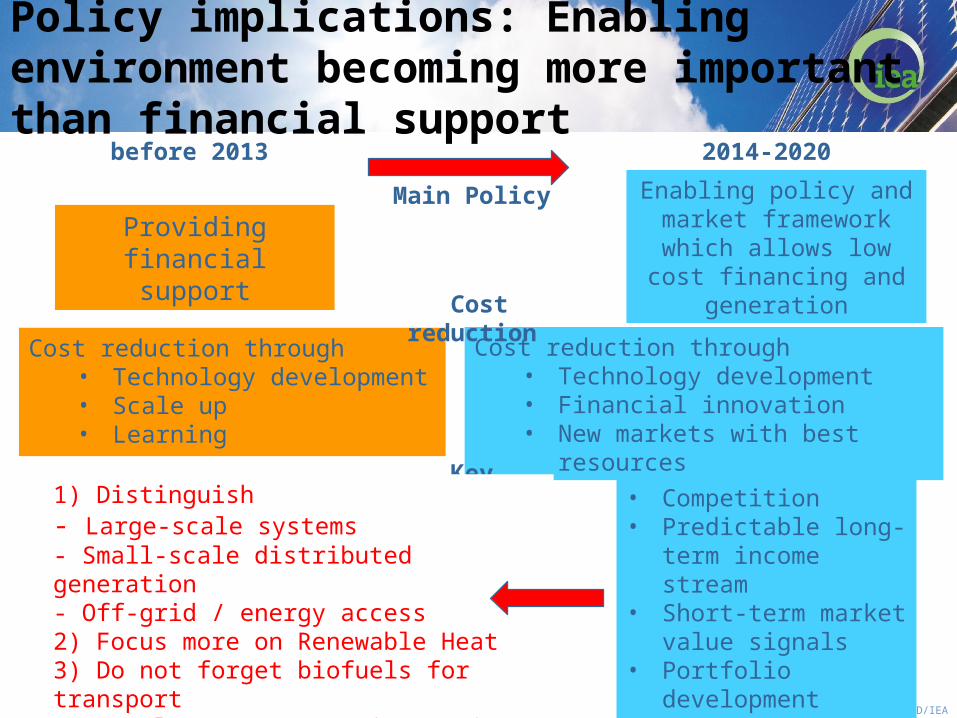
Policy implications: Enabling environment becoming more important than financial support
Providing financial support
Cost reduction through• Technology development• Scale up• Learning
before 2013
Enabling policy and market framework which allows low cost financing
and generation
• Competition• Predictable long-term
income stream• Short-term market
value signals• Portfolio development• System Integration
Cost reduction through• Technology development• Financial innovation• New markets with best resources
2014-2020
Main Policy
Key Characteristics
Cost reduction
1) Distinguish - Large-scale systems- Small-scale distributed generation- Off-grid / energy access2) Focus more on Renewable Heat3) Do not forget biofuels for transport4) Develop Energy Service Business Models


![[PPT]Chapter 18 Renewable Energy 18-1 Renewable …environmentalscienceclass.weebly.com/.../ch_18_notes.ppt · Web viewChapter 18 Renewable Energy 18-1 Renewable Energy Today Renewable](https://static.fdocuments.net/doc/165x107/5b029fb97f8b9a6a2e900bdf/pptchapter-18-renewable-energy-18-1-renewable-envir-viewchapter-18-renewable.jpg)