NO.18-027 | 10/2019 DISUSSIN PAER - ZEW
33
DISCUSSION PAPER // THUSHYANTHAN BASKARAN AND SEBASTIAN BLESSE // NO.18-027 | 10/2019 Subnational Border Reforms and Economic Development in Africa
Transcript of NO.18-027 | 10/2019 DISUSSIN PAER - ZEW

DISCUSSION PAPER
/ / T H U S H Y A N T H A N B A S K A R A NA N D S E B A S T I A N B L E S S E
/ / N O . 1 8 - 0 2 7 | 1 0 / 2 0 1 9
Subnational Border Reforms and Economic Development in Africa

Subnational border reforms and economic development in Africa
Thushyanthan Baskaran (University of Siegen, ZEW Mannheim)†∗
Sebastian Blesse (ZEW Mannheim) ††
This draft: October 15, 2019
First draft: May 14, 2018
Abstract
We study how subnational border reforms affect local economic development in Africa by relat-ing all changes to subnational borders across the continent during 1992-2013 to nighttime luminosity.Difference-in-difference regressions at the pixel-level suggest that mergers have strong positive ef-fects on local economic development. The effects of splits are also positive, but smaller. To identifyrelevant mechanisms, we link border changes to geocoded data on conflicts and political attitudes.Splits affect development by improving political stability. Mergers have no effect on political stabil-ity and instead seem to affect economic development by increasing administrative efficiency.
Keywords: Border changes, economic development, night-light data, AfricaJEL codes: D73, H77, R11
∗Corresponding author: Thushyanthan Baskaran, Department of Economics, University of Siegen, Unteres Schloß 3,57072 Siegen, Germany, Tel: +49(0)-271-740-3642, email: [email protected]. We thank Janne Tukiainen, Ste-lios Michalopoulos, Zareh Asatryan, Annika Havlik, Felix Rosel as well as participants at the EEA meeting in Cologne, theWorkshop on Municipal Mergers and Local Public Finance at VATT in Helsinki, the Geodata and Economics Workshop inBraunschweig, the IIPF meetings in Tampere, the research seminar of the University Frankfurt as well as the ECPS meetingin Budapest for valuable comments. Ozan Akbas and Marcel Wieting provided excellent research assistance. ThushyanthanBaskaran is grateful for financial support from the German Science Foundation within the project ”Regional favoritism and de-velopment” (Grant no. DFG-423358188). Sebastian Blesse gratefully acknowledges support from the SFB 884 ’The PoliticalEconomy of Reforms’, which is funded by the German Research Foundation. The usual disclaimer applies.

1 Introduction
Recent evidence suggests that the legacy of the colonial period continues to impair African develop-
ment to this day. During the scramble for Africa, colonial borders were drawn and spheres of influence
determined by the European colonizers with little regard for the ethnic markup of the affected regions
(Thomson, 2010). These borders were inherited by the newly formed African nation states after de-
colonization and have hardly changed ever since. The traditional homelands of many ethnic groups in
contemporary Africa are hence split by arbitrary borders. At the same time, different groups are forced
within the administrative confines of political jurisdictions to which they may harbor little allegiance.
These circumstances are a natural breeding ground for political instability and obvious impediments to
development. Indeed, Michalopoulos and Papaioannou (2016) show that the arbitrary nature of African
borders continues to be source of conflict and economic inefficiency on the continent.
If improperly drawn borders are one reason for the lackluster economic performance of African coun-
tries, then the implied solution appears to be to simply reshape these borders. Several authors indeed
bemoan a secessionist deficit on the continent (for instance, Englebert and Hummel (2005)). However,
as national borders have essentially remained the same since decolonization, it is difficult to predict
whether a reshaping of African borders will change the economic fortunes of the continent1 – nor is it
obvious how exactly borders should be reshaped. Should countries be split up into smaller nations or
merged into larger supranational units? In addition, on a more practical level, it is not easy to change
national borders and any attempts in this regard may have unforeseeable consequences.
Accordingly, if border changes would be one remedy to the chronic economic difficulties and politi-
cal conflicts in Africa, they may be more feasible and more effective at the subnational rather than the
national level. In this paper, we study changes to the borders of first-level subnational units – typically
labeled states, regions, or provinces – in Africa to advance our understanding of how territorial reorga-
nizations may affect economic development on the continent. Unlike national borders, the borders of
first-level subnational governments in Africa have been frequently changed in shape and structure over
the last decades (Grossman et al., 2017; Fox and Gurley, 2006). These border changes were nominally
often part of broader public sector reforms (Erk, 2014) or deliberate attempts to adjust administrative
borders such that they better reflect the ethno-linguistic markup of the country (Fessha, 2012).2 In any
case, they provide considerable identifying variation to explore how splits and mergers affect economic
development in Africa. At the same time, the first-level subnational units share many of the traits of
national governments. They are generally important administrative units with an independent political
life and their territorial organization is often a source of persistent controversy and conflict (Elaigwu,
2008).
We identify subnational border changes in Africa by making use of shapefiles on administrative bor-
ders from the United Nations’ Global Administrative Unit Layers (GAUL) project. The shapefiles are
available for every year during the period 1992-2013 and indicate the borders of all first-level subna-
1The only secession on the continent took place in 2011, when South Sudan split from Sudan.
2However, there were also exceptional cases, for example in Rwanda where border changes were deliberate attempts toreduce subnational ethnic homogeneity.
2

tional governments (henceforth referred to as regions) across the globe in a given year. Consequently,
any changes to the line features that indicate borders from one to the next year imply a border reform.
After identifying these changes with geographic information system (GIS) software, we classify them
into splits or mergers depending on whether a new line feature emerged (split) or an existing feature
vanished (merger) within an existing subnational region.
A challenge for the subsequent analysis is to determine the unit of analysis. The subnational regions
themselves cannot be used as units of analysis as those regions that are affected by a border change by
definition cease to exist in their current form. This prevents us from constructing a consistent time series
at the level of subnational regions.3 We address this issue by dividing all of Africa into a grid of 1 × 1
degree pixels (about 110km × 110km). We use these pixels as time-constant units in our estimations.4
Specifically, we project the the changes to the line features identified from the GAUL dataset onto this
grid of pixel to determine whether a particular pixel (or more specifically the territory it is overlayed on)
was affected by a a split or a merger.
Another challenge is how to measure economic performance at the subnational level. First, GDP
calculations for developing countries are questionable due to poor statistical capacity (Jerven, 2013).
Moreover, even if existing GDP data were reliable, it is typically not available at lower levels of geog-
raphy, notably not at the pixel-level. We thus follow recent research and use nighttime luminosity as
measured by orbital satellites as proxy for economic performance (Henderson et al., 2012). Specifically,
we calculate average night light output in all 1 × 1 degree pixels for each year between 1992 to 2013
and match this data to the pixel-level data on subnational border changes.
Interpreting border changes as policy treatments, we implement a difference-in-differences design at
the pixel level. Specifically, we explore whether pixels that were affected by a split or merger witness
an improvement or deterioration in their economic conditions, as proxied by pixel-level luminosity. Our
results indicate that mergers led to higher night light output in the post-treatment period. In our baseline
specification, mergers increase pixel-level luminosity by about 42% compared to the pre-merger period.
Using the estimate for the elasticity between night lights and GDP of 0.3 by Henderson et al. (2012), we
calculate that pixel-level GDP increases in the long-run on average by 12.6% because of a merger. We
find smaller, albeit still positive, effects for splits: luminosity increases by 13%, which translates to an
increase in GDP by 3.9%.
One inherent limitation of our setting is that border changes are not random events. Accordingly, one
concern is that pixels affected by a border change were on a different economic trajectory than other,
unaffected pixels. If border changes are endogenous to economic developments, our estimates may be
confounded. On the other hand, non-economic, and in particular administrative and political concerns,
often appear in practice to be main motivation for border changes. Prior evidence suggests that the
creation of new subnational units (by splits) in African countries follows an electoral cycle, especially
3That is, if a existing region A is split into two new regions called B and C, the region A ceases to exist.
4The area covered by a pixel (12,100km2) roughly corresponds to the size of Los Angeles county (12,305km2). We choosethis pixel size for two reasons. First, it is sufficiently large to capture the aggregate effects of border changes (rather than onlyeffects immediately at the border). If e. g. a merger leads to cost-savings, the positive implications should spread over theentirety of the affected regions. On the other hand, this pixel size is arguably also sufficiently small as to not dilute the effectof border changes if they are mostly local.
3

in areas with strong political opposition (Grossman and Lewis, 2014; Hassan, 2013). We have also
hand-collected information on the official reasons given for a large fraction of the border changes in our
sample. It appears that border changes are primarily implemented to increase administrative efficiency,
often in the context of decentralization reforms, and secondly to address political conflicts. There is in
general no indication that border changes are implemented after (negative or positive) economic shocks.
Hence, to the extent that border changes are orthogonal to economic shocks, our empirical approach
should produce unbiased estimates.
Nevertheless, it is of course possible that there are a number of border changes in our sample that were
implemented for economic reasons. It is not feasible to address such endogeneity concerns in our cross-
country context by means of a quasi-experiment as there is no institutional mechanism that would induce
quasi-random variation in subnational border changes across all of Africa. While we acknowledge this
limitation, we attempt to address it to the extent possible. First, we verify the common trend assumption
using event-study plots. We observe no shocks in night lights before splits or mergers, suggesting
that border changes were not primarily driven by differences in economic trajectories. Second, we
estimate regressions where we control for country-level year effects to account for country-specific
economic developments. Third, we control for a number of observable time-varying covariates. In all
these specifications, we obtain similar results as in our baseline estimates.
Another noteworthy issue is that the magnitudes of the treatment effects for splits and mergers are
noticeably different. This difference suggests the possibility that these two forms of border changes
affect night lights through different channels. Exploring mechanisms, we indeed find evidence for this.
One important motive as to why splits are implemented appears to be to increase political stability.
Specifically, we observe fewer conflicts after splits.5 Substantial evidence suggests that (violent) con-
flicts have negative economic implications (Cerra and Saxena, 2008; Abadie and Gardeazabal, 2003).
Hence, the first-order effects of splits on political stability ostensibly have positive, even if relatively
small, implications for economic development.
For mergers, concerns of political stability appear to be less important. We observe no effects on
conflicts. On the other hand, we find that mergers are particularly effective in countries that have a
higher bureaucratic quality. These results suggest that mergers are primarily implemented to improve
local administrative efficiency with an aim to make better use of limited public resources (i. e. affected
regions maintaining similar levels of public services with presumably lower administrative overhead).
This might be one of the main reason why economic effects of mergers are more positive than those of
splits.
Nevertheless, one drawback of our analysis of mechanisms is that, given the data limitations, we
cannot provide more direct evidence on whether mergers indeed improve administrative efficiency. Ac-
cordingly, the evidence for this channel is mostly indirect. Similarly, we cannot rule out other plausible
channels through which both splits and mergers may affect development. For example, it is possible that
splits, too, lead to improvements in administrative efficiency if they result in a better targeted provision
of public goods (Oates, 1999). Mergers, on the other hand, may reduce inefficient inter-jurisdictional
competition (Burgess et al., 2012). However, those channels that we pinpoint – reduced ethnic conflicts
5This result is similar to evidence on administrative unit splits in Indonesia (Bazzi and Gudgeon, 2016; Bazzi et al., 2018).
4

in the case of splits and increased administrative efficiency – are plausible and have been shown to be
relevant in other contexts.
This paper contributes to various strands of literature. First, our results are related to the emerging
literature on subnational border changes in the developing world and their implications for economic
outcomes. For example, Asher and Novosad (2015) show that in India, living conditions in new states
that were carved out of existing states improve after splits. Shenoy (2018), on the other hand, finds
ambiguous results regarding economic activity around newly established borders after splits of Indian
provinces. Swee (2015) documents that the partitions of municipalities after the Bosnian War led to
better educational outcomes. Grossman et al. (2017) find that an increase in the number of regional
administrations per country improves aggregate health outcomes. On the other hand, as indicated above,
splits might also lead to harmful externalities and a race to the bottom through intensified jurisdictional
competition. For example, Burgess et al. (2012) show that more government units in Indonesia exac-
erbate deforestation. Similarly, Lipscomb and Mobarak (2017) find evidence of negative spillovers in
water pollution after splits of counties in Brazil.
We contribute to this literature by linking border changes to local economic performance in Africa.
While there are prior studies that explore how border changes affect economic outcomes in individual
countries, we are the first to study their economic consequences at the subnational level for the entire
African continent. We are also the first to study the economic consequences of both splits and mergers
simultaneously. Most of the previous literature has focused primarily on splits of administrative units,
arguably because they are the more common form of border change in the developing world (e.g. Bazzi
et al. (2018) and Grossman et al. (2017)). However, as we show below, there were also a significant
number of mergers in Africa. Finally, we are able to tie differences in the economic implications of
mergers and splits to some underlying channels and thus identify relevant mechanisms.6
This paper also contributes to the literature on the optimal size of political jurisdictions. On the one
hand, the costs associated with the heterogeneity in preferences of the population likely increase with
the size of a region (Oates, 1999). On the other hand, larger regional units presumably imply more
cost-effective provision of public goods due to scale economies (Bolton and Roland, 1997; Alesina and
Spolaore, 1997). A further argument against smaller (and hence more) regional units is, as alluded
above, that they would imply stronger inter-jurisdictional competition, which may lead to inefficient
aggregate equilibrium (Zodrow and Mieszkowski, 1986).
The remainder of this paper is structured as follows. The next section provides background on sub-
national border changes in Africa over the last two decades. Section 3 introduces the data and discusses
our empirical strategy. Section 4 presents the main results and Section 5 discusses mechanisms. Section
6 concludes.
6By considering mergers, this paper is also related to the literature on the economic consequences of amalgamations ofadministrative units. The existing studies on this question, however, focus on local governments in industrialized countries.For example, Loumeau et al. (2017) show that municipal mergers have a positive net effect for economic activity in Germany.Pickering et al. (2016) find similar evidence for Japan. Blesse and Baskaran (2016) find that (voluntary) municipal mergers donot reduce local government expenditures. Reingewertz (2012) and Blom-Hansen et al. (2014), on the other hand, show thatmergers significantly reduce local spending in Israel and Denmark.
5
2 Background
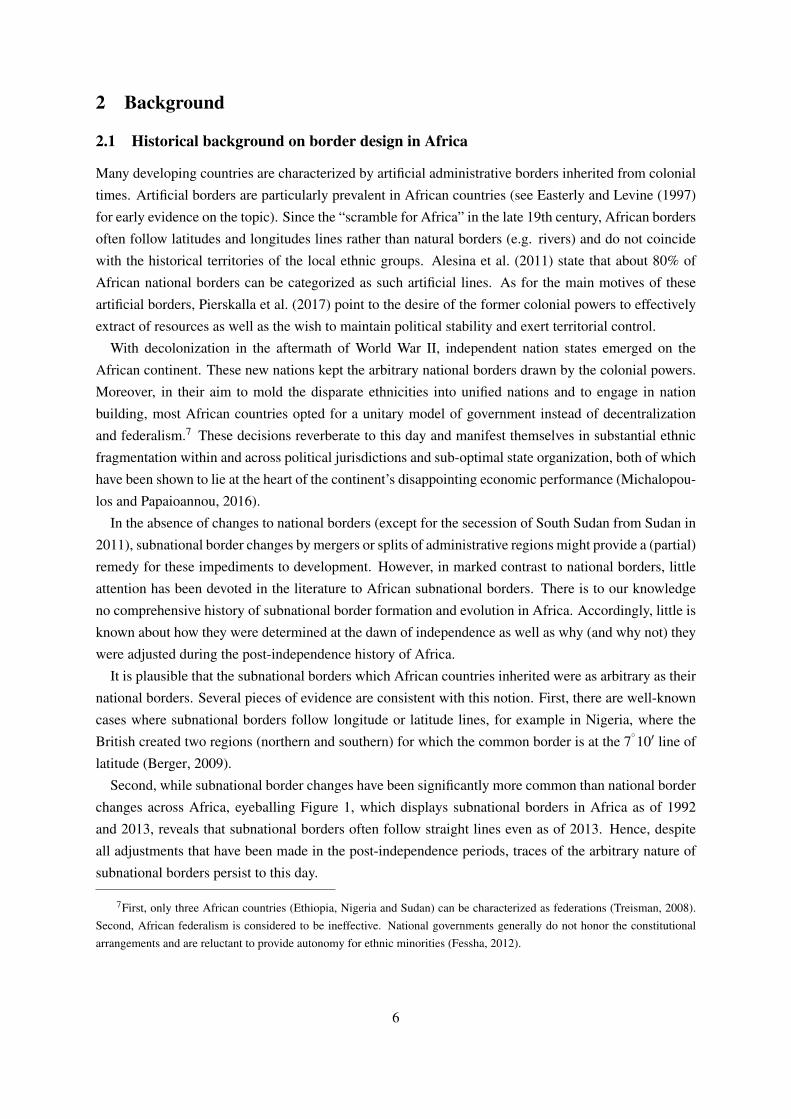
2.1 Historical background on border design in Africa
Many developing countries are characterized by artificial administrative borders inherited from colonial
times. Artificial borders are particularly prevalent in African countries (see Easterly and Levine (1997)
for early evidence on the topic). Since the “scramble for Africa” in the late 19th century, African borders
often follow latitudes and longitudes lines rather than natural borders (e.g. rivers) and do not coincide
with the historical territories of the local ethnic groups. Alesina et al. (2011) state that about 80% of
African national borders can be categorized as such artificial lines. As for the main motives of these
artificial borders, Pierskalla et al. (2017) point to the desire of the former colonial powers to effectively
extract of resources as well as the wish to maintain political stability and exert territorial control.
With decolonization in the aftermath of World War II, independent nation states emerged on the
African continent. These new nations kept the arbitrary national borders drawn by the colonial powers.
Moreover, in their aim to mold the disparate ethnicities into unified nations and to engage in nation
building, most African countries opted for a unitary model of government instead of decentralization
and federalism.7 These decisions reverberate to this day and manifest themselves in substantial ethnic
fragmentation within and across political jurisdictions and sub-optimal state organization, both of which
have been shown to lie at the heart of the continent’s disappointing economic performance (Michalopou-
los and Papaioannou, 2016).
In the absence of changes to national borders (except for the secession of South Sudan from Sudan in
2011), subnational border changes by mergers or splits of administrative regions might provide a (partial)
remedy for these impediments to development. However, in marked contrast to national borders, little
attention has been devoted in the literature to African subnational borders. There is to our knowledge
no comprehensive history of subnational border formation and evolution in Africa. Accordingly, little is
known about how they were determined at the dawn of independence as well as why (and why not) they
were adjusted during the post-independence history of Africa.
It is plausible that the subnational borders which African countries inherited were as arbitrary as their
national borders. Several pieces of evidence are consistent with this notion. First, there are well-known
cases where subnational borders follow longitude or latitude lines, for example in Nigeria, where the
British created two regions (northern and southern) for which the common border is at the 7◦10′ line of
latitude (Berger, 2009).
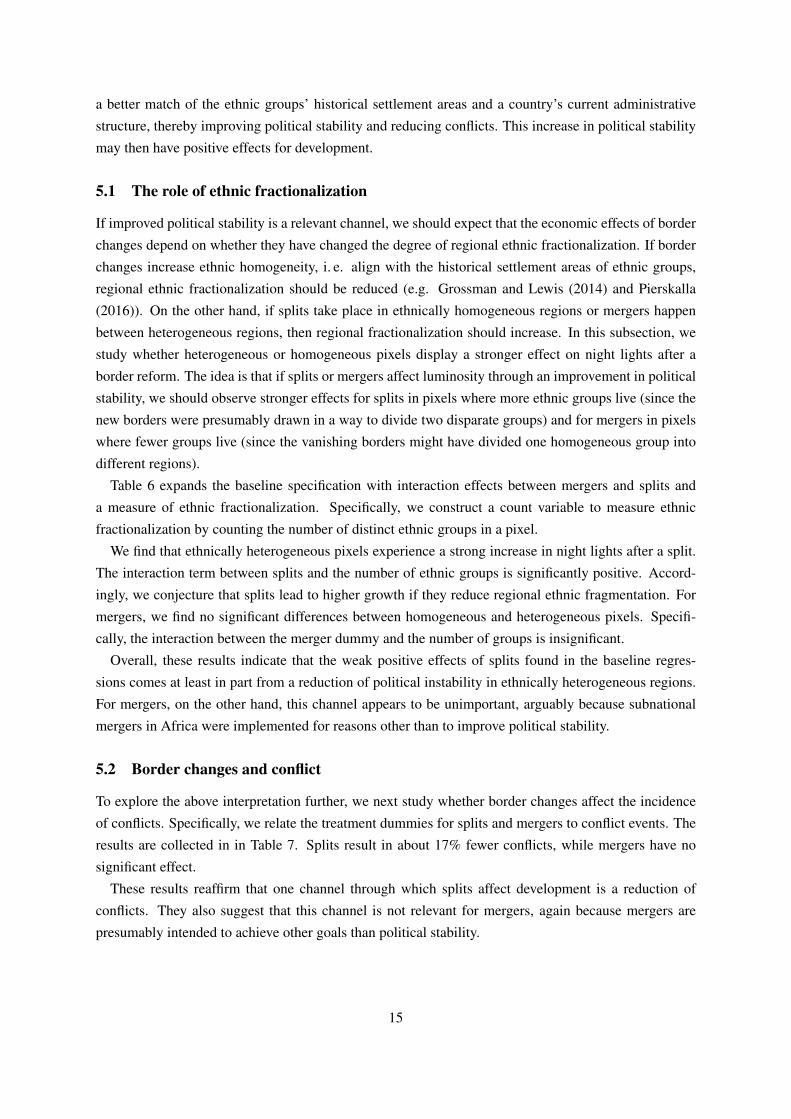
Second, while subnational border changes have been significantly more common than national border
changes across Africa, eyeballing Figure 1, which displays subnational borders in Africa as of 1992
and 2013, reveals that subnational borders often follow straight lines even as of 2013. Hence, despite
all adjustments that have been made in the post-independence periods, traces of the arbitrary nature of
subnational borders persist to this day.
7First, only three African countries (Ethiopia, Nigeria and Sudan) can be characterized as federations (Treisman, 2008).Second, African federalism is considered to be ineffective. National governments generally do not honor the constitutionalarrangements and are reluctant to provide autonomy for ethnic minorities (Fessha, 2012).
6

Third, the available anecdotal evidence on the creation of (new) subnational units and the definition
of their boundaries suggests that these were contentious negotiations in which the interests of several
stakeholders had to be taken into account. If various concerns needed to be simultaneously addressed,
it is plausible that the resulting borders were neither politically nor economically optimal. An example
is the creation of the provinces in South Africa during the transition to democracy after Apartheid.
As Makgetla and Jackson (2010) note, the constitutional committee tasked with the delimitation of
the provinces had to balance several political concerns (e. g. to gerrymander the provinces such that
influential stakeholders would maximize their electoral clout as well as to respect the settlement patterns
of ethnic and linguistic groups) and the need to create states that were economically viable.8
2.2 Subnational border changes in Africa
According to the GAUL data (we describe this data in more detail in Section 3), border reforms at
the state-level have been a frequent phenomenon in Africa during the last two decades.9 As mentioned,
Figure 1 shows the first-tier subnational boundaries in African countries in 1992 and 2013. As is obvious
from this figure, subnational borders have changed significantly in several countries. Moreover, different
types of border changes could be observed. The most straightforward type of border change is the split
of an existing region into two or more regions. In these cases, the name of the original region is either
retained by one of the new regions or both regions receive new names. The original name is typically
retained by one of the new regions if one of the newly created regions is relatively small (i. e. if the split
was a secession of a small part of a larger region).
The opposite type of border change is a merger of two or more existing regions into one larger entity.
In these cases, either an entirely new region is created or an existing (typically large) region absorbs one
or more smaller regions. Finally, a third type of border change combines both mergers and splits. In
these cases, subnational borders are completely re-aligned.
The number of regions in 1992 was 685. It has increased by 80 regions to 765 (or by 10.5%) by 2013
(see Figure 2). Table 1 gives an overview of the affected countries per year and type of reform being
implemented. The table also suggests that some countries experienced several border reforms. Figure 1
shows that in countries such as Egypt and Burundi, border changes were ostensibly isolated events that
affected only a few regions. In other countries, for example Buskin Faso and Ethiopia, border changes
affected the entire country and were ostensibly part of broader reforms.
Most border changes in Africa follow a top-down approach given the centralist nature of African
countries. Accordingly, border changes are usually a central government policy imposed on subnational
8For example, the National Party (NP) supported the creation of the Northern Cape province as its demographics wouldseem to give it an electoral edge against the African National Congress (AN) in provincial elections. Makgetla and Jackson(2010) state: “... technical committee members did not envision a Northern Cape, instead drawing a boundary between theWestern Cape and North-West province. AN members on the technical team noted that the Northern Cape had no historyof local administration and that the cost of governing the sparse population, coupled with the region’s modest local revenue,would make a provincial government’s work additionally difficult.” In the end, politics trumped the economic concerns andthe Northern Cape province was created.
9See also Table 1 in Grossman and Lewis (2014), which documents general trends in the creation of new subnational units(states, districts and municipalities) in Sub-Saharan Africa. However, they give no information on mergers of subnational units.
7
governments. The reasons for the border changes are, however, specific to the country in question. In
Buskin Faso, for example, a territorial reorganization was initiated in 2001 that saw the introduction
of a new tier of government – called regions – that encompassed the old provinces. These changes
were part of a wider public sector reform to improve administrative efficiency. In Rwanda, in contrast,
the boundaries of the provinces were completely redrawn in 2006 in a deliberate attempt to reduce the
degree of within-region ethnic homogeneity. In other cases, countries implemented splits to re-centralize
power to the national tier as well as to reduce the intergovernmental bargaining power of the subnational
units (Grossman and Lewis, 2014). Splits were also implemented for electoral reasons (Resnick, 2017),
in particular to more easily target fiscal transfers from the central government to specific voter groups
(Hassan, 2013; Gottlieb et al., 2019), to strengthen relationships with local elites (Green, 2010), or to
address ethnic grievances (Pierskalla, 2016).
3 Data and empirical strategy
3.1 Data
3.1.1 GAUL data on border changes
As mentioned, our data on border reforms is taken from the GAUL project. The main objectives of
the GAUL project are to provide reliable spatial information on administrative units and to maintain a
historical record of changes that occur to their shapes and extent (GAUL, 2014). The project assembles
this information using various official sources and makes it available to the public in the form of GIS
shapefiles in which subnational borders are indicated as line features.
In these shapefiles, the emergence or dissolving of a line from one to the next year ostensibly implies
some form of border reform. We use GIS software to systematically track changes to the line features
that represent the borders of the first-level subnational units. Line features can change in two ways. First,
a line can emerge within an existing subnational unit. We classify these changes as splits. Second, an
existing line between two regions may vanish. We classify these types of border changes as mergers.10
For an illustration, consider Figure 1. Subfigure (a) overlays the regional boundaries across Africa
in 1992 over the boundaries in 2013. The borders in 1992 are colored green while those in 2013 are
colored blue (we indicate country borders with black lines). The observable blue lines hence indicate
new borders that emerged over the sample period and thereby allow us to identify all splits from 1992 to
2013. Subfigure (b) overlays the regional boundaries in 2013 over those in 1992. In this case, the borders
as of 1992 are colored blue and those in 2013 green. Therefore, the blue lines show those borders that
vanished over the sample period and hence indicate mergers.
Since we have annual data, we can identify the year in which a particular region was split or merged.
After identifying such changes to the line features, we project the emerging (in case of splits) or vanish-
ing (in case of mergers) line to a 1 × 1 degree (about 110km × 110km) grid of pixels covering all of
10Note that with this algorithmic procedure, a border change where a region cedes territory to another already existingregion is classified as a split from the perspective of the ceding region. From the perspective of the receiving region, this borderchange would be classified as a merger (as an existing line vanishes). Pixels affected by this type of border change wouldhence be classified as having experienced both a split and a merger at the same time.
8

the African continent. As discussed above, unlike the subnational regions themselves, the 1 × 1 degree
pixels can serve as time-constant units of analysis.
Based on the projection of border changes to the grid of pixels, we classify pixels as being subject to
a split or a merger in a given year. Consider subfigure (a) of Figure 3 which shows how Africa is divided
into the 1× 1 degree pixels. Pixels are colored depending on whether they were at least once affected by
splits or mergers over the sample period. As suggested by our discussion in Section 2, and in line with
Figure 1, we observe that more pixels were subject to splits than mergers. There is also a large number
of pixels where the corresponding territory underwent both at least one split and one merger over the
sample period.
3.1.2 Luminosity as proxy for economic development
Following previous literature, we use nighttime luminosity as a proxy for development at low levels of
geography (Alesina et al., 2016; Hodler and Raschky, 2014; Michalopoulos and Papaioannou, 2016;
Bruederle and Hodler, 2018). This data is based on images of the earth at night obtained by satellites
of the US Air Force (USAF) Defense Meteorological Satellite Program Operational Linesman System
(DBMS-OLD). The original imagery is processed by the National Oceanic and Atmospheric Agency
(NOAA) and released to the public as raster datasets.
The raster datasets consist of annual average stable night lights between 8.30pm to 10pm and are
available at a resolution of 30 arc-seconds (about 0.86 square kilometer at the equator) for all years after
1992. Each pixel of the dataset stores a digital value ranging from 0 to 63 indicating the amount of
average light of an area covering 30 arc-seconds. Higher values imply that a pixel emanates more light
(Henderson et al., 2012).
To obtain a proxy for pixel-level GDP, we overlay the grid of pixels over the raster datasets and cal-
culate the sum of the digital values of each cell with size 30 arc-seconds that falls within the boundaries
of each of the 1 × 1 degree pixel as shown in subfigure (a) of Figure 3. Subfigure (b) plots average
night lights over the sample period in each of these pixels. More strongly shaded pixels indicate higher
luminosity. In general, the pattern of pixel-level luminosity matches with anecdotal evidence of African
development. For example, coastal areas tend to have higher luminosity than the hinterland.
3.1.3 Conflict data
We use geocoded data on conflict events from the Armed Conflict Location and Event Data Project
(ACLED) to explore how border changes affect the incidence of conflicts. This dataset collects, inter
alia, information on the location and date of reported conflict events, e. g. violence committed by gov-
ernment forces, rebels, etc. The data covers all countries in Africa over the period 1997-2014. We use
the information on violent conflicts (with fatalities) and project these conflict events on the 1× 1 degree
grid.
9

3.1.4 Afrobarometer data
To study how political attitudes evolve after border changes, we rely on data from the Afrobarometer
surveys. The Afrobarometer surveys are an “independent, nonpartisan research project that measures
the social, political, and economic atmosphere in Africa”.11 There are currently six waves of the survey,
with a varying coverage of countries across waves. Later waves have generally a better coverage (the first
wave covers 12 countries while the sixth wave covers 36 countries). The overall sample size increased
throughout the first six waves, from about 21,000 to about 54,000 respondents.
For the surveys, interviewers conduct face-to-face interviews with representative samples of respon-
dents in each wave and country (1,200 or 2,400 respondents, respectively) and ask several questions
about their personal circumstances as well as their attitudes toward the current political climate. To
explore the effect of border changes on political attitudes, we focus on responses regarding interest in
politics and trust in the executive of the central government (president or prime minister). In addition,
we exploit information on support of democracy, satisfaction with democracy and understanding of
government.
The wording of the questions is not exactly identical across waves, but their content is nearly the same.
Specifically, to measure effects on political attitudes, we use responses to questions with the following
content:
• Trust in president: How much do you trust the president?
• Support democracy: Is democracy preferable to any other kind of government?
• Satisfied democracy: How satisfied are you with the way democracy works in your country?
• Understand government: Politics and government sometimes seem so complicated that you
can’t really understand what’s going on. Do you agree?
• Interest in politics: How interested are you in public affairs?
Responses are on an ordinal scale. We transform the data into binary variables to make them compa-
rable across survey waves. If the relevant dummy variable assumes 1, then this implies higher interest
in politics, more trust in the president, more support and satisfaction of democracy as well as a higher
understanding of government.
3.1.5 Data for ethnic fractionalization
To measure ethnic fractionalization, we rely on a shapefile provided by the Geo-Referencing of Ethnic
Groups (GREG) project. This project uses maps and data from the Soviet Atlas Narodov Mira to geo-
reference ethnic groups across the globe, including Africa. We project the ethnic groups boundaries
on the grid of pixels and count the number of groups that fall within a pixel to construct a measure of
pixel-level ethnic heterogeneity.12
11See http://afrobarometer.org/.
12Note that GREG denotes up to three major ethnic groups in each settlement area. We count all mentioned groups for ourheterogeneity measure. Moreover, GREG measures the spatial location of ethnicities prior to our sample period. Hence, the
10

3.1.6 Data on subnational elections
To measure subnational autonomy, we hand-collect for each country data on whether it had any type of
subnational election during our sample period. The idea is that the existence of subnational elections
likely suggests some degree of subnational political independence. Typically, subnational elections, if
they take place, are held for legislative bodies and/or the regional executive. Table 2 lists which countries
held subnational elections, together with the years in which the elections took place.
3.1.7 Data for covariates
We use geographically disaggregated data on total population, forest cover, urban land area, the age and
gender ratios as controls in some specifications. This data is obtained from various sources.
Data on total population is from the Gridded Population of the World Version 4 dataset, which relies
on population census to model local population at a resolution of 30 arc-seconds. This data is available
in five-year increments starting in 2000. As for the luminosity data, we overlay the grid of pixels over
the raster datasets and calculate the sum of the digital values of each cell of 30 arc-seconds that falls
within the boundaries of a given 1 × 1 pixel. Since we have no annual data for population, we replace
missing population data with the information from the last available year (i. e. the value of a pixel in
2009 is the same as its value in 2005). For years before 2000, i. e. the first year with available data, we
use the value in 2000.
Information on forest cover is from the MODIS Percentage Forest Cover Fraction dataset. This data
is based on satellite imagery of the fraction of an area covered by trees or forests by the MODIS Sensor
(Moderate Resolution Imaging Spectroradiometer). The data is available at a resolution of 250 meter
grid cells and for all years between 2001-2010 from the US Geological Survey and Integrated Climate
Data Center. As for the population data, we aggregate the forest cover data to the level of 1 × 1 grid
cells and replace missing values before 2001 with the value in 2001 and after 2010 with value in 2010.
Disaggregated data on the demographic and gender composition of African regions is taken from
the United Nations Population Division, World Population Prospects (2015 Revision). This dataset is
mainly based on detailed official subnational data and is available for 5-year age groupings, both for
male and female at a resolution of about 0.01 × 0.01 decimal degrees (about 1km × 1km) for 2000 and
2005. As before, we aggregate this 0.01 × 0.01 pixels to our 1 × 1 degree pixels and replace missing
years with the closest available values.
Data on land cover is obtained from the MODIS land surface type dataset from the US Geological
Survey and Integrated Climate Data Center. The data measures the land area fraction by land use type
at a resolution of 0.5 × 0.5 decimal degrees for each year in 2001 to 2012. We use the fraction of urban
or developed land as a measure of urbanized land area. Again, we aggregate the urban land area to the
level of 1 × 1 degree pixels for later analysis.
numbers reflect values before the start of our sample period and accordingly, are not affected by the various border reformsduring our sample period.
11

3.2 Empirical strategy
To estimate the effect of border changes on local development, we implement a difference-in-difference
design using the 1 × 1 degree pixels as units of observations. The basic specification is:
yi,t = αi + γt +βsSpliti,t +βmMergeri,t + εi,t , (1)
where yi,t is log of pixel-level aggregate night light output in pixel i in year t.13 Spliti,t is a dummy that
is one for all T ≤ t ≤ 2013 after a new feature line in the GAUL files emerged in T within the territory
covered by a particular pixel (i. e. from the first split by which a pixel is affected until the end of the
sample period). Similarly, Mergeri,t is a dummy variable that is 1 for all T ≤ t ≤ 2013 after a feature
line vanished within the territory covered by a pixel.14
To account for year-specific continent-wide effects, we include year fixed effects γt . Year fixed effects
also account for annual variations in measured night light output due to different calibrations of the
satellites used to record luminosity. To control for systematic (but time-invariant) differences between
pixels, we include pixel fixed effects (αi). For hypothesis tests, we rely on heteroscedasticity-robust
standard errors that are clustered at the level of the pixels.
As always with difference-in-difference designs, the identifying assumption is that treated and control
pixels would have had common trends in the absence of treatment. This identifying assumption is
particularly important in our context as border changes do not take place randomly. To explore the
robustness of our results to possible violations of the common trends assumption, we control for a
number of time-varying pixel-level variables in robustness tests. We also report results from event-study
regressions where we can observe whether there shocks to nighttime luminosity systematically precede
border changes.
4 Results
4.1 Baseline
4.1.1 Main results
Table 3 collects the baseline results where we relate border changes to night light output. We observe
a positive and significant coefficient for both splits and mergers across all specifications, indicating
that pixels that were affected by either type of border change experience an improvement in economic
conditions, compared to unaffected pixels. More specifically, the results indicate that night light output
is on average about 13% higher after splits and 42% higher after mergers. Using the elasticity between
night-lights and GDP of 0.3 estimated by Henderson et al. (2012), these results imply that splits cause
an increase of GDP by 3.9% while mergers cause an increase of 12.6%.
13For pixels that have a value of 0 for aggregate night light output, we add 1 before taking the log.
14Note that by this definition of the treatment dummies, we implicitly account for the (few) pixels affected by borderchanges in two separate years.
12

While plausible when viewed in isolation, it may appear paradoxical that both splits and mergers
have a positive effect on development. As we show below, an explanation for this apparent paradox
is that splits and mergers work through different transmission channels. However, before exploring
transmission channels, we first establish the robustness of the baseline estimates.
4.1.2 Robustness
Time-varying covariates. To establish the robustness of the previous results, we replicate the baseline
specification after controlling for various time-varying covariates at the pixel-level: population, forest
cover, the share of a pixel that is urbanized, the share of young among the total population (age < 25
years), the share of old (age > 65), and the gender ratio (number of women / men).15
Table 4 collects the results. The share of urban area is the only variable that shows a significant corre-
lation with night light output: as pixels become more urbanized, night light output increases. However,
the estimates for splits and mergers remain virtually unchanged.
Country-specific year effects. While the baseline regressions include year fixed effects and hence
control for continent-wide common shocks, it is possible that countries that implemented border reforms
were from the outset on different economic trajectories than countries that did not experience border
changes.
To establish whether our results are robust to this concern, we re-estimate Equation 1 while including
country-specific rather than continent-wide year fixed effects, i.e. holding institutional and economic
changes at the country-level constant. We hence identify the effect of border changes with within-
country variation. The identifying assumption is that pixels which were not affected by a border change
were on the same economic trajectory than treated pixels within the same country.
Note that it is difficult to define country-level fixed effects in our pixel-based approach. In particular,
pixels may cover two or more countries. As a practical solution to this issue, we assign any pixels that
cover two or more countries to the country which encompasses the largest fraction of a pixel. However,
as a consequence of this, these estimates may be inaccurate and should hence be regarded as suggestive.
The results are collected in Table 5. Despite the issues mentioned above, the estimated coefficients are
similar to the baseline results, suggesting that country-level shocks do not bias the baseline estimates.
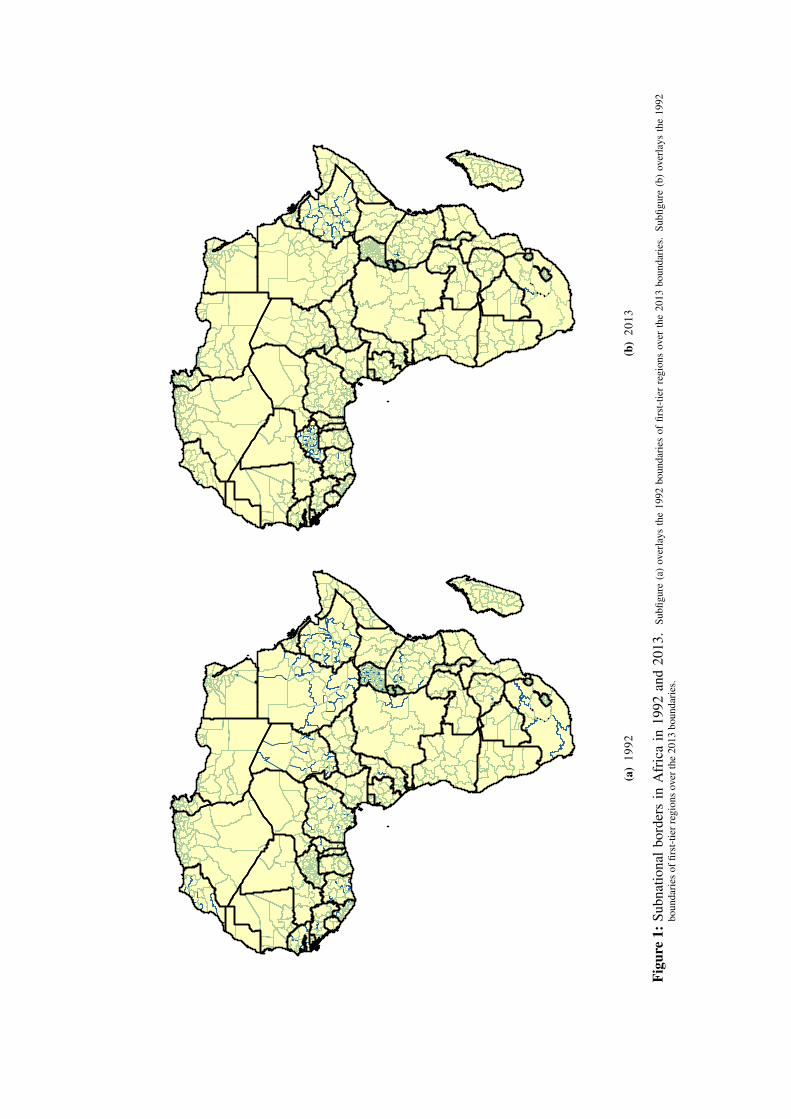
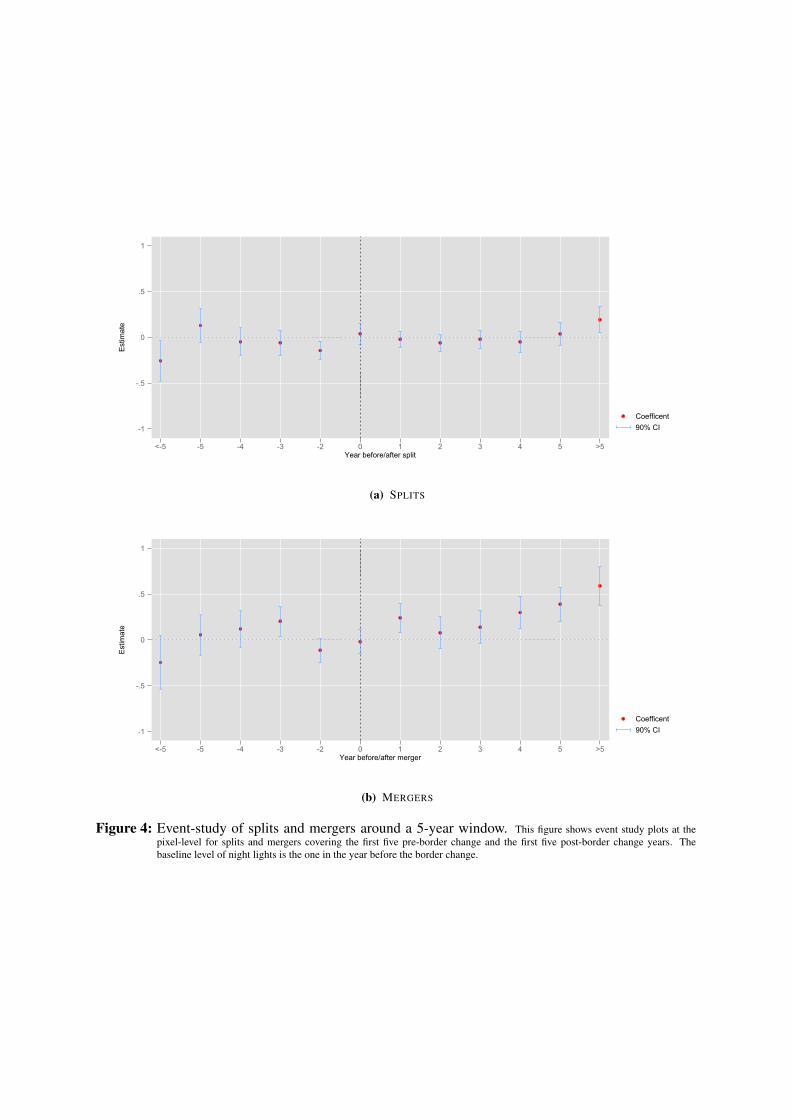
4.2 Event-studies
In this section, we report results from event-study regressions. The main purpose of these specifications
is to asses how quickly the economic benefits of border changes emerge, and thus to gain a more com-
prehensive picture of how border changes affect economic development. In addition, event studies can
help us to evaluate whether border changes are induced by recent economic shocks.
We estimate models of the following form:
15We include all variables in logs.
13

yi,t =αi + γt +β<−5Border changei,t<−5 +−1
∑t=−5
βtBorder changei,t
+5
∑t=1
βtBorder changei,t +βt>5Border changei,t>5 + εi,t ,
(2)
with Border change ∈ {Split,Merger} and t = −1 as the base year. That is, we explore luminosity in
treated pixels in all years before and after a border change relative to luminosity in the year immediately
before the border change. For the first four years before the base year and the first five years after the
border change, we provide annual estimates. For the remaining years, we estimate an average effect over
all remaining years.
We collect the results for splits in subfigure (a) of Figure 4. We observe no obvious trend or shocks,
suggesting that there were no systematic differences in the economic trajectories of pixels affected and
not affected by splits. After a split takes place, we observe no change in night lights for the first five
years. Only after five years, the effect turns significantly positive.
Subfigure (b) reports the results for mergers. As for splits, we observe similar pre-treatment trends
in the treated and control pixels. After a merger, the positive effects accumulate over time. We begin
to observe a significant positive effect from year three onwards. After five years, luminosity is about
50% higher in treated pixels compared to the control pixels. Overall, these results confirm the previous
findings. Mergers have a quick yet persistent effect on night lights while the effects of splits are more
muted.
5 Mechanisms
The above results suggest that the subnational border changes observed in Africa, in particular mergers
but also splits, had on average a positive effect on development. Since these estimates are average
treatment effects on the treated, one conclusion that follows is that those regions which were affected by
border changes were in general not of optimal size. Changing their size and shape led to improvements,
both in the case of mergers and, to a lesser extent, in the case of splits.
It is, however, notable that the estimates for splits and mergers are of significantly different mag-
nitudes.16 This points to different channels through which splits and mergers affect development. In
the following, we focus on two specific channels. First, border changes may increase administrative
efficiency. Splits may increase efficiency if they make it easier for public officials to tap into local
knowledge and to better tailor policies to heterogeneous populations. Mergers may increase efficiency
if they lead to a reduction in administrative overhead and enable public officials to exploit economies of
scale in the provision of public services.
The second channel works through increased political stability. As discussed, one apparent short-
coming of African borders is that similar groups can be either arbitrarily separated into several regions,
or lumped together with dissimilar groups into a single region. Splits and mergers may hence lead to
16Conducting t-tests for the baseline estimates for both mergers and splits yield a significant difference at the 1% level.
14
a better match of the ethnic groups’ historical settlement areas and a country’s current administrative
structure, thereby improving political stability and reducing conflicts. This increase in political stability
may then have positive effects for development.
5.1 The role of ethnic fractionalization
If improved political stability is a relevant channel, we should expect that the economic effects of border
changes depend on whether they have changed the degree of regional ethnic fractionalization. If border
changes increase ethnic homogeneity, i. e. align with the historical settlement areas of ethnic groups,
regional ethnic fractionalization should be reduced (e.g. Grossman and Lewis (2014) and Pierskalla
(2016)). On the other hand, if splits take place in ethnically homogeneous regions or mergers happen
between heterogeneous regions, then regional fractionalization should increase. In this subsection, we
study whether heterogeneous or homogeneous pixels display a stronger effect on night lights after a
border reform. The idea is that if splits or mergers affect luminosity through an improvement in political
stability, we should observe stronger effects for splits in pixels where more ethnic groups live (since the
new borders were presumably drawn in a way to divide two disparate groups) and for mergers in pixels
where fewer groups live (since the vanishing borders might have divided one homogeneous group into
different regions).
Table 6 expands the baseline specification with interaction effects between mergers and splits and
a measure of ethnic fractionalization. Specifically, we construct a count variable to measure ethnic
fractionalization by counting the number of distinct ethnic groups in a pixel.
We find that ethnically heterogeneous pixels experience a strong increase in night lights after a split.
The interaction term between splits and the number of ethnic groups is significantly positive. Accord-
ingly, we conjecture that splits lead to higher growth if they reduce regional ethnic fragmentation. For
mergers, we find no significant differences between homogeneous and heterogeneous pixels. Specifi-
cally, the interaction between the merger dummy and the number of groups is insignificant.
Overall, these results indicate that the weak positive effects of splits found in the baseline regres-
sions comes at least in part from a reduction of political instability in ethnically heterogeneous regions.
For mergers, on the other hand, this channel appears to be unimportant, arguably because subnational
mergers in Africa were implemented for reasons other than to improve political stability.
5.2 Border changes and conflict
To explore the above interpretation further, we next study whether border changes affect the incidence
of conflicts. Specifically, we relate the treatment dummies for splits and mergers to conflict events. The
results are collected in in Table 7. Splits result in about 17% fewer conflicts, while mergers have no
significant effect.
These results reaffirm that one channel through which splits affect development is a reduction of
conflicts. They also suggest that this channel is not relevant for mergers, again because mergers are
presumably intended to achieve other goals than political stability.
15

5.3 Subnational elections
To investigate the link between the specific institutional context and border changes further, we next
study whether splits and mergers are more effective when they are implemented in countries where
subnational units have significant autonomy. It is plausible that subnational autonomy is a necessary
precondition for border changes to reduce (ethnic) conflicts. If a new region is created through a split or
merger, but its policies as well as the chief administrators are still determined at the center, the border
change may be merely symbolic and hence have no substantive consequences.
Table 8 reports regressions where we interact the border change dummy with a dummy for whether
in a given year the country into which (the largest share of) a pixel falls has any type of subnational
elections, which we interpret as a proxy for subnational (political) autonomy. The results indicate that
splits are only effective in increasing growth if they take place in countries with subnational elections.
For mergers, on the other hand, we find no difference in their effect between countries with and without
subnational elections.
5.4 Political attitudes
If splits affect economic development through a reduction in conflicts, we should observe a correspond-
ing change in political attitudes in the affected regions. In particular, inhabitants should be more likely
to be satisfied with the political system. It is also possible that mergers, even if they do not lead to
more conflicts, affect political attitudes. These effects are especially likely if the growth effect found for
mergers is due to cuts in public services and cost savings rather than increased administrative efficiency.
To explore these questions, we use Afrobarometer survey data, which we match to our pixel-level
border change data. We then estimate different variants of the following model:
dn,i,t = αi + γt +βsSpliti,t +βmMergeri,t + εi,t , (3)
where dn,i,t are our re-coded variables that record the response of an individual n residing in pixel i in
year t to one of the five questions on political attitudes discussed in Section 3.1.4. In all regressions we
control for pixel-fixed effects αi and year fixed effects γt , respectively.
The results are collected in Table 9. We find that splits have strong and statistically significant effects
on certain political attitudes. Respondents that were subject to splits show an increase in their trust in the
president. Hence, splits ostensibly increase the satisfaction with the national government. Respondents
also voice a lower interest in politics, which may indicate that potentially divisive conflicts are pacified.
On the other hand, we find no effects on the support for “democracy” nor on how well respondents
“understand government”.
For mergers, in contrast, we find no effects on any of the measures of political attitudes. This indicates
that the positive effect of mergers on growth does not work through political channels. These results are,
however, consistent with the positive effects on luminosity found above as they suggest that mergers do
not lead to a disenchantment with the political process either.
16

5.5 Bureaucratic efficiency
Finally, we study the link between administrative efficiency and border changes further. If mergers
lead to higher luminosity primarily because they imply higher administrative efficiency, then their effect
should be more pronounced in countries that have a more competent bureaucracy. These countries
should be most equipped to fully reap the economies of scale that may come with mergers.
We explore this issue by estimating interaction models of the following form:
yi,t = αi + γt +βbBorder changei,t +βkBureaucratic qualityk,t+
βtBorder changei,t ×Bureaucratic qualityk,t + εi,t ,(4)
with Border changei,t ∈ {Split,Merger} at the pixel-year level and Bureaucratic qualityk,t for country
k in year t. As discussed, we obtain country-level information on government effectiveness as measured
by bureaucratic quality from the International Political Risk Guide. Specifically, we use the composite
score of government effectiveness which is normalized to values between 0 and 1.
Table 10 collects the results. In the most complete specification (Model 3), we find that mergers
are significantly more effective in raising economic activity in countries with higher bureaucratic qual-
ity. This is consistent with the interpretation that one important channel through which mergers affect
luminosity is administrative efficiency.
6 Conclusion
In this paper, we study the economic consequences of subnational border changes in Africa. Tracking
all changes to the borders of of first-level subnational units during 1992-2013 across all of Africa, we
find that territories that were affected by mergers and splits experience stronger economic development
as measured by nighttime luminosity. The effect of mergers is larger and more robust than that of splits,
indicating that these two types of border reforms work through different channels. Indeed, we find
suggestive evidence that splits increase political stability and reduce conflicts, possibly by leading to
more positive political attitudes by the affected inhabitants. On the other hand, we find no effects of
mergers on political attitudes or conflicts. While only circumstantial, this evidence is consistent with the
interpretation that mergers have a positive effect on development because they increase administrative
efficiency. Splits appear to be implemented primarily for political reasons and, as a consequence, have
only second-order, albeit still positive, effects on economic growth.
Overall, these results suggest that the present shape of subnational borders in Africa, just as presum-
ably those of national borders, is inefficient. African governments should in particular consider merging
subnational units. Mergers may increase administrative efficiency and thereby improve economic per-
formance. If, however, their main aim is to reduce ethnic conflicts and foster political stability, then
splits seem to be an effective strategy. They not only achieve these aims, but by doing so also appear to
have positive implications for economic development.
17

References
Abadie, A. and J. Gardeazabal (2003). The economic costs of conflict: A case study of the Basque
Country. American Economic Review 93(1), 113–132.
Alesina, A., W. Easterly, and J. Matuszeski (2011). Artificial states. Journal of the European Economic
Association 9(2), 246–277.
Alesina, A., S. Michalopoulos, and E. Papaioannou (2016, April 2016). Ethnic inequality. Journal of
Political Economy 124(2), 428–488.
Alesina, A. and E. Spolaore (1997). On the number and size of nations. Quarterly Journal of Eco-
nomics 112(4), 1027–1056.
Asher, S. and P. Novosad (2015). The impacts of local control over political institutions: evidence from
state splitting in India. Mimeo.
Bazzi, S. and M. Gudgeon (2016). Local government proliferation, diversity, and conflict. Mimeo.
Bazzi, S., M. Gudgeon, et al. (2018). The political boundaries of ethnic divisions. Technical report,
CEPR Discussion Papers.
Berger, D. (2009). Taxes, institutions, and local governance: evidence from a natural experiment in
colonial Nigeria. Mimeo (New York University).
Blesse, S. and T. Baskaran (2016). Do municipal mergers reduce costs? Evidence from a German federal
state. Regional Science and Urban Economics 59, 54–74.
Blom-Hansen, J., K. Houlberg, and S. Serritzlew (2014). Size, democracy, and the economic costs of
running the political system. American Journal of Political Science 58(4), 790–803.
Bolton, P. and G. Roland (1997). The breakup of nations: a political economy analysis. Quarterly
Journal of Economics 112(4), 1057–1090.
Bruederle, A. and R. Hodler (2018). Nighttime lights as a proxy for human development at the local
level. PloS one 13(9), e0202231.
Burgess, R., M. Hansen, B. A. Olken, P. Potapov, and S. Sieber (2012). The political economy of
deforestration in the tropics. Quarterly Journal of Economics 127, 1707–1754.
Cerra, V. and S. C. Saxena (2008). Growth dynamics: the myth of economic recovery. American
Economic Review 98, 439–457.
Easterly, W. and R. Levine (1997). Africa’s growth tragedy: policies and ethnic divisions. Quarterly
Journal Of Economics 112(4), 1203–1250.
Elaigwu, J. I. (2008). The politics of federalism in Nigeria. Adonis & Abbey Publishers Ltd.
18

Englebert, P. and R. Hummel (2005). Let’s stick together: understanding Africa’s secessionist deficit.
African Affairs 104, 399–427.
Erk, J. (2014). Federalism and decentralization in sub-Saharan Africa: Five patterns of evolution. Re-
gional & Federal Studies 24(5), 535–552.
Fessha, Y. T. (2012). Federalism, territorial autonomy and the management of ethnic diversity in africa:
reading the balance sheet. L’Europe en Formation (1), 265–285.
Fox, W. F. and T. Gurley (2006). Will consolidation improve sub-national governments? World Bank
Working Paper No. 3919.
GAUL (2014). The Global Administrative Unit Layers GAUL 2015: technical aspects of the GAUL
distribution set.
Gottlieb, J., G. Grossman, H. Larreguy, and B. Marx (2019). A signaling theory of distributive policy
choice: Evidence from Senegal. The Journal of Politics 81(2), 000–000.
Green, E. (2010). Patronage, district creation, and reform in Uganda. Studies in Comparative Interna-
tional Development 45(1), 83–103.
Grossman, G. and J. I. Lewis (2014). Administrative unit proliferation. American Political Science
Review 108(1), 196–217.
Grossman, G., J. H. Pierskalla, and E. Boswell Dean (2017). Government fragmentation and public
goods provision. The Journal of Politics 79(3), 823–840.
Hassan, M. (2013). District creation in Kenya under president Moi. Mimeo (University of Michigan).
Henderson, J. V., A. Storeygard, and D. N. Weil (2012). Measuring economic growth from outer space.
American Economic Review 102, 994–1028.
Hodler, R. and P. Raschky (2014). Regional favoritism. Quarterly Journal of Economics 129(2), 995–
1033.
Jerven, M. (2013). Poor numbers: how we are misled by African development statistics and what to do
about it. Cornell University Press.
Lipscomb, M. and A. M. Mobarak (2017). Decentralization and the political economy of water pollution:
Evidence from the re-drawing of county borders in Brazil. Review of Economic Studies 84, 464–502.
Loumeau, G., M. Koethenbuerger, and P. H. Egger (2017). Local border reforms and economic activity.
Makgetla, T. and R. Jackson (2010). Negotiating divisions in a divided land: creating provinces for a
new South Africa. ISS Policy Note.
Michalopoulos, S. and E. Papaioannou (2016). The long-run effects of the scramble for Africa. American
Economic Review 106, 1802–1848.
19

Oates, W. (1999). An essay on fiscal federalism. Journal of Economic Literature 37(3), 1120–1149.
Pickering, S., S. Tanaka, and K. Yamada (2016). The impact of municipal mergers on local public
spending: Evidence from remote-sensing data.
Pierskalla, J., A. De Juan, and M. Montgomery (2017). The territorial expansion of the colonial state:
Evidence from German East-Africa 1890–1909. British Journal of Political Science, 1–27.
Pierskalla, J. H. (2016). Splitting the difference? The politics of district creation in Indonesia. Compar-
ative Politics 48(2), 249–268.
Reingewertz, Y. (2012). Do municipal amalgamations work? Evidence from municipalities in Israel.
Journal of Urban Economics 72, 240–251.
Resnick, D. (2017). Democracy, decentralization, and district proliferation: The case of Ghana. Political
Geography 59, 47–60.
Shenoy, A. (2018). Regional development through place-based policies: Evidence from a spatial dis-
continuity. Journal of Development Economics 130, 173–189.
Swee, E. L. (2015). Together or separate? post-conflict partition, ethnic homogenization, and the provi-
sion of public schooling. Journal of Public Economics 128, 1–15.
Thomson, A. (2010). An Introduction to African Politics. London: Routledge.
Treisman, D. (2008). Decentralization Dataset. http://www.sscnet.ucla.edu/polisci/faculty/
treisman/.
Zodrow, G. R. and P. Mieszkowski (1986). Pigou, Tiebout, property taxation and the under-provision of
local public goods. Journal of Urban Economics 19, 356–370.
20
(a)
1992
(b)
2013
Figu
re1:
Subn
atio
nal
bord
ers
inA
fric
ain
1992
and
2013
.Su
bfigu
re(a
)ov
erla
ysth
e19
92bo
unda
ries
offir
st-t
ier
regi
ons
over
the
2013
boun
dari
es.
Subfi
gure
(b)
over
lays
the
1992
boun
dari
esof
first
-tie
rreg
ions
over
the
2013
boun
dari
es.

650
700
750
800
Num
ber o
f reg
ions
1990 1995 2000 2005 2010 2015Year
Figure 2: Number of first-level regions in Africa, 1992-2013.
22

Lege
nd No bo
rder c
hang
eOn
ly sp
litOn
ly me
rger
Both
(a)
BO
RD
ER
CH
AN
GE
S
Lege
ndAv
erage
nigh
t ligh
ts, 19
92-20
130 -
100
100 -
500
500 -
1000
1000
- 200
020
00 - 5
000
5000
- 100
0010
000 -
5000
00
(b)
NIG
HT
LIG
HT
OU
TP
UT
Figu
re3:
Bor
derc
hang
esan
dlig
htou
tput
atth
epi
xel-
leve
l.Su
bfigu
re(a
)sho
ws
the
pixe
lsaf
fect
edby
asp
lit,m
erge
r,or
both
duri
ngth
esa
mpl
epe
riod
.Sub
figur
e(b
)sho
ws
aver
age
nigh
tlig
htou
tput
ofea
chpi
xels
over
the
sam
ple
peri
od.
-1
-.5
0
.5
1
Estim
ate
<-5 -5 -4 -3 -2 0 1 2 3 4 5 >5Year before/after split
Coefficent90% CI
(a) SPLITS
-1
-.5
0
.5
1
Estim
ate
<-5 -5 -4 -3 -2 0 1 2 3 4 5 >5Year before/after merger
Coefficent90% CI
(b) MERGERS
Figure 4: Event-study of splits and mergers around a 5-year window. This figure shows event study plots at thepixel-level for splits and mergers covering the first five pre-border change and the first five post-border change years. Thebaseline level of night lights is the one in the year before the border change.

Tabl
e1:
BO
RD
ER
CH
AN
GE
SIN
AF
RIC
A
Yea
rSp
lits
Mer
gers
1994
Eth
iopi
a;So
uthA
fric
a;Su
dan
Eth
iopi
a;So
uthA
fric
a
1995
Con
go
1996
Gui
nea
1997
Cot
ed’I
voir
e;D
RC
Con
go;
Mor
occo
;N
iger
ia;
Zim
-ba
bwe
Cot
ed’I
voir
e;M
oroc
co;N
iger
ia
1998
Bur
undi
;Eth
iopi
a
1999
Ben
in
2000
Cha
d;C
oted
’Ivo
ire;
Lib
eria
;Sud
anC
had
2001
Cot
ed’I
voir
e;L
iber
iaB
urki
naFa
so
2002
Con
go;S
eneg
al;T
anza
nia
Sene
gal
2003
Con
goG
ambi
a
2005
Sout
hAfr
ica;
Uga
nda
Sout
hAfr
ica
2006
Rw
anda
;Sud
an;U
gand
aR
wan
da
2007
Uga
nda
2008
Sene
gal
2009
Egy
pt;U
gand
a
2010
Uga
nda
Uga
nda
2011
Con
go;S
udan
2012
Cot
ed’I
voir
e;Ta
nzan
iaC
oted
’Ivo
ire;
Tanz
ania
2013
Moz
ambi
que
Thi
sta
ble
colle
cts
whi
chco
untr
ies
unde
r-w
entb
orde
rcha
nges
(eith
ersp
litor
mer
gers
)dur
ing
the
sam
ple
peri
od.
25

Table 2: SUBNATIONAL ELECTIONS IN AFRICA IN SAMPLE PERIOD
Country Regional elections(Years of elections)
Algeria Yes (1997,2002,2007,2012)
Angola No
Botswana Yes (1994,1999,2004,2009)
Cameroon No
Central African Republic No
Chad No
Congo Yes (2002,2008)
Cote d’Ivoire No
Democratic Republic of the Congo Yes (2007)
Equatorial Guinea No
Eritrea Yes (1993,1997,2002,2004)
Gabon No
Gambia Yes (2002,2008,2013)
Ghana Yes (1996,2000,2004,2008,2012)
Guinea-Bissau No
Lesotho Yes (2005,2011)
Liberia No
Libya No
Malawi No
Mali Yes (1999,2004,2009)
Mauritania No
Morocco No
Mozambique Yes (1998,2003,2009)
Namibia Yes (1992,1998,2004,2010)
Niger No
Nigeria Yes (1992,1999,2003,2007,2011)
Rwanda No
Senegal Yes (1996,2002,2009)
Sierra Leone No
Somalia No
South Africa Yes (1994,1999,2004,2009)
Sudan Yes (2010)
Swaziland No
Togo No
Tunisia No
Uganda Yes (1997,2001,2002)
Western Sahara No
Zambia No
Zimbabwe Yes (2013)
Burkina Faso Yes (2012)
Burundi No
Guinea No
Madagascar Yes (2008)
United Republic of Tanzania No
Kenya No
Egypt Yes (2002,2008)
Ethiopia Yes (2000,2005,2010)
Benin Yes (2002,2008)
This table collects information on whether African countries had elections at the regional levelin the 1992–2013 period (election years in parentheses). The sources for this data are availableon request.
26
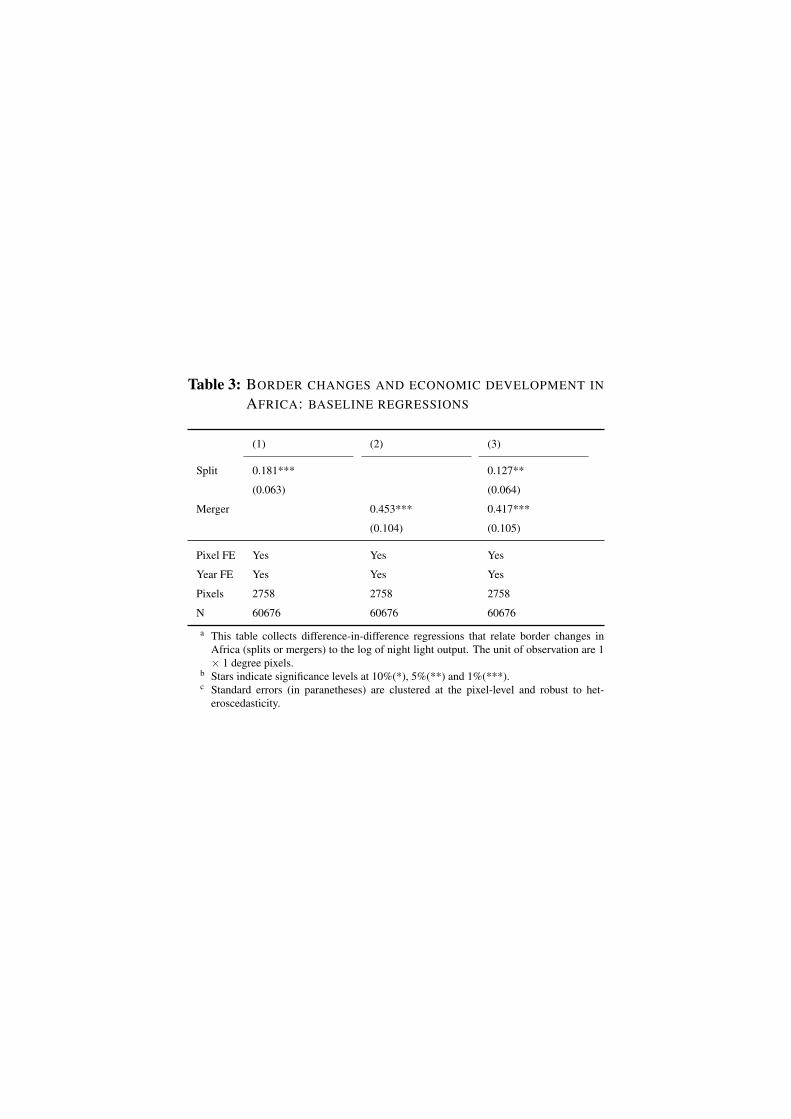
Table 3: BORDER CHANGES AND ECONOMIC DEVELOPMENT IN
AFRICA: BASELINE REGRESSIONS
(1) (2) (3)
Split 0.181*** 0.127**
(0.063) (0.064)
Merger 0.453*** 0.417***
(0.104) (0.105)
Pixel FE Yes Yes Yes
Year FE Yes Yes Yes
Pixels 2758 2758 2758
N 60676 60676 60676
a This table collects difference-in-difference regressions that relate border changes inAfrica (splits or mergers) to the log of night light output. The unit of observation are 1× 1 degree pixels.
b Stars indicate significance levels at 10%(*), 5%(**) and 1%(***).c Standard errors (in paranetheses) are clustered at the pixel-level and robust to het-
eroscedasticity.

Table 4: BORDER CHANGES AND ECONOMIC GROWTH IN AFRICA:REGRESSIONS WITH PIXEL-LEVEL COVARIATES
(1) (2) (3)
Split 0.181*** 0.128**
(0.063) (0.064)
Merger 0.446*** 0.410***
(0.104) (0.106)
Population -0.027 -0.004 -0.011
(0.144) (0.143) (0.144)
Forest cover -0.011 -0.010 -0.010
(0.018) (0.018) (0.018)
Urban share 0.369*** 0.369*** 0.374***
(0.109) (0.106) (0.109)
Young share 67.190 62.355 61.807
(61.386) (65.365) (65.051)
Old share 1.379 0.902 0.631
(16.750) (16.915) (16.902)
Gender ratio -24.191 -23.372 -22.260
(58.068) (58.853) (58.897)
Pixel FE Yes Yes Yes
Year FE Yes Yes Yes
Pixels 2758 2758 2758
N 60676 60676 60676
a This table collects difference-in-difference regressions that relate border changes in Africa(splits or mergers) to the log of night light output. The unit of observation are 1× 1 degreepixels.
b Stars indicate significance levels at 10%(*), 5%(**) and 1%(***).c Standard errors (in paranetheses) are clustered at the pixel-level and robust to heteroscedas-
ticity.

Table 5: BORDER CHANGES AND ECONOMIC GROWTH IN
AFRICA: REGRESSIONS WITH COUNTRY-SPECIFIC
YEAR EFFECTS
(1) (2) (3)
Split 0.161** 0.133*
(0.074) (0.074)
Merger 0.369*** 0.340***
(0.124) (0.124)
Pixel FE Yes Yes Yes
Year FE Yes Yes Yes
Pixels 2758 2758 2758
N 60676 60676 60676
a This table collects difference-in-difference regressions that relate border changes inAfrica (splits or mergers) to the log of night light output. The unit of observation are 1× 1 degree pixels.
b Stars indicate significance levels at 10%(*), 5%(**) and 1%(***).c Standard errors (in paranetheses) are clustered at the pixel-level and robust to het-
eroscedasticity.
Table 6: BORDER-INDUCED ETHNIC CHANGES AND ECONOMIC EFFECTS
(1) (2) (3)
Split -0.123 -0.126
(0.129) (0.128)
Split × Ethnic groups 0.112** 0.095*
(0.050) (0.049)
Merger 0.050 0.073
(0.261) (0.262)
Merger × Ethnic groups 0.134 0.113
(0.098) (0.098)
Pixel FE Yes Yes Yes
Year FE Yes Yes Yes
Pixels 2684 2684 2684
N 59048 59048 59048
a This table collects interaction models of the number of ethnicities in a 1 × 1 degree pixel with a treatmentdummy on whether that pixel was affected by a merger or split in a specific year and all subsequentyears. We relate border changes in Africa (splits or mergers) to the log of night light output. The unit ofobservation are 1 × 1 degree pixels.
b Stars indicate significance levels at 10%(*), 5%(**) and 1%(***).c Standard errors (in paranetheses) are clustered at the pixel-level and robust to heteroscedasticity.
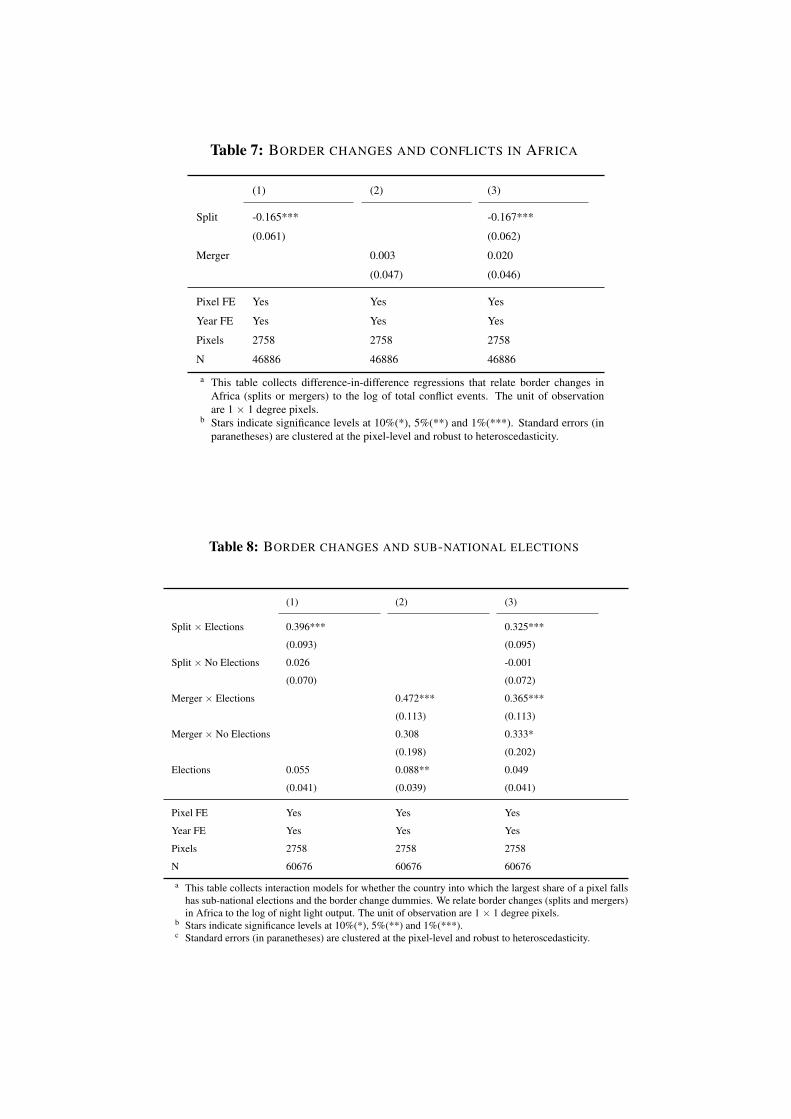
Table 7: BORDER CHANGES AND CONFLICTS IN AFRICA
(1) (2) (3)
Split -0.165*** -0.167***
(0.061) (0.062)
Merger 0.003 0.020
(0.047) (0.046)
Pixel FE Yes Yes Yes
Year FE Yes Yes Yes
Pixels 2758 2758 2758
N 46886 46886 46886
a This table collects difference-in-difference regressions that relate border changes inAfrica (splits or mergers) to the log of total conflict events. The unit of observationare 1 × 1 degree pixels.
b Stars indicate significance levels at 10%(*), 5%(**) and 1%(***). Standard errors (inparanetheses) are clustered at the pixel-level and robust to heteroscedasticity.
Table 8: BORDER CHANGES AND SUB-NATIONAL ELECTIONS
(1) (2) (3)
Split × Elections 0.396*** 0.325***
(0.093) (0.095)
Split × No Elections 0.026 -0.001
(0.070) (0.072)
Merger × Elections 0.472*** 0.365***
(0.113) (0.113)
Merger × No Elections 0.308 0.333*
(0.198) (0.202)
Elections 0.055 0.088** 0.049
(0.041) (0.039) (0.041)
Pixel FE Yes Yes Yes
Year FE Yes Yes Yes
Pixels 2758 2758 2758
N 60676 60676 60676
a This table collects interaction models for whether the country into which the largest share of a pixel fallshas sub-national elections and the border change dummies. We relate border changes (splits and mergers)in Africa to the log of night light output. The unit of observation are 1 × 1 degree pixels.
b Stars indicate significance levels at 10%(*), 5%(**) and 1%(***).c Standard errors (in paranetheses) are clustered at the pixel-level and robust to heteroscedasticity.

Table 9: BORDER CHANGES AND POLITICAL ATTITUDES: EVIDENCE FROM AFROBAROMETER
(Trust in president) (Support democracy) (Satisfied withdemocracy)
(Understand govern-ment)
(Interest in politics)
Split 0.122*** 0.022 0.010 -0.013 -0.149***
(0.042) (0.015) (0.030) (0.024) (0.021)
Merger -0.042 0.016 0.041 0.000 -0.006
(0.056) (0.018) (0.030) (0.050) (0.019)
Pixel FE Yes Yes Yes Yes Yes
Year FE Yes Yes Yes Yes Yes
Regions 1005 1065 1065 837 1065
N 92071 151014 152273 89215 166656
F 9.226 3016.583 12.210 123.103 243.726
a This table collects difference-in-difference regressions that relate border changes in Africa (splits or mergers) to survey evidence onpolitical attitudes from the Afrobarometer. The unit of observation are individual survey respondents.
b Stars indicate significance levels at 10%(*), 5%(**) and 1%(***).c Standard errors (in paranetheses) are clustered at the pixel-level and robust to heteroscedasticity.
Table 10: BORDER CHANGES AND ECONOMIC DEVELOPMENT IN AFRICA: THE
EFFECT OF BUREAUCRATIC QUALITY
(1) (2) (3)
Split 0.102 0.098
(0.066) (0.068)
Split × Bureaucratic quality 0.459** 0.159
(0.214) (0.232)
Merger 0.296** 0.269**
(0.120) (0.123)
Merger × Bureaucratic quality 0.822** 0.750*
(0.369) (0.402)
Bureaucratic quality -0.152 -0.146 -0.161
(0.175) (0.171) (0.174)
Region FE Yes Yes Yes
Year FE Yes Yes Yes
Regions 2438 2438 2438
N 50148 50148 50148
a This table depicts the interaction effects of splits and mergers with a measure for bureaucratic quality fromthe International Country Risk Guide. The outcome variable is log of night light output at the 1 × 1 degreepixel-level.
b Stars indicate significance levels at 10%(*), 5%(**) and 1%(***).c Standard errors (in parentheses) are clustered at the pixel-level and robust to heteroscedasticity.

ZEW – Leibniz-Zentrum für Europäische Wirtschaftsforschung GmbH MannheimZEW – Leibniz Centre for European Economic Research
L 7,1 · 68161 Mannheim · Germany Phone +49 621 1235-01 [email protected] · zew.de
Discussion Papers are intended to make results of ZEW research promptly avail able to other economists in order to encourage discussion and suggestions for revisions. The authors are solely respons ible for the contents which do not necessarily represent the opinion of the ZEW.
IMPRINT
//
Download ZEW Discussion Papers from our ftp server:
http://ftp.zew.de/pub/zew-docs/dp/
or see:
https://www.ssrn.com/link/ZEW-Ctr-Euro-Econ-Research.html https://ideas.repec.org/s/zbw/zewdip.html