

PitNews.com Magazine December 006
50
Transcript of PitNews.com Magazine December 006
�PitNews.com Magazine December �006 ��
Disclaimer: The risk of loss in trading futures, options, stocks, and forex can be substantial. See Page 6 for more information.
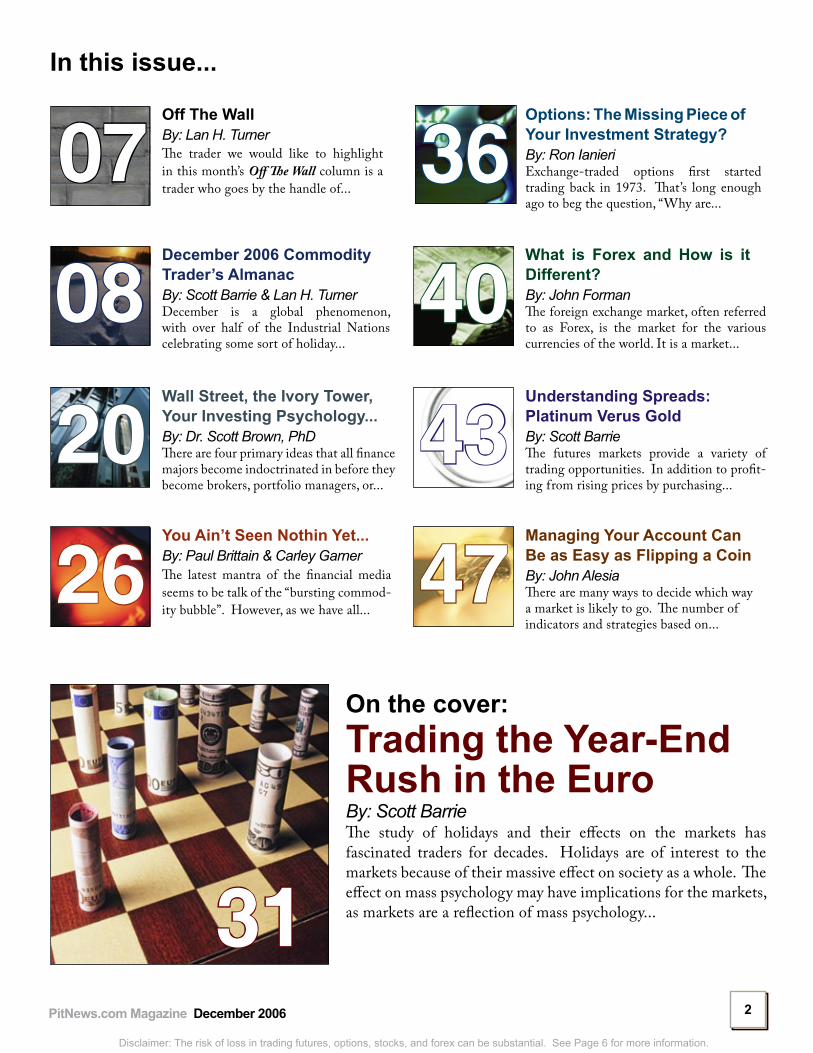
Off The WallBy: Lan H. TurnerThe trader we would like to highlight in this month’s Off The Wall column is a trader who goes by the handle of...
07Options: The Missing Piece of Your Investment Strategy?By: Ron IanieriExchange-traded options first started trading back in 1973. That’s long enough ago to beg the question, “Why are...
36December �006 Commodity Trader’s AlmanacBy: Scott Barrie & Lan H. TurnerDecember is a global phenomenon, with over half of the Industrial Nations celebrating some sort of holiday...
08What is Forex and How is it Different?By: John FormanThe foreign exchange market, often referred to as Forex, is the market for the various currencies of the world. It is a market...
40Wall Street, the Ivory Tower, Your Investing Psychology...By: Dr. Scott Brown, PhDThere are four primary ideas that all finance majors become indoctrinated in before they become brokers, portfolio managers, or...
20Understanding Spreads: Platinum Verus GoldBy: Scott BarrieThe futures markets provide a variety of trading opportunities. In addition to profit-ing from rising prices by purchasing...
43You Ain’t Seen Nothin Yet...By: Paul Brittain & Carley GarnerThe latest mantra of the financial media seems to be talk of the “bursting commod-ity bubble”. However, as we have all...
26Managing Your Account Can Be as Easy as Flipping a Coin By: John Alesia There are many ways to decide which way a market is likely to go. The number of indicators and strategies based on...
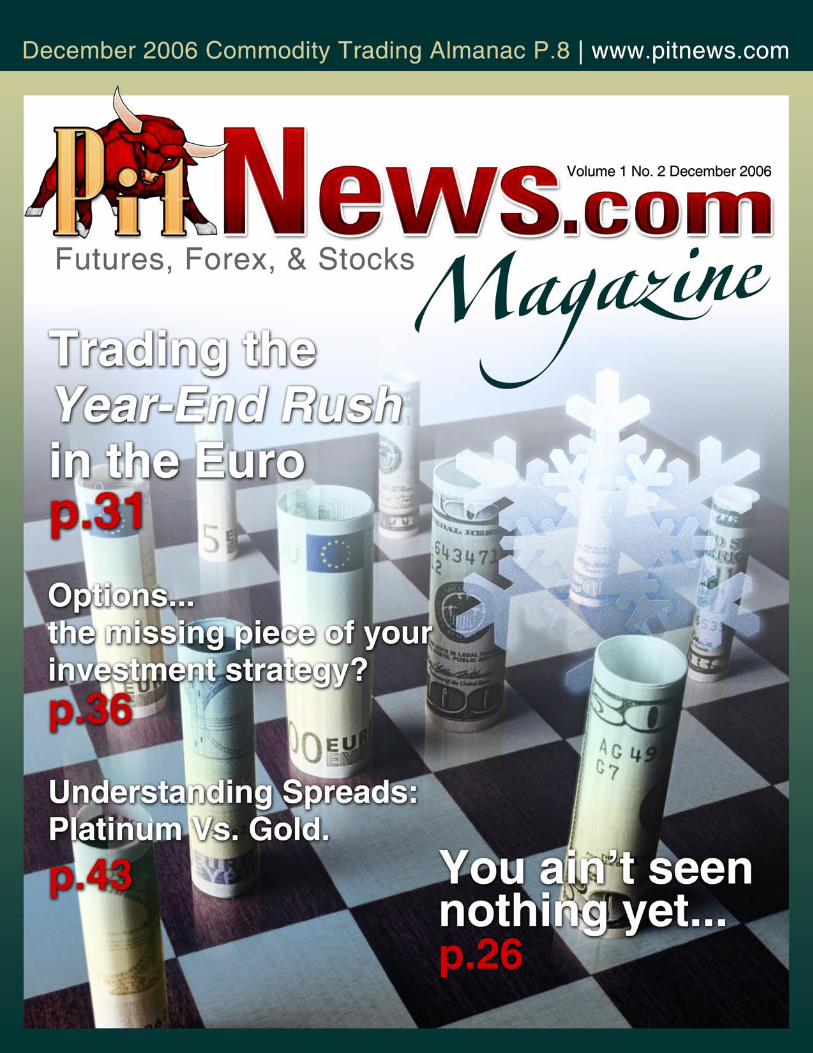
47On the cover:Trading the Year-End Rush in the Euro By: Scott BarrieThe study of holidays and their effects on the markets has fascinated traders for decades. Holidays are of interest to the markets because of their massive effect on society as a whole. The effect on mass psychology may have implications for the markets, as markets are a reflection of mass psychology...31
In this issue...
�PitNews.com Magazine December �006 ��
Disclaimer: The risk of loss in trading futures, options, stocks, and forex can be substantial. See Page 6 for more information.
Editor’s NoteT his issue began with an assortment of seemingly unrelated articles.
They were written by authors of different backgrounds and with diverse points of view, discussing very distinct topics. As the publication started to take shape, however, a theme emerged from the once disparate components.
The theme for this month’s issue is strategy.
One of the best metaphors for trading, in my opinion, is the game of chess. Like trading, it requires a lot of planning, a little audacity, good judgment, and education to develop a good strategy.
If you’ve played much chess, you know that there are certain sequences of moves, which, if planned properly, work almost every time. Seasonals specialist Scott Barrie has a few “moves” of his own, featured in The Commodity Trader’s Almanac, Trading the Year-End Rush in the Euro, and Understanding Spreads: Platinum vs. Gold.
One of the best ways to improve your strategy is to try new things. If you’ve never undertaken options (page 36) or forex trading (page 40), it might be just the shot in the arm your strategy needs.
Sometimes your hopes of winning a game are all but gone. What’s the smart thing to do? Settle for a draw, so that you can have another shot at victory. John Alesia’s Managing Your Account Can Be as Easy as Flipping a Coin follows the same principle: minimize your losses so that you can stick around to profit in the future.
Observation and research are important, too. Have a look at the trade we pulled “Off the Wall”, then learn more about the markets by studying Wall Street and the Ivory Tower, and You Ain’t Seen Nothin Yet.
This is our second issue of PitNews.com Magazine folks, and you really ain’t seen nothin yet.
Kimberly Lyon
Managing EditorPitNews.com Magazine
Editor in Chief:Lan H. Turner
Editor: Scott [email protected]
Managing Editor: Kimberly [email protected]
Art Director: Matt Langenheim
Editorial Consultant: Janie Russell
Controller: Sharon Rosinski
National Sales Manager: Todd [email protected] x 190
International Relations: Claire [email protected]
Webmasters: Jacob AnawaltNick Russell
Website:http://www.pitnews.com
Email:[email protected]
6PitNews.com Magazine December �006 66
Disclaimer: The risk of loss in trading futures, options, stocks, and forex can be substantial. See Page 6 for more information.
GENERAL DISCLAIMER: THE DATA CONTAINED HEREIN IS BELIEVED TO BE RELIABLE BUT CANNOT BE GUARANTEED AS TO RELIABLILITY, ACCURACY, OR COMPLETENESS; AND, AS SUCH IS SUBJECT TO CHANGE WITHOUT NO-TICE. PITNEWS.COM, ITS EMPLOYEES AND CONTRACTORS WILL NOT BE RESPONSIBLE FOR ANY-THING WHICH MAY RESULT FROM RELIANCE ON THIS DATA OR THE OPINIONS EXPRESSED HEREIN.
DISCLOSURE OF RISK: THE RISK OF LOSS IN TRADING CAN BE SUBSTANTIAL; THEREFORE, ONLY GENUINE RISK FUNDS SHOULD BE USED. SPECULATIVE VEHICLES SUCH AS FUTURES, OPTIONS, AND FOREX MAY NOT BE SUITABLE INVESTMENTS FOR ALL INDIVIDUALS, AND INDIVIDUALS SHOULD CAREFULLY CONSIDER THEIR FINANCIAL CONDITION IN DECIDING WHETHER TO TRADE. OPTION TRADERS SHOULD BE AWARE THAT THE EXERCISE OF A LONG OPTION WOULD RESULT IN A FUTURES POSITION.
SEASONAL DISCLAIMER: SEASONAL TENDENCIES ARE A COMPOSITE OF SOME OF THE MOST CONSISTENT COMMODITY FU-TURES SEASONALS THAT HAVE OCCURRED IN THE PAST 15 YEARS. THERE ARE USUALLY UNDERLY-ING, FUNDAMENTAL CIRCUMSTANCES THAT OCCUR ANNUALLY THAT TEND TO CAUSE THE FUTURES MARKETS TO REACT IN SIMILAR DIRECTIONAL MANNER DURING A CERTAIN CALENDAR YEAR. EVEN IF A SEASONAL TENDENCY OCCURS IN THE FUTURE, IT MAY NOT RESULT IN A PROFITABLE TRANSAC-TION AS FEES AND THE TIMING OF THE ENTRY AND LIQUIDATION MAY IMPACT ON THE RESULTS. NO REPRESENTATION IS BEING MADE THAT ANY ACCOUNT HAS IN THE PAST, OR WILL IN THE FUTURE, ACHIEVE PROFITS USING THESE RECOMMENDATIONS. NO REPRESENTATION IS BEING MADE THAT PRICE PATTERNS WILL RECUR IN THE FUTURE.
HYPOTHETICAL PERFORMANCE: RESULTS HAVE MANY INHERENT LIMITATIONS, SOME OF WHICH ARE DESCRIBED BELOW. NO REPRE-SENTATION IS BEING MADE THAT ANY ACCOUNT WILL, OR IS LIKELY TO, ACHIEVE PROFITS OR LOSS-ES SIMILAR TO THOSE SHOWN. IN FACT, THERE ARE FREQUENTLY SHARP DIFFERENCES BETWEEN HYPOTHETICAL PERFORMANCE RESULTS AND THE ACTUAL RESULTS SUBSEQUENTLY ACHIEVED BY ANY PARTICULAR TRADING PROGRAM. ONE OF THE LIMITATIONS OF HYPOTHETICAL PERFORMANCE RESULTS IS THAT THEY ARE GENERALLY PREPARED WITH THE BENEFIT OF HINDSIGHT. IN ADDITION, HYPOTHETICAL TRADING DOES NOT INVOLVE FINANCIAL RISK, AND NO HYPOTHETICAL TRADING RECORD CAN COMPLETELY ACCOUNT FOR THE IMPACT OF FINANCIAL RISK IN ACTUAL TRADING. FOR EXAMPLE, THE ABILITY TO WITHSTAND LOSSES OR TO ADHERE TO A PARTICULAR TRADING PRO-GRAM, IN SPITE OF TRADING LOSSES, ARE MATERIAL POINTS WHICH CAN ALSO ADVERSELY AFFECT ACTUAL TRADING RESULTS. THERE ARE NUMEROUS OTHER FACTORS RELATED TO THE MARKETS, IN GENERAL, OR TO THE IMPLEMENTATION OF ANY SPECIFIC TRADING PRO GRAM WHICH CANNOT BE FULLY ACCOUNTED FOR IN THE PREPARATION OF HYPOTHETICAL PERFORMANCE RESULTS AND ALL OF WHICH CAN ADVERSELY AFFECT ACTUAL TRADING RESULTS.
�PitNews.com Magazine December �006 ��
Disclaimer: The risk of loss in trading futures, options, stocks, and forex can be substantial. See Page 6 for more information.
Off theWALL
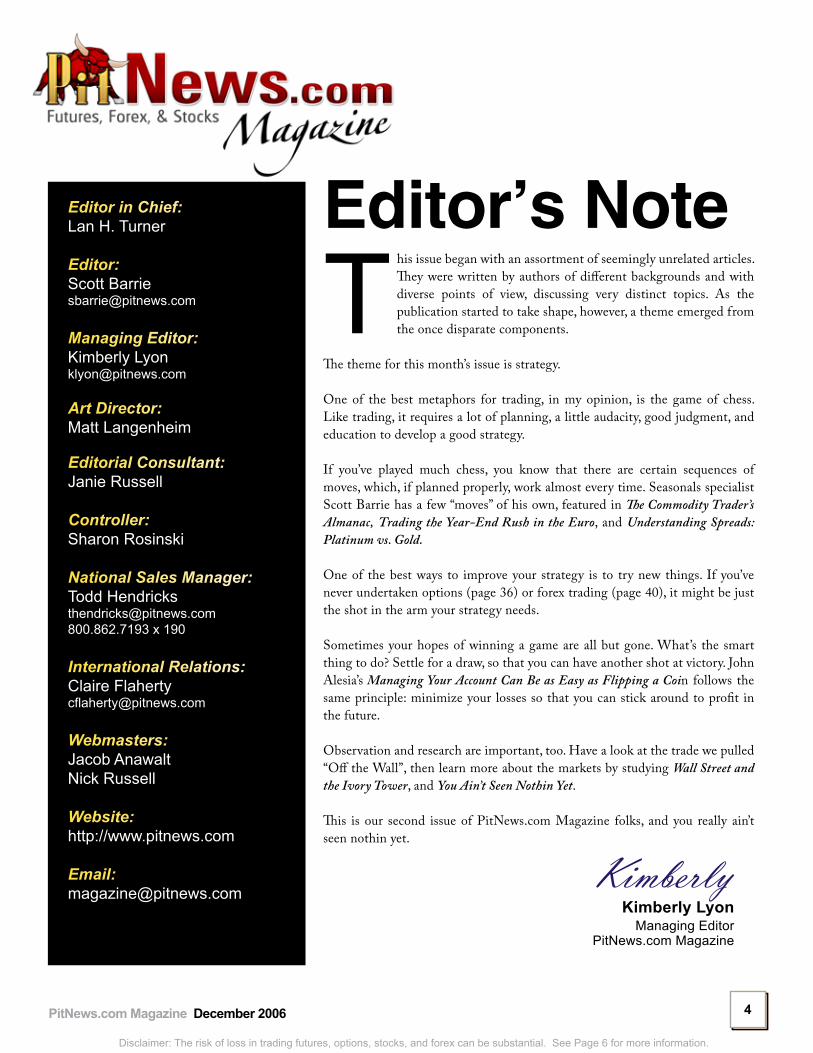
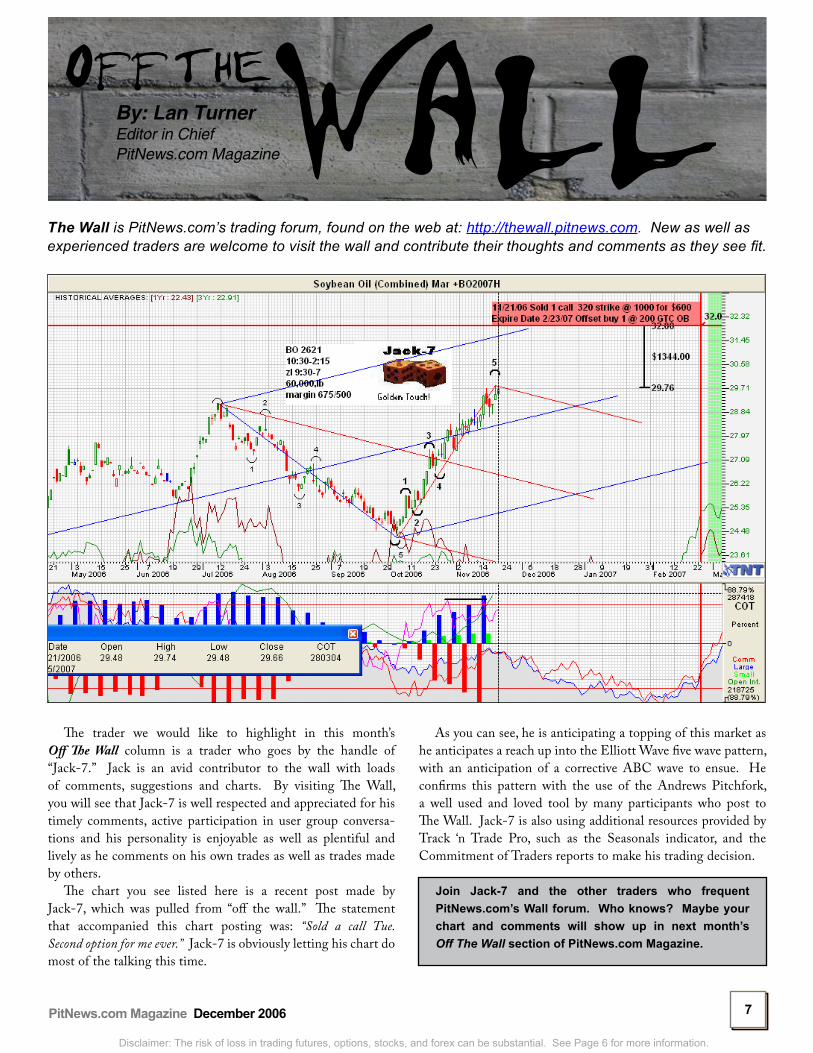
The trader we would like to highlight in this month’s Off The Wall column is a trader who goes by the handle of “Jack-7.” Jack is an avid contributor to the wall with loads of comments, suggestions and charts. By visiting The Wall, you will see that Jack-7 is well respected and appreciated for his timely comments, active participation in user group conversa-tions and his personality is enjoyable as well as plentiful and lively as he comments on his own trades as well as trades made by others.
The chart you see listed here is a recent post made by Jack-7, which was pulled from “off the wall.” The statement that accompanied this chart posting was: “Sold a call Tue. Second option for me ever.” Jack-7 is obviously letting his chart do most of the talking this time.
As you can see, he is anticipating a topping of this market as he anticipates a reach up into the Elliott Wave five wave pattern, with an anticipation of a corrective ABC wave to ensue. He confirms this pattern with the use of the Andrews Pitchfork, a well used and loved tool by many participants who post to The Wall. Jack-7 is also using additional resources provided by Track ‘n Trade Pro, such as the Seasonals indicator, and the Commitment of Traders reports to make his trading decision.
By: Lan Turner Editor in ChiefPitNews.com Magazine
The Wall is PitNews.com’s trading forum, found on the web at: http://thewall.pitnews.com. New as well as experienced traders are welcome to visit the wall and contribute their thoughts and comments as they see fit.
Join Jack-� and the other traders who frequent PitNews.com’s Wall forum. Who knows? Maybe your chart and comments will show up in next month’s Off The Wall section of PitNews.com Magazine.
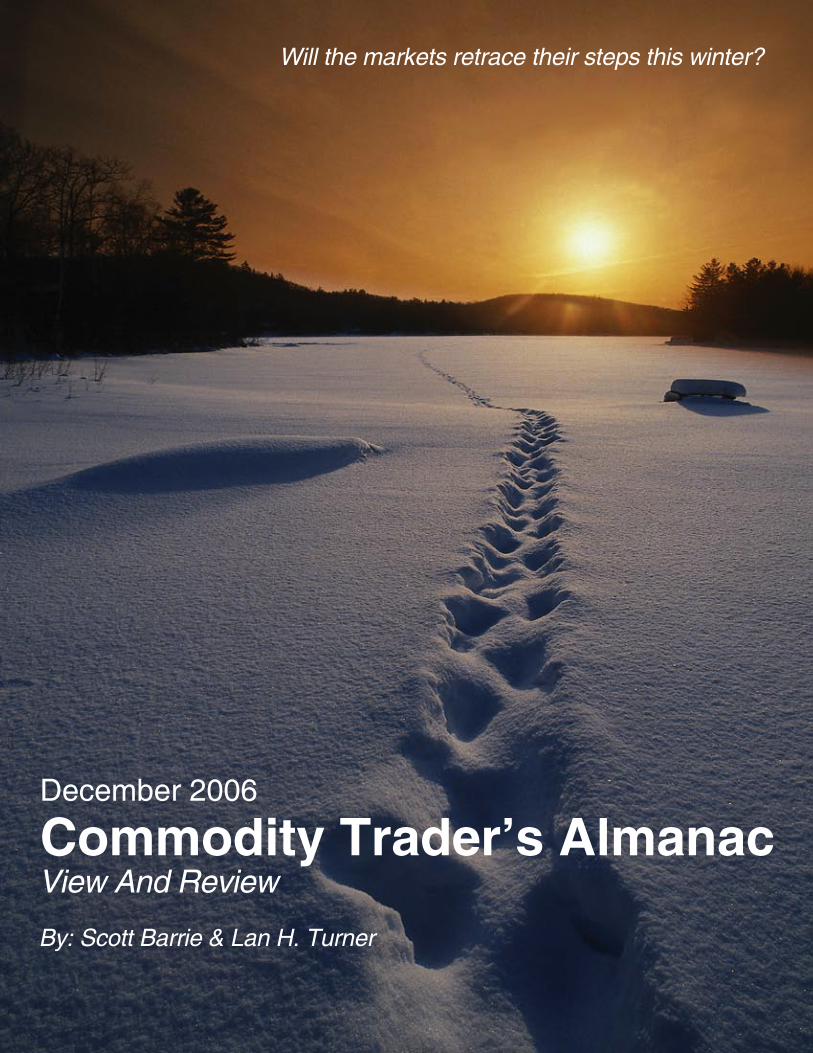
December 2006
Commodity Trader’s Almanac View And Review
By: Scott Barrie & Lan H. Turner
Will the markets retrace their steps this winter?
�PitNews.com Magazine December �006 ��
Disclaimer: The risk of loss in trading futures, options, stocks, and forex can be substantial. See Page 6 for more information.
future supply usually equates to higher prices, if demand (usage) at least stays constant.
In the last decade and a half, March Sugar futures have risen 12 times (80%) between the 11th to last trading day of December through the first trading day of January.
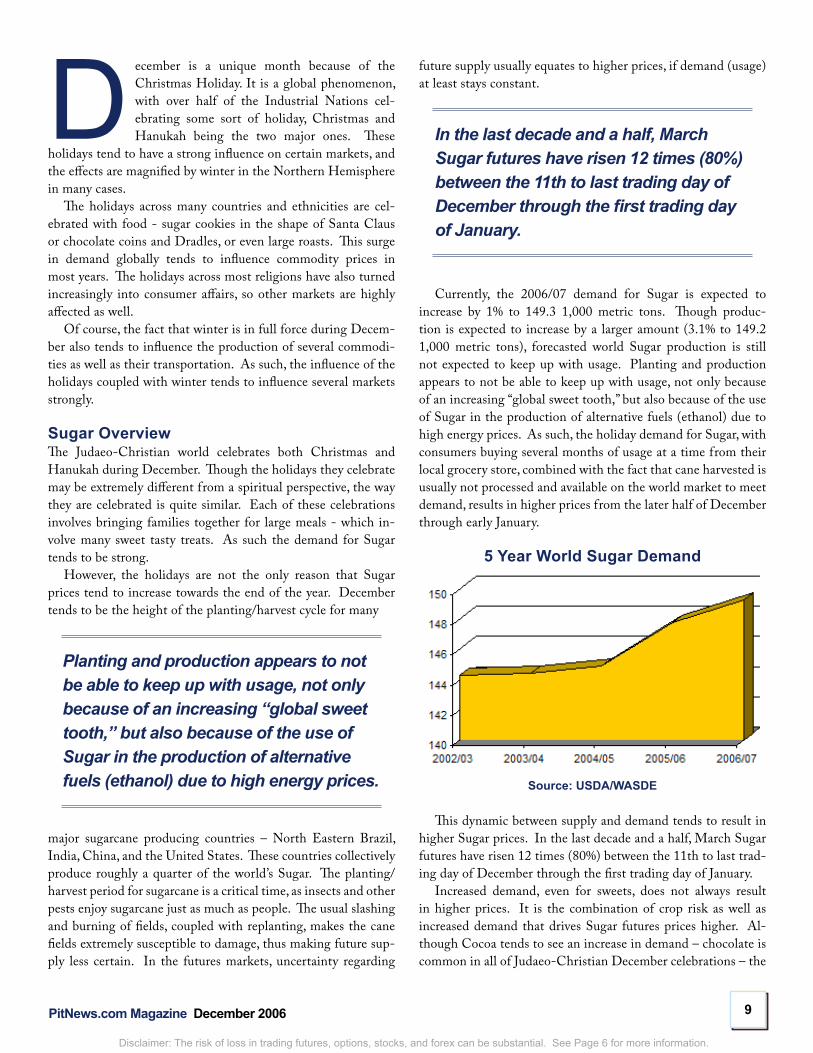
Currently, the 2006/07 demand for Sugar is expected to increase by 1% to 149.3 1,000 metric tons. Though produc-tion is expected to increase by a larger amount (3.1% to 149.2 1,000 metric tons), forecasted world Sugar production is still not expected to keep up with usage. Planting and production appears to not be able to keep up with usage, not only because of an increasing “global sweet tooth,” but also because of the use of Sugar in the production of alternative fuels (ethanol) due to high energy prices. As such, the holiday demand for Sugar, with consumers buying several months of usage at a time from their local grocery store, combined with the fact that cane harvested is usually not processed and available on the world market to meet demand, results in higher prices from the later half of December through early January.
5 Year World Sugar Demand
Source: USDA/WASDE
This dynamic between supply and demand tends to result in higher Sugar prices. In the last decade and a half, March Sugar futures have risen 12 times (80%) between the 11th to last trad-ing day of December through the first trading day of January.
Increased demand, even for sweets, does not always result in higher prices. It is the combination of crop risk as well as increased demand that drives Sugar futures prices higher. Al-though Cocoa tends to see an increase in demand – chocolate is common in all of Judaeo-Christian December celebrations – the
D ecember is a unique month because of the Christmas Holiday. It is a global phenomenon, with over half of the Industrial Nations cel-ebrating some sort of holiday, Christmas and Hanukah being the two major ones. These
holidays tend to have a strong influence on certain markets, and the effects are magnified by winter in the Northern Hemisphere in many cases.
The holidays across many countries and ethnicities are cel-ebrated with food - sugar cookies in the shape of Santa Claus or chocolate coins and Dradles, or even large roasts. This surge in demand globally tends to influence commodity prices in most years. The holidays across most religions have also turned increasingly into consumer affairs, so other markets are highly affected as well.
Of course, the fact that winter is in full force during Decem-ber also tends to influence the production of several commodi-ties as well as their transportation. As such, the influence of the holidays coupled with winter tends to influence several markets strongly.
Sugar OverviewThe Judaeo-Christian world celebrates both Christmas and Hanukah during December. Though the holidays they celebrate may be extremely different from a spiritual perspective, the way they are celebrated is quite similar. Each of these celebrations involves bringing families together for large meals - which in-volve many sweet tasty treats. As such the demand for Sugar tends to be strong.
However, the holidays are not the only reason that Sugar prices tend to increase towards the end of the year. December tends to be the height of the planting/harvest cycle for many
Planting and production appears to not be able to keep up with usage, not only because of an increasing “global sweet tooth,” but also because of the use of Sugar in the production of alternative fuels (ethanol) due to high energy prices.
major sugarcane producing countries – North Eastern Brazil, India, China, and the United States. These countries collectively produce roughly a quarter of the world’s Sugar. The planting/harvest period for sugarcane is a critical time, as insects and other pests enjoy sugarcane just as much as people. The usual slashing and burning of fields, coupled with replanting, makes the cane fields extremely susceptible to damage, thus making future sup-ply less certain. In the futures markets, uncertainty regarding
10PitNews.com Magazine December �006 1010
Disclaimer: The risk of loss in trading futures, options, stocks, and forex can be substantial. See Page 6 for more information.
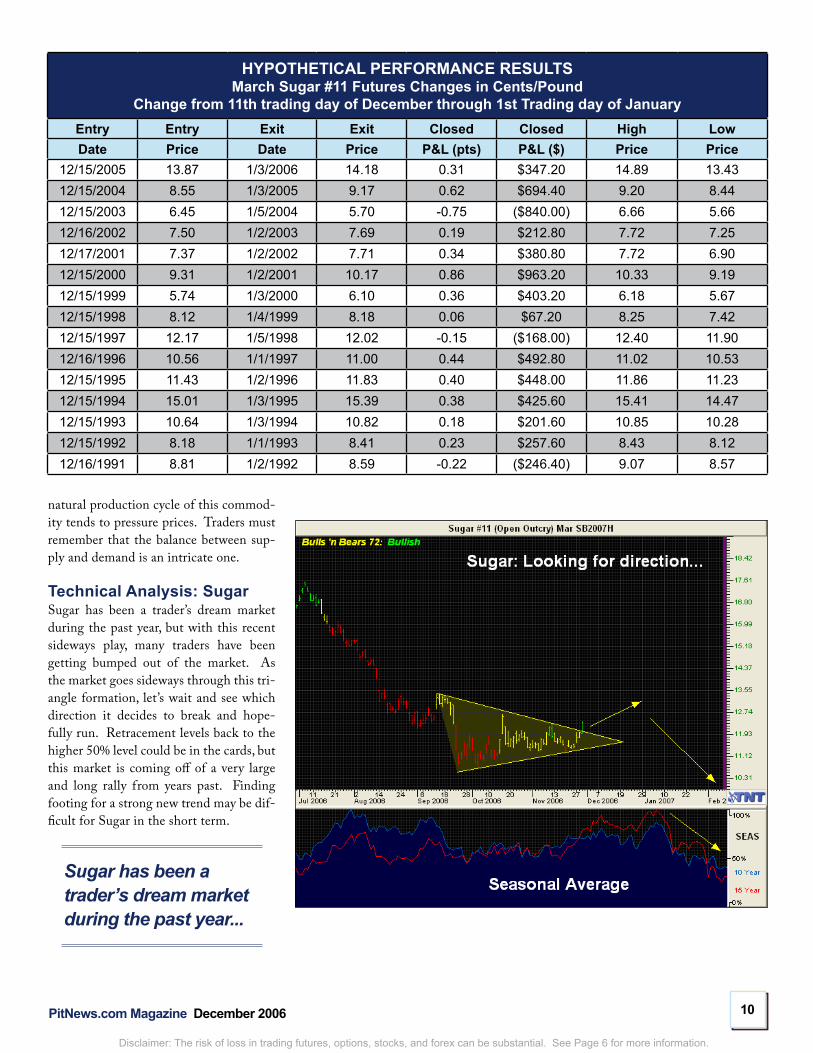
HYPOTHETICAL PERFORMANCE RESULTSMarch Sugar #11 Futures Changes in Cents/Pound
Change from 11th trading day of December through 1st Trading day of January Entry Entry Exit Exit Closed Closed High LowDate Price Date Price P&L (pts) P&L ($) Price Price
12/15/2005 13.87 1/3/2006 14.18 0.31 $347.20 14.89 13.4312/15/2004 8.55 1/3/2005 9.17 0.62 $694.40 9.20 8.4412/15/2003 6.45 1/5/2004 5.70 -0.75 ($840.00) 6.66 5.6612/16/2002 7.50 1/2/2003 7.69 0.19 $212.80 7.72 7.2512/17/2001 7.37 1/2/2002 7.71 0.34 $380.80 7.72 6.9012/15/2000 9.31 1/2/2001 10.17 0.86 $963.20 10.33 9.1912/15/1999 5.74 1/3/2000 6.10 0.36 $403.20 6.18 5.6712/15/1998 8.12 1/4/1999 8.18 0.06 $67.20 8.25 7.4212/15/1997 12.17 1/5/1998 12.02 -0.15 ($168.00) 12.40 11.9012/16/1996 10.56 1/1/1997 11.00 0.44 $492.80 11.02 10.5312/15/1995 11.43 1/2/1996 11.83 0.40 $448.00 11.86 11.2312/15/1994 15.01 1/3/1995 15.39 0.38 $425.60 15.41 14.4712/15/1993 10.64 1/3/1994 10.82 0.18 $201.60 10.85 10.2812/15/1992 8.18 1/1/1993 8.41 0.23 $257.60 8.43 8.1212/16/1991 8.81 1/2/1992 8.59 -0.22 ($246.40) 9.07 8.57
natural production cycle of this commod-ity tends to pressure prices. Traders must remember that the balance between sup-ply and demand is an intricate one.
Technical Analysis: SugarSugar has been a trader’s dream market during the past year, but with this recent sideways play, many traders have been getting bumped out of the market. As the market goes sideways through this tri-angle formation, let’s wait and see which direction it decides to break and hope-fully run. Retracement levels back to the higher 50% level could be in the cards, but this market is coming off of a very large and long rally from years past. Finding footing for a strong new trend may be dif-ficult for Sugar in the short term.
Sugar has been a trader’s dream market during the past year...
11PitNews.com Magazine December �006 1111
Disclaimer: The risk of loss in trading futures, options, stocks, and forex can be substantial. See Page 6 for more information.
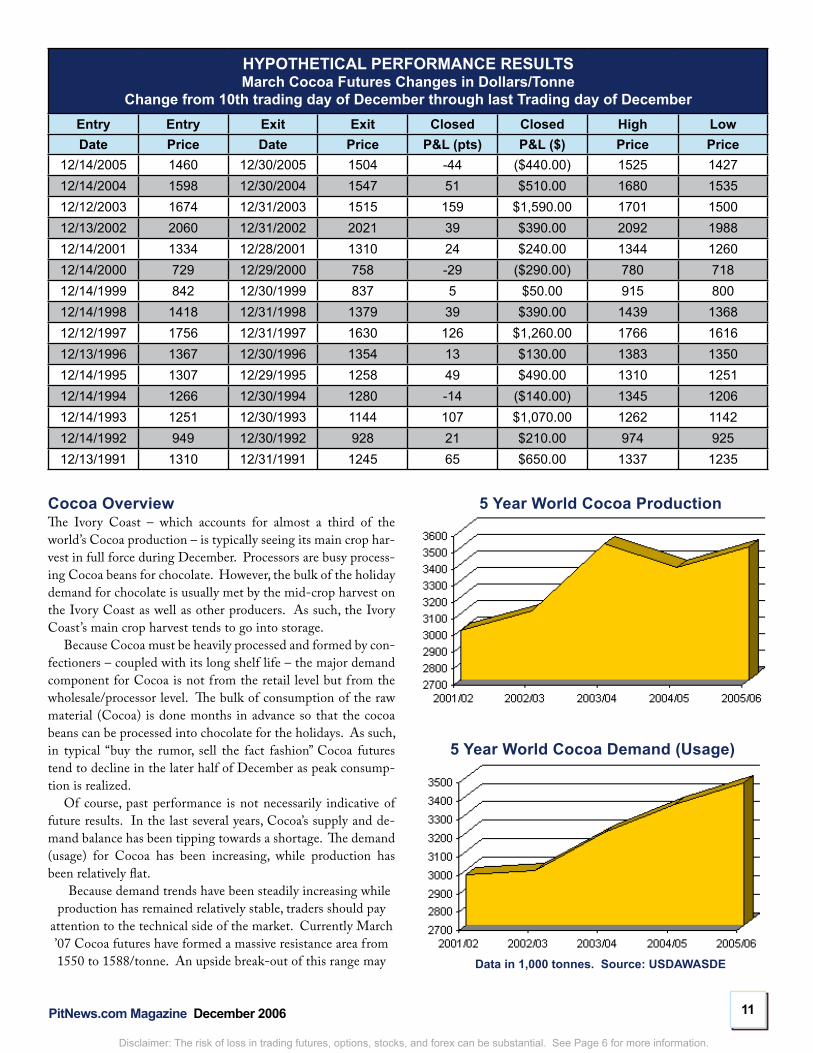
5 Year World Cocoa Production
5 Year World Cocoa Demand (Usage)
Data in 1,000 tonnes. Source: USDAWASDE
Cocoa OverviewThe Ivory Coast – which accounts for almost a third of the world’s Cocoa production – is typically seeing its main crop har-vest in full force during December. Processors are busy process-ing Cocoa beans for chocolate. However, the bulk of the holiday demand for chocolate is usually met by the mid-crop harvest on the Ivory Coast as well as other producers. As such, the Ivory Coast’s main crop harvest tends to go into storage.
Because Cocoa must be heavily processed and formed by con-fectioners – coupled with its long shelf life – the major demand component for Cocoa is not from the retail level but from the wholesale/processor level. The bulk of consumption of the raw material (Cocoa) is done months in advance so that the cocoa beans can be processed into chocolate for the holidays. As such, in typical “buy the rumor, sell the fact fashion” Cocoa futures tend to decline in the later half of December as peak consump-tion is realized.
Of course, past performance is not necessarily indicative of future results. In the last several years, Cocoa’s supply and de-mand balance has been tipping towards a shortage. The demand (usage) for Cocoa has been increasing, while production has been relatively flat.
Because demand trends have been steadily increasing while production has remained relatively stable, traders should pay
attention to the technical side of the market. Currently March ’07 Cocoa futures have formed a massive resistance area from 1550 to 1588/tonne. An upside break-out of this range may
HYPOTHETICAL PERFORMANCE RESULTSMarch Cocoa Futures Changes in Dollars/Tonne
Change from 10th trading day of December through last Trading day of DecemberEntry Entry Exit Exit Closed Closed High LowDate Price Date Price P&L (pts) P&L ($) Price Price
12/14/2005 1460 12/30/2005 1504 -44 ($440.00) 1525 142712/14/2004 1598 12/30/2004 1547 51 $510.00 1680 153512/12/2003 1674 12/31/2003 1515 159 $1,590.00 1701 150012/13/2002 2060 12/31/2002 2021 39 $390.00 2092 198812/14/2001 1334 12/28/2001 1310 24 $240.00 1344 126012/14/2000 729 12/29/2000 758 -29 ($290.00) 780 71812/14/1999 842 12/30/1999 837 5 $50.00 915 80012/14/1998 1418 12/31/1998 1379 39 $390.00 1439 136812/12/1997 1756 12/31/1997 1630 126 $1,260.00 1766 161612/13/1996 1367 12/30/1996 1354 13 $130.00 1383 135012/14/1995 1307 12/29/1995 1258 49 $490.00 1310 125112/14/1994 1266 12/30/1994 1280 -14 ($140.00) 1345 120612/14/1993 1251 12/30/1993 1144 107 $1,070.00 1262 114212/14/1992 949 12/30/1992 928 21 $210.00 974 92512/13/1991 1310 12/31/1991 1245 65 $650.00 1337 1235
1�PitNews.com Magazine December �006 1�1�
Disclaimer: The risk of loss in trading futures, options, stocks, and forex can be substantial. See Page 6 for more information.
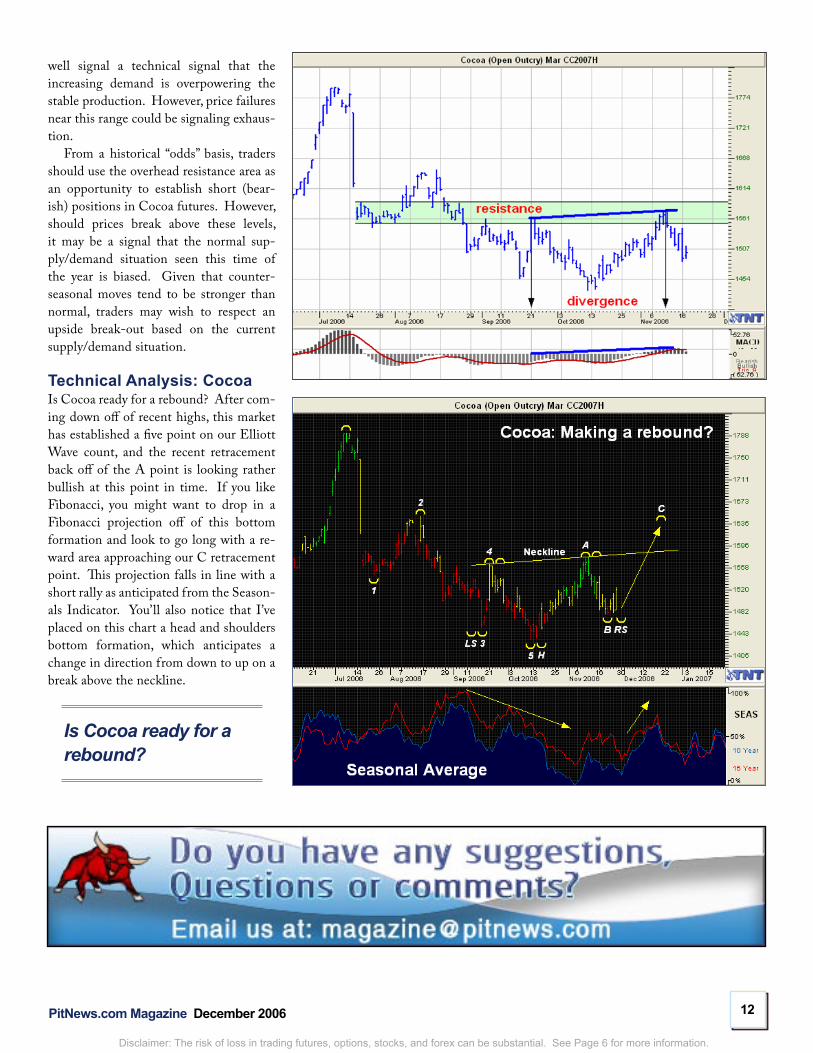
well signal a technical signal that the increasing demand is overpowering the stable production. However, price failures near this range could be signaling exhaus-tion.
From a historical “odds” basis, traders should use the overhead resistance area as an opportunity to establish short (bear-ish) positions in Cocoa futures. However, should prices break above these levels, it may be a signal that the normal sup-ply/demand situation seen this time of the year is biased. Given that counter-seasonal moves tend to be stronger than normal, traders may wish to respect an upside break-out based on the current supply/demand situation.
Technical Analysis: CocoaIs Cocoa ready for a rebound? After com-ing down off of recent highs, this market has established a five point on our Elliott Wave count, and the recent retracement back off of the A point is looking rather bullish at this point in time. If you like Fibonacci, you might want to drop in a Fibonacci projection off of this bottom formation and look to go long with a re-ward area approaching our C retracement point. This projection falls in line with a short rally as anticipated from the Season-als Indicator. You’ll also notice that I’ve placed on this chart a head and shoulders bottom formation, which anticipates a change in direction from down to up on a break above the neckline.
Is Cocoa ready for a rebound?
13PitNews.com Magazine December �006 1313
Disclaimer: The risk of loss in trading futures, options, stocks, and forex can be substantial. See Page 6 for more information.
Winter Effect on Orange JuiceThe holidays are not the only force pushing food prices this time of the year. The holidays also coincide with winter. In the Northern Hemisphere there is no more of a cold-sensitive crop than oranges. Because oranges are grown in groves, with trees which take roughly 4 years of growth before becoming produc-tive, frost damage not only destroys the current crop but also production for several years.
It is the cold’s ability to damage the tree itself – not just the fruit – that makes the Orange Juice market so volatile. However, it is only at specific times of the year that the orange groves are most vulnerable.
The oranges themselves are always sensitive to frost and the cold. The major difference is between damage to the fruit itself or damage to the tree. It is the cold’s ability to damage the tree itself – not just the fruit – that makes the Orange Juice market so volatile. However, it is only at specific times of the year that the orange groves are most vulnerable.
HYPOTHETICAL PERFORMANCE RESULTSMarch Orange Juice Futures Changes in Dollars/Lb
Change from 5th to last trading day of December through �th trading day of JanuaryEntry Entry Exit Exit Closed Closed High LowDate Price Date Price P&L (pts) P&L ($) Price Price
12/23/2005 126.10 1/11/2006 125.95 0.15 $22.50 127.90 120.0012/23/2004 88.70 1/11/2005 80.35 8.35 $1,252.50 89.00 77.0012/23/2003 69.75 1/13/2004 64.05 5.70 $855.00 69.90 63.6012/23/2002 100.05 1/10/2003 93.95 6.10 $915.00 101.40 91.2012/20/2001 96.30 1/10/2002 90.50 5.80 $870.00 96.60 88.3012/22/2000 83.05 1/10/2001 79.00 4.05 $607.50 83.80 74.9012/27/1999 87.55 1/11/2000 82.20 5.35 $802.50 88.20 81.8512/24/1998 107.40 1/12/1999 101.75 5.65 $847.50 109.50 96.1012/23/1997 88.10 1/13/1998 87.60 0.50 $75.00 91.10 80.0012/20/1996 90.70 1/9/1997 77.85 12.85 $1,927.50 93.15 77.8012/22/1995 122.95 1/11/1996 117.20 5.75 $862.50 125.25 115.5012/23/1994 119.95 1/11/1995 104.20 15.75 $2,362.50 121.40 101.0012/23/1993 111.10 1/11/1994 114.85 -3.75 ($562.50) 116.50 106.1012/23/1992 98.35 1/11/1993 81.80 16.55 $2,482.50 99.25 80.7512/24/1991 158.25 1/10/1992 153.45 4.80 $720.00 159.00 151.00
1�PitNews.com Magazine December �006 1�1�
Disclaimer: The risk of loss in trading futures, options, stocks, and forex can be substantial. See Page 6 for more information.
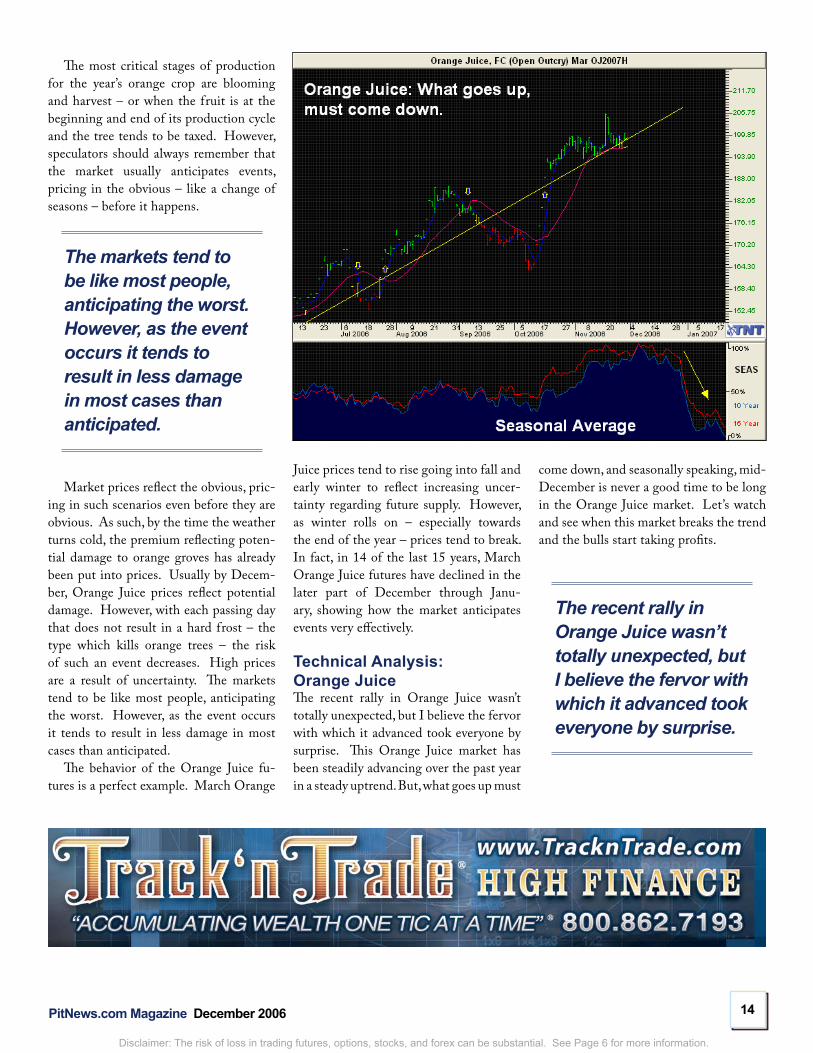
The most critical stages of production for the year’s orange crop are blooming and harvest – or when the fruit is at the beginning and end of its production cycle and the tree tends to be taxed. However, speculators should always remember that the market usually anticipates events, pricing in the obvious – like a change of seasons – before it happens.
The markets tend to be like most people, anticipating the worst. However, as the event occurs it tends to result in less damage in most cases than anticipated.
Market prices reflect the obvious, pric-ing in such scenarios even before they are obvious. As such, by the time the weather turns cold, the premium reflecting poten-tial damage to orange groves has already been put into prices. Usually by Decem-ber, Orange Juice prices reflect potential damage. However, with each passing day that does not result in a hard frost – the type which kills orange trees – the risk of such an event decreases. High prices are a result of uncertainty. The markets tend to be like most people, anticipating the worst. However, as the event occurs it tends to result in less damage in most cases than anticipated.
The behavior of the Orange Juice fu-tures is a perfect example. March Orange
Juice prices tend to rise going into fall and early winter to reflect increasing uncer-tainty regarding future supply. However, as winter rolls on – especially towards the end of the year – prices tend to break. In fact, in 14 of the last 15 years, March Orange Juice futures have declined in the later part of December through Janu-ary, showing how the market anticipates events very effectively.
Technical Analysis: Orange JuiceThe recent rally in Orange Juice wasn’t totally unexpected, but I believe the fervor with which it advanced took everyone by surprise. This Orange Juice market has been steadily advancing over the past year in a steady uptrend. But, what goes up must
come down, and seasonally speaking, mid-December is never a good time to be long in the Orange Juice market. Let’s watch and see when this market breaks the trend and the bulls start taking profits.
The recent rally in Orange Juice wasn’t totally unexpected, but I believe the fervor with which it advanced took everyone by surprise.
15PitNews.com Magazine December �006 1515
Disclaimer: The risk of loss in trading futures, options, stocks, and forex can be substantial. See Page 6 for more information.
Live Cattle OverviewWinter’s cold can affect lots of markets, even markets that are not traditionally grown. Winter tends to kill not only citrus and other crops, but also animals. Winter’s adverse affect also tends to influence Cattle prices. Cattle death due to the elements or disease is greatest during the winter months, as Cattle are raised outdoors. However, it is not this “disappearance” (the industry term for cattle death on feedlots) that drives prices higher, but the transportation system.
Winter’s cold can affect lots of markets, even markets that are not traditionally grown. Winter tends to kill not only citrus and other crops, but also animals.
The United States has been blessed with a great river system. Barge transportation is the least expensive method of moving bulk commodities. Typically, as in the case of the United States, commodities are not produced in high population areas. Instead, commodities must be transported to these highly populated ar-eas. Given that the United States is basically self-sufficient in meat production, transportation plays a key roll.
Standing rib roasts at Christmas, steaks on New Year’s, and other assorted celebratory meals tend to create demand for high-end beef cuts. This surge in demand is coupled not only with
This surge in demand, together with distribution difficulties, has historically caused February Live Cattle to gain in price from late December through mid-January...
a difficulty in moving cattle from feedlots/grazing facilities to slaughter houses, but also moving the finished beef to consum-ers. Major rivers – like the Mississippi, Snake, and Columbia – tend to be difficult to navigate this time of the year. As such, transportation costs tend to increase, which in turn tend to drive general prices higher.
This surge in demand, together with distribution difficulties, has historically caused February Live Cattle to gain in price from late December through mid-January as a drawdown in supply due to holiday consumption tends to push prices higher. This fact can readily be seen historically through the behavior of February Live Cattle futures.
HYPOTHETICAL PERFORMANCE RESULTSFebruary Live Cattle Changes in Dollars/Lb
Change from �nd to last trading day of December through 11th trading day of JanuaryEntry Entry Exit Exit Closed Closed High LowDate Price Date Price P&L (pts) P&L ($) Price Price
12/29/2005 96.40 1/18/2006 96.08 -0.33 ($130.00) 97.05 93.8512/30/2004 87.82 1/18/2005 91.12 3.30 $1,320.00 92.75 87.4012/30/2003 76.17 1/16/2004 78.70 2.53 $1,010.00 79.60 71.1712/30/2002 78.72 1/16/2003 79.67 0.95 $380.00 82.00 78.3812/28/2001 70.85 1/16/2002 71.12 0.27 $108.00 71.75 69.7012/28/2000 77.87 1/17/2001 80.20 2.33 $932.00 81.07 76.0512/30/1999 69.60 1/18/2000 70.70 1.10 $440.00 71.47 68.7212/30/1998 60.48 1/19/1999 62.98 2.50 $1,000.00 63.83 59.4512/30/1997 66.35 1/16/1998 66.43 0.08 $32.00 66.85 63.6312/27/1996 64.80 1/15/1997 65.85 1.05 $420.00 66.25 64.0312/28/1995 66.75 1/16/1996 65.67 -1.08 ($432.00) 67.05 65.2512/29/1994 71.27 1/17/1995 73.62 2.35 $940.00 73.97 70.9212/30/1993 73.30 1/17/1994 74.12 0.82 $328.00 74.77 72.2712/29/1992 76.27 1/15/1993 80.70 4.43 $1,772.00 80.75 76.0212/30/1991 71.77 1/16/1992 74.80 3.03 $1,212.00 75.50 70.85
16PitNews.com Magazine December �006 1616
Disclaimer: The risk of loss in trading futures, options, stocks, and forex can be substantial. See Page 6 for more information.
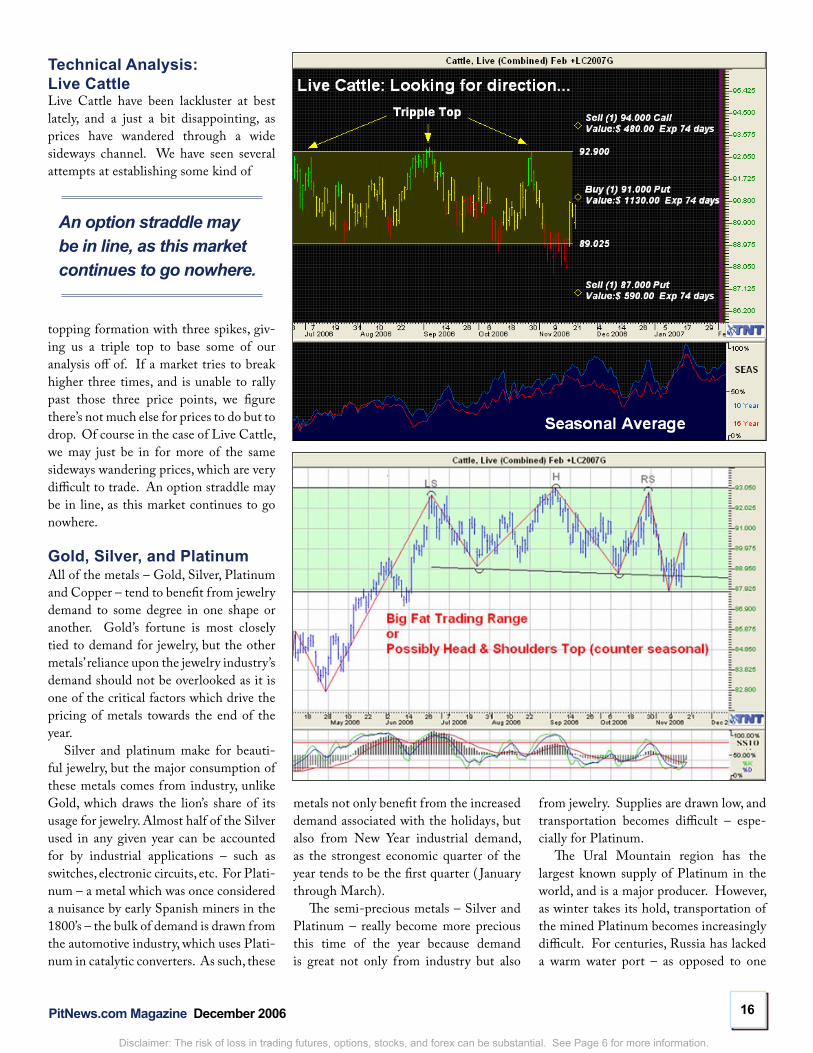
Technical Analysis: Live CattleLive Cattle have been lackluster at best lately, and a just a bit disappointing, as prices have wandered through a wide sideways channel. We have seen several attempts at establishing some kind of
An option straddle may be in line, as this market continues to go nowhere.
topping formation with three spikes, giv-ing us a triple top to base some of our analysis off of. If a market tries to break higher three times, and is unable to rally past those three price points, we figure there’s not much else for prices to do but to drop. Of course in the case of Live Cattle, we may just be in for more of the same sideways wandering prices, which are very difficult to trade. An option straddle may be in line, as this market continues to go nowhere.
Gold, Silver, and PlatinumAll of the metals – Gold, Silver, Platinum and Copper – tend to benefit from jewelry demand to some degree in one shape or another. Gold’s fortune is most closely tied to demand for jewelry, but the other metals’ reliance upon the jewelry industry’s demand should not be overlooked as it is one of the critical factors which drive the pricing of metals towards the end of the year.
Silver and platinum make for beauti-ful jewelry, but the major consumption of these metals comes from industry, unlike Gold, which draws the lion’s share of its usage for jewelry. Almost half of the Silver used in any given year can be accounted for by industrial applications – such as switches, electronic circuits, etc. For Plati-num – a metal which was once considered a nuisance by early Spanish miners in the 1800’s – the bulk of demand is drawn from the automotive industry, which uses Plati-num in catalytic converters. As such, these
metals not only benefit from the increased demand associated with the holidays, but also from New Year industrial demand, as the strongest economic quarter of the year tends to be the first quarter ( January through March).
The semi-precious metals – Silver and Platinum – really become more precious this time of the year because demand is great not only from industry but also
from jewelry. Supplies are drawn low, and transportation becomes difficult – espe-cially for Platinum.
The Ural Mountain region has the largest known supply of Platinum in the world, and is a major producer. However, as winter takes its hold, transportation of the mined Platinum becomes increasingly difficult. For centuries, Russia has lacked a warm water port – as opposed to one
1�PitNews.com Magazine December �006 1�1�
Disclaimer: The risk of loss in trading futures, options, stocks, and forex can be substantial. See Page 6 for more information.
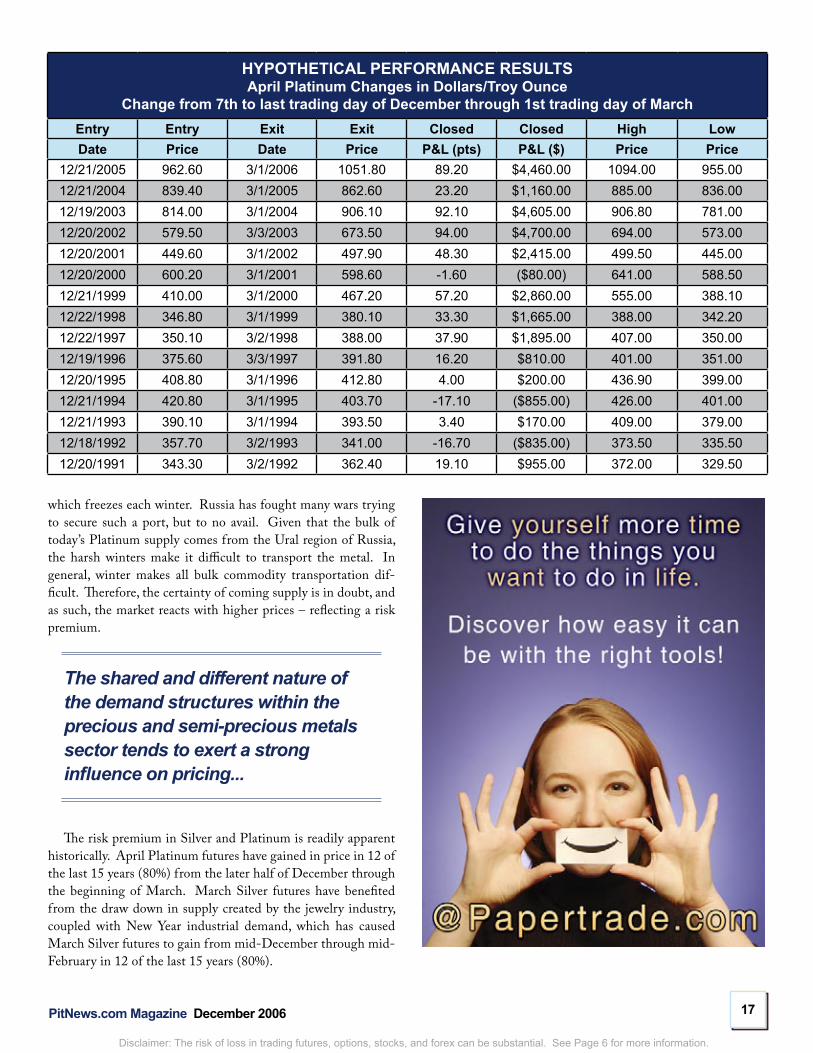
which freezes each winter. Russia has fought many wars trying to secure such a port, but to no avail. Given that the bulk of today’s Platinum supply comes from the Ural region of Russia, the harsh winters make it difficult to transport the metal. In general, winter makes all bulk commodity transportation dif-ficult. Therefore, the certainty of coming supply is in doubt, and as such, the market reacts with higher prices – reflecting a risk premium.
The shared and different nature of the demand structures within the precious and semi-precious metals sector tends to exert a strong influence on pricing...
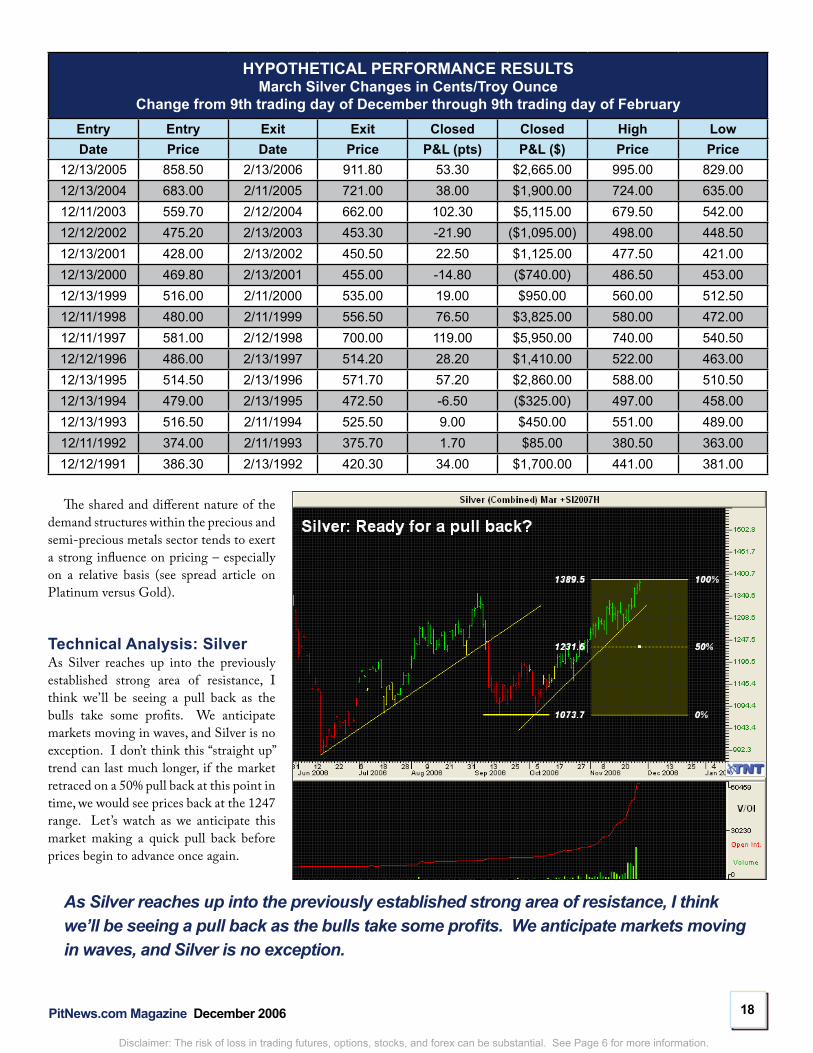
The risk premium in Silver and Platinum is readily apparent historically. April Platinum futures have gained in price in 12 of the last 15 years (80%) from the later half of December through the beginning of March. March Silver futures have benefited from the draw down in supply created by the jewelry industry, coupled with New Year industrial demand, which has caused March Silver futures to gain from mid-December through mid-February in 12 of the last 15 years (80%).
HYPOTHETICAL PERFORMANCE RESULTSApril Platinum Changes in Dollars/Troy Ounce
Change from �th to last trading day of December through 1st trading day of MarchEntry Entry Exit Exit Closed Closed High LowDate Price Date Price P&L (pts) P&L ($) Price Price
12/21/2005 962.60 3/1/2006 1051.80 89.20 $4,460.00 1094.00 955.0012/21/2004 839.40 3/1/2005 862.60 23.20 $1,160.00 885.00 836.0012/19/2003 814.00 3/1/2004 906.10 92.10 $4,605.00 906.80 781.0012/20/2002 579.50 3/3/2003 673.50 94.00 $4,700.00 694.00 573.0012/20/2001 449.60 3/1/2002 497.90 48.30 $2,415.00 499.50 445.0012/20/2000 600.20 3/1/2001 598.60 -1.60 ($80.00) 641.00 588.5012/21/1999 410.00 3/1/2000 467.20 57.20 $2,860.00 555.00 388.1012/22/1998 346.80 3/1/1999 380.10 33.30 $1,665.00 388.00 342.2012/22/1997 350.10 3/2/1998 388.00 37.90 $1,895.00 407.00 350.0012/19/1996 375.60 3/3/1997 391.80 16.20 $810.00 401.00 351.0012/20/1995 408.80 3/1/1996 412.80 4.00 $200.00 436.90 399.0012/21/1994 420.80 3/1/1995 403.70 -17.10 ($855.00) 426.00 401.0012/21/1993 390.10 3/1/1994 393.50 3.40 $170.00 409.00 379.0012/18/1992 357.70 3/2/1993 341.00 -16.70 ($835.00) 373.50 335.5012/20/1991 343.30 3/2/1992 362.40 19.10 $955.00 372.00 329.50
18PitNews.com Magazine December �006 1818
Disclaimer: The risk of loss in trading futures, options, stocks, and forex can be substantial. See Page 6 for more information.
HYPOTHETICAL PERFORMANCE RESULTSMarch Silver Changes in Cents/Troy Ounce
Change from �th trading day of December through �th trading day of FebruaryEntry Entry Exit Exit Closed Closed High LowDate Price Date Price P&L (pts) P&L ($) Price Price
12/13/2005 858.50 2/13/2006 911.80 53.30 $2,665.00 995.00 829.0012/13/2004 683.00 2/11/2005 721.00 38.00 $1,900.00 724.00 635.0012/11/2003 559.70 2/12/2004 662.00 102.30 $5,115.00 679.50 542.0012/12/2002 475.20 2/13/2003 453.30 -21.90 ($1,095.00) 498.00 448.5012/13/2001 428.00 2/13/2002 450.50 22.50 $1,125.00 477.50 421.0012/13/2000 469.80 2/13/2001 455.00 -14.80 ($740.00) 486.50 453.0012/13/1999 516.00 2/11/2000 535.00 19.00 $950.00 560.00 512.5012/11/1998 480.00 2/11/1999 556.50 76.50 $3,825.00 580.00 472.0012/11/1997 581.00 2/12/1998 700.00 119.00 $5,950.00 740.00 540.5012/12/1996 486.00 2/13/1997 514.20 28.20 $1,410.00 522.00 463.0012/13/1995 514.50 2/13/1996 571.70 57.20 $2,860.00 588.00 510.5012/13/1994 479.00 2/13/1995 472.50 -6.50 ($325.00) 497.00 458.0012/13/1993 516.50 2/11/1994 525.50 9.00 $450.00 551.00 489.0012/11/1992 374.00 2/11/1993 375.70 1.70 $85.00 380.50 363.0012/12/1991 386.30 2/13/1992 420.30 34.00 $1,700.00 441.00 381.00
The shared and different nature of the
demand structures within the precious and semi-precious metals sector tends to exert a strong influence on pricing – especially on a relative basis (see spread article on Platinum versus Gold).
Technical Analysis: SilverAs Silver reaches up into the previously established strong area of resistance, I think we’ll be seeing a pull back as the bulls take some profits. We anticipate markets moving in waves, and Silver is no exception. I don’t think this “straight up” trend can last much longer, if the market retraced on a 50% pull back at this point in time, we would see prices back at the 1247 range. Let’s watch as we anticipate this market making a quick pull back before prices begin to advance once again.
As Silver reaches up into the previously established strong area of resistance, I think we’ll be seeing a pull back as the bulls take some profits. We anticipate markets moving in waves, and Silver is no exception.
1�PitNews.com Magazine December �006 1�1�
Disclaimer: The risk of loss in trading futures, options, stocks, and forex can be substantial. See Page 6 for more information.
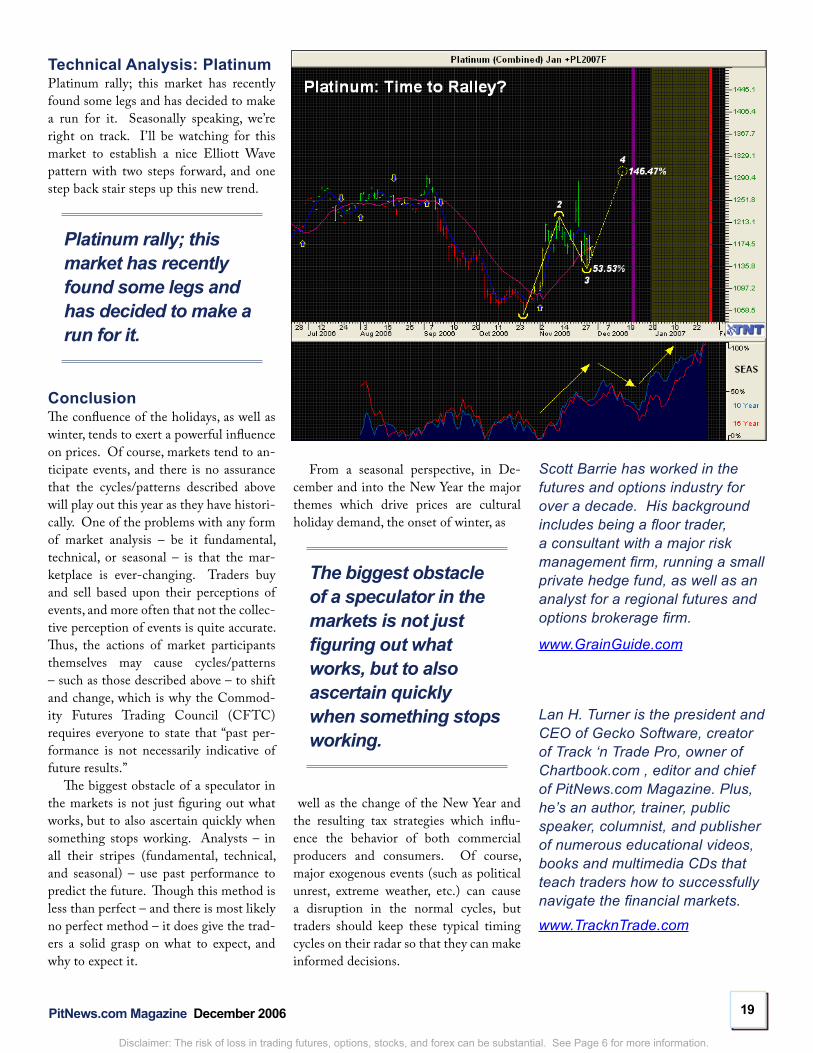
Technical Analysis: PlatinumPlatinum rally; this market has recently found some legs and has decided to make a run for it. Seasonally speaking, we’re right on track. I’ll be watching for this market to establish a nice Elliott Wave pattern with two steps forward, and one step back stair steps up this new trend.
Platinum rally; this market has recently found some legs and has decided to make a run for it.
ConclusionThe confluence of the holidays, as well as winter, tends to exert a powerful influence on prices. Of course, markets tend to an-ticipate events, and there is no assurance that the cycles/patterns described above will play out this year as they have histori-cally. One of the problems with any form of market analysis – be it fundamental, technical, or seasonal – is that the mar-ketplace is ever-changing. Traders buy and sell based upon their perceptions of events, and more often that not the collec-tive perception of events is quite accurate. Thus, the actions of market participants themselves may cause cycles/patterns – such as those described above – to shift and change, which is why the Commod-ity Futures Trading Council (CFTC) requires everyone to state that “past per-formance is not necessarily indicative of future results.”
The biggest obstacle of a speculator in the markets is not just figuring out what works, but to also ascertain quickly when something stops working. Analysts – in all their stripes (fundamental, technical, and seasonal) – use past performance to predict the future. Though this method is less than perfect – and there is most likely no perfect method – it does give the trad-ers a solid grasp on what to expect, and why to expect it.
From a seasonal perspective, in De-cember and into the New Year the major themes which drive prices are cultural holiday demand, the onset of winter, as
The biggest obstacle of a speculator in the markets is not just figuring out what works, but to also ascertain quickly when something stops working.
well as the change of the New Year and the resulting tax strategies which influ-ence the behavior of both commercial producers and consumers. Of course, major exogenous events (such as political unrest, extreme weather, etc.) can cause a disruption in the normal cycles, but traders should keep these typical timing cycles on their radar so that they can make informed decisions.
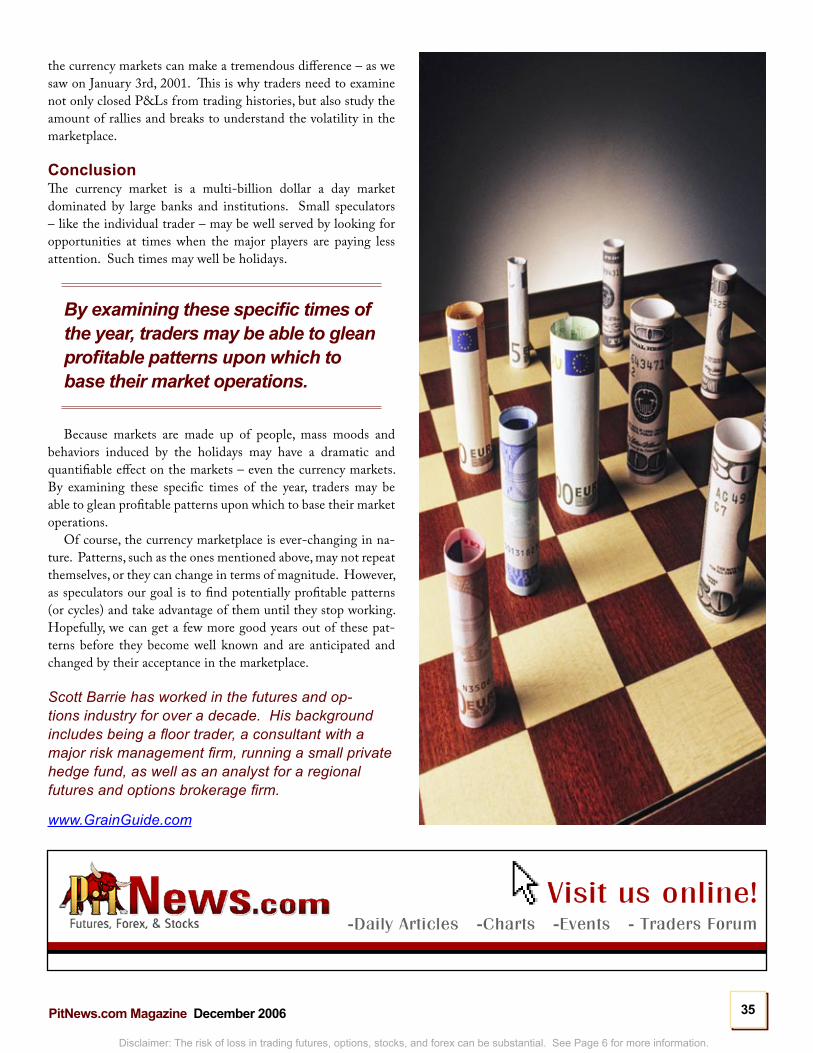
Scott Barrie has worked in the futures and options industry for over a decade. His background includes being a floor trader, a consultant with a major risk management firm, running a small private hedge fund, as well as an analyst for a regional futures and options brokerage firm.
www.GrainGuide.com
Lan H. Turner is the president and CEO of Gecko Software, creator of Track ‘n Trade Pro, owner of Chartbook.com , editor and chief of PitNews.com Magazine. Plus, he’s an author, trainer, public speaker, columnist, and publisher of numerous educational videos, books and multimedia CDs that teach traders how to successfully navigate the financial markets.
www.TracknTrade.com
Wall Street, the Ivory Tower, Your Investing Psychology and
What It All Means ToYour Investing SuccessPart 1 of 6 by: Dr. Scott Brown, PhD.
�1PitNews.com Magazine December �006 �1�1
Disclaimer: The risk of loss in trading futures, options, stocks, and forex can be substantial. See Page 6 for more information.
T here are four primary ideas that all finance majors become indoctrinated in before they become brokers, portfolio managers, or certified financial planners. Just like lemmings, they are all walking to the beat of the same drummer going in the same direction like mind-
less robots. You don’t want them to march you toward the edge of the same cliff. For this reason, over the next six months I am going to explain to you the thoughts behind the “professional” side of Wall Street and how they connect to the ivory tower of top economics and finance professors who deal with market theory… with heavy emphasis on theory throughout. These four areas are Efficient Capital Markets (ECM) Theory, the Random Walk (RW) hypothesis which is used to test and support the idea of ECM, Modern Portfolio Theory (MPT), and the Capital Asset Pricing Model (CAPM).
Eugene Fama is a very famous finance professor at the University of Chicago, arguably one of the best schools of eco-nomics in the world. Fama’s Efficient Capital Markets (ECM) Theory states that all financial prices correctly reflect all public information at all times . In simple language this means that you never under or over-pay for a stock or futures contract given what is publicly known, at all times. This theory says that prices for a futures contract, forex contract, options contract, or share of stock may appear to be too high or too low at times. Prices that seem incorrect must be an illusion, according to ECM. The
average investor fails to understand that this will only hold true at very best in the very short term, like in the next ten seconds or minutes. Let me explain.
Arbitrage Is Market GlueThe glue that holds markets together is arbitrage. In the very short term, such as the next few seconds, there are people that are trying to take advantage of very small price differences in the same stock on different exchanges. These people are called arbitragers. They are attempting to profit by exploiting price differences of identical or similar financial instruments, on dif-ferent markets or in different forms. The ideal version is risk-less arbitrage.
It doesn’t make sense that the same share of stock could be selling for the same price on two different exchanges, does it?
Think about it. Wouldn’t it be odd if a share of IBM was selling for $91.77 per share on the New York Stock Exchange (NYSE) right now at 10:04 AM on Monday, November 13,
ECM: Efficient Capital Markets Theory
RW:The Random Walk Hypothesis
MPT:Modern Portfolio Theory
CAPM:Capital Asset Pricing Model
The “Four Pillars” of Wall Street:
��PitNews.com Magazine December �006 ����
Disclaimer: The risk of loss in trading futures, options, stocks, and forex can be substantial. See Page 6 for more information.
2006, but is selling for $91.73 on the American Stock Exchange (AMEX)? It doesn’t make sense that the same share of stock could be selling for the same price on two different exchanges, does it? You are right, and here is why,Arbitragers are constantly on the lookout for these kinds of op-portunities in all of the financial markets. They have very sophis-ticated computer equipment and can almost instantly buy and sell on different exchanges. In this specific situation, arbitragers will immediately begin buying lots of IBM on the AMEX and simultaneously sells lots of stock on the NYSE. The arbitrager’s buying pressure on the AMEX will drive the price up on the exchange. The arbitrager’s selling pressure on the NYSE will drive the price down in New York.
Within seconds the stock on the NYSE will be trading at $91.76 per share. On the AMEX the stock will immediately jump to $91.74. In a flash the stock will be trading at $91.75 on BOTH exchanges. This is price convergence and this process is driven by arbitrage. This doesn’t sound like a big deal, but if the arbitrager managed to arbitrage 100,000 shares at 4¢ and 50,000 shares at 2¢, he or she would make $4,000 and $1,000 for a total of $5,000 in just a few seconds with no risk!
Do Stocks Take A Random Walk Around Wall Street — At Least In The Super Short Term?Because of arbitrage, according to ECM, all security prices reflect all available public information about the economy, fi-nancial markets, and the specific company you are dealing with. The idea is that market prices of individual securities adjust very rapidly to any new information entering the marketplace during each second of daily trading.
This new information, according to ECM, can make the price bounce above and below the stock’s intrinsic (or real) value as market prices adjust very rapidly to new information. The theory admits that new information can result in a new intrinsic value of the stock, but all prices going forward in time will not follow any particular pattern such as a trend. Stock prices will follow a “random walk” throughout the trading day.
History is of no use whatsoever in predicting the stock mar-ket if you believe in Fama’s notion of market efficiency — paying attention to the news is worthless to you as a stock investor. By the time you are able to take action, security price adjustments will already have occurred, according to the efficient market no-tion. This theory says that ALL technical analysis is worthless! Don’t despair though because once I teach you the details of this theory I am going to show you a blind spot so big it is like a black hole of the ivory tower that business schools neglect to explain to business students — who become professionals on Wall Street. This blind spot is so important that it makes techni-cal analysis the most reasonable way to analyze the stock market. Don’t despair over this random walk hypothesis nonsense… keep on reading and it will be well worth it!
Baskin Robbins Has 31 Flavors — Fama Has 3!More formally, market efficiency means that the unexpected part of a stock price’s movement is unpredictable and, over a period of time doesn’t differ from zero. In other words, in the daily jumble of up a tic and down a tic, this theory says that you cannot make any profit on average. In fancy financial language,
“The unanticipated portion is simply the actual return less that which was expected based on some fundamental analysis (e.g., intrinsic value).” Put differently, it is the surprise element.
Using the definitions of Fama, weak-form market efficiency means that the unanticipated return is not correlated with the previous unanticipated returns. In other words, the market has no memory. Knowing the past does not help you earn future re-turns. Semistrong-form market efficiency means that prices are not correlated with any publicly available information. Finally, with strong-form market efficiency, the unanticipated return is not correlated with any information, be it public or insider.
On balance, the evidence indicates that (in the very short term) the stock market, particularly the NYSE, is reasonably efficient. Security prices on the big board really do appear to be a good reflection of available information, and market prices adjust quickly to new information in the very short term of a couple of seconds from now! Arbitragers seem ready to seize on any recurring price pattern; and in doing so, they drive price
�3PitNews.com Magazine December �006 �3�3
Disclaimer: The risk of loss in trading futures, options, stocks, and forex can be substantial. See Page 6 for more information.
changes about a security’s “intrinsic” value to a random walk. About the only way, according to this theory, that you can have any consistent profits is with insider in-formation. Insider information is known to officers and directors but not to the public.
Wallet Doctor Survival Rule: If you are a day-trader, stay off the NYSE!!!
Paradoxically, the ECM theory will be true (again only in the extreme short run where arbitrage holds) only if a sufficiently large number of investors don’t believe in market efficiency (and try to day-trade against the arbitragers) who, in their at-tempts to earn profits, promptly receive and analyze all the information that is publicly available concerning companies whose securities they follow. Should this considerable effort devoted to data accu-mulation and evaluation cease, the NYSE in the very short run would become much less efficient.
Since it is so important to understand arbitrage, I want to give another example from a different angle. Again, arbitrage simply means finding two things that are essentially the same and buying the cheaper and selling, or selling short, the more expensive. Suppose there are two risk-free bonds, specifically 2 year trea-sury bonds: bond 1 is priced at $1,000 and pays $100 at the end of year 1 and $1,100 at the end of year 2. Right now, you own 8 of bond 1. If you hold them you will get $800 at the end of year 1. If someone paid you 10% to use this money from the end of year 1 to the end of year 2, the $800 would grow to $880. The total amount you would have at the end of year 2 would be $880 plus (8 X $1,100), or $9,680. For bond 2, let’s say that $8,000 invested today would grow to $10,000 at the end of year 2. Clearly, you should sell your holdings in bond 1 for $8,000 and invest in bond 2 where you make an immediate $2,000.
As other bond speculators figure this out, they will do the same. Selling bond 1, of course, exerts downward pressure on its price; while bond 2 is pressured upward by
buying. Arbitrage will continue until the two bonds give the same amount of money at the end of year 2. The simple but powerful notion here is that security prices adjust as market participants search for arbitrage profits. When opportunities have been exhausted, security prices are in equilibrium. In this context, a definition of market efficiency is the absence of arbitrage opportunities because they have been eliminated by arbitragers.
Does Market Efficiency Always Hold?Anyone who experienced the stock market crash on October 19, 1987, when it went into a free fall losing 20% in a few hours, is inclined to question the efficiency of fi-nancial markets. We know that stock markets tend to increase over time in relatively small increments, but when they decline it is with a vengeance.
This leaves us with an uneasy feeling that, although market efficiency is a good explanation of market behavior in the extreme short run, since securities do seem to be efficiently priced relative to one another, there are exceptions. These exceptions call into question market prices embodying all available information. You must be mindful of evidence that suggest exceptions. The most important exceptions are the small firm affect and long term price reversal .
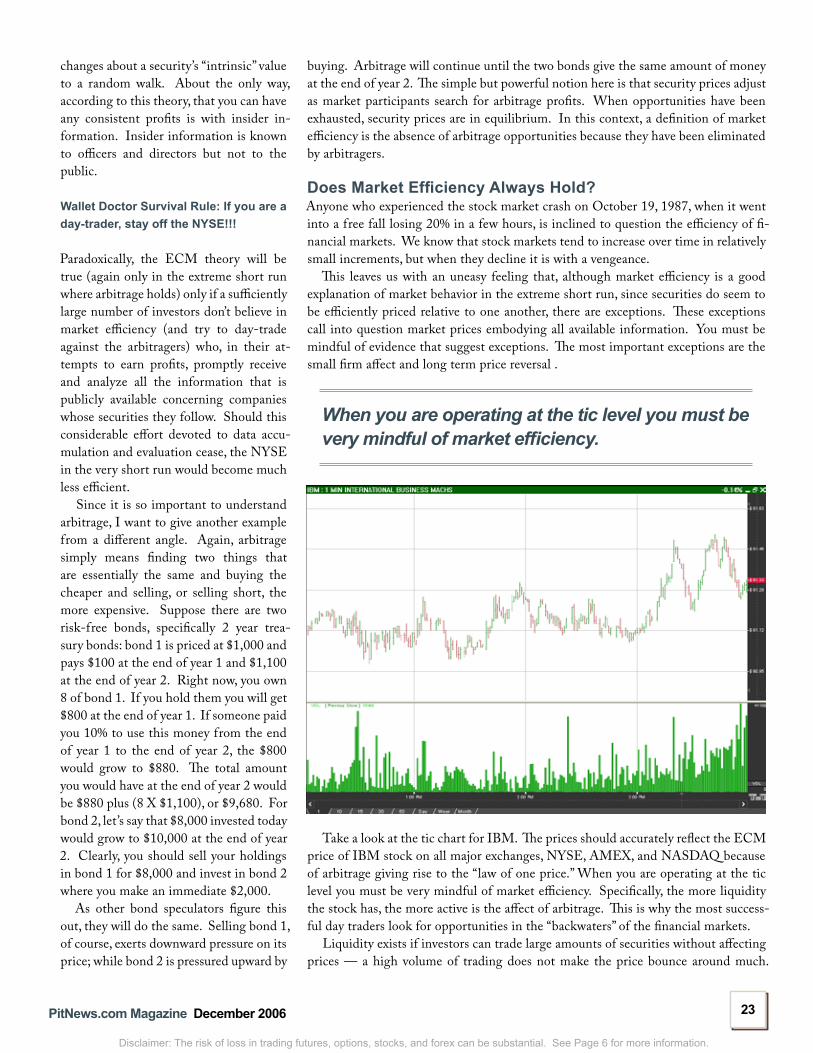
When you are operating at the tic level you must be very mindful of market efficiency.
Take a look at the tic chart for IBM. The prices should accurately reflect the ECM price of IBM stock on all major exchanges, NYSE, AMEX, and NASDAQ because of arbitrage giving rise to the “law of one price.” When you are operating at the tic level you must be very mindful of market efficiency. Specifically, the more liquidity the stock has, the more active is the affect of arbitrage. This is why the most success-ful day traders look for opportunities in the “backwaters” of the financial markets.
Liquidity exists if investors can trade large amounts of securities without affecting prices — a high volume of trading does not make the price bounce around much.
��PitNews.com Magazine December �006 ����
Disclaimer: The risk of loss in trading futures, options, stocks, and forex can be substantial. See Page 6 for more information.
Prices are said to be fair if they reflect the underlying value of the security correctly. The problem is that it is very hard to
The problem is that it is very hard to determine what the true value of a stock is...
determine what the true value of a stock is, but there are some strong clues most people don’t know how to recognize.
What Is Liquidity?There are three liquidity-related char-acteristics of a secondary market that investors find desirable: depth, breadth, and resiliency. First, a secondary market is said to have depth if there are orders both above and below the price at which the security is currently trading — people are waiting on the sidelines at each price increment to enter the market if the price goes up or down. When a security trades in a deep market, temporary imbalances of purchase or sale orders (that would otherwise create substantial price changes) encounter offsetting, and hence stabiliz-ing, sale or purchase orders reducing noisy price volatility.
Second, a secondary market is said to have breadth if orders in large volume give the market depth — lots of people are waiting to enter the market at each price increment above and below the cur-rent trading price. The broader the market for a stock, the greater the potential for stabilization of temporary price changes that may arise from order imbalances.
Third, a market is resilient if new or-ders pour in promptly in response to price changes that result from temporary order imbalances — investors act very quickly buying or selling when the stock price moves up or down. For a market to be resilient, investors must be able to quickly learn when stock price changes occur. However, what investors are most con-cerned with is having complete informa-
tion concerning a security’s current price and where that price can be obtained.
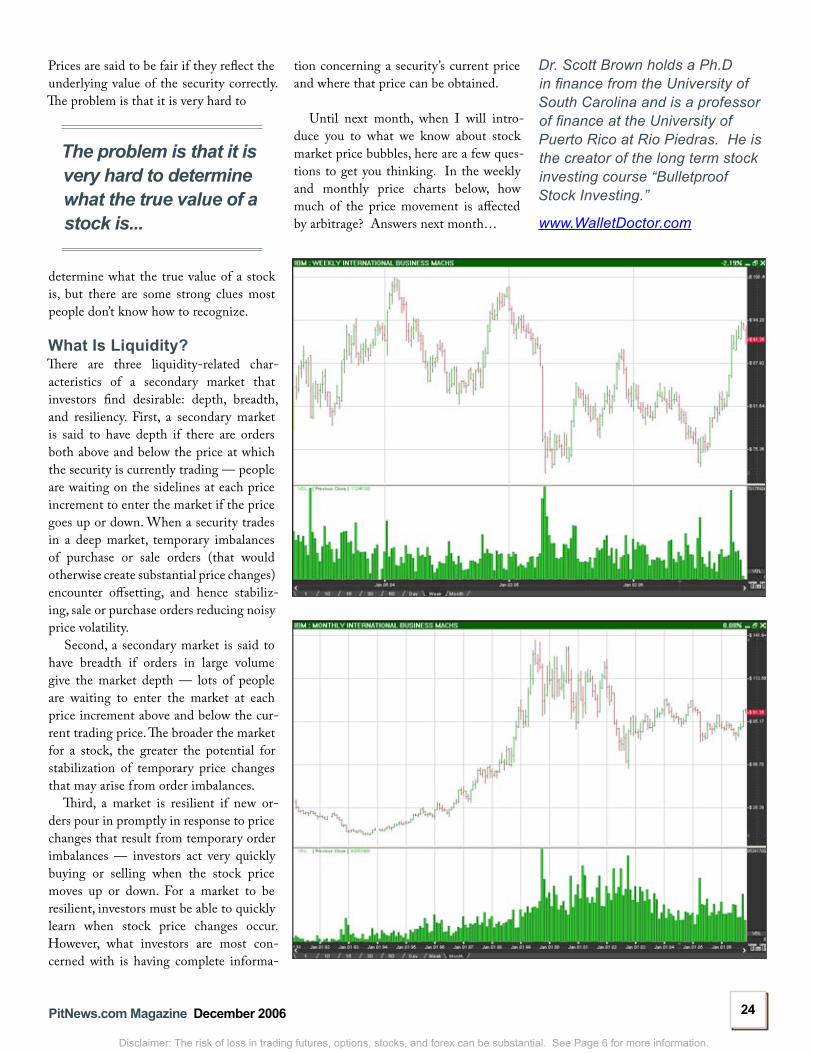
Until next month, when I will intro-duce you to what we know about stock market price bubbles, here are a few ques-tions to get you thinking. In the weekly and monthly price charts below, how much of the price movement is affected by arbitrage? Answers next month…
Dr. Scott Brown holds a Ph.D in finance from the University of South Carolina and is a professor of finance at the University of Puerto Rico at Rio Piedras. He is the creator of the long term stock investing course “Bulletproof Stock Investing.”
www.WalletDoctor.com
�6PitNews.com Magazine December �006 �6�6
Disclaimer: The risk of loss in trading futures, options, stocks, and forex can be substantial. See Page 6 for more information.
You Ain’t Seen Nothin Yet...by: Paul Brittain & Carley Garner
T he latest mantra of the financial media seems to be talk of the “bursting commodity bubble”. How-ever, as we have all come to
realize…the media tends to be wrong. They say history repeats itself, and al-
though it never really truly repeats itself exactly, it can be an excellent barometer. After all, the economy and the markets move in cycles. The most predominant cycle is the annual fluctuation of prices according to natural seasonal tendencies. However, our focus is going to be on a much larger cycle that spans between de-cades. You may have heard of the 54-year economic cycle, noted by Edward Dewy and Edwin Dakin or the 50-60 year cycle noted by Nikolai Kondratieff. While these are extreme time frames, it gives you an idea of how patterns exist in both the short term and the long term.
Commodity CyclesAlthough many of us are oblivious of this now, those in less fortunate areas of the world know all too well that commodities and thus the economy is subject to oscil-latory behavior. Raw based commodities, namely agricultural goods, petroleum and even precious metals fall into this cat-egory. Persistent instability in supply and demand and the markets constant desire for equilibrium results in pendulum price swings, or commodity cycles.
They say history repeats itself, and although it never really truly repeats itself exactly, it can be an excellent barometer.
By definition, a cycle is historical repetition or patterns that reoccur with similar characteristics. For the most part, there is a sense of periodicity associated with the timeframe of any given cycle. In the world of economics, there are five prominent cycles; growth, peak, recession, trough and recovery. Commodity cycles are very similar in nature in that there are dramatic periods of depressed and elevated prices as market supply and demand fluctuate.
��PitNews.com Magazine December �006 ����
Disclaimer: The risk of loss in trading futures, options, stocks, and forex can be substantial. See Page 6 for more information.
Inflationary CycleHowever, there is another cycle worth noting…the inflationary cycle. Not un-like the others, inflation fluctuates from extreme highs to extreme lows in search of an equilibrium level. It is important to note, that inflation has the potential to reap the fiercest repercussions. Savvy traders should always be aware of inflation cycles and be prepared to trade accord-ingly.
We have become spoiled by the 2-3% inflation rates that we currently enjoy. Those of you over the age of 30, prob-ably recall double-digit levels of inflation seen in the 70’s. The pandemonium was fueled by energy prices and rampant fear surrounding inflationary expectations. Adding to the chaos, union-driven wage negotiations were running out of control. Due to differences in monetary policy and the nature of the currency markets, there were very few outlets for inflation relative to today’s environment.
�0’s Style MarketsLooking back to the seventies, which was the last time that the U.S. economy entered into an inflationary cycle of sub-stantial magnitude, you may notice some resemblance to what we are experiencing today.
In the 70’s, there was somewhat of a “perfect storm” in the financial markets. Gold spiked to over $800 per troy ounce, inflation rates were well above 14% and OPEC was restricting oil supplies for the first time which added gasoline to the fire (pardon the pun).
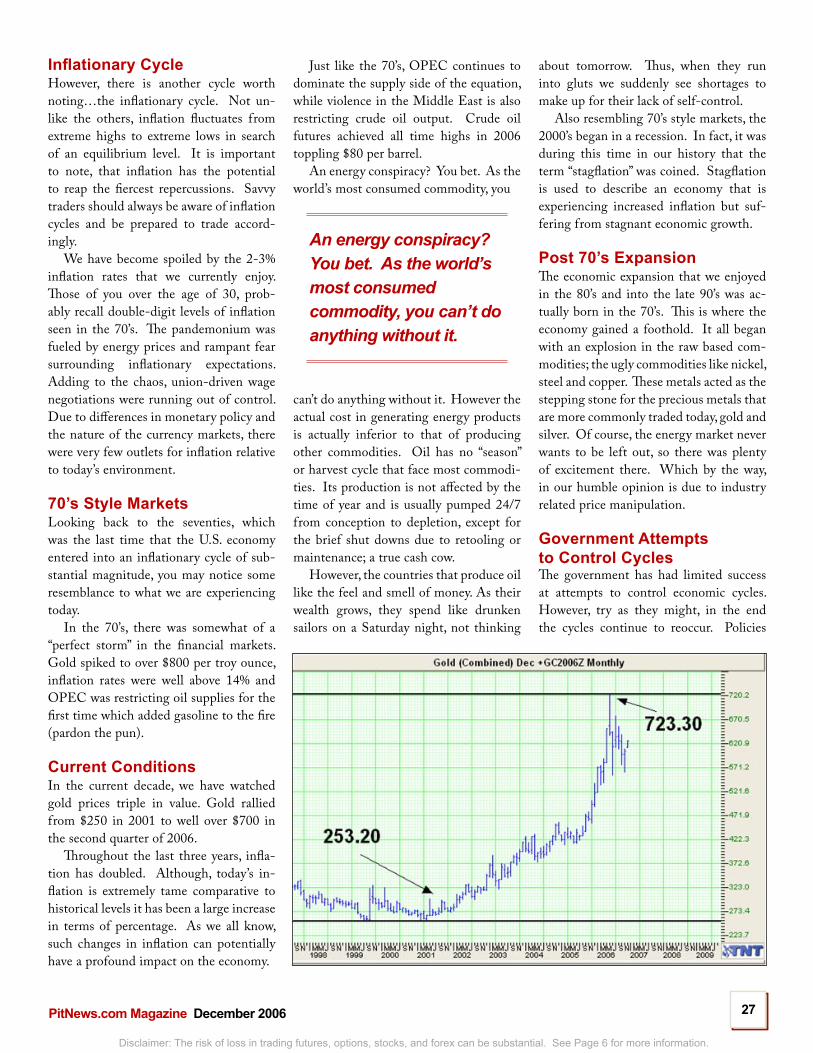
Current ConditionsIn the current decade, we have watched gold prices triple in value. Gold rallied from $250 in 2001 to well over $700 in the second quarter of 2006.
Throughout the last three years, infla-tion has doubled. Although, today’s in-flation is extremely tame comparative to historical levels it has been a large increase in terms of percentage. As we all know, such changes in inflation can potentially have a profound impact on the economy.
Just like the 70’s, OPEC continues to dominate the supply side of the equation, while violence in the Middle East is also restricting crude oil output. Crude oil futures achieved all time highs in 2006 toppling $80 per barrel.
An energy conspiracy? You bet. As the world’s most consumed commodity, you
An energy conspiracy? You bet. As the world’s most consumed commodity, you can’t do anything without it.
can’t do anything without it. However the actual cost in generating energy products is actually inferior to that of producing other commodities. Oil has no “season” or harvest cycle that face most commodi-ties. Its production is not affected by the time of year and is usually pumped 24/7 from conception to depletion, except for the brief shut downs due to retooling or maintenance; a true cash cow.
However, the countries that produce oil like the feel and smell of money. As their wealth grows, they spend like drunken sailors on a Saturday night, not thinking
about tomorrow. Thus, when they run into gluts we suddenly see shortages to make up for their lack of self-control.
Also resembling 70’s style markets, the 2000’s began in a recession. In fact, it was during this time in our history that the term “stagflation” was coined. Stagflation is used to describe an economy that is experiencing increased inflation but suf-fering from stagnant economic growth.
Post �0’s ExpansionThe economic expansion that we enjoyed in the 80’s and into the late 90’s was ac-tually born in the 70’s. This is where the economy gained a foothold. It all began with an explosion in the raw based com-modities; the ugly commodities like nickel, steel and copper. These metals acted as the stepping stone for the precious metals that are more commonly traded today, gold and silver. Of course, the energy market never wants to be left out, so there was plenty of excitement there. Which by the way, in our humble opinion is due to industry related price manipulation.
Government Attempts to Control CyclesThe government has had limited success at attempts to control economic cycles. However, try as they might, in the end the cycles continue to reoccur. Policies
aimed at mitigating the impact of cycles on the economy can be compared to speed bumps ahead of a runaway truck. The bumps cause some bouncing and swaying, but the truck continues to barrel forward…. The world goes through periods of growth and stagnation, which is usually looked on as recession, but in actuality it is just a period of rest and digestion before the next cycle begins.
As you have probably already been made aware, the Fed’s primary weapon is the Fed Funds target rate. The Federal funds rate is the interest rate on overnight loans of reserves from one bank to another. This rate is often quoted in the media and is of significant importance in the conduct of monetary policy because the Fed uses it to combat economic hindrances such as inflation, stagnation etc.
Fed Funds RateIn order to grasp the complexity of the financial markets, it is important that you understand the nature of the Fed Funds rate and the Fed’s never-ending pursuit to control the target rate. As you will find, there is no black and white in finance…only shades of gray. In other words, economic cycles along with interest rate fluctuations are not an exact science.
When the Federal Open Market Committee meets to dis-cuss monetary policy, the best they can do is make an “educated guess” based on the available information. Just as we cannot predict the direction of any given market with absolute certainty, they cannot predict what future events may bring to the state of the economy.
Despite how monetary policy may be portrayed on television or in the papers, the Fed cannot “set” the Fed Funds rate. For instance, a commonly used description of an interest rate deci-sion is ‘The Fed raised rates to 5.25%’. This is not entirely true. What the Fed has actually done is raised their target rate to 5.25%. Once a target is established they will either pump liquid-ity (or money) into or out of the domestic economy in attempt to influence the Federal Funds rate.
As you will find, there is no black and white in finance…only shades of gray.
It isn’t quite this simple, there are a few other tools that the Fed uses such as discount lending and adjusting reserve require-ments, but for the scope of this explanation will do.
The commodity markets are full of great examples of the cyclical nature of price pressure along with economic expansion and contraction. Take a look at the 30-year history of silver, sugar and soybeans. We have chosen these commodities because we feel that they offer an accurate reflection of economic activity due to the fact that they are not subject to the same level of manipulation that other markets such as crude oil might be.
�8PitNews.com Magazine December �006 �8�8
Disclaimer: The risk of loss in trading futures, options, stocks, and forex can be substantial. See Page 6 for more information.
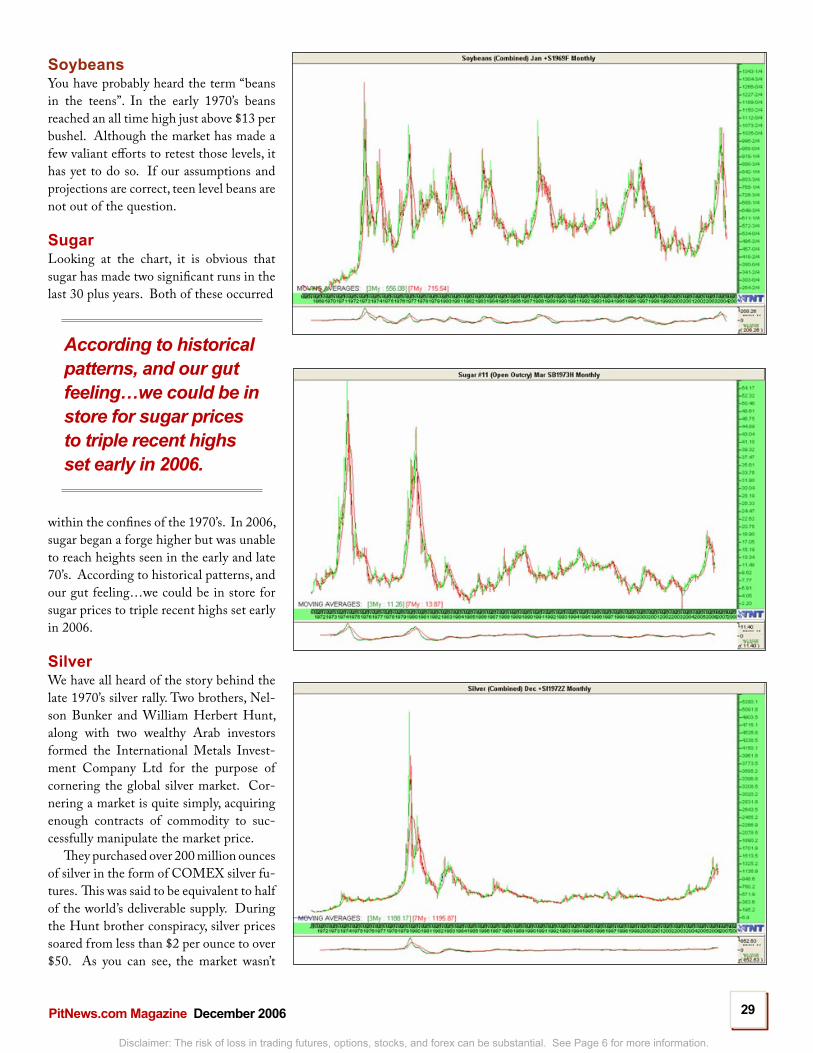
SoybeansYou have probably heard the term “beans in the teens”. In the early 1970’s beans reached an all time high just above $13 per bushel. Although the market has made a few valiant efforts to retest those levels, it has yet to do so. If our assumptions and projections are correct, teen level beans are not out of the question.
SugarLooking at the chart, it is obvious that sugar has made two significant runs in the last 30 plus years. Both of these occurred
According to historical patterns, and our gut feeling…we could be in store for sugar prices to triple recent highs set early in 2006.
within the confines of the 1970’s. In 2006, sugar began a forge higher but was unable to reach heights seen in the early and late 70’s. According to historical patterns, and our gut feeling…we could be in store for sugar prices to triple recent highs set early in 2006.
SilverWe have all heard of the story behind the late 1970’s silver rally. Two brothers, Nel-son Bunker and William Herbert Hunt, along with two wealthy Arab investors formed the International Metals Invest-ment Company Ltd for the purpose of cornering the global silver market. Cor-nering a market is quite simply, acquiring enough contracts of commodity to suc-cessfully manipulate the market price.
They purchased over 200 million ounces of silver in the form of COMEX silver fu-tures. This was said to be equivalent to half of the world’s deliverable supply. During the Hunt brother conspiracy, silver prices soared from less than $2 per ounce to over $50. As you can see, the market wasn’t
��PitNews.com Magazine December �006 ����
Disclaimer: The risk of loss in trading futures, options, stocks, and forex can be substantial. See Page 6 for more information.

30PitNews.com Magazine December �006 3030
Disclaimer: The risk of loss in trading futures, options, stocks, and forex can be substantial. See Page 6 for more information.
capable of sustaining those prices and quickly retreated. Whether or not we will ever see $50 silver is yet to be seen,
but a rally exceeding prices set in early 2006 are a potential. De-spite the fact that silvers prices in the 70’s were manipulated, it won’t necessarily take an event such as the Hunt brothers’ fiasco to reenact the scenario. There are a lot of so-called “silver bugs” looking for a repeat. Sometimes the market will search for a reason to retest old highs as opposed to legitimate fundamental or even technical move. Hi Ho Silver!!
ConclusionIt is easy to see that current prices, although high, are nowhere near the highs set throughout the 1970’s. Let’s not even begin to think about the effects that inflation would have on this analysis. Can we see a repeat of these types of markets? Well, many ana-lysts feel that it is inevitable. Based upon a standard projection, the next highs could and should exceed the ones we see here. Are you going to be there?
Paul Brittain and Carley Garner are futures and options brokers in the Las Vegas branch of Alaron Trading. They are also trader educators through www.CommodityTradingSchool.com and are widely published in their field.
Free Newsletters!
1.800.935.6492Or Call Us Today!
Disclaimer: There is risk of loss in Futures and Options Trading
Sign up online!www.AlaronLasVegas.com
Trading the Year-End Rush in the Euroby: Scott Barrie
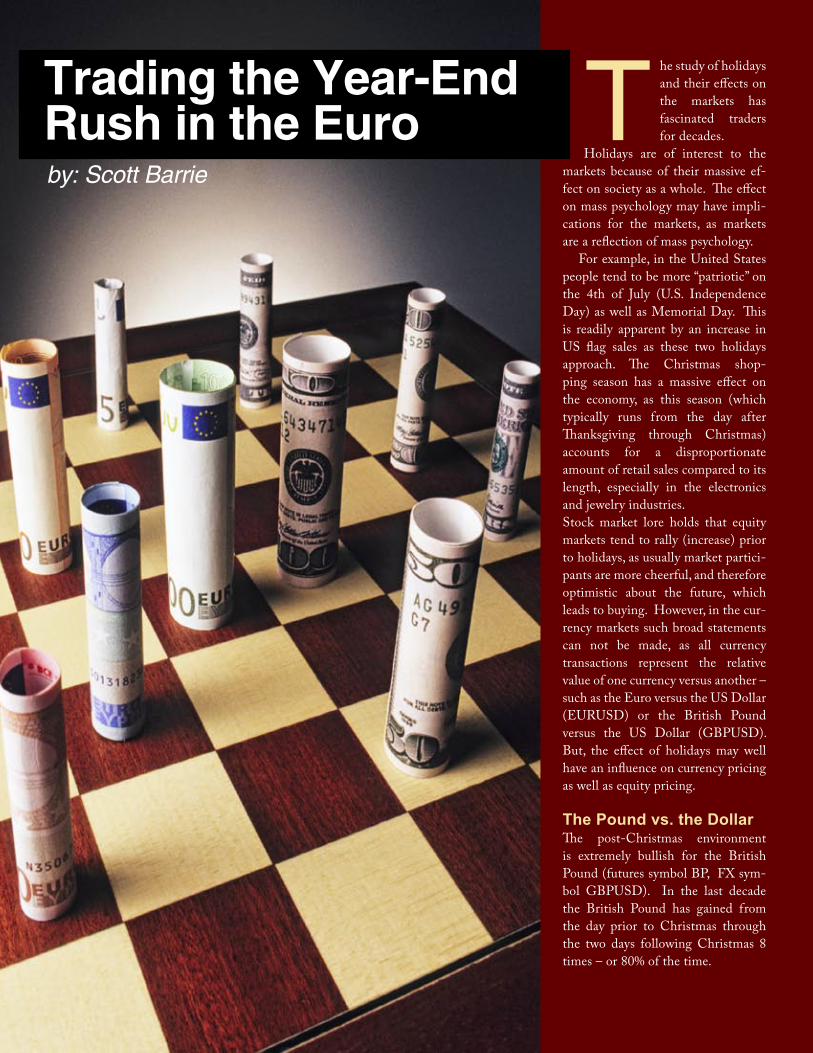
T he study of holidays and their effects on the markets has fascinated traders for decades.
Holidays are of interest to the markets because of their massive ef-fect on society as a whole. The effect on mass psychology may have impli-cations for the markets, as markets are a reflection of mass psychology.
For example, in the United States people tend to be more “patriotic” on the 4th of July (U.S. Independence Day) as well as Memorial Day. This is readily apparent by an increase in US flag sales as these two holidays approach. The Christmas shop-ping season has a massive effect on the economy, as this season (which typically runs from the day after Thanksgiving through Christmas) accounts for a disproportionate amount of retail sales compared to its length, especially in the electronics and jewelry industries.Stock market lore holds that equity markets tend to rally (increase) prior to holidays, as usually market partici-pants are more cheerful, and therefore optimistic about the future, which leads to buying. However, in the cur-rency markets such broad statements can not be made, as all currency transactions represent the relative value of one currency versus another – such as the Euro versus the US Dollar (EURUSD) or the British Pound versus the US Dollar (GBPUSD). But, the effect of holidays may well have an influence on currency pricing as well as equity pricing.
The Pound vs. the DollarThe post-Christmas environment is extremely bullish for the British Pound (futures symbol BP, FX sym-bol GBPUSD). In the last decade the British Pound has gained from the day prior to Christmas through the two days following Christmas 8 times – or 80% of the time.
3�PitNews.com Magazine December �006 3�3�
Disclaimer: The risk of loss in trading futures, options, stocks, and forex can be substantial. See Page 6 for more information.
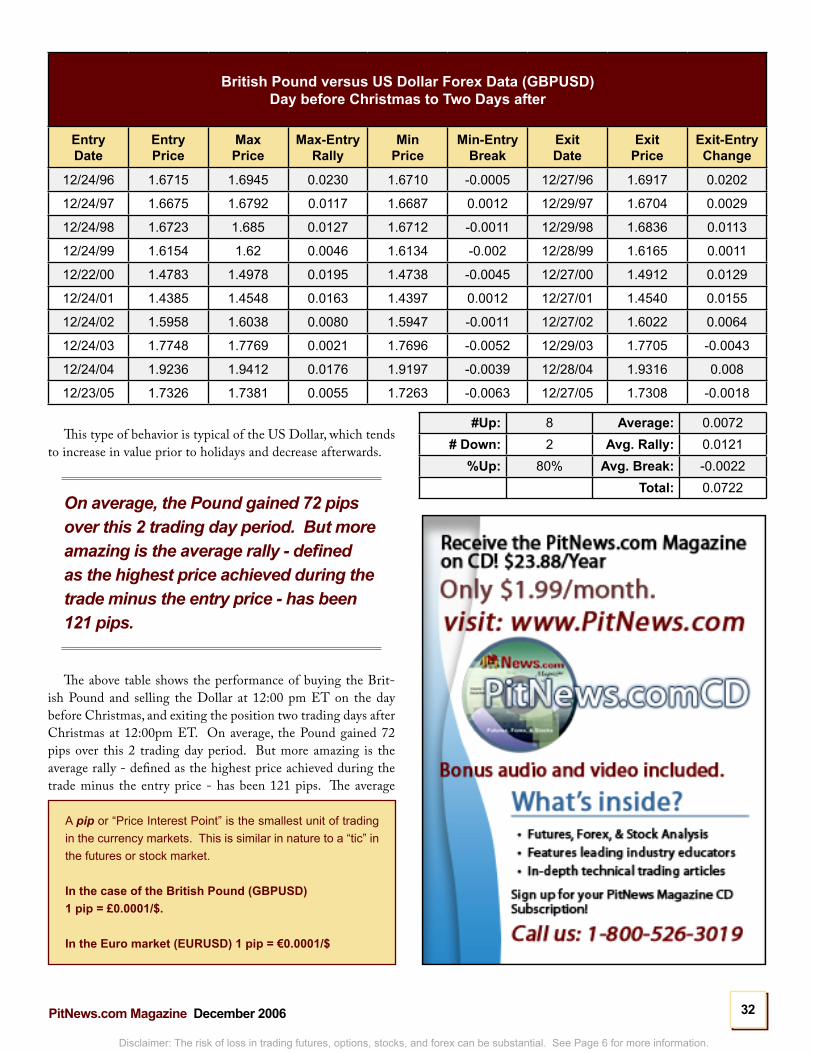
This type of behavior is typical of the US Dollar, which tends to increase in value prior to holidays and decrease afterwards.
On average, the Pound gained 72 pips over this 2 trading day period. But more amazing is the average rally - defined as the highest price achieved during the trade minus the entry price - has been 121 pips.
The above table shows the performance of buying the Brit-ish Pound and selling the Dollar at 12:00 pm ET on the day before Christmas, and exiting the position two trading days after Christmas at 12:00pm ET. On average, the Pound gained 72 pips over this 2 trading day period. But more amazing is the average rally - defined as the highest price achieved during the trade minus the entry price - has been 121 pips. The average
British Pound versus US Dollar Forex Data (GBPUSD)Day before Christmas to Two Days after
Entry Date
Entry Price
Max Price
Max-EntryRally
MinPrice
Min-EntryBreak
Exit Date
Exit Price
Exit-EntryChange
12/24/96 1.6715 1.6945 0.0230 1.6710 -0.0005 12/27/96 1.6917 0.0202
12/24/97 1.6675 1.6792 0.0117 1.6687 0.0012 12/29/97 1.6704 0.0029
12/24/98 1.6723 1.685 0.0127 1.6712 -0.0011 12/29/98 1.6836 0.0113
12/24/99 1.6154 1.62 0.0046 1.6134 -0.002 12/28/99 1.6165 0.0011
12/22/00 1.4783 1.4978 0.0195 1.4738 -0.0045 12/27/00 1.4912 0.0129
12/24/01 1.4385 1.4548 0.0163 1.4397 0.0012 12/27/01 1.4540 0.0155
12/24/02 1.5958 1.6038 0.0080 1.5947 -0.0011 12/27/02 1.6022 0.0064
12/24/03 1.7748 1.7769 0.0021 1.7696 -0.0052 12/29/03 1.7705 -0.0043
12/24/04 1.9236 1.9412 0.0176 1.9197 -0.0039 12/28/04 1.9316 0.008
12/23/05 1.7326 1.7381 0.0055 1.7263 -0.0063 12/27/05 1.7308 -0.0018
A pip or “Price Interest Point” is the smallest unit of trading in the currency markets. This is similar in nature to a “tic” in the futures or stock market.
In the case of the British Pound (GBPUSD)1 pip = £0.0001/$.
In the Euro market (EURUSD) 1 pip = €0.0001/$
#Up: 8 Average: 0.0072# Down: 2 Avg. Rally: 0.0121
%Up: 80% Avg. Break: -0.0022Total: 0.0722
33PitNews.com Magazine December �006 3333
Disclaimer: The risk of loss in trading futures, options, stocks, and forex can be substantial. See Page 6 for more information.
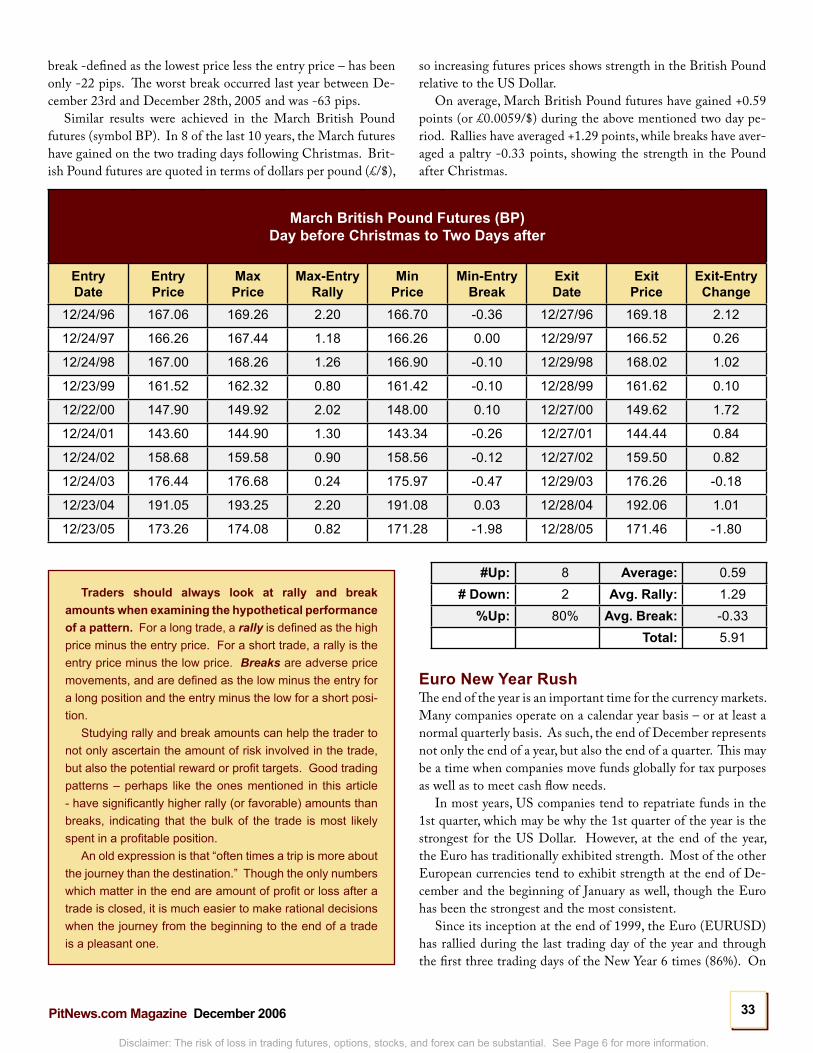
so increasing futures prices shows strength in the British Pound relative to the US Dollar.
On average, March British Pound futures have gained +0.59 points (or £0.0059/$) during the above mentioned two day pe-riod. Rallies have averaged +1.29 points, while breaks have aver-aged a paltry -0.33 points, showing the strength in the Pound after Christmas.
Euro New Year Rush The end of the year is an important time for the currency markets. Many companies operate on a calendar year basis – or at least a normal quarterly basis. As such, the end of December represents not only the end of a year, but also the end of a quarter. This may be a time when companies move funds globally for tax purposes as well as to meet cash flow needs.
In most years, US companies tend to repatriate funds in the 1st quarter, which may be why the 1st quarter of the year is the strongest for the US Dollar. However, at the end of the year, the Euro has traditionally exhibited strength. Most of the other European currencies tend to exhibit strength at the end of De-cember and the beginning of January as well, though the Euro has been the strongest and the most consistent.
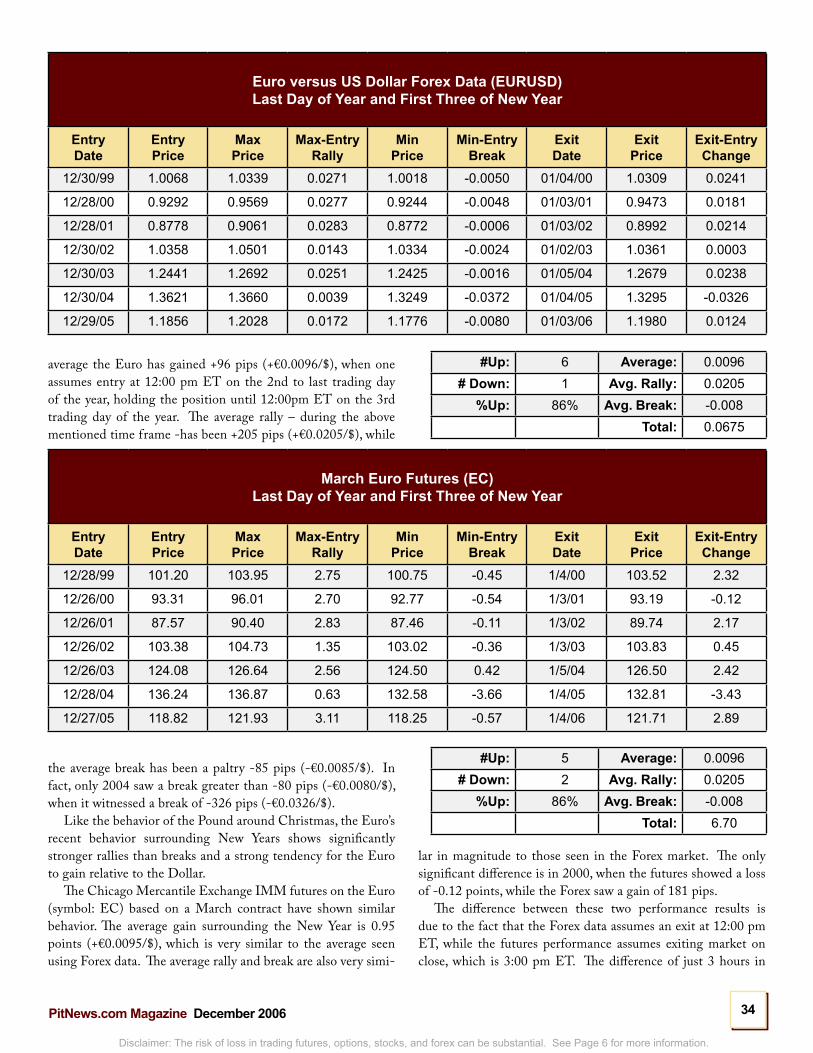
Since its inception at the end of 1999, the Euro (EURUSD) has rallied during the last trading day of the year and through the first three trading days of the New Year 6 times (86%). On
break -defined as the lowest price less the entry price – has been only -22 pips. The worst break occurred last year between De-cember 23rd and December 28th, 2005 and was -63 pips.
Similar results were achieved in the March British Pound futures (symbol BP). In 8 of the last 10 years, the March futures have gained on the two trading days following Christmas. Brit-ish Pound futures are quoted in terms of dollars per pound (£/$),
March British Pound Futures (BP) Day before Christmas to Two Days after
Entry Date
Entry Price
Max Price
Max-EntryRally
MinPrice
Min-EntryBreak
Exit Date
Exit Price
Exit-EntryChange
12/24/96 167.06 169.26 2.20 166.70 -0.36 12/27/96 169.18 2.12
12/24/97 166.26 167.44 1.18 166.26 0.00 12/29/97 166.52 0.26
12/24/98 167.00 168.26 1.26 166.90 -0.10 12/29/98 168.02 1.02
12/23/99 161.52 162.32 0.80 161.42 -0.10 12/28/99 161.62 0.10
12/22/00 147.90 149.92 2.02 148.00 0.10 12/27/00 149.62 1.72
12/24/01 143.60 144.90 1.30 143.34 -0.26 12/27/01 144.44 0.84
12/24/02 158.68 159.58 0.90 158.56 -0.12 12/27/02 159.50 0.82
12/24/03 176.44 176.68 0.24 175.97 -0.47 12/29/03 176.26 -0.18
12/23/04 191.05 193.25 2.20 191.08 0.03 12/28/04 192.06 1.01
12/23/05 173.26 174.08 0.82 171.28 -1.98 12/28/05 171.46 -1.80
#Up: 8 Average: 0.59# Down: 2 Avg. Rally: 1.29
%Up: 80% Avg. Break: -0.33Total: 5.91
Traders should always look at rally and break amounts when examining the hypothetical performance of a pattern. For a long trade, a rally is defined as the high price minus the entry price. For a short trade, a rally is the entry price minus the low price. Breaks are adverse price movements, and are defined as the low minus the entry for a long position and the entry minus the low for a short posi-tion.
Studying rally and break amounts can help the trader to not only ascertain the amount of risk involved in the trade, but also the potential reward or profit targets. Good trading patterns – perhaps like the ones mentioned in this article - have significantly higher rally (or favorable) amounts than breaks, indicating that the bulk of the trade is most likely spent in a profitable position.
An old expression is that “often times a trip is more about the journey than the destination.” Though the only numbers which matter in the end are amount of profit or loss after a trade is closed, it is much easier to make rational decisions when the journey from the beginning to the end of a trade is a pleasant one.
3�PitNews.com Magazine December �006 3�3�
Disclaimer: The risk of loss in trading futures, options, stocks, and forex can be substantial. See Page 6 for more information.
average the Euro has gained +96 pips (+€0.0096/$), when one assumes entry at 12:00 pm ET on the 2nd to last trading day of the year, holding the position until 12:00pm ET on the 3rd trading day of the year. The average rally – during the above mentioned time frame -has been +205 pips (+€0.0205/$), while
the average break has been a paltry -85 pips (-€0.0085/$). In fact, only 2004 saw a break greater than -80 pips (-€0.0080/$), when it witnessed a break of -326 pips (-€0.0326/$).
Like the behavior of the Pound around Christmas, the Euro’s recent behavior surrounding New Years shows significantly stronger rallies than breaks and a strong tendency for the Euro to gain relative to the Dollar.
The Chicago Mercantile Exchange IMM futures on the Euro (symbol: EC) based on a March contract have shown similar behavior. The average gain surrounding the New Year is 0.95 points (+€0.0095/$), which is very similar to the average seen using Forex data. The average rally and break are also very simi-
Euro versus US Dollar Forex Data (EURUSD)Last Day of Year and First Three of New Year
Entry Date
Entry Price
Max Price
Max-EntryRally
MinPrice
Min-EntryBreak
Exit Date
Exit Price
Exit-EntryChange
12/30/99 1.0068 1.0339 0.0271 1.0018 -0.0050 01/04/00 1.0309 0.0241
12/28/00 0.9292 0.9569 0.0277 0.9244 -0.0048 01/03/01 0.9473 0.0181
12/28/01 0.8778 0.9061 0.0283 0.8772 -0.0006 01/03/02 0.8992 0.0214
12/30/02 1.0358 1.0501 0.0143 1.0334 -0.0024 01/02/03 1.0361 0.0003
12/30/03 1.2441 1.2692 0.0251 1.2425 -0.0016 01/05/04 1.2679 0.0238
12/30/04 1.3621 1.3660 0.0039 1.3249 -0.0372 01/04/05 1.3295 -0.0326
12/29/05 1.1856 1.2028 0.0172 1.1776 -0.0080 01/03/06 1.1980 0.0124
#Up: 6 Average: 0.0096# Down: 1 Avg. Rally: 0.0205
%Up: 86% Avg. Break: -0.008Total: 0.0675
lar in magnitude to those seen in the Forex market. The only significant difference is in 2000, when the futures showed a loss of -0.12 points, while the Forex saw a gain of 181 pips.
The difference between these two performance results is due to the fact that the Forex data assumes an exit at 12:00 pm ET, while the futures performance assumes exiting market on close, which is 3:00 pm ET. The difference of just 3 hours in
March Euro Futures (EC)Last Day of Year and First Three of New Year
Entry Date
Entry Price
Max Price
Max-EntryRally
MinPrice
Min-EntryBreak
Exit Date
Exit Price
Exit-EntryChange
12/28/99 101.20 103.95 2.75 100.75 -0.45 1/4/00 103.52 2.32
12/26/00 93.31 96.01 2.70 92.77 -0.54 1/3/01 93.19 -0.12
12/26/01 87.57 90.40 2.83 87.46 -0.11 1/3/02 89.74 2.17
12/26/02 103.38 104.73 1.35 103.02 -0.36 1/3/03 103.83 0.45
12/26/03 124.08 126.64 2.56 124.50 0.42 1/5/04 126.50 2.42
12/28/04 136.24 136.87 0.63 132.58 -3.66 1/4/05 132.81 -3.43
12/27/05 118.82 121.93 3.11 118.25 -0.57 1/4/06 121.71 2.89
#Up: 5 Average: 0.0096# Down: 2 Avg. Rally: 0.0205
%Up: 86% Avg. Break: -0.008Total: 6.70
35PitNews.com Magazine December �006 3535
Disclaimer: The risk of loss in trading futures, options, stocks, and forex can be substantial. See Page 6 for more information.
the currency markets can make a tremendous difference – as we saw on January 3rd, 2001. This is why traders need to examine not only closed P&Ls from trading histories, but also study the amount of rallies and breaks to understand the volatility in the marketplace.
ConclusionThe currency market is a multi-billion dollar a day market dominated by large banks and institutions. Small speculators – like the individual trader – may be well served by looking for opportunities at times when the major players are paying less attention. Such times may well be holidays.
By examining these specific times of the year, traders may be able to glean profitable patterns upon which to base their market operations.
Because markets are made up of people, mass moods and behaviors induced by the holidays may have a dramatic and quantifiable effect on the markets – even the currency markets. By examining these specific times of the year, traders may be able to glean profitable patterns upon which to base their market operations.
Of course, the currency marketplace is ever-changing in na-ture. Patterns, such as the ones mentioned above, may not repeat themselves, or they can change in terms of magnitude. However, as speculators our goal is to find potentially profitable patterns (or cycles) and take advantage of them until they stop working. Hopefully, we can get a few more good years out of these pat-terns before they become well known and are anticipated and changed by their acceptance in the marketplace.
Scott Barrie has worked in the futures and op-tions industry for over a decade. His background includes being a floor trader, a consultant with a major risk management firm, running a small private hedge fund, as well as an analyst for a regional futures and options brokerage firm.
www.GrainGuide.com
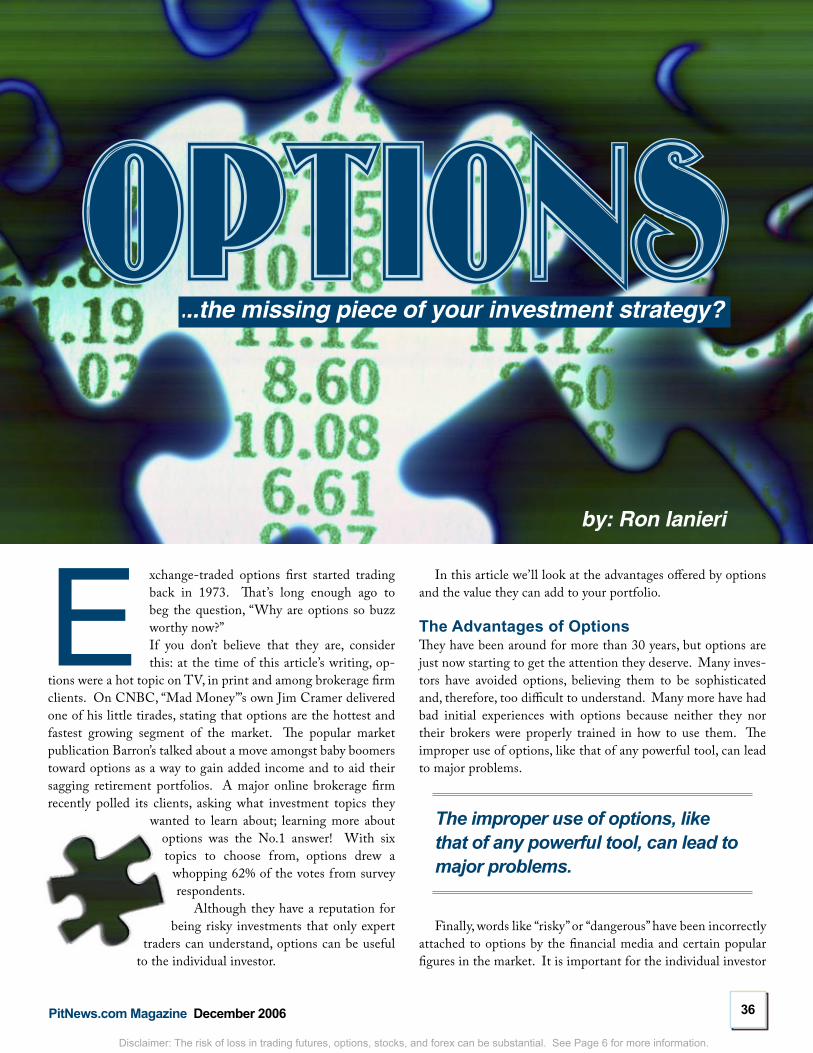
36PitNews.com Magazine December �006 3636
Disclaimer: The risk of loss in trading futures, options, stocks, and forex can be substantial. See Page 6 for more information.
...the missing piece of your investment strategy?
E xchange-traded options first started trading back in 1973. That’s long enough ago to beg the question, “Why are options so buzz worthy now?”If you don’t believe that they are, consider this: at the time of this article’s writing, op-
tions were a hot topic on TV, in print and among brokerage firm clients. On CNBC, “Mad Money”’s own Jim Cramer delivered one of his little tirades, stating that options are the hottest and fastest growing segment of the market. The popular market publication Barron’s talked about a move amongst baby boomers toward options as a way to gain added income and to aid their sagging retirement portfolios. A major online brokerage firm recently polled its clients, asking what investment topics they
wanted to learn about; learning more about options was the No.1 answer! With six topics to choose from, options drew a
whopping 62% of the votes from survey respondents.
Although they have a reputation for being risky investments that only expert
traders can understand, options can be useful to the individual investor.
by: Ron Ianieri
OPTIONS
In this article we’ll look at the advantages offered by options and the value they can add to your portfolio.
The Advantages of OptionsThey have been around for more than 30 years, but options are just now starting to get the attention they deserve. Many inves-tors have avoided options, believing them to be sophisticated and, therefore, too difficult to understand. Many more have had bad initial experiences with options because neither they nor their brokers were properly trained in how to use them. The improper use of options, like that of any powerful tool, can lead to major problems.
The improper use of options, like that of any powerful tool, can lead to major problems.
Finally, words like “risky” or “dangerous” have been incorrectly attached to options by the financial media and certain popular figures in the market. It is important for the individual investor
3�PitNews.com Magazine December �006 3�3�
Disclaimer: The risk of loss in trading futures, options, stocks, and forex can be substantial. See Page 6 for more information.
to get both sides of the story before making a decision about the value of options.
These are the main advantages (in no particular order) that options may give an investor:
With advantages like these, you can see how those who have been using options for a while would be at a loss to explain op-tions’ lack of popularity in the past. Let’s look into these advan-tages one by one.
Cost EfficiencyOptions have great leveraging power. An investor can obtain an option position that will mimic a stock position almost identi-cally, but at a huge cost savings. For example, in order to purchase 200 shares of an $80 stock, an investor must pay out $16,000.
Options have great leveraging power. An investor can obtain an option position that will mimic a stock position almost identically, but at a huge cost savings.
However, if the investor were to purchase two call option contracts for $20 each (with each contract representing 100 shares), the total outlay would be only $4,000 (2 contracts X 100 shares/contract X $20 market price). The investor would
then have an additional $12,000 to use at his or her discretion. Obviously, it is not quite as simple as that. The investor has to pick the right call to purchase (a topic for another discus-sion) in order to mimic the stock position properly. However, this strategy, known as stock replacement, is not only viable but also practical and cost efficient.
Assume you wish to purchase Schlumberger (SLB) because you think it will be going up over the next several months. You want to buy 200 shares while SLB is trading at $131, which would cost you a total of $26,200. Instead of putting up that much money, you could have gone into the options market, picked the proper option that mimics the stock closely, and bought the August call option with a strike price of $100, for $34. In order to acquire a position equivalent in size to the 200 shares mentioned above, you would need to buy two contracts. This would bring your total investment to $6,800 (2 contracts X 100 shares/contract X $34 market price), as opposed to $26,200. The difference could be left in your account to gain interest or applied to another opportunity - which provides better diversifi-cation potential, among other things.
Less Risky... Depending on How You Use ThemThere are situations in which buying options is riskier than own-ing equities, but there are also times when options can be used to reduce risk. It really depends on how you use them. Options can be less risky for investors because they require less financial commitment than equities, and they can also be less risky due to their relative imperviousness to the potentially catastrophic effects of gap openings.
Options are the most dependable form of hedge, and this also makes them safer than stocks. When an investor purchases stock, a stop-loss order is frequently placed to protect the position. The stop order is designed to “stop” losses below a predetermined price identified by the investor. The problem with these orders lies in the nature of the order itself. A stop order is executed when the stock trades at or below the limit as indicated in the order.
For example, assume you buy a stock at $50. You do not wish to lose any more than 10% of your investment, so you place a $45 stop order. This order will become a market order to sell once the stock trades at or below $45. This order works during the day, but it may lead to problems at night. Say you go to bed with the stock having closed at $51. The next morning, when you wake up and turn on CNBC, you hear that there is breaking news on your stock. It seems that the company’s CEO has been lying about the earnings reports for quite some time now, and there are also rumors of embezzlement. The stock is indicated to open down around $20. When that happens, $20 will be the first trade below your stop order’s $45 limit price. So, when the
1. they may provide increased cost efficiency; 2. they may be less risky than equities; 3. they have the potential to deliver higher percentage returns; and �. they offer a number of strategic alternatives.
There are two basic types of options: Calls and Puts.
A Call Option gives the buyer the right, but not the obliga-tion, to purchase the underlying at a specific price anytime during the life of the option.
A Put Option gives the buyer the right, but not the obliga-tion, to sell the underlying at a specific price anytime during the life of the option.
Note that underlying can be any vehicle: Stock, Futures contract, or Forex cross rate. Options are available on all of these vehicles, and as such the information contained in this article is applicable to all types of traders.
38PitNews.com Magazine December �006 3838
Disclaimer: The risk of loss in trading futures, options, stocks, and forex can be substantial. See Page 6 for more information.
stock opens, you sell at $20, locking in a considerable loss. The stop-loss order was not there for you when you
needed it most. Had you purchased a put option
for protection, you would not have had to suffer the catastrophic loss. Unlike stop-loss orders,
options do not shut down when the market closes. They give you insurance 24 hours a day, seven days a week. This is something that stop orders can’t do. This is why options are considered a dependable form of hedging.
Furthermore, as an alternative to purchasing the stock, you could have employed the strategy mentioned above (stock re-placement), where you purchase an in-the-money call instead of purchasing the stock. There are options that will mimic up to 85% of a stock’s performance, but cost one-quarter the price of the stock. If you had purchased the $45 strike call instead of the stock, your loss would be limited to what you spent on the op-tion. If you paid $6 for the option, you would have lost only that $6, not the $31 you lost if you owned the stock. The effectiveness of stop orders pales in comparison to the natural, full-time stop offered by options.
Higher Potential ReturnsYou don’t need a calculator to figure out that if you spend much less money and make almost the same profit, you have a higher percentage return. When they pay off, that’s what options typi-cally offer to investors.
For example, using the scenario from above, let’s compare the percentage returns of the stock (purchased for $50) and the option (purchased at $6). Let us also say that the option has a delta of 80, meaning that the option’s price will change 80% of the stock’s price change. If the stock were to go up $5, your stock position would provide a 10% return. Your option position would gain 80% of the stock movement (due to its 80 delta), or $4. A $4 gain on a $6 investment amounts to a 67% return - much better than the 10% return on the stock. Of course, we must point out that when the trade doesn’t go your way, options can exact a heavy toll - there is the possibility that you will lose 100% of your investment.
More Strategic AlternativesThe final major advantage of options is that they offer more investment alternatives. Options are a very flexible tool. There are many ways to use options to recreate other positions. We call these positions synthetics.
Synthetic positions present investors with multiple ways to attain the same in-vestment goals, and this can be very, very useful. While synthetic positions are con-sidered an advanced option topic, there are many other examples of how options offer
3�PitNews.com Magazine December �006 3�3�
Disclaimer: The risk of loss in trading futures, options, stocks, and forex can be substantial. See Page 6 for more information.
strategic alternatives. For example, many investors use brokers that charge a margin when an investor wants to short a stock. The cost of this margin requirement can be quite prohibitive. Other investors use brokers that simply do not allow for the shorting of stocks, period. The inability to play the downside when needed virtually handcuffs investors and forces them into a black and white world while the market trades in color. But no broker has any rule against investors purchasing puts to play the downside, and this is a definite benefit of options trading.
The use of options also allows the investor to trade the market’s “third dimension”, if you will: no direction. Options allow the investor to trade not only stock movements, but also the passage of time and movements in volatility. Most stocks don’t have large moves most of the time. Only a few stocks actu-ally move significantly, and then they do it rarely. Your ability to take advantage of stagnation could turn out to be the factor that decides whether your financial goals are reached or whether they remain simply a pipe dream. Only options offer the strategic alternatives necessary to profit in every type of market.
ConclusionHaving reviewed the primary advantages of options, it’s evident why they seem to be the center of attention in financial circles today. With online brokerages providing direct access to the op-tions markets through the internet and insanely low commission
costs, the average retail investor now has the ability to use the most powerful tool in the investment industry just like the pros do. So, take the initiative and dedicate some time to learning how to use options properly.
Remember, options can provide these advantages to your portfolio:
1. Greater Cost Efficiency �. Less Risk 3. Higher Potential Returns �. More Strategic Alternatives
It is the dawn of a new era for individual investors. Don’t get left behind!
Ron Ianieri is co-founder and chief options strategist at OptionsUniversity.com. A former professional op-tions trader, market maker, and 10-year floor trader on the Philadelphia options exchange, Ron played an integral role in the development of proprietary trading and strategic risk management programs for large, fast-growing specialty units. You can see more of Ron’s work by visiting: www.Options-University.com.
Whether you're trading or hedging—you need the invaluable insights only found in the inaugural edition of the Commodity Trader's Almanac. - Highlights important market-based data and informs you of different market tendencies
- Alerts you to seasonal opportunities and dangers
- Provides monthly and daily reminders
- Furnishes a historical viewpoint
www.CommoditySeasonals.com
Get your copy today!
COMMODITY TRADER’S ALMANAC 2007Knowledge of the past and awareness of the present are essential!
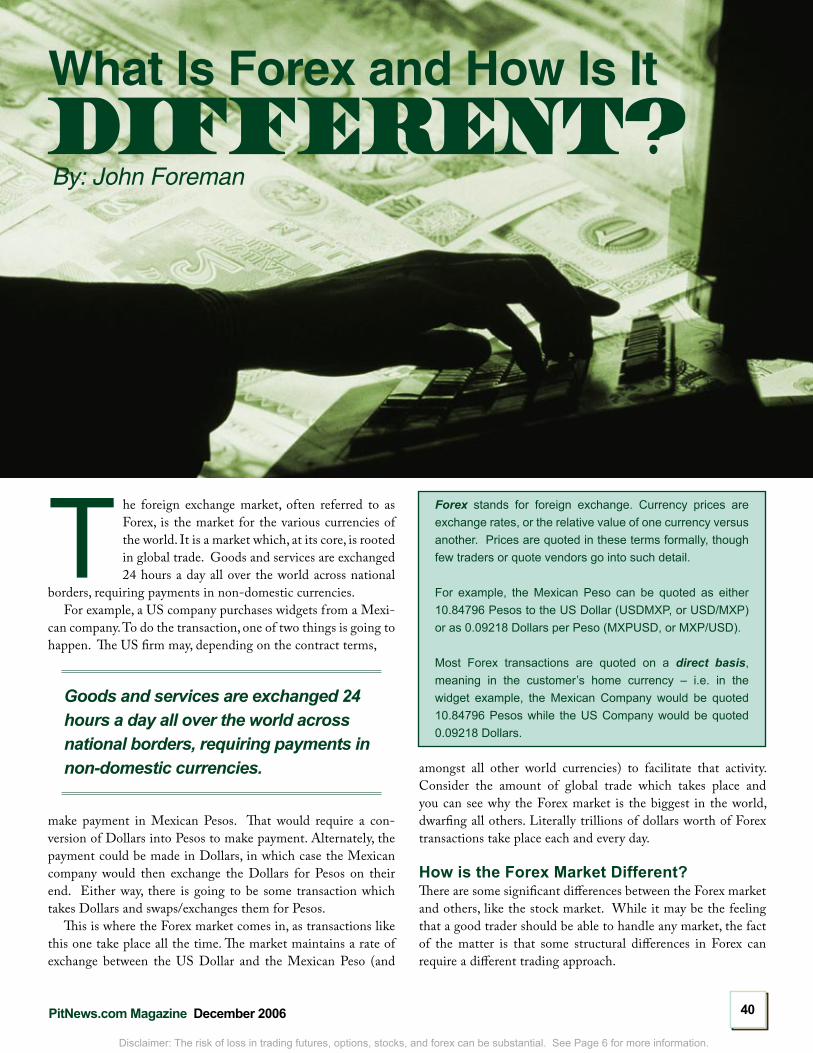
�0PitNews.com Magazine December �006 �0�0
Disclaimer: The risk of loss in trading futures, options, stocks, and forex can be substantial. See Page 6 for more information.
What Is Forex and How Is It
By: John Foreman
T he foreign exchange market, often referred to as Forex, is the market for the various currencies of the world. It is a market which, at its core, is rooted in global trade. Goods and services are exchanged 24 hours a day all over the world across national
borders, requiring payments in non-domestic currencies.For example, a US company purchases widgets from a Mexi-
can company. To do the transaction, one of two things is going to happen. The US firm may, depending on the contract terms,
Goods and services are exchanged 24 hours a day all over the world across national borders, requiring payments in non-domestic currencies.
make payment in Mexican Pesos. That would require a con-version of Dollars into Pesos to make payment. Alternately, the payment could be made in Dollars, in which case the Mexican company would then exchange the Dollars for Pesos on their end. Either way, there is going to be some transaction which takes Dollars and swaps/exchanges them for Pesos.
This is where the Forex market comes in, as transactions like this one take place all the time. The market maintains a rate of exchange between the US Dollar and the Mexican Peso (and
amongst all other world currencies) to facilitate that activity. Consider the amount of global trade which takes place and you can see why the Forex market is the biggest in the world, dwarfing all others. Literally trillions of dollars worth of Forex transactions take place each and every day.
How is the Forex Market Different?There are some significant differences between the Forex market and others, like the stock market. While it may be the feeling that a good trader should be able to handle any market, the fact of the matter is that some structural differences in Forex can require a different trading approach.
Forex stands for foreign exchange. Currency prices are exchange rates, or the relative value of one currency versus another. Prices are quoted in these terms formally, though few traders or quote vendors go into such detail.
For example, the Mexican Peso can be quoted as either 10.84796 Pesos to the US Dollar (USDMXP, or USD/MXP) or as 0.09218 Dollars per Peso (MXPUSD, or MXP/USD).
Most Forex transactions are quoted on a direct basis, meaning in the customer’s home currency – i.e. in the widget example, the Mexican Company would be quoted 10.84796 Pesos while the US Company would be quoted 0.09218 Dollars.
�1PitNews.com Magazine December �006 �1�1
Disclaimer: The risk of loss in trading futures, options, stocks, and forex can be substantial. See Page 6 for more information.
TimeFor most stock and futures traders, the first difference they will notice between the Forex market and these others is timeframe. Although the hours of stock or futures trading have been expand-ing in recent years, the Forex market is still the only one which can truly be viewed as 24-hour. There is ready Forex trading activity in all time zones during the week, and sometimes even on the weekends as well. Other markets may in fact transact 24 hours, but the volume outside their primary trading day is thin and inconsistent.
No ExchangesThe lack of an exchange is probably the next big thing that sticks out as being different in Forex. While it is true that there is ex-change-based Forex trading in the form of futures, the primary trading takes place over-the-counter via the spot market. There is no NYSE of Forex.
On the largest scale, Forex transactions are done in what is referred to as the inter-bank market. That literally means banks trading with each other on behalf of their customers. Larger speculators also operate in the inter-bank market where they can execute multi-million dollar trades with ease. Individual trad-
The fact that the firm representing the customer takes the opposite side of the transaction may be of great concern to many potential traders. This is a serious concern, but in actuality it is not that different from exchange-traded vehicles.
In exchange-traded instruments (stocks or futures) the broker makes a commission for executing the transaction, while the exchange representative – Specialist, Market-Mak-er, or “Local” – establishes the bid/offer spread, and collects the difference (meaning the customer buys the offer/ask from the members selling and sells the bid to the members buying). In Forex, a legitimate company represents either one side or the other: either collecting a commission and giving the customer the best bid/ask spread, or providing a slightly wider bid/ask spread and taking the other side of the trade.
Under either format, representing customers on an exchange or executing the trade “in-house”, there is an opportunity for excellent service as well as fraud. Because Forex is not federally regulated like futures and options, it is easier to commit fraud. As such, Forex traders should exercise special caution when choosing a firm, not simply judging by fees and spreads, but also examine the firm’s history and reputation. “Caveat Emptor,” or buyer beware, is a good motto when dealing in the marketplace, be it ex-change-traded or over-the-counter, like Forex.
ers, who generally trade in much smaller sizes, primarily do so through brokers and dealers.
This is something which can trouble stock traders. There is no central location for price data, and no real volume information is attainable. Since volume is an often reported figure in the stock market, the lack of it in spot Forex trading is something which takes a bit of getting used to for those making the switch.
Transaction ProcessingAlso, the lack of an exchange means a difference in how trad-ing is actually done. In the stock market an order is submitted to a broker who facilitates the trade with another broker/dealer (over-the-counter) or through an exchange. In the spot Forex, much of the trading done by individuals is actually executed directly with their broker/dealer. That means the broker takes the other side of the trade. This is not always the case, but is the most common approach.
Transaction CostsThe lack of an exchange and the direct trade with the broker creates another difference between stock and Forex trading. In the stock market brokers will generally charge a commission for each buy and sell transaction. In Forex, though, most brokers do not charge any commissions. Since they are taking the other side of all the customer trades, they profit by making the spread between the bid and offer prices.
Some traders do not like the structure of the spot Forex market. They are not comfortable with their broker being on the other side of their trades as they feel it presents a type of conflict of interest. They also question the safety of their funds and the lack of overall regulation. These are some worthwhile concerns, certainly, but the fact of the matter is that the majority of Forex brokers are very reliable and ethical. Those that are not don’t stay in business very long.
Margin TradingThe Forex market is a 100% margin-based market. This is a fa-miliar thing for those used to trading futures. In fact, spot Forex trading is essentially trading a 2-day forward (futures) contract. You do not take actual possession of any currency, but rather have a theoretical agreement to do so in the future. That puts you in a position to benefit from price changes. The reverse could also happen, so your broker requires a deposit on your trades to provide surety against any losses you may incur. The exact amount of the deposit varies. Some brokers will ask for as little as 1/2%, which is very aggressive. Expect 1%-2% on the value of the position in most cases.
Now, unlike the stock market, margin trading does not mean margin loans. Your broker will not be lending you money to buy securities (at least not the way a stock broker does). As such, there is no margin interest charged. In fact, since you are the one putting money on deposit with your broker, you may earn
��PitNews.com Magazine December �006 ����
Disclaimer: The risk of loss in trading futures, options, stocks, and forex can be substantial. See Page 6 for more information.
interest in your margin funds.
Interest Rate Carry (Rollover)When trading Forex, you are essentially borrowing one currency, converting it in to another, and depositing it. This is all done on an overnight basis, so the trader is paying the overnight interest rate on the borrowed currency and at the same time earning the overnight rate on the currency being held. This means the trader is either paying out or receiving interest on their position, de-pending on whether the interest rate differential is for or against them.
This is commonly handled in what is referred to as a “roll-over.” Spot Forex trades are done on a trading day basis, and as such are technically closed out at the end of each day. If you are holding your position longer than that, your broker rolls you forward into a new position for the next trading day. This is generally done transparently, but it does mean that at the end of each day you will either pay or receive the interest differential on your position.
The type of trader you are and the way your broker handles rollover will be the deciding factors in determining whether the interest rate differentials are an important concern for you. Some brokers will not apply the day’s interest differential value on positions closed out during the trading day. This means that if you were to enter a position at 10am and exit at 2pm, no interest would come in to play. If you were to open a position on Monday and close it on Tuesday, though, you would have the interest for Monday applied (the full day, regardless of when you entered the position), but nothing for Tuesday. (Note: There is at least one broker who calculates interest on a continuous basis, so you will always make or pay the interest differential on all positions, no matter when you entered or exited them).
It should also be noted that although some folks will claim there is no rollover in Forex futures, the interest rate spread is definitely factored in. You can see this when comparing futures prices with the spot market rates. As the futures contracts ap-proach their delivery date, their prices will converge with the spot rate so that the holders will pay or receive the differential just as if they had been in a spot position.
InterventionFixed income traders know that central bankers, like the Federal Reserve, are active in the markets, buying and selling securities to influence prices, and thereby interest rates. This is not some-thing which happens in stocks, but it does in the Forex markets. This is known as “intervention.” It happens when a central bank or other national monetary authority buys or sells currency in the market with the objective of influencing exchange rates.
Intervention is most often seen at times when exchange rates get a bit out of hand, either falling or rising too rapidly. At those times, central banks may step in to try to nullify the trend. Sometimes it works, sometimes not.
The US has traditionally taken a hands-off approach when it comes to the value of the Dollar, preferring to allow the markets to do their thing. Others are not quite so willing to let specula-tors determine their currency’s value. The Bank of Japan has the most active track record in that regard.
It has long been thought by individual traders that Forex is a market strictly for professionals. That was true in the past, but the landscape has changed dramatically in the last few years. Now anyone can trade Forex. It offers some nice advantages over other markets, making it one of the most suitable markets for many traders. It is certainly worth at least exploring when mak-ing a decision on what market(s) to trade, especially if you are interested in currency trading.
John Forman, author of The Essentials of Trading, is a near 20-year veteran of the financial markets. He has worked as an analyst in the foreign exchange, fixed income, and energy markets, and has published literally dozens of articles on market analysis and trading methods. Currently, John is a principal of and the Managing Analyst & Chief Trader for Anduril Analytics.
Understanding Spreads: Part 1 of 3Platinum VS. Gold A lesson in inter-market spreads & relative demand schedules
By: Scott Barrie
T he futures mar-kets provide a variety of trading oppor tun i t i e s . In addition to
profiting from rising prices by purchas-ing futures or from falling prices by selling
futures contracts, there is an opportunity to profit from the relationship between different
contracts – or SPREAD. A spread refers to the simultaneous purchase and sale of two or more different futures contracts.
Trading spreads is all about trading one position against the other, or the relative gain in one market versus another. Because a spread position entails both a long and short position, it is a speculation on relative
�3PitNews.com Magazine December �006 �3�3
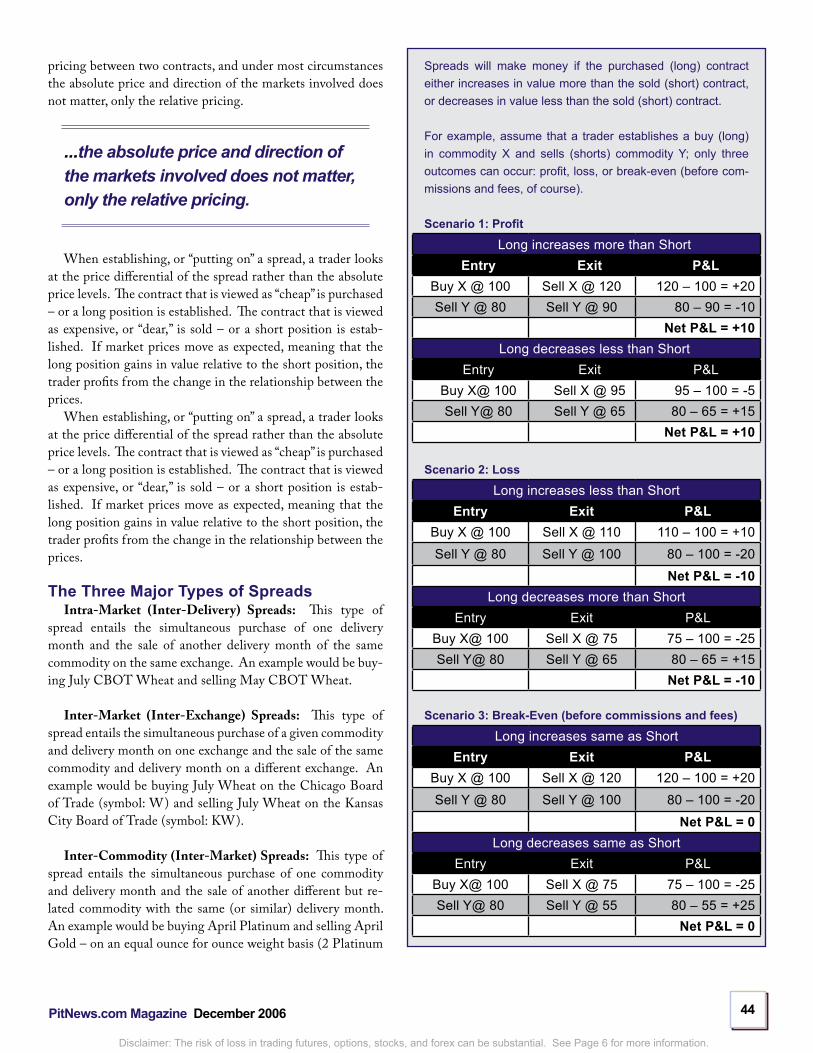
��PitNews.com Magazine December �006 ����
Disclaimer: The risk of loss in trading futures, options, stocks, and forex can be substantial. See Page 6 for more information.
Spreads will make money if the purchased (long) contract either increases in value more than the sold (short) contract, or decreases in value less than the sold (short) contract.
For example, assume that a trader establishes a buy (long) in commodity X and sells (shorts) commodity Y; only three outcomes can occur: profit, loss, or break-even (before com-missions and fees, of course).
Scenario 1: Profit
Long increases more than ShortEntry Exit P&L
Buy X @ 100 Sell X @ 120 120 – 100 = +20Sell Y @ 80 Sell Y @ 90 80 – 90 = -10
Net P&L = +10Long decreases less than Short
Entry Exit P&LBuy X@ 100 Sell X @ 95 95 – 100 = -5Sell Y@ 80 Sell Y @ 65 80 – 65 = +15
Net P&L = +10
Scenario �: Loss
Long increases less than ShortEntry Exit P&L
Buy X @ 100 Sell X @ 110 110 – 100 = +10Sell Y @ 80 Sell Y @ 100 80 – 100 = -20
Net P&L = -10Long decreases more than Short
Entry Exit P&LBuy X@ 100 Sell X @ 75 75 – 100 = -25Sell Y@ 80 Sell Y @ 65 80 – 65 = +15
Net P&L = -10
Scenario 3: Break-Even (before commissions and fees)
Long increases same as ShortEntry Exit P&L
Buy X @ 100 Sell X @ 120 120 – 100 = +20Sell Y @ 80 Sell Y @ 100 80 – 100 = -20
Net P&L = 0Long decreases same as Short
Entry Exit P&LBuy X@ 100 Sell X @ 75 75 – 100 = -25Sell Y@ 80 Sell Y @ 55 80 – 55 = +25
Net P&L = 0
pricing between two contracts, and under most circumstances the absolute price and direction of the markets involved does not matter, only the relative pricing.
...the absolute price and direction of the markets involved does not matter, only the relative pricing.
When establishing, or “putting on” a spread, a trader looks at the price differential of the spread rather than the absolute price levels. The contract that is viewed as “cheap” is purchased – or a long position is established. The contract that is viewed as expensive, or “dear,” is sold – or a short position is estab-lished. If market prices move as expected, meaning that the long position gains in value relative to the short position, the trader profits from the change in the relationship between the prices.
When establishing, or “putting on” a spread, a trader looks at the price differential of the spread rather than the absolute price levels. The contract that is viewed as “cheap” is purchased – or a long position is established. The contract that is viewed as expensive, or “dear,” is sold – or a short position is estab-lished. If market prices move as expected, meaning that the long position gains in value relative to the short position, the trader profits from the change in the relationship between the prices.
The Three Major Types of SpreadsIntra-Market (Inter-Delivery) Spreads: This type of
spread entails the simultaneous purchase of one delivery month and the sale of another delivery month of the same commodity on the same exchange. An example would be buy-ing July CBOT Wheat and selling May CBOT Wheat.
Inter-Market (Inter-Exchange) Spreads: This type of spread entails the simultaneous purchase of a given commodity and delivery month on one exchange and the sale of the same commodity and delivery month on a different exchange. An example would be buying July Wheat on the Chicago Board of Trade (symbol: W) and selling July Wheat on the Kansas City Board of Trade (symbol: KW).
Inter-Commodity (Inter-Market) Spreads: This type of spread entails the simultaneous purchase of one commodity and delivery month and the sale of another different but re-lated commodity with the same (or similar) delivery month. An example would be buying April Platinum and selling April Gold – on an equal ounce for ounce weight basis (2 Platinum
�5PitNews.com Magazine December �006 �5�5
Disclaimer: The risk of loss in trading futures, options, stocks, and forex can be substantial. See Page 6 for more information.
to 1 Gold, as each Platinum contract is 50 troy ounces while each Gold contract represents 100 ounces).
Spread trading is all about relative pricing, or the price of one futures contract versus another. In the equity markets, spread trading is usually referred to as “pairs trading,” or buying one member of an industry group and selling an equal amount of another company (i.e. buying Toyota Motors and selling Ford Motors). The idea behind this style of trade is that though mac-roeconomic influences are not predictable – such as inflation, war, plight, and pestilence – the relative supply and demand between two products are. Case in point… Platinum versus Gold
A Tale Of Two MetalsProbably the easiest type of spread to understand is the “In-ter-Market” or “Inter-Commodity” spread, which represents a speculation that one commodity will outperform another. This position type represents a speculation that one similar, but dif-ferent, commodity will increase in value relative to another com-modity. For example, Platinum prices will increase relative to Gold, Beef prices will increase relative to Pork, or Corn prices will increase relative to Wheat. Just like many hedge funds in the Stock Market speculate that one member of an industry grouping will outperform another (Toyota versus Ford, Dell versus Gateway, or Exxon/Mobil versus Chevron), an Inter-
Market spread position is a speculation that one commodity will outperform another within the same general group.
For example, both Gold and Platinum are used in the manu-facturing of jewelry. Platinum is commonly referred to as “white gold” even though this metal is used primarily for industrial purposes. However, the relationship between these two metals is a great example of inter-market spreading.
The largest consumer of Platinum is the automotive industry, which uses Platinum in catalytic converters. The second largest consumer is the jewelry industry, as these groups consume 45% and 30% respectively of a typical year’s demand.
The largest consumer of Gold is the jewelry industry, which accounts for over half of a normal year’s consumption. Hoarding (or investment), coupled with industrial usage, account for the majority of the remaining yearly usage.
In most years, jewelry and industrial usage – primarily from the electronics industry – tend to dry up after the holidays and into the first quarter of the New Year. However, automotive demand for Platinum tends to increase. As such, Platinum tends to increase in value relative to Gold in the 1st quarter of the New Year.
The key here is relative increase, which is supported by the differing demand structures for these two metals. For example, assume that the demand for jewelry tends to increase, Gold prices should increase but at the same time Platinum prices should too, as Platinum draws over a third of its demand from the jewelry industry. If jewelry demand increases, and automo-tive demand at least stays flat, then Platinum should benefit as much as Gold – if not more as Platinum benefits not only from strong jewelry demand but also automotive demand – which should result in Platinum gaining relative to Gold. However, if jewelry demand falls, which it typically does after the Christmas holiday, the jewelry demand for Platinum should decrease as well, but not as much as Gold as Platinum enjoys automotive demand as well – as such Platinum prices should decrease in value less than Gold.
This basic scenario of decreasing Gold demand in most years after the holidays compared to increasing Platinum demand has resulted in April Platinum futures gaining relative to April Gold futures –when done on an ounce for ounce basis* – in 17 of the last 19 years (89.5%) from January through March.
*Note: The recognized ratio of Platinum to Gold for spread-ing purposes is 2 Platinum per 1 Gold contract. This ratio makes sense because Platinum futures call for delivery of 50 troy ounces of Platinum, while the standard Gold con-tract calls for delivery of 100 troy ounces of Gold. As such, to make the dollar differential between these two different, but similar futures, the same one must establish 2 Platinum futures for every Gold future making each $1/ounce equal to $100 before commissions and fees.
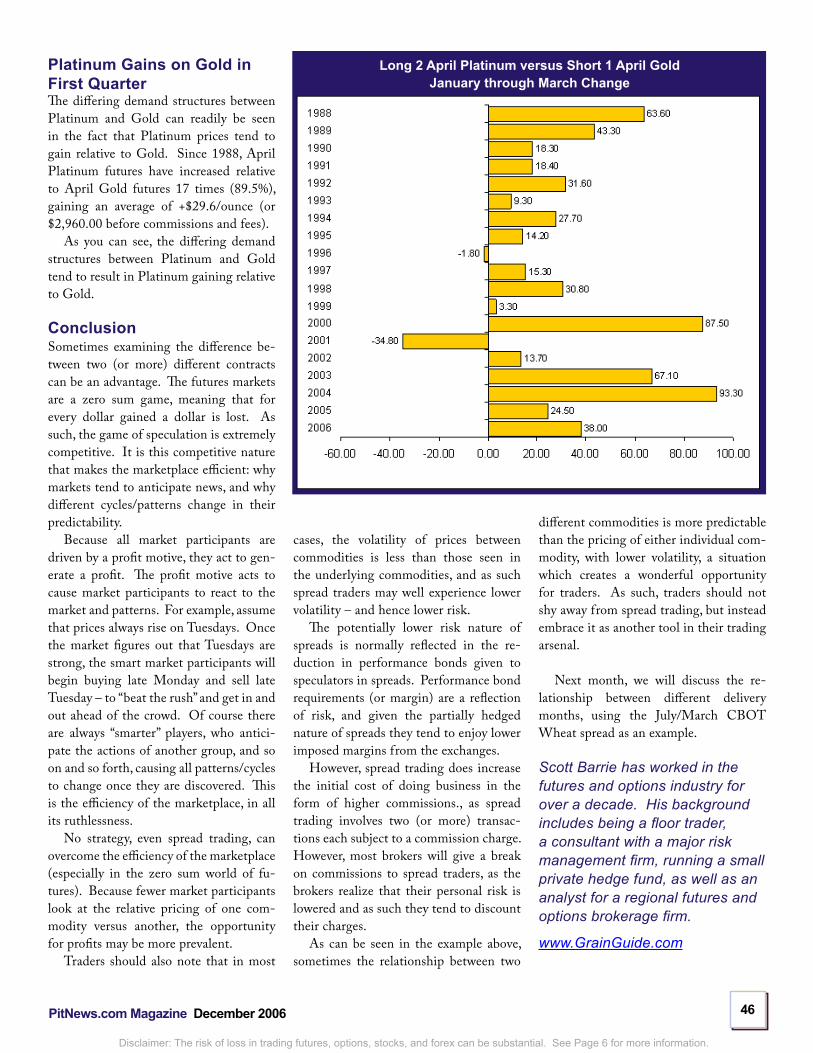
�6PitNews.com Magazine December �006 �6�6
Disclaimer: The risk of loss in trading futures, options, stocks, and forex can be substantial. See Page 6 for more information.
Platinum Gains on Gold in First QuarterThe differing demand structures between Platinum and Gold can readily be seen in the fact that Platinum prices tend to gain relative to Gold. Since 1988, April Platinum futures have increased relative to April Gold futures 17 times (89.5%), gaining an average of +$29.6/ounce (or $2,960.00 before commissions and fees).
As you can see, the differing demand structures between Platinum and Gold tend to result in Platinum gaining relative to Gold.
ConclusionSometimes examining the difference be-tween two (or more) different contracts can be an advantage. The futures markets are a zero sum game, meaning that for every dollar gained a dollar is lost. As such, the game of speculation is extremely competitive. It is this competitive nature that makes the marketplace efficient: why markets tend to anticipate news, and why different cycles/patterns change in their predictability.
Because all market participants are driven by a profit motive, they act to gen-erate a profit. The profit motive acts to cause market participants to react to the market and patterns. For example, assume that prices always rise on Tuesdays. Once the market figures out that Tuesdays are strong, the smart market participants will begin buying late Monday and sell late Tuesday – to “beat the rush” and get in and out ahead of the crowd. Of course there are always “smarter” players, who antici-pate the actions of another group, and so on and so forth, causing all patterns/cycles to change once they are discovered. This is the efficiency of the marketplace, in all its ruthlessness.
No strategy, even spread trading, can overcome the efficiency of the marketplace (especially in the zero sum world of fu-tures). Because fewer market participants look at the relative pricing of one com-modity versus another, the opportunity for profits may be more prevalent.
Traders should also note that in most
Long � April Platinum versus Short 1 April GoldJanuary through March Change
cases, the volatility of prices between commodities is less than those seen in the underlying commodities, and as such spread traders may well experience lower volatility – and hence lower risk.
The potentially lower risk nature of spreads is normally reflected in the re-duction in performance bonds given to speculators in spreads. Performance bond requirements (or margin) are a reflection of risk, and given the partially hedged nature of spreads they tend to enjoy lower imposed margins from the exchanges.
However, spread trading does increase the initial cost of doing business in the form of higher commissions., as spread trading involves two (or more) transac-tions each subject to a commission charge. However, most brokers will give a break on commissions to spread traders, as the brokers realize that their personal risk is lowered and as such they tend to discount their charges.
As can be seen in the example above, sometimes the relationship between two
different commodities is more predictable than the pricing of either individual com-modity, with lower volatility, a situation which creates a wonderful opportunity for traders. As such, traders should not shy away from spread trading, but instead embrace it as another tool in their trading arsenal.
Next month, we will discuss the re-lationship between different delivery months, using the July/March CBOT Wheat spread as an example.
Scott Barrie has worked in the futures and options industry for over a decade. His background includes being a floor trader, a consultant with a major risk management firm, running a small private hedge fund, as well as an analyst for a regional futures and options brokerage firm.
www.GrainGuide.com
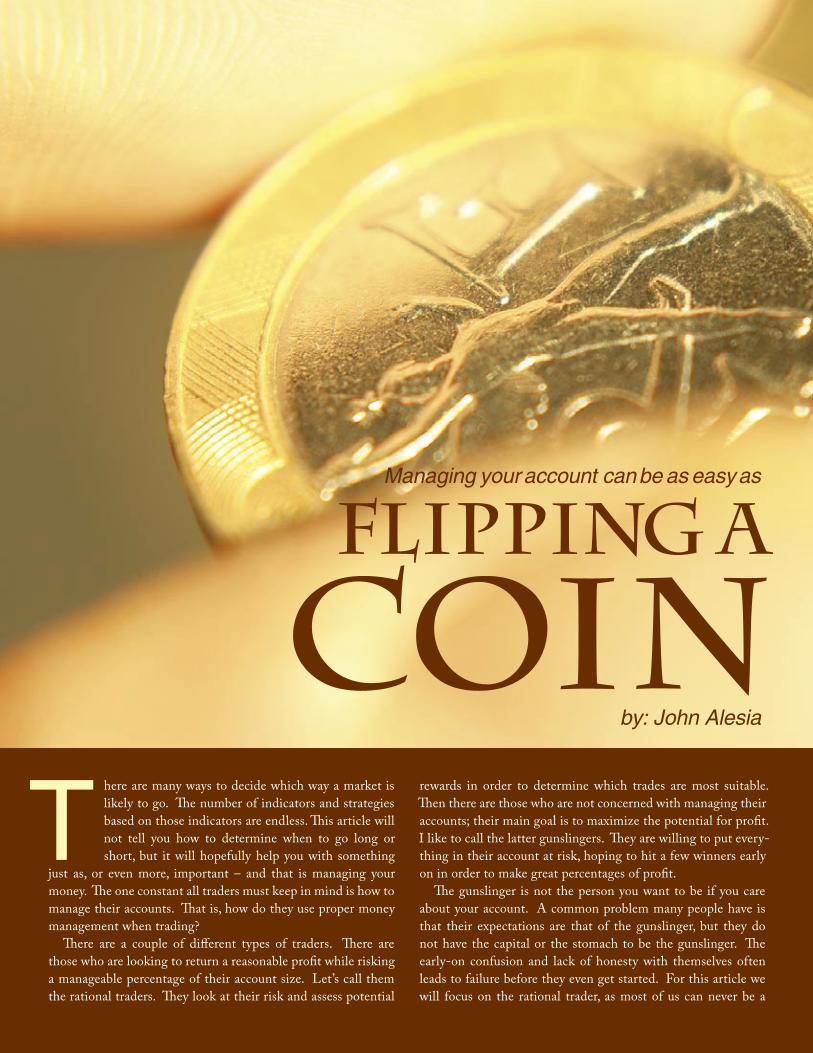
Managing your account can be as easy as
Flipping a
Coin by: John Alesia
T here are many ways to decide which way a market is likely to go. The number of indicators and strategies based on those indicators are endless. This article will not tell you how to determine when to go long or short, but it will hopefully help you with something
just as, or even more, important – and that is managing your money. The one constant all traders must keep in mind is how to manage their accounts. That is, how do they use proper money management when trading?
There are a couple of different types of traders. There are those who are looking to return a reasonable profit while risking a manageable percentage of their account size. Let’s call them the rational traders. They look at their risk and assess potential
rewards in order to determine which trades are most suitable. Then there are those who are not concerned with managing their accounts; their main goal is to maximize the potential for profit. I like to call the latter gunslingers. They are willing to put every-thing in their account at risk, hoping to hit a few winners early on in order to make great percentages of profit.
The gunslinger is not the person you want to be if you care about your account. A common problem many people have is that their expectations are that of the gunslinger, but they do not have the capital or the stomach to be the gunslinger. The early-on confusion and lack of honesty with themselves often leads to failure before they even get started. For this article we will focus on the rational trader, as most of us can never be a
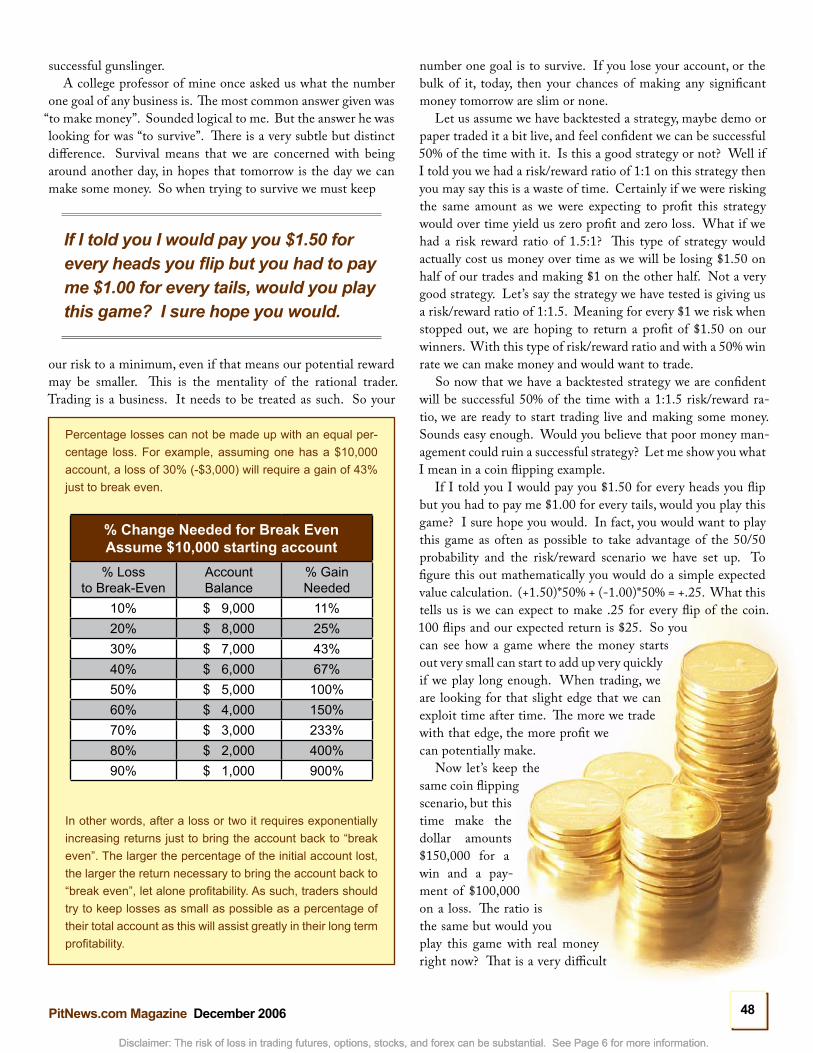
Disclaimer: The risk of loss in trading futures, options, stocks, and forex can be substantial. See Page 6 for more information.
�8PitNews.com Magazine December �006 �8�8
Disclaimer: The risk of loss in trading futures, options, stocks, and forex can be substantial. See Page 6 for more information.
successful gunslinger. A college professor of mine once asked us what the number
one goal of any business is. The most common answer given was “to make money”. Sounded logical to me. But the answer he was looking for was “to survive”. There is a very subtle but distinct difference. Survival means that we are concerned with being around another day, in hopes that tomorrow is the day we can make some money. So when trying to survive we must keep
If I told you I would pay you $1.50 for every heads you flip but you had to pay me $1.00 for every tails, would you play this game? I sure hope you would.
our risk to a minimum, even if that means our potential reward may be smaller. This is the mentality of the rational trader. Trading is a business. It needs to be treated as such. So your
number one goal is to survive. If you lose your account, or the bulk of it, today, then your chances of making any significant money tomorrow are slim or none.
Let us assume we have backtested a strategy, maybe demo or paper traded it a bit live, and feel confident we can be successful 50% of the time with it. Is this a good strategy or not? Well if I told you we had a risk/reward ratio of 1:1 on this strategy then you may say this is a waste of time. Certainly if we were risking the same amount as we were expecting to profit this strategy would over time yield us zero profit and zero loss. What if we had a risk reward ratio of 1.5:1? This type of strategy would actually cost us money over time as we will be losing $1.50 on half of our trades and making $1 on the other half. Not a very good strategy. Let’s say the strategy we have tested is giving us a risk/reward ratio of 1:1.5. Meaning for every $1 we risk when stopped out, we are hoping to return a profit of $1.50 on our winners. With this type of risk/reward ratio and with a 50% win rate we can make money and would want to trade.
So now that we have a backtested strategy we are confident will be successful 50% of the time with a 1:1.5 risk/reward ra-tio, we are ready to start trading live and making some money. Sounds easy enough. Would you believe that poor money man-agement could ruin a successful strategy? Let me show you what I mean in a coin flipping example.
If I told you I would pay you $1.50 for every heads you flip but you had to pay me $1.00 for every tails, would you play this game? I sure hope you would. In fact, you would want to play this game as often as possible to take advantage of the 50/50 probability and the risk/reward scenario we have set up. To figure this out mathematically you would do a simple expected value calculation. (+1.50)*50% + (-1.00)*50% = +.25. What this tells us is we can expect to make .25 for every flip of the coin. 100 flips and our expected return is $25. So you can see how a game where the money starts out very small can start to add up very quickly if we play long enough. When trading, we are looking for that slight edge that we can exploit time after time. The more we trade with that edge, the more profit we can potentially make.
Now let’s keep the same coin flipping scenario, but this time make the dollar amounts $150,000 for a win and a pay-ment of $100,000 on a loss. The ratio is the same but would you play this game with real money right now? That is a very difficult
Percentage losses can not be made up with an equal per-centage loss. For example, assuming one has a $10,000 account, a loss of 30% (-$3,000) will require a gain of 43% just to break even.
% Change Needed for Break EvenAssume $10,000 starting account
% Lossto Break-Even
Account Balance
% Gain Needed
10% $ 9,000 11%20% $ 8,000 25%30% $ 7,000 43%40% $ 6,000 67%50% $ 5,000 100%60% $ 4,000 150%70% $ 3,000 233%80% $ 2,000 400%90% $ 1,000 900%
In other words, after a loss or two it requires exponentially increasing returns just to bring the account back to “break even”. The larger the percentage of the initial account lost, the larger the return necessary to bring the account back to “break even”, let alone profitability. As such, traders should try to keep losses as small as possible as a percentage of their total account as this will assist greatly in their long term profitability.
Disclaimer: The risk of loss in trading futures, options, stocks, and forex can be substantial. See Page 6 for more information.
��PitNews.com Magazine December �006 ����
Disclaimer: The risk of loss in trading futures, options, stocks, and forex can be substantial. See Page 6 for more information.
question, and one that gets more difficult as the amount increases. At this amount you are still at a big advantage and would love to play this game many times over. The problem you now have is whether or not you can afford to take a hit on 1 or 2 flips going against you early before you can build your bankroll up to withstand a bad string of flips.
Trading is a business. It needs to be treated as such.
This scenario may sound familiar to some of you who are do-ing something similar when trading. We can often have a setup that gives us a statistical advantage, an edge, but we may not be trading it responsibly with a sound money management plan. This is usually a recipe for failure. Assume your account size is $10,000. You get a signal to go long the EUR/USD with a stop loss of 25 pips and a target of 40 pips. This is a perfect setup for you based on your backtesting. Because it looks so good, you take this trade for 5 lots. The risk is now $1,250 on this trade, which is 12.5% of your entire account. If this trade goes against you and you are stopped out, you are now left with $8,750 in your account. A similar setup presents itself again so you go for 5 lots in hopes to make up what you lost. Sounds logical since
It’s important to have your rules set up before you ever start to trade. A couple of questions you need to answer are:
1. What percentage of my account will I risk per trade?A good guide is no more than 2% but this number is based solely on what you are comfortable with. If you are not as big a risk-taker, move that number down to 1% or .5%. Go much higher than 2% and you run into the risk of getting yourself in a bad situation with a few losses in a row.
�. What percentage of my account am I willing to lose in a day/week/month etc. before stopping?This is an important figure to have in mind as well. You may want to call it quits during the day when you reach a certain monetary figure, or a certain number of losses. This will help keep your sanity and help you from trying to get back what you lost all at once. It’s much easier to start the new day fresh. You also want a max loss for the week, month or even the year. When you reach those levels, stop trading. If you hit your weekly number maybe take a day off to cool down, look at your trades, make sure you are following your strategy. If you are not, then fix the problem. If you are, maybe the market is just not moving in a way that works with your strategy right now and it’s best to clear your head and start again next week.
YOUR AD
HERECall us at 800.5�6.301� to learn more about advertising opportunities in PitNews.com Magazine. Ask about special multiple-issue discounts for �00�!

Disclaimer: The risk of loss in trading futures, options, stocks, and forex can be substantial. See Page 6 for more information.
50PitNews.com Magazine December �006 5050
Disclaimer: The risk of loss in trading futures, options, stocks, and forex can be substantial. See Page 6 for more information.
your strategy tested out to a 50% win rate so after one failure you are due for a win. Well now you are risking 14.3% of your total account. And the odds of this trade being successful are still 50/50. If you lose this one you are down to $7,500 in your account. You have now lost 25% of your account in 2 trades!!! When you backtested I am sure you had 3 or 4 or 5 or even more winners in a row but you probably had the same amount of losers in a row as well. That’s how you get to a 50/50 scenario. If we play that coin flipping game for the high stakes we know we have an edge, but even if we lost just one or two times we may be out of money and never play enough to take advantage of the edge we have.
This type of thinking can obviously hurt you financially in your account, but it will lead itself to some psychological problems as well. I don’t know any trader who has not had 2 bad trades in a row. Most rational traders can shrug it off and keep plugging away knowing their run of good trades is just around the corner.
The trader who loses 25% of their account in 2 trades is now reevaluating their setup that they worked so hard on testing and paper trading and may start to change their plan. All that’s on that trader’s mind is getting their $2,500 back. This mentality after just 2 losses can be crippling. Just 2 losses!!!
The rational trader has the same setup and sees the same trade. They have a plan to not risk more than 2% of their account on any one given trade. With a 25 pip stop loss and a $10,000 ac-count, the trader determines a trade of 8 mini lots is appropriate. This is a risk of $200 and 2% of their total account. When that trade goes bad, and trade 2 goes bad, they find themselves down $400, or 4%. Based on their setup and strategy they are still very much okay, because the next winning trade should make up for most, if not all, of the previous 2 losses. Mentally this trader is not looking to jump off a bridge as the previous trader was. They know that, when they tested, a few trades went against them in a row and a few went in their favor in a row. The key is trading it as often as possible and being able to survive until tomor-row. You can not put yourself in a situation where just a few bad trades can cripple your account. Most can not handle that financially or mentally.
If you lose your account, or the bulk of it, today, then your chances of making any significant money tomorrow are slim or none.
Most traders function better as the rational trader, but they lose their rational thoughts by the lure of great fortunes in trad-ing. While trading can be a lucrative business, there are many more stories of failure than there are of the trader who turns $10,000 into $1,000,000 overnight. Those stories are just stories because they happen so infrequently. The successful trader is the one who can survive. You can’t be successful if you don’t have anything left in your account. As such, speculators should pay as much – if not more – attention to their account management as they pay to their entry/exit signals if they wish to succeed. For one has to be able to make the trade to profit from it.
John S. Alesia founded Brown Forex after a success-ful career on Wall Street. Recognizing an opportunity to capitalize on an untapped retail trading market, Mr. Alesia left an executive post with Deutsche Bank to start Brown Forex. Leveraging his years of capital markets experience with hedge funds, investment banks, and institutional money managers enables Mr. Alesia to provide sage guidance and powerful resources to the retail trader.