, Jullien, B., & Postel-Vinay, F. (2016). Reputation and ...€¦ · Bruno Jullien ‡ Toulouse...
44
Jolivet, G. R., Jullien, B., & Postel-Vinay, F. (2016). Reputation and Prices on the e-Market: Evidence from a Major French Platform. International Journal of Industrial Organization, 45, 59-75. https://doi.org/10.1016/j.ijindorg.2016.01.003 Peer reviewed version License (if available): CC BY-NC-ND Link to published version (if available): 10.1016/j.ijindorg.2016.01.003 Link to publication record in Explore Bristol Research PDF-document This is the author accepted manuscript (AAM). The final published version (version of record) is available online via Elsevier at http://www.sciencedirect.com/science/article/pii/S0167718716000059. Please refer to any applicable terms of use of the publisher. University of Bristol - Explore Bristol Research General rights This document is made available in accordance with publisher policies. Please cite only the published version using the reference above. Full terms of use are available: http://www.bristol.ac.uk/pure/about/ebr-terms
Transcript of , Jullien, B., & Postel-Vinay, F. (2016). Reputation and ...€¦ · Bruno Jullien ‡ Toulouse...

Jolivet, G. R., Jullien, B., & Postel-Vinay, F. (2016). Reputation and Priceson the e-Market: Evidence from a Major French Platform. InternationalJournal of Industrial Organization, 45, 59-75.https://doi.org/10.1016/j.ijindorg.2016.01.003
Peer reviewed version
License (if available):CC BY-NC-ND
Link to published version (if available):10.1016/j.ijindorg.2016.01.003
Link to publication record in Explore Bristol ResearchPDF-document
This is the author accepted manuscript (AAM). The final published version (version of record) is available onlinevia Elsevier at http://www.sciencedirect.com/science/article/pii/S0167718716000059. Please refer to anyapplicable terms of use of the publisher.
University of Bristol - Explore Bristol ResearchGeneral rights
This document is made available in accordance with publisher policies. Please cite only the publishedversion using the reference above. Full terms of use are available:http://www.bristol.ac.uk/pure/about/ebr-terms

Reputation and Prices on the e-Market:
Evidence from a Major French Platform∗
Gregory Jolivet †
University of Bristol
Bruno Jullien ‡
Toulouse School of Economics
Fabien Postel-Vinay §
University College London and Sciences Po
December 2015
Abstract
We use an exhaustive data set from one of France’s largest e-commerce platforms,PriceMinister.com, to estimate a statistical causal effect of a seller’s reputation (rat-ing and size) on transaction prices. We go beyond the results currently available bytackling the issue of seller unobserved heterogeneity and the dynamics of reputationin price equations. We can also produce results for a large range of product categories(books, CDs, video games or DVDs), product conditions (used or new) and seller types(individual or professional sellers). Our results show large-scale empirical evidence ofa significant, positive and strong effect of seller reputation on prices.
∗We thank Heski Bar-Isaac, Yinghua He, Ginger Zhe Jin, Edwin Leuven, Steve Tadelis and Frank Wind-meijer for useful discussion and comments as well as seminar participants at Univeristy of Bristol, UCL,CREST, University of Mannheim, University of Oslo, Sciences Po Paris, Stockholm, Toulouse School ofEconomics, University of Warwick, VU Amsterdam, and at the Workshop on Reputation in Organizationsand Markets in Mannheim. Special thanks to Sebastien Mitraille who helped us start this project. We aredeeply grateful to PriceMinister.com for giving us access to their data.
†Address: Department of Economics, University of Bristol, 8 Woodland Road, Bristol BS8 1TN, UK.E-mail: [email protected].
‡Address: Universite des Sciences Sociales de Toulouse I, Manufacture des Tabacs, Aile Jean-JacquesLaffont, 21 allee de Brienne, 31000 Toulouse, France. E-mail: [email protected].
§Address: Department of Economics, University College London, Drayton House, 30 Gordon Street,London WC1H 0AX, UK. E-mail: [email protected]. Postel-Vinay is also affiliated with CEPR(London), IZA (Bonn), IFS (London), and CfM (London).
1

1 Introduction
Over the past fifteen years, e-commerce has evolved from a marginal and sporadic medium
of trade involving small numbers of IT enthusiasts into an economy-wide phenomenon. One
of the biggest challenges e-commerce web sites are faced with is to design mechanisms that
address fraud and seller misbehavior (such as poor delivery service or misrepresentation).
One of the main responses to this challenge has been to develop online feedback procedures
as a “technology for building trust and fostering cooperation” (Dellarocas, 2006). These
procedures aim to alleviate adverse selection and moral hazard problems by providing a
publicly observable measure of seller reputation. The empirical importance of these repu-
tation indicators is the focus of a burgeoning literature in economics, that has arisen from
the expansion of e-commerce and increasing data availability. The objective of this paper is
to conduct an empirical analysis of the effect of seller reputation on transaction prices that
contributes to this literature on at least two dimensions. First, the scale of our analysis is
larger than that of previous papers as we can document the effect of reputation for a wide
range of product categories, seller types and product conditions. The second contribution
is methodological as we account for unobserved heterogeneity and we highlight and address
issues related to the dynamics of seller reputation arising from the feedback mechanism.
We use a unique and exhaustive data set from one of France’s largest e-commerce plat-
forms, PriceMinister (www.priceminister.com) to study the relation between a seller’s av-
erage feedback score and its prices for different categories of products, product conditions
and types of sellers. Like other e-commerce web sites, PriceMinister implements a rating
system where buyers grade their transactions. A seller’s web page displayed at all times the
(running) average rating over all transactions completed by that seller and the number of
completed transactions, referred to as the size. We consider a seller’s reputation as resulting
from this public information. Our main findings are the following:
− We estimate a statistically significant, positive and large causal effect of average rating
on transaction prices.
− The effect differs across products and seller categories (professional sellers or private
individuals).
− The effect of average rating increases with the size and decreases with the advertised
condition of the good.
− We also find a positive effect of recent feedback scores on prices, but of a small mag-
nitude.
Identifying and understanding the effects of feedback mechanisms on transactions is a
key step in the economic analysis of online markets. Our work confirms that reputation
effects are significant, and thus that due care should be taken in the design of feedback
systems. Our results also confirm the importance of information in online trading, and
2

suggest that variation in buyers’ information may partly explain why the Internet does not
seem to have caused the substantial reduction in price dispersion that was initially expected
(see Baye et al., 2004).
More generally, our work provides evidence of reputation effects at work. Economic
theory has identified several channels through which public information about buyer satis-
faction may improve trade efficiency (see MacLeod, 2007 or Bar-Isaac and Tadelis, 2008 for
a review), but the empirical evidence remains scarce and often inconclusive. Rating systems
whereby one or both trading parties can report to the community of traders about their level
of satisfaction with any transaction they were involved in are interesting for at least two rea-
sons: they apply to a large set of agents who can be tracked across time and transactions,
and the information transmitted is directly observable. These features provide economists
with new opportunities to analyze reputation effects.
While a number of contributions have already taken steps in that direction, efforts to
exploit these features have been constrained by data availability (see Bajari and Hortacsu,
2004 or Cabral, 2012 for a recent review).1 Our rich data set allows us to overcome several
of the difficulties previously encountered in this emerging domain of research.
PriceMinister has several specific features that distinguish it from eBay, which has been
the focus of most of the extant literature. First, PriceMinister has a unilateral rating system
in which only buyers rate sellers, which avoids the sophisticated gaming between buyers
and sellers that arises on eBay’s bilateral rating mechanism. Also, PriceMinister uses a
pure price-posting mechanism, as opposed to auctions, and it serves as an intermediary
for payment in all transactions. Importantly, PriceMinister makes the completion of any
transaction conditional on the buyer acknowledging receipt of the item and rating the seller.
These features arguably make the data from PriceMinister better suited to the analysis of
reputation mechanisms. The flip side of that coin however is that our results might not
apply to platforms with a different feedback mechanism. We will compare our results with
those from other studies at the end of the paper and see that our conclusions are broadly in
line with the existing literature.
Another interesting feature of our data set is that, in an effort to help sellers set their
prices, PriceMinister records the list price of each product, that is the suggested retail price
of the product when it was released. For books, the list price would then be the price set by
the publisher. An important aspect of our analysis is that we can control for this variable,
which will facilitate comparisons across products.
Most studies of feedback systems rely on data downloaded directly from a web site using
a spider software (a prominent example is Cabral and Hortacsu, 2010), which inevitably
makes the resulting information limited in time and in product space. In this paper, we
use an exhaustive data set obtained directly from PriceMinister. This data set allows us
to overcome many of the issues attached to the use of observational Internet data, from
1The earlier literature includes Dewally and Ederington (2006), Dewan and Hsu (1995),Houser and Wooders (2006), Livingston (2005), Lucking-Reiley et al. (2007), McDonald and Slawson(2002), Melnick and Alm (2002), Resnick and Zeckhauser (2002). See also the review by Dellarocas (2003).
3

seller heterogeneity to limited product ranges.2 To our knowledge, ours is the first study
that estimates reputation effects for different types of product categories, advertised product
conditions, and sellers. We show that the impact of reputation on prices varies across product
categories, as suggested by Resnick et al. (2006).
Our data allow to track the full transaction and feedback rating history of sellers (in-
cluding items sold), objective measures of the products’ value (mainly, their list price) and
condition (as advertised by the seller). This enables us to control for seller unobserved het-
erogeneity which has been identified as a major limitation in existing work (Resnick et al.,
2006 or Cabral, 2012). This issue has been addressed in the literature by relying on
field experiments (see Durham et al., 2004 or Resnick et al., 2006) or natural experiments
(Cabral and Hortacsu, 2010). An alternative strategy adopted by Lei (2011) is to focus on
one specific product (Gmail invitations), for which there is little heterogeneity, and further
including well chosen measures of seller quality. Klein et al. (2013) exploit a natural ex-
periment and multiple feedback on eBay to provide evidence that the feedback mechanism
affects seller behavior, but their data do not allow to measure effects on transaction prices.
More recent papers have been using rich data sets from e-commerce web sites. For
instance Fan et al. (2013) follow a group of sellers on a large Internet platform in China for
14 months and estimate the effect of reputation measures on sellers’ monthly revenue and
sales. Another recent paper by Cai et al. (2013) uses a panel of online sellers from a Chinese
e-commerce web site with similar features as eBay. Its focus and approach are different
from ours as these authors study both theoretically and empirically how buyer protection
may affect trust between buyers and sellers. Using a data on eBay, Elfenbein et al. (2012)
study how charity donations can be used as a substitute for reputation. Hui et al. (2014)
also use data on eBay to study the effect of the ’Top Rated Seller’ label, which grants sellers
with a better visibility in listings. These authors find that this label has a positive effect
on transaction prices and, although they cannot break the effect down by product category,
they find that it varies with the item’s condition and value, which is in line with our results.
Due the exhaustive nature of our data, we are able to address the issue of unobserved
heterogeneity using more standard panel data methods and thus draw inference for a varied
set of product categories, product conditions and seller types. In so doing, we also highlight
another substantive issue that was not investigated before: feedback ratings given by buyers
depend on the prices set by a seller, thereby introducing an effect of past prices on rating
that needs to be taken into account in the estimation strategy.
The empirical evidence on the effect of reputation on the Internet is not solely based on
data from e-commerce web sites. Two recent papers, Anderson and Magruder (2012) and
Luca (2011), use data from Yelp.com, a web site providing reviews of restaurants. An inter-
esting feature of these studies is that they exploit a discontinuity in restaurant scores to esti-
mate the effect of a change in a restaurant’s rating on its bookings (Anderson and Magruder,
2A detailed discussion of these issues is conducted in Einav et al. (2013). These authors also use a richdata set from eBay to study the effect of listing characteristics on prices and other outcomes.
4

2012) or its revenues (Luca, 2011). Our paper is different in at least two dimensions. First,
our outcome variable is the transaction price and we control for the value of the item (through
its suggested retail price). We thus have a direct measure of the effect of reputation on
prices. Secondly, each feedback rating on PriceMinister.com is associated with one and only
one transaction, while anyone can post a review on Yelp.com. We will discuss the existing
literature at the end of our paper, after having presented our estimates, and compare our
results with those of related papers.
The paper is organized as follows. We first describe the PriceMinister.com platform
and the content of our data in Section 2. In Section 3 we lay out our statistical model and
describe our identification and estimation strategy. Results are then presented and discussed
in Section 4. Section 5 concludes. In Appendix, we show additional descriptive statistics, we
discuss the theory underlying our empirical approach and we present a series of robustness
checks.
2 The PriceMinister.com data
2.1 A short description of PriceMinister.com
Our data come from PriceMinister.com, a French company organizing on-line trading of first-
hand or second-hand products between buyers and professional or non-professional sellers
through their web site (www.priceminister.com).3 The PriceMinister web site opened in
2001 with a business model emphasizing the fight against fraud and counterfeit, as well as
price recommendations for sellers. It is now one of France’s biggest e-commerce web sites,
claiming 11 million registered members in 2010.4 There were over 120 million products for
sale in 2010, from books to television sets, shoes to motorbikes and computers to paintings.
In this paper, we focus on four categories of so-called ‘cultural’ goods: books, CDs,
video games (games thereafter) and DVDs (videos thereafter).5 In 2004, these products
represented more than 80% of the transactions on the web site and more than 60% of the
transaction value (defined as the sum of all transaction prices). These numbers decrease
over time but remain large even at the end of our observation period (still more than 60% of
the transactions in 2007). We thus find it relevant to conduct our analysis on a set of goods
that represent such a large share of the trade on a major e-commerce platform.6
The web site is a platform where sellers post adverts and buyers choose what products
to purchase and which sellers to buy from. PriceMinister does not charge a sign-on fee, and
3This company also runs a similar a web site in Spain, and had another one in the UK for a time. In thispaper, we focus exclusively on the French web site.
4It was ranked first among e-commerce web sites in terms of ratings in a survey conducted by Mediametriein March 2010. The other main e-commerce web sites in France are Amazon, eBay and fnac.
5The ‘video’ category in fact also covers VHS, although the fraction of VHS in total sales in that categoryis likely to be negligible, as VHS were practically extinct in 2001, when PriceMinister started.
6In 2012, the categories ’books and magazines’ and ’music and videos’ accounted for 10% of US e-commercesales (source: US Census).
5

posting an advert is free of charge. However for each completed transaction, sellers have to
pay a variable fee to PriceMinister.7 Sellers can be professional (registered businesses) or
non professional (private individuals). Goods can be new or used. Used goods have been
sold since the web site opened in 2001 whereas new goods have only been sold since 2003.
Only professional sellers can sell new goods (they can also sell used goods).
Three specific features make PriceMinister different from other e-commerce web sites that
are studied in the economic literature. First, PriceMinister itself does not sell any products:
it is a pure platform (unlike, e.g., Amazon). Second, prices are posted by sellers, there are no
auctions (unlike eBay). Lastly, PriceMinister also uses a specific feedback and transaction
control mechanism that makes it particularly well suited to our study. One concern could
then be that our approach or results may not extend to other platforms which do not share
these features. Yet we will show at the end of the paper that our results do not contradict
those from studies based on other e-commerce website data such as eBay.
Every time a seller wants to sell an item, she must enter the product characteristics (bar
code or detailed description), and then receives a price recommendation from PriceMinister
based on the list price and the condition of the item (the recommendation also factors in
prices charged for the same item by other sellers on the platform). She then chooses a price
and creates the advert.
A buyer looking for a given product at a given date will be taken through a sequence of
web pages. On the first page, he will see all live adverts for this product. Each advert con-
veys information on the price, the seller’s name and country, the different shipping options,
whether the product is new or used and, in the latter case, its advertised condition. For used
products, sellers have to state whether the good’s condition is ‘as new’, ‘very good’, ‘good’
or ‘fair’. Buyers also observe the seller’s size, equal to the number of completed transactions
to date, and the seller’s average feedback score over all completed transactions, rounded
to the nearest multiple of 0.1 — what we define as the seller’s average rating, or rating in
short (more on this in the next section). There is also a link to the seller’s web page on
PriceMinister (the seller’s ‘showcase’). The buyer may then select an advert, obtain more
detailed information about the item and make a purchase.
In a typical transaction, where a buyer purchases a given product from a given seller, the
buyer’s payment first goes to PriceMinister.8 This initiates the transaction. At this point
the seller is informed that a buyer has chosen her product and ships the item to the buyer.
In any transaction, the choice of shipping mode (essentially, standard or registered mail) is
up to the buyer, subject to a fixed shipping cost scale imposed by PriceMinister.9 Sellers
thus cannot compete on shipping fees.10
7The fee scale is posted on the PriceMinister.com web site. For example the fee for a e10 transactionwould be e2.1.
8Buyers may use a credit card or hold a virtual account credited with other means of payment.9Specifically, the buyer chooses a particular shipping option at the time of purchase and the corresponding
fee on the shipping cost scale is added to the bill and transferred to the seller by PriceMinister. It is then upto the seller to minimize its costs, subject to complying with the buyer’s specific choice of shipping mode.
10Some non-standard shipping options can be offered by some sellers but not by others, always at a fixed
6
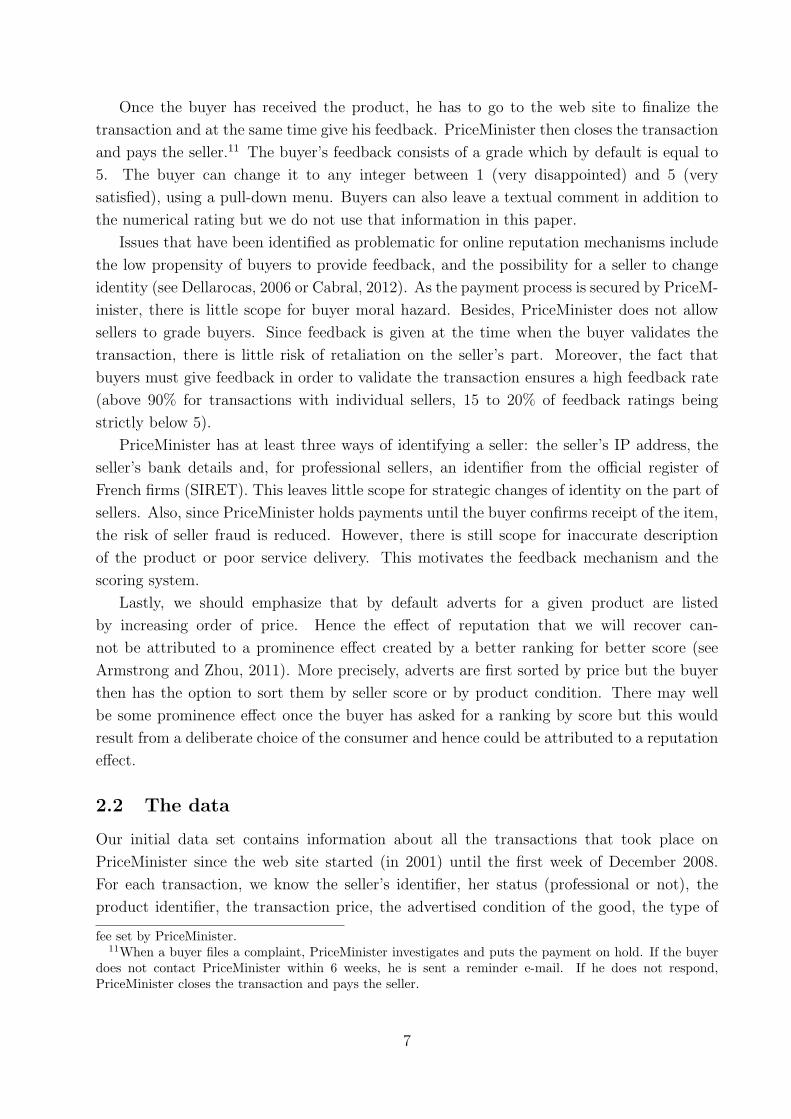
Once the buyer has received the product, he has to go to the web site to finalize the
transaction and at the same time give his feedback. PriceMinister then closes the transaction
and pays the seller.11 The buyer’s feedback consists of a grade which by default is equal to
5. The buyer can change it to any integer between 1 (very disappointed) and 5 (very
satisfied), using a pull-down menu. Buyers can also leave a textual comment in addition to
the numerical rating but we do not use that information in this paper.
Issues that have been identified as problematic for online reputation mechanisms include
the low propensity of buyers to provide feedback, and the possibility for a seller to change
identity (see Dellarocas, 2006 or Cabral, 2012). As the payment process is secured by PriceM-
inister, there is little scope for buyer moral hazard. Besides, PriceMinister does not allow
sellers to grade buyers. Since feedback is given at the time when the buyer validates the
transaction, there is little risk of retaliation on the seller’s part. Moreover, the fact that
buyers must give feedback in order to validate the transaction ensures a high feedback rate
(above 90% for transactions with individual sellers, 15 to 20% of feedback ratings being
strictly below 5).
PriceMinister has at least three ways of identifying a seller: the seller’s IP address, the
seller’s bank details and, for professional sellers, an identifier from the official register of
French firms (SIRET). This leaves little scope for strategic changes of identity on the part of
sellers. Also, since PriceMinister holds payments until the buyer confirms receipt of the item,
the risk of seller fraud is reduced. However, there is still scope for inaccurate description
of the product or poor service delivery. This motivates the feedback mechanism and the
scoring system.
Lastly, we should emphasize that by default adverts for a given product are listed
by increasing order of price. Hence the effect of reputation that we will recover can-
not be attributed to a prominence effect created by a better ranking for better score (see
Armstrong and Zhou, 2011). More precisely, adverts are first sorted by price but the buyer
then has the option to sort them by seller score or by product condition. There may well
be some prominence effect once the buyer has asked for a ranking by score but this would
result from a deliberate choice of the consumer and hence could be attributed to a reputation
effect.
2.2 The data
Our initial data set contains information about all the transactions that took place on
PriceMinister since the web site started (in 2001) until the first week of December 2008.
For each transaction, we know the seller’s identifier, her status (professional or not), the
product identifier, the transaction price, the advertised condition of the good, the type of
fee set by PriceMinister.11When a buyer files a complaint, PriceMinister investigates and puts the payment on hold. If the buyer
does not contact PriceMinister within 6 weeks, he is sent a reminder e-mail. If he does not respond,PriceMinister closes the transaction and pays the seller.
7

shipping, the dates when the transaction was initiated (when the payment went to PriceM-
inister, recorded to the millisecond), and completed (when PriceMinister pays the seller),
and the buyer’s feedback rating. Products are precisely defined, for instance the product
identifier for a book is similar to its ISBN code. Used products are heterogenous with respect
to their advertised condition (as new, very good, good or fair), whereas all new products
have by definition the same condition.12
We observe the product list price. For each product this variable is documented when
the item is first introduced for sale on the web site. The list price is the suggested retail
price set by the publisher for books, by the record company for CDs, etc. It is thus fixed for
each product. Notice that it differs from the price recommendation that PriceMinister gives
to sellers when they post an advert (that we do not observe). The list price variable will
be important to account for product heterogeneity as well as for sorting on seller/product
characteristics. We discuss this issue in section 3.2.
The price variable that we use throughout the analysis is the advert price net of shipping
costs. This is a way of making all prices comparable, as shipping costs are rigidly set by
PriceMinister.
Then, from the initial data set, we can construct the following two variables for every
transaction (at the date when the transaction was initiated):
− the seller’s rating r defined as the average feedback score over all completed transac-
tions,
− the seller’s size s equal to the number of completed transactions.
These two pieces of information are immediately available to the buyer, together with
the advert price, for each advert on the first page seen by the buyer. Intuitively size should
matter because the consumer may take market performance as reflecting part of the seller’s
quality. The size may also affect the weight given by the buyer to the rating (we elaborate
on this in section 3.1).
Buyers further have access to any seller’s full feedback history. By browsing that history,
it is relatively easy for buyers to see at least a few of the most recent feedback ratings received
by a seller. We will therefore investigate the separate effect of recent feedback.
Our empirical analysis focuses on four product categories (books, CDs, games and videos)
although we use all transactions to compute a seller’s size and rating. Since we observe all
transactions for all sellers, both of those variables are available at all dates for all sellers.
Finally , for each transaction we construct the “age” of the article as the length of time
between the date at which the product was first sold on the web site and the transaction
date.12The condition variable can be strategically manipulated by sellers. Modelling the seller’s decision
to advertise a genuine or misleading product’s condition is a challenging and interesting problem (seeJullien and Park, 2014) but beyond the scope of this paper. We will show estimation results for all usedgoods but also for each product condition. We will also present additional results on new goods which areimmune from sellers’ decisions to cheat on the condition.
8

The main focus of this paper is on individual sellers and used goods. However, we also
present results for professional sellers and new or used goods. This allows us to gauge whether
reputation is more important for individual sellers, which would be the case if professional
status was interpreted by customers as an indicator of quality and thus as a substitute for
reputation.
The four product categories we focus on (books, CDs, video games and videos) are
the products most commonly sold on PriceMinister. They account for 12,241,317 of the
15,003,376 transactions made by individual sellers (81.6%) and 4,033,490 of the 6,337,838
transactions involving professional sellers (63.6%).
2.3 Descriptive statistics
We now present some descriptive statistics for individual sellers and used goods. Descriptive
statistics for professional sellers and used or new goods are in the Appendix. We start with
Figure 1 which presents general trends for the four product categories we are considering.
The top row shows the total number of transactions over time, at a monthly frequency. We
observe a strong increasing pattern reflecting the increasing activity in e-commerce in France
during the past decade, as well as the success of PriceMinister as a platform. The middle
row of Figure 1 presents the evolution of average transaction prices (in e) throughout the
observation period. The price fluctuations at the very beginning of each series probably
reflect the small number of transactions in the few months following the opening of the
platform. If we look at these series from 2002 onwards, we observe a strong increasing trend
in book prices whereas transaction prices for games, videos and (after 2006) CDs decline
steadily. Note that the volume and price series both exhibit strong seasonality.
Table 1 reports a series of descriptive statistics on sellers and goods. We start with the
top panel. A seller is in the ‘books’ column if she sells at least one book (the same goes for the
other product categories) over the observation window. In each product category there are
hundreds of thousands of individual sellers and used products, and millions of transactions.
As one may expect with individual sellers, comparison of the third and fourth rows shows
that very few products are sold more than once by the same seller.
The second panel of Table 1 shows that the distribution of product condition among
transactions of used goods is non-uniform, and varies across product categories. For indi-
vidual sellers, most transactions involve products in a condition advertised as ‘very good’ or
‘as new’ , but there is still a large number of products sold in a ‘good’ or ‘fair’ condition.
The third panel shows quantiles of the distribution of seller size (the number of completed
transactions) in January 2008. To compute these quantiles, we consider sellers who are
‘active’ in January 2008. Since we do not observe seller exit, we assume that a seller is active
at a given date t if she created her account before t and makes at least one transaction after
t. Table 1 shows that there is substantial dispersion in seller size and that some sellers are
relatively big, even though they are not officially registered as businesses. Another feature
of the data is that individual sellers do not seem to just occasionally sell a few products on
9

Number of transactions per month
BOOKS CD GAMES VIDEO
050
000
1000
0015
0000
2000 2002 2004 2006 2008
010
000
2000
030
000
4000
0
2000 2002 2004 2006 2008
010
000
2000
030
000
4000
050
000
2002 2004 2006 2008 2010
020
000
4000
060
000
8000
0
2002 2004 2006 2008 2010
Average transaction price (in Euros) per month
BOOKS CD GAMES VIDEO
4.5
55.
56
6.5
7
2002 2004 2006 2008 2010
67
89
10
2002 2004 2006 2008 2010
1416
1820
22
2002 2004 2006 2008 2010
68
1012
14
2002 2004 2006 2008 2010
Distribution of seller rating in January 2008
BOOKS CD GAMES VIDEO
0.5
11.
52
2.5
3.5 4 4.5 5
0.5
11.
52
2.5
3.5 4 4.5 5
0.5
11.
52
2.5
3.5 4 4.5 5
0.5
11.
52
2.5
3.5 4 4.5 5
Figure 1: Descriptive statistics for individual sellers and used goods
10

Table 1: Descriptive statistics: individual sellers and used goods
BOOKS CD GAMES VIDEONumber of...sellers 152 894 88 366 164 706 131 111products 767 209 270 189 31 500 123 789seller/product 3 820 354 1 812 987 1 586 264 2 445 400transactions 3 981 429 1 948 637 1 759 572 2 927 386
Number of transactions per used product conditionfair 249 363 40 134 45 827 29 022good 723 313 218 625 200 243 180 752very good 1 712 632 1 038 310 962 373 2 054 480as new 1 296 121 651 568 551 129 663 132
Distribution of seller size in January 20085% quantile 2 4 2 350% quantile 29 48 28 3895% quantile 328 424 321 37299% quantile 879 1 097 877 968
Distribution of feedback across completed transactionsPr(feedback = 1) 0.6% 0.9% 1.5% 1.1%Pr(feedback = 2) 0.8% 0.9% 1.2% 0.9%Pr(feedback = 3) 2.4% 2.9% 3.3% 2.6%Pr(feedback = 4) 9.9% 11.1% 13.4% 10.7%Pr(feedback = 5) 86.3% 84.1% 80.6% 84.7%
PriceMinister: more than half of the sellers make around 30 transactions or more.
The bottom panel shows the distribution of feedback ratings for each category. While it
is highly concentrated on the default grade of 5, 15 to 20% of feedback ratings are below 5.
Because 5 is the default, a feedback score equal to 5 only means that the buyer is satisfied
enough with the transaction that he does not feel the urge to actively enter a strictly lower
score.13
The important conclusion from the last panel of Table 1 is that there is sufficient variation
in feedback grades to induce variation in the rating of sellers. In the last panel of Figure 1
we show the distribution of rating for sellers who are ‘active’ in January 2008. As expected,
very few sellers have a rating below 4 (around 1%). In the interest of readability, we do
13Suppose that some consumers always grade actively while others leave the default unchanged. If themass of the former type of consumers is small, a grade of 5 is not very informative while a grade of 4 couldbe interpreted as positive feedback.
11

Table 2: Price dispersion
BOOKS CD GAMES VIDEO
No. of distinct transaction prices for a given product- mean 3.5 5.0 25 13- median 2 2 8 4
If no. of distinct transaction prices > 1- pmax/pmin (mean) 3.31 3.98 8.78 5.67- pmax/pmin (median) 1.98 2.04 4.63 3.11- p10/p50 (mean) 0.73 0.71 0.60 0.64- p90/p50 (mean) 1.55 1.54 1.92 1.73
If no. of transactions ≥ 10- No. of prices (mean) 15 21 47 31- No. of prices (median) 11 14 26 19- pmax/pmin (mean) 6.62 8.40 12.24 8.70- pmax/pmin (median) 3.98 4.43 7.47 5.56- p10/p50 (mean) 0.65 0.60 0.55 0.58- p90/p50 (mean) 1.77 1.73 2.03 1.85
Note: pmax (pmin) is the maximum (minimum) price observed for a given product.
p10 (p50, p90) is the 10% price quantile (50%, 90%) for a given product.
not show these sellers on the graphs. Most rating levels are above 4.5 and the mode of the
distribution is at 4.8 for all product categories. It is important to note that while most sellers
have a rating between 4 and 5, there is substantial variation across the sample between these
two bounds. Our analysis will show that a 0.1 difference in rating will have a strong effect
on the transaction price and, given the dispersion of seller rating between 4 and 5 (4.6, 4.7,
etc.) this will result in substantial variation in prices.
To end this section, we show evidence of price dispersion within product. The relevant
descriptive statistics are in Table 2. Looking at the first panel of Table 2, we see that on
average there are at least 3 different transaction prices for a given book and up to 25 different
prices for a given video game. The distribution is very asymmetric as the median number
of distinct transaction prices is between 2 and 8, depending on the product category. It
should be noted that that these moments are taken over the whole population of products,
including the very large number of products that are sold only once.
If we focus on products with at least 2 different transaction prices, and thus look at the
middle panel of Table 2, we see that the maximum price is on average 3 (books) to 8 (video
games) times larger than the minimum price. The median ratio of highest to lowest price
is also large (2 to 4.6). Hence, transactions for a single product take place at a very wide
12

range of prices. This range seems to be wider above the median as the 10% price quantile
is 60 to 73% smaller than the median while the 90% price quantile is 154% to 192% times
higher than the median.
A natural explanation for this price dispersion within product lies in changes in demand
over time. The price of, say, a music album may be high just after its release but will decrease
over time as the demand for this particular product falls. We will account for this feature in
our analysis by controlling for the age of a product. For this section however, since we take
a first descriptive pass at the data, we just look at the overall distribution of prices within
product.
The bottom panel of Table 2 zooms in on the group of products that are sold at least 10
times. We see that these products have on average 15 (books) to 47 (video games) different
transaction prices and, whether we look at the mean or the median ratio, the maximum
price is at least 4 times higher than the minimum price.
We thus observe a large amount of within-product price dispersion in our data. The
same CD can be sold at prices that differ by a factor 4 on average. These price differences
could result from changes in demand over time, from seller differentiation (and thus reflect
differences in rating or size) or from market imperfections such as search frictions. We will
control for the dynamics of the demand side (accounting for product age and for product
category-specific trends) and study the effect of two seller characteristics, rating and size, on
transaction prices.
3 Empirical framework
In section 3.1, we present the econometric model used for our analysis. Section 3.2 shows how
we tackle identification issues and section 3.3 is devoted to estimation. Our analysis is essen-
tially empirical and reduced-form but we should mention that a vast theoretical literature is
devoted to seller reputation. This concept encompasses different phenomena depending on
the information unavailable to market participants (sellers’ hidden characteristics or hidden
actions) and on the equilibrium concept (Markov or Bayesian Perfect).14 Most theoretical
models are solved under extreme assumptions about the environment, in particular about
hidden characteristic and the distribution of observables. The link between our empirical
framework and the existing theory is discussed in Appendix B.
3.1 The econometric model
Let pijd be the (logarithm of the) price set by seller i for product j at time d (time is discrete).
We consider the following price equation:
pijd = g (rid, sid) + βxijd + αi + µj + εijd, (1)
14A tentative unifying framework is provided by Bar-Isaac and Tadelis (2008)
13

where rid denotes seller i’s rating at date d and sid denotes her size. The effect of these
two variables, formally defined below, is modeled as a function g which we will specify
momentarily. The vector xijd contains the seller/product characteristics observed by the
econometrician at date d, including the product’s list price, condition and age (a complete
list is presented in Section 3.3). The variables αi and µj respectively denote seller and
product fixed characteristics that are unobserved by the econometrician. Finally, εijd is
a scalar unobserved seller/product-specific shock capturing market conditions for (i, j) at
date d. It is assumed mean-independent of any of the other contemporaneous right-hand
side variables. Apart from αi, all the variables on the right-hand side of (1) are observed
by buyers. The seller fixed effect αi may or may not be observed by the buyer (see the
discussion in Appendix).
Our outcome of interest is the transaction price. We cannot study advert prices or
purchase probabilities because, whilst we have exhaustive information on transactions, we
only have limited information on adverts.15 Our analysis will thus aim at estimating a
causal statistical effect of reputation on transaction prices but not at delving into consumers’
preferences for rating or sellers’ pricing decisions. Still, our reduced-form equation (1) is
grounded in economic theory, as we discuss in Appendix B.
The effect of reputation on transaction prices is captured by the function g that is made
dependent on the prominent information, consisting in the (average) rating and size. That
rating positively affects reputation is our motivation for this study. Size is shown jointly
with the rating on the advert and webpage of the seller. It matters for two reasons. First
the confidence that a buyer will attach to the rating depends on the size. In particular a
bayesian updater would put more weight on the rating (vs prior beliefs) when many buyers
have tested the seller, because the information is more precise. Also, as shown by Bar-Isaac,
2003, under adverse selection, bad sellers tend to exit the market sooner than good sellers
so that the number of transactions may be a signal of quality. Hence, we may expect size to
have a direct effect in prices but also an effect interacting with rating. This latter interaction
will be considered in one of our specifications of the g function.
Before we turn to the identification and estimation of these effects in our data, it is useful
to discuss the flip side of the reputation mechanism, namely the feedback process.
Consider the nth transaction for seller i and product j and let d0(i, j, n) and d1(i, j, n)
be the dates when this transaction is initiated (when the buyer purchases the product) and
completed (when feedback is received) respectively. Seller i’s size at date d is given by:
sid = #{j, n : d1(i, j, n) ≤ d
}, (2)
where #{·} denotes the cardinality of a set.
Let fijn denote the feedback grade set by the buyer for this transaction. The rating
index rit of seller i at date d is the rounded average, to the nearest first decimal, of all past
15As shown by Elfenbein et al. (2012), seller quality signals may affect their probability of selling. Unfor-tunately, our data does not allow us to tackle the resulting selection effect.
14

feedback (for all completed transaction). Formally:
rid = ⌊10 · f id + 0.5⌋/10 where f id =
1
sid·
∑
j,n : d1(i,j,n)≤d
fijn, (3)
and where ⌊·⌋ denotes the floor (integer) function.16
We assume that feedback fijn is a function of price, rating, size, all observed or unob-
served characteristics at date d0 (i, j, n) (when the transaction is initiated), of the duration
d1(i, j, n) − d0(i, j, n) between the initiation and completion dates of a transaction, and of
some unobserved shock affecting buyer satisfaction. We will not derive or estimate this func-
tion. Studying the determinants of buyer feedback is an important and interesting question
but it is beyond the scope of this paper. Yet, independently of the specific form of that
function, this discussion suggests that reverse causality may be an issue in our estimation
of the effect of reputation on prices, as the feedback rating fijn can be affected by the price
pijd0(i,j,n) in any transaction. For instance, a buyer paying a higher price may have higher
expectations about quality of service. Moreover high-price and low-price offers may attract
consumers with different marginal willingness to pay for quality.
Since rating is a summary measure of past feedback, it will in general depend on past
prices. The rating variable rid in equation (1) may thus be correlated with past realizations
of the ε shocks. The same problem may arise with the size variable. Again, rather than fully
specifying the feedback function and estimating the determinants of feedback, we will take
a reduced-form approach to tackling reverse causality, as discussed in the next sub-section.
3.2 Identification
The main identification problem lies in the presence of seller and product fixed effects, respec-
tively αi and µj, which are not independent of the outcomes of seller i’s past transactions,
and thus of seller i’s rating rid and size sid.
Sellers can change the price they post for a specific item, so that prices do vary within
a seller/product pair (i, j). However, exploiting this source of variation is problematic for
several reasons. First, we observe that only a small fraction of seller/product pairs have
transactions at different prices. This is especially true for non-professional sellers who, in
the overwhelming majority of cases, sell only one copy of any given good. Second, in order
to exploit price changes within seller/product pairs, we need to model the sellers’ decision
to update their prices and address the resulting selection problem.
We thus choose another route to identify our effects of interest and exploit differences
within sellers.17 While this will take out the unobserved seller effect αi, this approach raises
16Note that a seller’s reputation (and size) may change between the date when an advert for a givenproduct is posted and the transaction date. We use the seller’s reputation at the latter date as it is the oneseen by the consumers when they purchase the good. Using the limited information we have on adverts,we find that sellers very rarely change their advert price for a given product (most of our sellers are privateindividuals, not professional sellers).
17As discussed in section 2.2, our price variable is net of shipping costs, which depend on the shipping
15

two further concerns which we discuss in turn. First, we still have to deal with product
unobserved heterogeneity. Second, rating and size may depend on past ε shocks in (1).
3.2.1 First transactions
By definition, when a seller sells a product j for the first time, she has not yet received any
feedback for transactions involving this product. Hence product j’s characteristics have not
yet had any direct effect on the seller’s reputation. We will use this insight to identify g.
We focus on the first transaction for each seller/product pair (i, j): for all product j/seller
i pair observed in our initial data set, we only keep the observation corresponding to the first
time seller i sells a copy of product j. We then sort these ‘first transactions’ chronologically
for each seller and denote the tth first transaction using the index t.18 The product sold
by seller i at (first) transaction t is denoted by j(i, t). Considering equation (1) for first
transactions only thus consists of selecting those observations for which there is a t ≥ 1 such
that d = d0(i, j(i, t), 1). This allows us to replace the triple index (i, j, d) by the double index
(i, t) where d = d0(i, j(i, t), 1). Rewriting (1) in this fashion, the price equation that we take
to the data reads:
pit = g (rit, sit) + β · xit + αi + µj(i,t) + εit. (4)
We thus have a panel where sellers are individuals for which we observe a series of ‘first
transactions’, as defined earlier, and where the time dimension is given by the chronological
rank of a transaction in a seller’s series of first transactions. Taking forward differences
between t and t+ k, k ≥ 1, we get:
pit+k − pit = [g (rit+k, sit+k)− g (rit, sit)] + β · (xit+k − xit)
+ µj(i,t+k) − µj(i,t) + εit+k − εit, (5)
The seller unobserved effect αi has been differenced out but the second line of (5) shows
that there are still two unobservables: µj(i,t+k)−µj(i,t) and εit+k − εit. These two unobserved
variables are at the source of both identification issues discussed above: unobserved product
heterogeneity and the dependence of reputation on past shocks.
3.2.2 Product heterogeneity
At any first transaction t, the rating and size posted on the web site for seller i are based on
that seller’s past transactions, none of which involves product j(i, t). Hence, product j(i, t)’s
characteristics have no direct effect on the seller i’s size and rating at transaction t. They
mode chosen by the buyer according to a fixed scale set by PriceMinister. If sellers try to influence buyers’choices of shipping options, our identification approach requires that the resulting strategy does not varyover time within seller in response to reputation or sales shocks.
18Since individual sellers rarely sell more than one copy of any item (see Table 1), the descriptive statisticsshown in 2.3 would not vary much if we computed them on first transactions only. In particular, there wouldbe as much variation in reputation and size across sellers. Descriptive statistics on first transactions areavailable from the authors upon request.
16

may still affect rit and sit indirectly through their correlation with the seller’s characteristics.
We thus need further assumptions.
Formally, the first assumption we will use to achieve identification and to write our
moment conditions is the following mean-independence condition:
E[(µj(i,t+k) − µj(i,t)
)|rit−ℓ
]= E
[(µj(i,t+k) − µj(i,t)
)|sit−ℓ
]= 0, ∀i, t, k ≥ 1, ℓ ≥ 0. (6)
In words, condition (6) means that for each seller the change in unobserved product char-
acteristics between two (first) transactions, t and t + k, is mean independent of the seller’s
rating or size at t. We now discuss the validity of this assumption.
First, we observe key product characteristics, namely the product list price, age and
condition, which arguably capture a large share of the heterogeneity across products. We
should also note that estimation is conducted separately by product category so we do not
compare, say, books with video games. If a seller specializes in, say, special collector’s
editions of certain books, this should be reflected in those books’ list prices and will thus be
captured by our observed variables.
Residual unobserved heterogeneity may then arise from features not captured by the
list price such as whether the book seller specializes in, say, French literature. This could
be a problem if equation (6) was written in levels. We would then need a stronger, but
easier to interpret, assumption that would rule out any sorting between seller and product
unobserved characteristics. Writing (5) in differences however allows for sellers to specialize
in an unobserved category with the variation in µ within seller coming from iid shocks.
The latter assumption rules out cases where sellers change the (unobserved) type of
products they specialize into in response to changes in their reputation. We believe this
assumption to be largely uncontroversial for individual sellers (the category we mainly focus
on), the majority of whom are private individuals selling whatever products they happen to
have purchased at some point and now want to get rid of. It is difficult to believe that those
sellers strategically adjust the types of products they sell in response to changes in their
reputation. Our assumption, however, may be stronger when applied to professional sellers.
It should be stressed, however, that this assumption only applies to unobserved product
characteristics. If, for example, a seller responds to a declining reputation by advertising
cheaper products, this will be captured by the observed product list price.
Lastly, an alternative approach would have consisted in focusing on a small number of
products (see e.g. Cabral and Hortacsu, 2010) and thus conduct estimation for each product
separately. We do not follow this route because we want to evaluate the effects of reputation
for a large and varied set of products, which we think is in itself a contribution to the existing
literature.
3.2.3 The dynamics of reputation
The second issue with the differenced price equation (5) lies in the term εit+k − εit. The
seller’s rating and size at transaction t + k are built on past transactions and will thus be
17

correlated with past prices, including pit and thus εit, through the feedback mechanism.
Since the unobserved price shock εit is orthogonal to the current (or past) rating and size
variables, we can use (any function of) rit−ℓ and sit−ℓ, for ℓ ≥ 0, as instruments. Indeed the
following conditional mean independence condition holds:19
E [(εit+k − εit) |rit−ℓ] = E [(εit+k − εit) |sit−ℓ] = 0, ∀i, t, k ≥ 1, ℓ ≥ 0. (7)
We use conditions (6) and (7) to identify and estimate the function g. Before presenting
the estimation approach in the next subsection we should point out that we have discussed
identification under the assumption of iid price shocks ε. While our approach could easily
be extended to accommodate some persistence in εit, we will test (and not reject) after
estimation the assumption of iid shocks.
3.3 Estimation
In theory we could use our identifying assumptions (6) and (7) to conduct a nonparametric
instrumental regression.20 However we have two potentially endogenous variables, rating and
size, and many exogenous regressors (which we present in detail at the end of this section).
We thus take the simpler approach of specifying a functional form for g, and using a set of
instrumental variables and moment equations to estimate the parameters of interest.
All our estimations are based on the following moment equation:
E {[pit+k − pit − (g (rit+k, sit+k)− g (rit, sit))− β · (xit+k − xit)] · z} = 0, (8)
for all instruments z in a set Zgit and for a given specified function g and a given k ≥ 1.
The expectation is taken over all sellers and first transactions, that is over (i, t) within a
given product category. The specification we use for our benchmark estimation results is the
following:
g(r, s) = γr + δs+ δ2s2, Zg
it ={rit, sit, s
2it
}and k = 1. (9)
The main parameter of interest will thus be γ, the effect of an increase in rating on (log)
prices. In all tables below, we will rescale γ as measuring the effect of an increase in rating
of 0.1.21
We will also consider alternative specifications, essentially for two purposes. The first
one is to allow for a more flexible relationship between rating, size and prices. This will be
achieved by changing the specification of g. The second purpose is to check the robustness of
our results. For this we can consider longer differences in the price equation, k > 1, and/or
a different set of instruments Zgit (for instance including further lags of rating or size). We
will discuss these alternative specifications in Section 4.
19Note that these conditions are slightly weaker than assuming conditional independence between εit andrit−ℓ or sit−ℓ, ℓ ≥ 1.
20See e.g. Ai and Chen (2003) or Darolles et al. (2011).21Recall that reputation is rounded to the nearest multiple of 0.1 on the PriceMinister web site, so that
0.1 is the minimal variation in reputation that is observable by buyers.
18

For each category of sellers (individual or professional), product (books, CDs, video or
games) and product quality (used or new), the sample used for estimation contains the first
transaction of each seller/product pair. Sellers who only make one transaction in the product
category are thus dropped from the sample. Prices are in logarithms. The strictly exogenous
observed covariates xit are product list price, product age,22 year × quarter dummies and, for
used products, dummies indicating the product’s advertised condition (as new, very good,
good, fair).23
4 Results
4.1 The effect of reputation on prices
We now present and discuss our main estimation results. Unless mentioned otherwise, we
will focus on individual sellers and used goods. Results for other types of sellers or goods
will be discussed in section 4.3.
For all tables, the coefficients of rating are divided by 10, and those of size and size2
are multiplied by 103 and 106, respectively, so one should interpret the numbers as marginal
changes in (log) prices following a 0.1-increase in rating or a increase in size by 1,000 trans-
actions. All standard errors are robust to a within-seller correlation of the residuals (εit).24
We first consider the benchmark specification (9), with a linear effect of rating and a
quadratic effect of size. In Table 3, we show the coefficients of rating and size estimated
by three approaches. The first one simply consists in estimating the price equation (4) by
OLS. Estimates thus obtained are likely to suffer from an omitted variable bias because of
unobserved seller/product heterogeneity (αi + µj(i,t)). We then show estimates based on an
OLS regression of the first-differenced price equation (5). The resulting estimates, labeled
FOLS in the tables, are also likely to be biased because rating and size may depend on
past prices, or because of changes in the unobserved product characteristics µ. Finally, our
preferred results are based on the GMM estimation of the first-differenced price equation (5)
using the moment conditions (8) and the specification (9), as explained in section 3.3.
For our benchmark GMM estimation, we should mention that the autocorrelation of
residuals from the first-differenced price equation (5) is estimated around −0.45 at the first
order and drops to around 0.01 to 0.015 at higher orders for all product categories, thus
indicating that our assumption of iid shocks εit (which are thus MA(1) in first differences)
is borne out by the data.
22Our data set contains a variable giving the release date of each product but there are many missingobservations. We thus measure the age of a product as the time between the current transaction and thefirst observed transaction for this product on the web site.
23We will also show separate results for each of the four conditions.24Recall that we are working under the assumption that εit is iid across sellers and dates, so that, as we
estimate the price equation in differences, the difference εi,t+k − εit will be autocorrelated within sellers.
19

Table 3: The effect of seller rating - Estimates of γ - GMM benchmark specification (9)
OLS FOLS GMM
BOOKS 0.000612 (0.0013) -0.00380 (0.00072)∗∗∗ 0.237 (0.0097)∗∗∗
CD 0.0153 (0.0016) -0.00235 (0.00091)∗∗∗ 0.201 (0.013)∗∗∗
GAMES 0.000862 (0.00051)∗ -0.00359 (0.00059)∗∗∗ 0.133 (0.0062)∗∗∗
VIDEO -0.000612 (0.0015) -0.00190 (0.00083)∗∗ 0.214 (0.0097)∗∗∗
Note: The coefficients are divided by 10 (effect of a 0.1 increase in reputation).
Standard errors in parenthesis, 1/2/3 stars if estimate significant at the 10%/5%/1% level.
For OLS, N = 3051759 (books), 1563542 (CD), 1254995 (games), 2048781 (video).
For FOLS/GMM, N = 2949281 (books), 1505925 (CD), 1157709 (games), 1967060 (video).
Other regressors (not shown): size, size2, product age, list price, condition, year/quarter dummies.
The effect of rating. Estimation results are in Table 3. We start with the OLS results
and find little conclusive evidence of any correlation between rating and prices in the pooled
sample. The estimated coefficient of rating is positive for books, CDs and games, and
negative for videos. In all cases, the magnitude of that coefficient is very small as a 0.1
increase in rating would change prices by less than 0.1% (except for CDs where the change
would be 1.5%). The estimate is not significant (except for video games, at the 10% level).
Turning to the FOLS estimation results, we find a significant yet again very small effect
of rating for all categories, always smaller than 0.4% in absolute value. Unlike with OLS,
the FOLS estimates are consistently negative across product categories.
The last column of Table 3 differs markedly from the first two. Our preferred estimates,
based on GMM, show a significant, positive and strong effect of rating on prices. This is
the main result of this paper. Once unobserved heterogeneity and the dependence between
reputation and past shocks are accounted for, we find consistent evidence that a 0.1 increase
in a seller’s rating raises prices by a substantial amount (around 20% for books, CDs and
videos, 13% for video games). We will show that our results are robust to changes in the
instrument set, to the specification of the g function and to the way we difference out the
unobserved seller effect. We will also provide evidence that the effect of rating is also strong
for professional sellers. Note that the effect of rating varies across product categories, it is
stronger for books (24%) and weaker, although still substantial, for video games (13%).
It is interesting to note that even on a platform where payments are held until buyers
confirm that they have received the good, seller reputation can have such a strong impact
on prices. A higher reputation can reflect a lower probability of delays in the delivery of
the good, of an inaccurate description of the product condition or of any reason why the
20
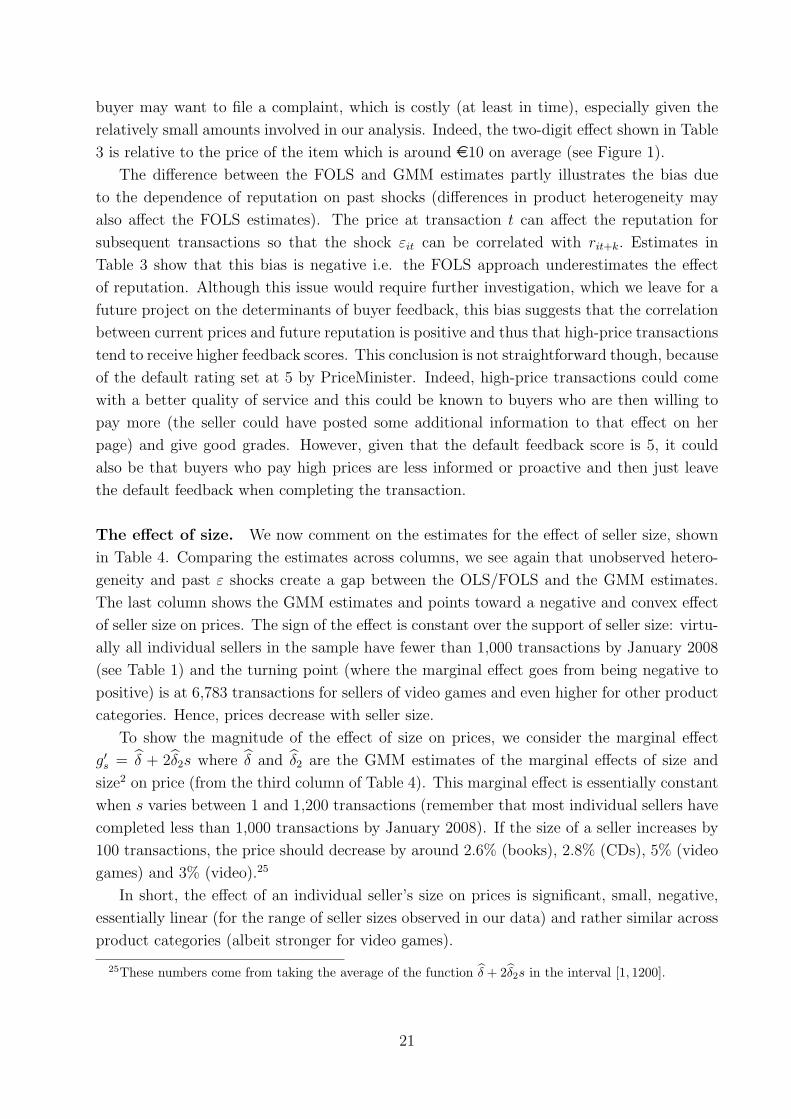
buyer may want to file a complaint, which is costly (at least in time), especially given the
relatively small amounts involved in our analysis. Indeed, the two-digit effect shown in Table
3 is relative to the price of the item which is around e10 on average (see Figure 1).
The difference between the FOLS and GMM estimates partly illustrates the bias due
to the dependence of reputation on past shocks (differences in product heterogeneity may
also affect the FOLS estimates). The price at transaction t can affect the reputation for
subsequent transactions so that the shock εit can be correlated with rit+k. Estimates in
Table 3 show that this bias is negative i.e. the FOLS approach underestimates the effect
of reputation. Although this issue would require further investigation, which we leave for a
future project on the determinants of buyer feedback, this bias suggests that the correlation
between current prices and future reputation is positive and thus that high-price transactions
tend to receive higher feedback scores. This conclusion is not straightforward though, because
of the default rating set at 5 by PriceMinister. Indeed, high-price transactions could come
with a better quality of service and this could be known to buyers who are then willing to
pay more (the seller could have posted some additional information to that effect on her
page) and give good grades. However, given that the default feedback score is 5, it could
also be that buyers who pay high prices are less informed or proactive and then just leave
the default feedback when completing the transaction.
The effect of size. We now comment on the estimates for the effect of seller size, shown
in Table 4. Comparing the estimates across columns, we see again that unobserved hetero-
geneity and past ε shocks create a gap between the OLS/FOLS and the GMM estimates.
The last column shows the GMM estimates and points toward a negative and convex effect
of seller size on prices. The sign of the effect is constant over the support of seller size: virtu-
ally all individual sellers in the sample have fewer than 1,000 transactions by January 2008
(see Table 1) and the turning point (where the marginal effect goes from being negative to
positive) is at 6,783 transactions for sellers of video games and even higher for other product
categories. Hence, prices decrease with seller size.
To show the magnitude of the effect of size on prices, we consider the marginal effect
g′s = δ + 2δ2s where δ and δ2 are the GMM estimates of the marginal effects of size and
size2 on price (from the third column of Table 4). This marginal effect is essentially constant
when s varies between 1 and 1,200 transactions (remember that most individual sellers have
completed less than 1,000 transactions by January 2008). If the size of a seller increases by
100 transactions, the price should decrease by around 2.6% (books), 2.8% (CDs), 5% (video
games) and 3% (video).25
In short, the effect of an individual seller’s size on prices is significant, small, negative,
essentially linear (for the range of seller sizes observed in our data) and rather similar across
product categories (albeit stronger for video games).
25These numbers come from taking the average of the function δ + 2δ2s in the interval [1, 1200].
21

Table 4: The effect of size - GMM benchmark specification (9)
OLS FOLS GMMBOOKS
size -0.0912 (0.024)∗∗∗ -0.0673 (0.058) -0.268 (0.035)∗∗∗
size2 0.0141 (0.0037)∗∗∗ 0.00179 (0.0021) 0.0116 (0.0038)∗∗∗
CDsize 0.0810 (0.028)∗∗∗ -0.0531 (0.053) -0.283 (0.11)∗∗∗
size2 -0.0116 (0.0054)∗∗ 0.0104 (0.0051)∗∗ 0.00927 (0.025)
GAMESsize 0.000619 (0.019) 0.136 (0.059)∗∗ -0.525 (0.073)∗∗∗
size2 0.00227 (0.0041) -0.0361 (0.016)∗∗ 0.0387 (0.016)∗∗
VIDEOsize 0.0516 (0.021)∗∗ 0.111 (0.055)∗∗ -0.300 (0.044)∗∗∗
size2 -0.00755 (0.0020)∗∗∗ -0.00531 (0.0020)∗∗∗ 0.00683 (0.0059)
Note: The coefficients of size and size2 are multiplied by 103 and 106.
Standard errors in parenthesis, 1/2/3 stars if estimate significant at the 10%/5%/1% level.
Other regressors (not shown): rating, product age, list price, condition, year/quarter dummies.
22

Table 5: The effect of strictly exogenous covariates (x) - GMM benchmark specification (9)
BOOKS CD GAMES VIDEO
Product age -0.072 (0.001) -0.072 (0.001) -0.240 (0.001) -0.130 (0.001)List price 0.259 (0.001) 0.072 (0.001) 0.147 (0.002) 0.150 (0.002)
Product condition:- good 0.115 (0.003) 0.132 (0.006) 0.137 (0.006) 0.080 (0.008)- very good 0.220 (0.004) 0.266 (0.007) 0.280 (0.006) 0.153 (0.009)- as new 0.329 (0.004) 0.387 (0.007) 0.401 (0.006) 0.223 (0.009)
Note: All estimates significant at the 1% level. Standard errors in parenthesis.
Product age is measured in years.
The reference for product condition is ‘fair’.
Other product characteristics. Before moving on to an alternative specification of the
g function, we take a quick look at coefficient estimates for some variables in the x vector,
still using the benchmark specification (9). These estimates are shown in Table 5. We do
not show the estimates for the year × quarter dummies.
We first note that all the variables in Table 5 have a significant effect on prices. The age
of a product has a negative effect on prices, from -20% for books and CDs to -66% for video
games. This is intuitive as we expect demand for a given video game to fall more quickly
over time than demand for a book or a CD. The effect of list price, positive and significant,
is also in line with intuition. Lastly, product condition has a strong and positive effect on
prices. Moreover, we note that when the condition goes up by one level (from ‘fair’ to ‘good’
or from ‘very good’ to ‘as new’), the price increase is almost constant, around 11% for books,
13% for CDs, 12-14% for video games and 7-8% for videos.
Does the effect of rating depend on size? We now consider a different specification
for g and add an interaction term between size and rating to the piecewise-linear function
in (9). Formally, the specification is the following:
g(r, s) = γr + φrs+ δs+ δ2s2, Zg
it ={rit, rit · sit, sit, s
2it
}and k = 1. (10)
GMM estimates are in Table 6. They show that rating still has a significant, positive and
strong effect on prices. The coefficient capturing the linear effect of rating is in line with the
one we found with our benchmark specification (cf. Table 3). The main insight from Table 6
is that the effect of rating on prices depends on the seller’s size, the estimated coefficient of
rs is always significant and positive. This means that the positive impact of rating on prices
is stronger for larger sellers. After 10 completed transactions, the marginal effect of rating
on prices increases by 0.87% for books, 0.76% for CDs, 0.42% for video games and 0.65% for
23

Table 6: Interaction between rating and size, specification (10) - GMM estimates
BOOKS CD GAMES VIDEO
r 0.248 (0.01)∗∗∗ 0.195 (0.01)∗∗∗ 0.126 (0.01)∗∗∗ 0.215 (0.01)∗∗∗
rs 0.871 (0.29)∗∗∗ 0.767 (0.19)∗∗∗ 0.424 (0.11)∗∗∗ 0.650 (0.14)∗∗∗
s -42.03 (13.9)∗∗∗ -37.1 (8.95)∗∗∗ -20.85 (5.05)∗∗∗ -31.37 (6.5)∗∗∗
s2 -0.022 (0.02) 0.0001 (0.03) 0.053 (0.026)∗∗ -0.024 (0.013)∗
Note: Standard errors in parenthesis, 1/2/3 stars if estimate significant at the 10%/5%/1% level.
The coefficient of r is divided by 10, those for rs, s and s2 are multiplied by 102, 103 and 106.
Other regressors (not shown): product age, list price, condition, year/quarter dummies.
videos. This positive interaction between rating and size is consistent with a Bayesian model
of learning which predicts that the weight attached to the average performance increases over
time while the weight attached to the prior decreases.
We showed in Table 1 that the median size of individual sellers active in January 2008
was 29 for books, 48 for CDs, 28 for video games and 38 for videos. If we then use the
estimates in Table 6 to compute the effect of rating at these median levels of seller size, we
find that a 0.1 increase in rating raises prices by 27% for books (27% ≈ 0.248+0.871×0.029),
23% for CDs, 14% for video games and 24% for videos. These numbers are qualitatively
consistent with those we found with our benchmark specification (9) (see Table 3). We will
thus mostly use our benchmark specification in the following sections, except when we focus
on professional sellers, as the support of seller size is different for those sellers.
4.2 Results by product condition
Our benchmark analysis focuses on individual sellers, who may only sell used products.
Those products can be advertised as being in one of four conditions: ‘as new’, ‘very good’,
‘good’ or ‘fair’. We already know from Table 5 that product condition has a significant
effect on prices. As discussed in section 2.2, we do not tackle the challenging problem of
manipulation of product condition by sellers. In this subsection, however, we check whether
the estimated effect of reputation is different for different advertised product conditions.
To this end, we estimate our linear specification (9) separately for each product condition.
Results are in Table 7.
We first note that for any advertised product condition and category, the effect of rating
is significant, positive and large. Taking a closer look at the effect of rating across product
conditions, we see that the main pattern emerging from Table 7 is that the effect of rating
on price increases in magnitude when the advertised condition of the product deteriorates.
This is true for all four product categories.
If the information asymmetry only revolved around dimensions such as delays, care and
24

Table 7: Effect of seller rating by product condition - GMM benchmark specification (9)
BOOKS CD GAMES VIDEO
As new 0.240 (0.012) 0.180 (0.016) 0.106 (0.007) 0.192 (0.011)
Very good 0.293 (0.016) 0.214 (0.014) 0.152 (0.009) 0.282 (0.018)
Good 0.312 (0.022) 0.301 (0.026) 0.214 (0.018) 0.420 (0.045)
Fair 0.317 (0.037) 0.514 (0.086) 0.375 (0.052) 0.510 (0.13)
Note: All estimates significant at the 1% level. Standard errors in parenthesis.
The coefficient is divided by 10.
Other regressors (not shown): size, size2, product age, list price, year/quarter dummies.
delivery, we would expect the effect of reputation to be unaffected by the condition or to be
larger for products advertised as being ‘as new’ or in a ‘very good’ condition. An alternative
interpretation is that consumers are also concerned about the quality of the good itself, which
seems consistent with the results. First, there is more variation of quality within the category
‘fair’ than within the category ‘as new’ (the latter is more specific). Second, seller reputation
also reflects the confidence that buyers have in the description of the good (Jullien and Park,
2014) and there may be more disagreement on the accuracy of the description for poorer
conditions.26 Hence rating might well convey information beyond the seller’s propensity to
report product condition accurately.27
4.3 Results for professional sellers and new/used goods
So far, we have focused on individual sellers and used goods. In this subsection, we show
how reputation affect prices for professional sellers (i.e. those listed in the official register of
French corporations) selling used or new goods. We use specification (10), thereby allowing
for an interaction term between rating and size, and estimate the model by GMM.We think it
is important to allow for an interaction between rating and size when comparing professional
and individual sellers, as the support of size is very different between these two populations.
Table 8 shows the estimation results for professional sellers and new goods, professional
sellers and used goods and, for comparison, also includes the estimates for individual sellers
and used goods (from Table 6).
We first consider used goods only and compare results between professional and individ-
26Note that the issue of misclassification of a damaged/out-of-order product as ‘fair’ may arise.27The importance of an accurate description of the product’s condition is supported by the estimates in
Table 5 which showed a strong positive effect of product condition on prices.
25

Table 8: Professional and individuals sellers - GMM estimates - Linear specification (9)
Pro - New Pro - Used IndividualBOOKSrating 0.0206 (0.077) 0.229 (0.090)∗∗ 0.248 (0.012)∗∗∗
rating × size 0.000287 (0.00028) 0.00383 (0.0058) 0.871 (0.29)∗∗∗
CDrating 0.0478 (0.094) 0.438 (0.22)∗∗ 0.195 (0.013)∗∗∗
rating × size -0.0000716 (0.00014) 0.0774 (0.062) 0.767 (0.19)∗∗∗
GAMESrating 0.202 (0.10)∗∗ 0.193 (0.070)∗∗∗ 0.126 (0.0066)∗∗∗
rating × size 0.00339 (0.0035) 0.0147 (0.016) 0.424 (0.11)∗∗∗
VIDEOrating 0.158 (0.081)∗ 0.256 (0.088)∗∗∗ 0.215 (0.011)∗∗∗
rating × size 0.00442 (0.0049) 0.0306 (0.018)∗ 0.650 (0.14)∗∗∗
Note: The coefficients for rating/rating × size is divided by 10/multiplied by 102.
Standard errors in parenthesis, 1/2/3 stars if estimate significant at the 10%/5%/1% level.
For Pro/Used, N = 350190 (books), 162880 (CD), 131300 (games), 161662 (video).
For Pro/New, N = 203311 (books), 198505 (CD), 59616 (games), 217629 (video).
Regressors not shown: size, size2, product age, list price, condition (if used), year/quarter dummies.
ual sellers. Consistently with what we found for individual sellers, rating has a significant,
positive and strong impact on transaction prices for transactions involving professional sell-
ers and used goods (although for used CDs, the standard error is large). Point estimates
suggest that the prices of used games and videos respond more to reputation for professional
than for individual sellers. However, our estimates are not precise enough to conclude that
these differences are statistically significant at conventional levels. Still, these results may
indicate that professional/individual seller status and seller ratings are not used by buyers
as complementary pieces of information to predict the quality of a transaction. If they were,
and if professional status was perceived as a positive signal of quality, we would expect
feedback ratings to have a smaller effect on price for professional sellers. A more rigorous
interpretation of these differences would require a structural model.
For professional sellers, the effect of rating is not affected by size. This is different from
what we find with individual sellers whose rating had a stronger impact on prices as size
increased. It is interesting to see that the ‘professional seller’ status, meaning that the
seller is registered with the French ministry of commerce, seems to make the effect of rating
independent of size. Moreover, individual sellers of CDs, video games or videos need to
26

make many transactions (respectively 317, 158 and 63)28 before the impact of their rating
on prices becomes as strong as that of professional sellers.
Next focusing on professional sellers only and comparing results for new and used goods,
we first note that the effect of rating is always significant, positive and strong except for new
books and CDs. The former reflects an institutional feature of the market for new books in
France. The price of a new book is fixed by the publisher, printed on the book and during the
first two years after publication, no one is allowed to offer more than a 5% discount on that
regulated price. This law does not apply to used books. It is therefore not surprising to find
a non-significant effect of rating on the prices of new books. The small and non-significant
effect estimated for new CDs is more puzzling. Given that payment is deferred until the
object is received, the main sources of uncertainty should be related to the description of the
item’s condition and the quality of services (see Smith and Brynjolfsson (2001)). For new
goods, the latter should matter prominently as there is less scope for inaccurate product
description. Thus one interpretation is that uncertainty on the quality of service matters
less than accuracy of condition for that product category, while it matters relatively more
for video games. We should also mention that the market for new CDs on PriceMinister
seems to be more concentrated than for other product categories. Indeed, the seller with
the highest number of transactions of new CDs accounts for almost a third (31%) of total
transactions in this product category. The second largest seller only accounts for 3.5% of
total transactions. If we look at other new product categories, the largest and second largest
sellers make up respectively 12.7% and 6.3% of all transactions for books, 8.5% and 5.5%
for video games and 6.6% and 5.8% for videos.
The effect of buyer feedback for the other two product categories, video games and videos,
is strongly positive. However we cannot find a specific pattern between used and new goods
for these two categories as the effect of reputation for used goods is estimated to be larger for
videos and lower for games. Moreover these differences are not significant. Still, the fact that
reputation has a strong effect on transaction prices of new goods can be taken as evidence
that, for professional sellers, information asymmetry does not only pertain to the condition
of the good but also to the accuracy of its description on the web site (e.g. subtitles for a
DVD) and/or to the quality of service (e.g. delivery time, quality of packaging, etc.).
4.4 Prices, reputation and recent feedback history
So far we have focused on average feedback as the measure of reputation. This is motivated
by the design of the PriceMinister web site, where the information immediately available to
buyers about a given advert consists of the price, the product’s condition and the seller’s
name, rating and size. However, buyers who want to learn more about a seller can look at her
feedback history, where previous feedback scores and comments are presented in chronological
order (pooling all types of product and displaying the outcomes of around 10 transactions
28These numbers come from the estimates in Table 8. For CDs: 317 ≈ (0.438− 0.195)/0.767× 1000.
27
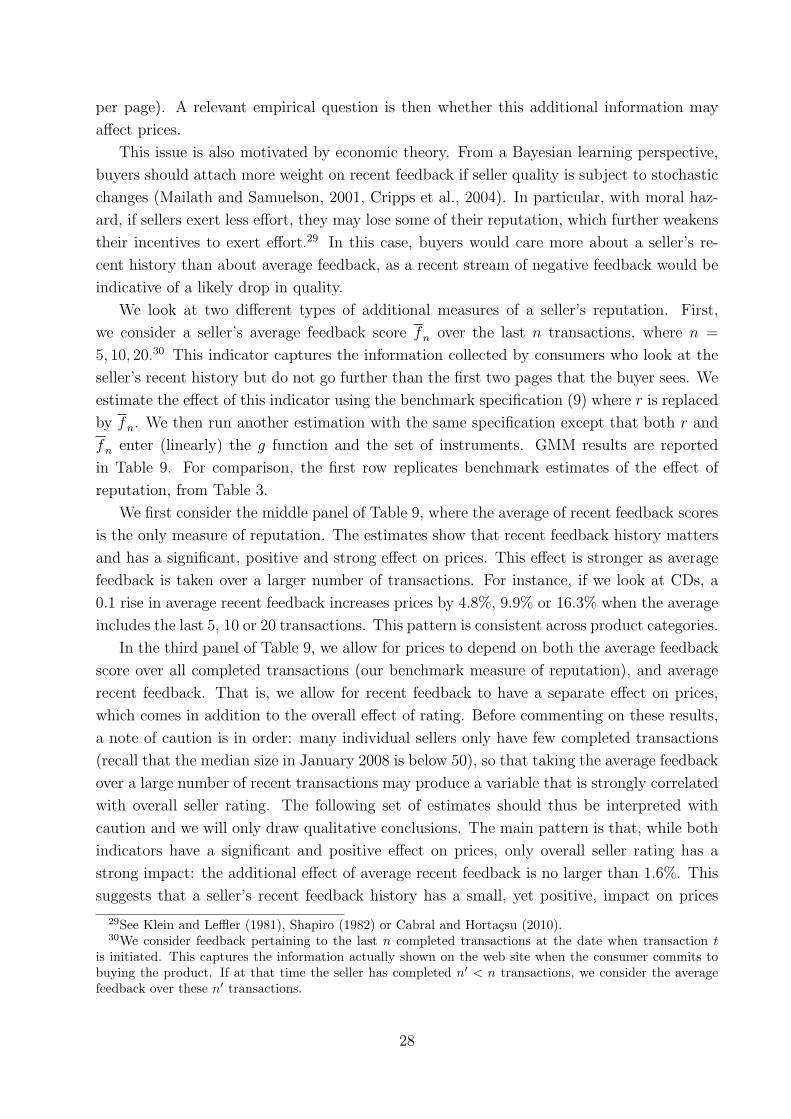
per page). A relevant empirical question is then whether this additional information may
affect prices.
This issue is also motivated by economic theory. From a Bayesian learning perspective,
buyers should attach more weight on recent feedback if seller quality is subject to stochastic
changes (Mailath and Samuelson, 2001, Cripps et al., 2004). In particular, with moral haz-
ard, if sellers exert less effort, they may lose some of their reputation, which further weakens
their incentives to exert effort.29 In this case, buyers would care more about a seller’s re-
cent history than about average feedback, as a recent stream of negative feedback would be
indicative of a likely drop in quality.
We look at two different types of additional measures of a seller’s reputation. First,
we consider a seller’s average feedback score fn over the last n transactions, where n =
5, 10, 20.30 This indicator captures the information collected by consumers who look at the
seller’s recent history but do not go further than the first two pages that the buyer sees. We
estimate the effect of this indicator using the benchmark specification (9) where r is replaced
by fn. We then run another estimation with the same specification except that both r and
fn enter (linearly) the g function and the set of instruments. GMM results are reported
in Table 9. For comparison, the first row replicates benchmark estimates of the effect of
reputation, from Table 3.
We first consider the middle panel of Table 9, where the average of recent feedback scores
is the only measure of reputation. The estimates show that recent feedback history matters
and has a significant, positive and strong effect on prices. This effect is stronger as average
feedback is taken over a larger number of transactions. For instance, if we look at CDs, a
0.1 rise in average recent feedback increases prices by 4.8%, 9.9% or 16.3% when the average
includes the last 5, 10 or 20 transactions. This pattern is consistent across product categories.
In the third panel of Table 9, we allow for prices to depend on both the average feedback
score over all completed transactions (our benchmark measure of reputation), and average
recent feedback. That is, we allow for recent feedback to have a separate effect on prices,
which comes in addition to the overall effect of rating. Before commenting on these results,
a note of caution is in order: many individual sellers only have few completed transactions
(recall that the median size in January 2008 is below 50), so that taking the average feedback
over a large number of recent transactions may produce a variable that is strongly correlated
with overall seller rating. The following set of estimates should thus be interpreted with
caution and we will only draw qualitative conclusions. The main pattern is that, while both
indicators have a significant and positive effect on prices, only overall seller rating has a
strong impact: the additional effect of average recent feedback is no larger than 1.6%. This
suggests that a seller’s recent feedback history has a small, yet positive, impact on prices
29See Klein and Leffler (1981), Shapiro (1982) or Cabral and Hortacsu (2010).30We consider feedback pertaining to the last n completed transactions at the date when transaction t
is initiated. This captures the information actually shown on the web site when the consumer commits tobuying the product. If at that time the seller has completed n′ < n transactions, we consider the averagefeedback over these n′ transactions.
28

Table 9: Reputation and recent feedback - GMM estimates
Benchmark specification
BOOKS CD GAMES VIDEO
r 0.237 (0.01) 0.201 (0.01) 0.133 (0.01) 0.214 (0.01)
Replacing reputation with recent feedback average
BOOKS CD GAMES VIDEO
f 5 0.0572 (0.0023) 0.0483 (0.0032) 0.0524 (0.0026) 0.0508 (0.0023)
f 10 0.117 (0.0048) 0.0989 (0.0065) 0.0897 (0.0045) 0.106 (0.0048)
f 20 0.188 (0.0080) 0.163 (0.011) 0.116 (0.0059) 0.174 (0.0082)
Allowing for both reputation and recent feedback average
BOOKS CD GAMES VIDEO
r 0.322 (0.015) 0.258 (0.018) 0.186 (0.0098) 0.282 (0.014)
f 5 0.0035 (0.0005) 0.00242 (0.0005) 0.0018 (0.0005) 0.0022 (0.0005)
r 0.318 (0.015) 0.254 (0.018) 0.183 (0.0097) 0.278 (0.014)
f 10 0.0082 (0.0009) 0.0061 (0.001) 0.0049 (0.0009) 0.0061 (0.0009)
r 0.312 (0.015) 0.251 (0.018) 0.181 (0.0096) 0.274 (0.014)
f 20 0.016 (0.002) 0.012 (0.002) 0.0080 (0.0012) 0.012 (0.002)
Note: All estimates significant at the 1% level. Standard errors in parenthesis.
All coefficients are divided by 10.
fn is the average feedback over the last n transactions.
Other regressors (not shown): size, size2, product age, list price, condition, year/quarter dummies.
29

Table 10: Alternative indicators - Recent feedback - GMM estimates
1 {min (f5) > 2} 1 {min (f10) > 2} 1 {min (f5) = 5} 1 {min (f10) = 5}
BOOKS 0.157 (0.0084) 0.112 (0.0076) 0.0189 (0.0024) 0.0159 (0.0026)
CD 0.127 (0.011) 0.089 (0.0094) 0.0132 (0.0028) 0.0131 (0.0030)
GAMES 0.136 (0.0096) 0.111 (0.0091) 0.0150 (0.0032) 0.0220 (0.0036)
VIDEO 0.130 (0.0078) 0.098 (0.0070) 0.0167 (0.0026) 0.0169 (0.0027)
Note: All estimates significant at the 1% level. Standard errors in parenthesis.
min(fn
)is the minimum of the last n feedback scores.
Other regressors (not shown): size, size2, product age, list price, condition, year/quarter dummies.
once the seller’s rating has been taken into account.
We would need a structural model to interpret this result in terms of buyer search strategy.
One possible explanation is that buyers do not actually care much about recent history and
only look at average rating. Another would be that buyers do care about both indicators
but only those with a low search cost take the time to browse the seller’s full history. In this
case the estimates shown in Table 9 would capture a population average effect.
We confirm the results of Cabral and Hortacsu (2010) in that recent feedback matters,
but we find that it matters less than the average seller score (rating) readily displayed on the
web site. This, of course, does not say what would be the effect of recent feedback if average
recent feedback was shown by default together with (or instead of) total average feedback.
We can also construct other indicators of a seller’s recent feedback history. In line with
Cabral and Hortacsu (2010), we can for instance see whether prices are affected by extreme
values of recent feedback scores. To this end, we consider two alternative types of indicators.
We first construct a dummy equal to 1 if none of the last 5 (or 10) feedback scores was lower
than 2 (out of 5), which indicates that none of the seller’s recent transactions was rated very
unsatisfactory by the buyer. We also consider a dummy equal to 1 if all of the last 5 (or 10)
feedback ratings were equal to 5 (the maximum score). We then estimate specification (9)
replacing rating r by each of these new indicators in turn. Results are in Table 10.
The first two columns of Table 10 show that having recently received a low feedback score
has a strong, significant and negative effect on the price (since the effect of having received
no low feedback is positive). This effect weakens slightly as one looks at the last 10 feedback
ratings instead of the last 5, which is consistent with negative feedback having a more averse
effect when it is more recent. Looking at the last two columns of Table 10, we note that
having the maximum score in all of the last 5 or 10 transactions has a significant and positive
effect on prices. However, the magnitude of the estimates, around 1-2%, is much lower than
30

that of the effect of recent negative feedback.
4.5 Robustness
We have conducted a series of robustness checks. First we want to ensure that our results
are not driven by a specific choice of instruments and/or by our approach to differencing
out the unobserved seller effect. To this end, we consider a series of modified versions of our
benchmark specification (9) and estimate the effect of rating by GMM. These robustness
checks consist of the following:
− we consider alternative forward-difference transformations of the price to difference out
the seller fixed effect,
− we add further lags of rating and size to our instrument set,
− we add the seller’s average feedback over recent transactions to the instrument set,
− we add a control for the product sales up to date t, to further account for heterogeneity
in product demand.
We present and discuss the results of these robustness checks in Appendix C. The main
picture is that our results on the effect of rating on prices are robust to these departures
from our benchmark specification: rating has a significant, positive and strong effect on
prices (stronger for books and videos than for CDs and video games).
Checking for weak instruments. We have also checked for potential weak instrument
issues. Since we have more than one endogenous variable in the benchmark specification
(reputation, size and size squared), we cannot simply use the three separate F -statistics
from first-stage regressions (which are all very large, with three digits or more). Instead, we
use the test statistic developed by Sanderson and Windmeijer (2015) specifically for cases
like ours i.e. for linear IV models with multiple endogenous variables. For each product
category, we compute three conditional F -statistics (one for each endogenous variable) and
find that they are very large (at least three digits). We thus conclude that our estimation
results do not suffer from a weak instrument bias.
Using both longitudinal and cross-sectional variation. We now present more in
details a more original robustness check which challenges the source of information we use
for identification. Our estimation is based on differencing the price equation (4) within
sellers and then instrumenting changes in rating and size to account for the dynamics of
these seller characteristics. We are thus essentially using within-seller variation in rating
and size. One may then question whether a seller’s reputation still varies after a large
number of transactions. Indeed, if the reputation mechanism aims to reveal the seller’s type,
it should converge to a value reflecting the average quality of the seller’s transactions. In
31

that case, reputation should not vary much anymore past a certain number of transactions.
Our estimates would then essentially be exploiting variations in reputation for transactions
with a small seller size while future transactions may not bring much information for the
identification of the effects of interest.
To check that our results are not solely driven by transactions with a small seller size, we
need to exploit the cross-sectional variation for large sellers. The problem is that part of this
variation is due to the unobserved seller effect αi. Our approach consists of first estimating
this seller fixed effect by running our GMM estimation on the differenced price equation (5)
using only on the first transactions for each seller, for instance when t ≤ T where T = 5
or 10, from which we then obtain an estimate αi of each seller fixed effect. We can then
take this effect out of the price equation (4) and estimate the parameters by OLS. Indeed,
the seller fixed effect is controlled for and, if we assume away sorting between unobserved
seller and product characteristics,31 the unobserved product effect µj is not correlated with
rating and size when the first transaction for this seller/product pair takes place. We can
run OLS for t ≤ T , which should yield the same estimates as the GMM estimates obtained
on t ≤ T , and for t > T . This will show whether the cross-sectional variation for large size
transactions is consistent with the longitudinal variation within sellers. Results are in Table
11.
Note that the standard errors for our OLS estimates would need to be corrected for the
variability in the first-stage estimate of the seller fixed effect. We only show the uncorrected
standard errors, which as one expects are very small, and we will draw comparisons only
based on the point estimates.
First, we note that all estimates in Table 11, whether obtained by GMM or by “OLS”,
are in line with our benchmark GMM estimates (see Table 3). Although all estimates are
significant, positive and large, there is a small discrepancy with Table 3 as the point estimates
in Table 11 are 15-20% lower (except for videos where the difference is larger). Still, the
qualitative conclusions stand.
If we are to compare estimates across the columns of Table 11, we find that the longitu-
dinal variation (used to produce the GMM estimates) is consistent with the cross-sectional
variation (used in the last two columns). Moreover, we find that the estimates in the last
column, for t > T , are systematically slightly larger than the ones in the second column, for
t ≤ T . This may indicate that seller size positively but weakly influences the effect of rating
on prices. This is consistent with the results we found in Table 6, where we allowed for an
interaction between rating and size and estimated this interaction to be significant, positive
but small (below 0.1%) when the number of transactions was low (around 10).
31Note that this is a stronger assumption than the one we used, assumption (6), for our benchmark GMMestimation.
32

Table 11: Comparing cross-sectional and longitudinal variation - Effect of seller rating
GMM, t ≤ 5 OLS(α), t ≤ 5 OLS(α), t > 5
BOOKS 0.209 (0.011) 0.200 (0.0002) 0.199 (0.001)
CD 0.178 (0.011) 0.170 (0.0002) 0.172 (0.001)
GAMES 0.120 (0.0064) 0.110 (0.0002) 0.111 (0.001)
VIDEO 0.147 (0.012) 0.136 (0.0002) 0.142 (0.003)
GMM, t ≤ 10 OLS(α), t ≤ 10 OLS(α), t > 10
BOOKS 0.203 (0.0091) 0.193 (0.0002) 0.193 (0.001)
CD 0.180 (0.0098) 0.171 (0.0002) 0.173 (0.001)
GAMES 0.112 (0.0057) 0.101 (0.0002) 0.103 (0.001)
VIDEO 0.164 (0.0091) 0.149 (0.0003) 0.155 (0.002)
Note: All GMM estimates significant at the 1% level.
Standard errors in parenthesis (uncorrected for OLS estimates).
GMM based on (8)-(9).
OLS(α) based on (4) where αi is taken out of the left- and right-hand sides.
Other regressors (not shown): size, size2, product age, list price, condition, year/quarter dummies.
4.6 Comparison with the existing literature
Our results show large-scale evidence of a strong and positive effect of seller rating on trans-
action prices. Our analysis contributes to the existing literature on online seller reputation
along at least two dimensions. First, we explicitly account for unobserved seller heterogeneity
and for the dynamics of reputation and prices. Second, we estimate the effect of reputation
on prices for a large and varied set of products, product conditions, and types of sellers.
The existing empirical evidence of a causal effect between reputation and price has
been based on controlled field experiments (Resnick et al., 2006), on structural models
(Bajari and Hortacsu, 2003), or on reduced-form regressions. Due to data limitations, the
latter category (which includes Bajari and Hortacsu, 2004 and Cabral and Hortacsu, 2010)
cannot fully account for unobserved seller heterogeneity and/or for dynamics of reputation.
More recently, the contribution by Lei (2011), based on eBay data, tackles the issue of prod-
uct heterogeneity by looking at one very specific product (Gmail invitations) and indirectly
33

controls for sellers’ skills by using the auction title as a regressor.
As we mention in the Introduction, two recent papers by Anderson and Magruder (2012)
and Luca (2011) have also made significant contributions, albeit in a very different set-
ting from ours. Indeed we use price as the outcome (they look at restaurant bookings or
revenues) and our data come from a web site where feedback is systematic and unilateral.
One interesting feature of those two papers is that they exploit a discontinuity in the feed-
back mechanism, namely the fact that the score posted on-line is a rounded average of past
feedback ratings. Seller rating on PriceMinister is constructed in the same way, so that in
principle, the PriceMinister data could lend itself to such a regression discontinuity design ap-
proach (RDD hereafter). However the distance to the cutoff point (the cutoff point between,
e.g., a posted rating of 4.5 and one of 4.6 being 4.55) depends on seller size which is also an
endogenous variable. Indeed, it will take more additional feedback to take a seller’s average
score from, say, 4.54 to 4.56 (thus changing that seller’s rating from 4.5 to 4.6) if this seller’s
size is large than if it is small. Directly importing the RDD idea of Anderson and Magruder
(2012) and Luca (2011) into our context thus seems problematic, and we therefore resort to
panel-data techniques to provide large-scale evidence of the effect of both rating and size on
prices (the latter effect could not be estimated with an RDD approach).
The recent paper by Fan et al. (2013) uses a 14-month panel with information about a
group of sellers on a large e-commerce platform in China (Taobao). These authors estimate
the effects of last month’s reputation indicators on some seller outcomes such as revenue
and sales. Their approach revolves around linear regressions with a seller fixed effect and
instrumental variables. The endogeneity that they consider arises from a potential correlation
between last month’s reputation and an unobserved and persistent quality shock. Their
instrumentation strategy exploits the fact that sellers can also be buyers and thus uses
variables pertaining to sellers’ history as buyers. Our paper differs from theirs in several
ways. First, we observe the sellers’ entire histories and focus on transaction prices (which are
not directly observed in Fan et al., 2013). We look at the effect of those seller characteristics
(rating and size) that were displayed on the web site at the exact time each transaction
took place, not at a monthly frequency. This allows us to study the effect of reputation for a
wider set of products and product conditions. Lastly, the source of endogeneity we consider is
different as it arises from a dynamic effect of transaction prices on future reputation through
the feedback mechanism. We can thus exploit structural assumptions on the dynamics of
shocks to instrument for rating and size.
We now turn to the article by Cabral and Hortacsu (2010) on eBay data. We use a richer
data set, which helps us tackle important identification issues. Moreover, the web site we use
for our analysis has a different design than eBay: price-posting (no auctions), and a unilateral
feedback mechanism (little scope for retaliation), make the relationship between reputation
and prices more straightforward to interpret. Cabral and Hortacsu (2010) have transaction
data for three specific products sold on eBay. They find that the proportion of negative
feedback affects prices negatively. OLS estimates show an effect of around 9% in magnitude,
34

which becomes non significant when one accounts for within-seller correlation. Moreover, this
effect disappears when the authors control for a large-seller dummy, in an effort to account
for seller heterogeneity. An interesting feature of the Cabral and Hortacsu (2010) analysis
is that they can also exploit a change in the design of the eBay web site which affected the
feedback information passed on to bidders. Using this change as a natural experiment, they
show that negative feedbacks can influence prices. Unfortunately their data did not allow
them to exploit any longitudinal variation for the estimation of their price equation.
Our results bring about additional evidence of a significant effect of seller reputation on
transaction prices. We consider a wide range of products (at the cost of some assumptions
on sorting), and our very rich longitudinal data set allows us to address explicitly unobserved
heterogeneity and the dynamic relationship between reputation and past prices. Our OLS
results shown in Table 3 are consistent with Cabral and Hortacsu (2010) and previous work
finding a weak, slightly positive and significant relationship between reputation and prices
in cross-sections. The effect vanishes once the unobserved seller effect is differenced out. By
contrast, our preferred GMM estimates, shown in Table 3 point toward a significant, positive
and strong effect of reputation on prices, in accordance with Cabral and Hortacsu (2010)’s
natural experiment results.
In our data, the main effect goes through the seller’s average score, although recent feed-
back may also matter (see Table 9). Comparing this with the result from Cabral and Hortacsu
(2010) that the first negative feedback on eBay has a strong effect on sales suggests that
framing matters, an issue that should be further investigated (see Nosko and Tadelis, 2014
for work in this direction). Finally we confirm that the effect of rating interacts with the
seller’s size (see Table 6).
5 Conclusion
In this paper, we have used a unique exhaustive data set from a large e-commerce web site to
study the effect of on-line seller rating and size on transaction prices. Our first contribution is
methodological as our data allow us to explicitly account for seller unobserved heterogeneity.
There, we highlight, and overcome, the bias arising from the dependence of reputation on
past prices. Our second contribution is descriptive as we provide empirical evidence of a
significant, positive and strong effect of seller reputation on transaction prices for a large
and varied group of product categories (books to video games), product conditions (used
or new) and types of seller (individual or professional). We thus provide new results on
the determinants of the reputation effect induced by feedback scores. As far as we know,
such large-scale evidence of an empirical relationship between prices and reputation was not
available prior to this study.
The next step would now be to delve into the causal statistical link between rating and
prices that we uncovered in this paper. This requires a structural model of price formation
on an on-line platform. There are many issues to be tackled with a more structural approach,
35

each of which motivating an interesting project for which the PriceMinister data would be
useful. First, we can study the dynamic strategies of sellers who may want to manipulate
prices over time in order to build up or milk their reputation. Secondly, one may be interested
in the reverse causality mechanism and study how consumers’ feedbacks are formed. Another
interesting research question is how the vast degree of price dispersion observed on the
web site results from seller differentiation (through e.g. reputation) and/or through search
frictions. In particular, this latter project will shed light on whether the strong positive
effect of reputation on prices we found in this paper reflects consumers’ preferences and/or
of other features of on-line markets.
References
Ai, C. and X. Chen (2003): “Efficient Estimation of Models with Conditional Moment Restric-tions Containing Unknown Functions,” Econometrica, 71, 1795–1843.
Anderson, M. and J. Magruder (2012): “Learning from the Crowd: Regression DiscontinuityEstimates of the Effects of an Online Review Database,” Economic Journal, 122, 957–989.
Armstrong, M. and J. Zhou (2011): “Paying for Prominence,” Economic Journal, 121, F368–F395.
Atkeson, A., C. Hellwig, and G. Ordonez (2012): “Optimal Regulation in the Presence ofReputation Concerns,” Nber working paper.
Bajari, P. and A. Hortacsu (2003): “The Winner’s Curse, Reserve Prices, and EndogenousEntry: Empirical Insights from eBay Auctions,” Rand Journal of Economics, 34, 329–55.
——— (2004): “Economic Insights from Internet Auctions,” Journal of Economic Literature, 42,457–86.
Bar-Isaac, H. (2003): “Reputation and Survival: Learning in a Dynamic Signalling Model,”Review of Economic Studies, 70, 231–251.
Bar-Isaac, H. and S. Tadelis (2008): “Seller Reputation,” Foundations and Trends in Microe-
conomics, 4, 273–351.
Baye, M., J. Morgan, and P. Scholten (2004): “Price Dispersion in the Small and in theLarge: Evidence from an Internet Price Comparison Site,” Journal of Industrial Economics, 52,463–496.
Bergemann, D. and J. Valimaki (1996): “Learning and Strategic Pricing,” Econometrica, 64,1125–1149.
Cabral, L. (2012): “Reputation on the Internet,” in The Oxford Handbook of the Digital Economy,ed. by M. Peitz and J. Waldfogel, Oxford University Press, chap. 13, 343–354.
Cabral, L. and A. Hortacsu (2010): “The Dynamics of Seller Reputation: Evidence frome-Bay,” Journal of Industrial Economics, 58, 54–78.
36

Cai, H., G. Jin, C. Liu, and L.-A. Zhou (2013): “More Trusting, Less Trust? An Investigationof Early e-Commerce in China,” Nber working paper.
Cripps, M., G. Mailath, and L. Samuelson (2004): “Imperfect Monitoring and ImpermanentReputations,” Econometrica, 72, 407–432.
Darolles, S., Y. Fan, J. Florens, and E. Renault (2011): “Nonparametric InstrumentalRegression,” Econometrica, 79, 1541–1565.
Dellarocas, C. (2003): “The Digitization of Word of Mouth: Promise and Challenges of OnlineFeedback Mechanisms,” Management Science, 49, 1407 – 1424.
——— (2006): “Reputation Mechanisms,” in Handbook on Information Systems and Economics,ed. by T. Hendershott, Elsevier, chap. 13, 629–660.
Dewally, M. and L. Ederington (2006): “Reputation, Certification, Warranties, and Infor-mation as Remedies for Seller-Buyer Information Asymmetries: Lessons from the Online ComicBook Market,” Journal of Business, 79, 693–729.
Dewan, S. and V. Hsu (1995): “Adverse Selection in Electronic Markets: Evidence from OnlineStamp Auctions,” Journal of Industrial Economics, 52, 497–516.
Durham, Y., M. Roelofs, and S. Standifird (2004): “eBay’s Buy-It-Now function: Who,when, and How,” Topics in Economic Analysis and Policy, 4, 1–22.
Einav, L., T. Kuchler, J. Levin, and N. Sundaresan (2013): “Learning from Seller Experi-ments in Online Markets,” Nber working paper.
Elfenbein, D., R. Fisman, and B. Mcmanus (2012): “Charity as a Substitute for Reputation:Evidence from an Online Marketplace,” Review of Economic Studies, 79, 1141–68.
Ericson, R. and A. Pakes (1995): “Markov-Perfect Industry Dynamics: A Framework forEmpirical Work,” Review of Economic Studies, 62, 53–82.
Fan, Y., J. Ju, and M. Xiao (2013): “Losing to Win: Reputation Management of Online Sellers,”mimeo.
Horner, J. (2002): “Reputation and Competition,” American Economic Review, 92, 644–663.
Houser, D. and J. Wooders (2006): “Reputation in auctions: Theory, and evidence from eBay,”Journal of Economics and Management Strategy, 15, 353–370.
Hui, X., M. Saeedi, Z. Shen, and N. Sundaresan (2014): “Reputation and Regulations:Evidence from eBay,” mimeo.
Jullien, B. and I.-U. Park (2014): “New, Like New, or Very Good? Reputation and Credibility,”The Review of Economic Studies, 81, 1543–1574.
Klein, B. and K. Leffler (1981): “The Role of Market Forces in Assuring Contractual Perfor-mance,” Journal of Political Economy, 89, 615–641.
Klein, T., C. Lambertz, and K. Stahl (2013): “Market Transparency, Adverse Selection, andMoral Hazard,” mimeo.
Lei, Q. (2011): “Financial Value of Reputation: Evidence from the eBay Auctions of GmailInvitations,” Journal of Industrial Economics, 59, 422–456.
37

Livingston, J. (2005): “How Valuable Is a Good Reputation? A Sample Selection Model ofInternet Auctions,” Review of Economics and Statistics, 87, 453–465.
Luca, M. (2011): “Reviews, Reputation, and Revenue: The Case of Yelp.com,” mimeo.
Lucking-Reiley, D., D. Bryan, N. Prasad, and D. Reeves (2007): “Pennies from Ebay:The Determinants of Price in Online Auctions,” Journal of Industrial Economics, 55, 223–233.
MacLeod, B. (2007): “Reputations, Relationships, and Contract Enforcement,” Journal of Eco-
nomic Literature, 45, 597–630.
Mailath, G. and L. Samuelson (2001): “Who Wants a Good Reputation?” Review of Economic
Studies, 68, 415–441.
McDonald, C. and C. Slawson (2002): “Reputation in an Internet Auction Market,” Economic
Inquiry, 40, 633–650.
Melnick, M. and J. Alm (2002): “Does a Seller’s Ecommerce Reputation Matter? Evidencefrom eBay Auctions,” Journal of Industrial Economics, 50, 337–49.
Nosko, C. and S. Tadelis (2014): “Quality Externalities and the Limits of Reputation,” mimeo.
Resnick, P. and R. Zeckhauser (2002): “Trust Among Strangers in Internet Transactions:Empirical Analysis of eBay’s Reputation System,” in The Economics of the Internet and E-
Commerce, ed. by M. Baye, Elsevier, 127–157.
Resnick, P., R. Zeckhauser, J. Swanson, and K. Lockwood (2006): “The Value of Repu-tation on eBay: A Controlled Experiment,” Experimental Economics, 9, 79–101.
Rosen, S. (1974): “Hedonic Prices and Implicit Markets: Product Differentiation in Pure Com-petition,” Journal of Political Economy, 82, 34–55.
Sanderson, E. and F. Windmeijer (2015): “A Weak Instrument F-test in Linear IV Modelswith Multiple Endogenous Variables,” Journal of Econometrics, forthcoming.
Shapiro, C. (1982): “Consumer Information, Product Quality, and Seller Reputation,” Bell Jour-
nal of Economics, 13, 20–35.
Smith, M. and E. Brynjolfsson (2001): “Consumer Decision-Making at an Internet Shopbot:Brand Still Matters,” Journal of Industrial Economics, 49, 541–558.
Tadelis, S. (1999): “What’s in a Name? Reputation as a Tradeable Asset,” American Economic
Review, 89, 548–563.
Weintraub, G., L. Benkard, and B. Van Roy (2008): “Markov Perfect Industry Dynamicswith Many Firms,” Econometrica, 76, 1375–411.
38

APPENDIX
A Descriptive statistics for professional sellers
Table A1: Descriptive statistics: Professional sellers - Used goods
Books CD Games VideoNumber of...
sellers 1 917 1 012 1 348 1 549products 395 084 105 532 19 511 52 589seller/product 568 382 194 170 151 265 191 607transactions 642 227 228 923 286 455 304 858
Number of transactions per used condition
fair 76 702 3 298 11 492 4 381good 217 831 24 621 51 269 27 227very good 181 392 102 033 108 994 189 773as new 166 302 98 971 114 700 83 477
Distribution of seller size in January 2008
5% quantile 28 18 14 1850% quantile 631 444 454 44895% quantile 13 327 9 531 10 163 8 56699% quantile 48 685 22 793 42 166 28 023
Table A2: Descriptive statistics: Professional sellers - New goods
Books CD Games VideoNumber of...
sellers 751 855 1 048 1 442products 157 858 150 164 15 505 75 239seller/product 222 366 222 599 64 386 242 375transactions 339 374 474 274 323 327 939 882
Distribution of seller size in January 2008
5% quantile 3 7 9 1250% quantile 406 302 606 54295% quantile 9 769 6 406 12 428 8 65199% quantile 44 503 22 793 43 530 22 793
39

B Discussion: Theoretical underpinnings
The price equation (1) contains the main ingredients present in most theoretical models of repu-
tation with non-competing sellers.32 The main substantive assumption underlying our statistical
model is that contemporaneous rating and size are the only relevant endogenous state variables on
which strategies are made contingent. One may describe the situation using the following basic
model. Each seller has an unknown type αi, and sells a sequence of items over time. Transaction
dates d and item characteristics zid follow exogenous processes. At any date, all buyers observe
the characteristics zid of the item (if any) as well as the same public information Iid about past
transactions and in particular the experience of past buyers. For each completed transaction, the
final quality qid is observed by the buyer only upon consumption. This quality is random and its
distribution depends on zid and the type αi of the seller. After observing qid, the buyer passes on
information about his experience to the market through the feedback system.
This set-up is quite flexible as it allows zid to include current characteristics of the market as well
as of the item, and Iid to vary from full information to coarse information. In our main specification,
we summarize the information available to buyers by the seller’s rating (mean feedback) and size,
Iid = {rid, sid}, because obtaining more information, while possible on the PriceMinister web site,
requires pro-active search by buyers. We will also consider alternative specifications that allow the
most recent feedback ratings to have a separate impact on prices.
Our model is consistent with the assumption of a Markov equilibrium being played. Under
the assumption of common prior beliefs about the types of sellers and public information, all
buyers hold the same beliefs about the distribution of the type αi of the seller, resulting from
the Bayesian updating of the prior distribution based on the information {Iid, zid} available at
the time of the transaction. These beliefs summarize all the information that is relevant from a
buyer perspective. The Markov assumption underlying our econometric specification is then that
for any given transaction, the strategy of the seller, hence the price, depends solely on the market
information Iid, the characteristics zid and the seller’s type (if it is known by the seller).33 This is a
common assumption in the literature on reputation, which is particularly appealing in our context,
as each seller faces many buyers and buyers see at best the history of feedback ratings, but not the
full history of prices and products sold.
Most models of reputation assume that demand exceeds supply so that a seller acts as a
monopoly.34 In our context sellers face competition to a variable degree: some items are offered
by one seller only, others are offered by many sellers at the same time. Ideally we would want to
control for the degree of competition. Unfortunately at the time of writing, we only have data on
completed transactions and thus cannot accurately observe the overall supply of each product at
all points in time.
32See Bar-Isaac and Tadelis (2008) for a review.33Notice that the dependence on type is captured by the fixed effect αi.34Many reputation models, for instance Tadelis (1999) or Mailath and Samuelson (2001), assume homoge-
nous demand and prices set at the consumers’ reserve price, but our model would also be consistent withelastic demand accounting for the seller’s benefits of inducing learning (Bergemann and Valimaki, 1996).
40

Although the literature on reputation in competitive markets is comparatively small, our spec-
ification would also be consistent with a situation featuring a large number of competing sellers.
For instance, in a simple model of non-strategic Bayesian learning about seller quality, our price
equation (1) could be interpreted as an equilibrium hedonic price equation where reputation enters
as a vertical attribute of goods (Rosen, 1974). In this case competition between multi-attribute
goods equalizes the utility that consumers expect to obtain from all items for sale, where this utility
depends on the price and an index of quality that is a function of the attributes. Such a model
was analyzed for input goods by Atkeson et al. (2012).35 In our model the attributes are zid and
E (αi|Iid), and the implied price equation is pid − g (Iid)− αzzid = hd, where hd is constant across
all items for sales at date d and reflects current aggregate supply and demand conditions.
The price equation (1) could also follow from a theoretical model of imperfect competition in
the spirit of Ericson and Pakes (1995), up to some simplifying assumptions ensuring that seller i’s
optimal price for product j at date d can be expressed as a function of variables pertaining to seller i
and product j at date d only (independent of other sellers’ characteristics). We thus need to impose
that the set of products offered by a seller at any date is exogenous, that sellers work ‘product by
product’ (i.e. treat their pricing decision on one product as independent of that on other products),
and that sellers are oblivious of other sellers’ pricing decisions. The latter assumption can be related
to the concept of oblivious equilibria which was introduced by Weintraub et al. (2008) to alleviate
the computational burden of simulating Markov Perfect Equilibria with a high-dimensional state
variable. These assumptions are reasonable for a large online market although there may be some
limitations due to loyalty and the endogenous degree of competition. Intuitively, these assumptions
are more likely to hold for individual sellers, which is the category we study in our benchmark
estimation.
We remain agnostic about whether or not a seller’s fixed effect αi is observed by buyers. Both
cases may arise: observable fixed effects may be related to the seller’s presentation skills, i.e. the
general look and feel of the seller’s page on the PriceMinister web site.
C Robustness checks: presentation and results
This section presents in detail the series of robustness mentioned in section 4.5. The results for
the effect of rating are in Table 12, where the first row shows estimates from our benchmark
specification, for comparison.
Alternative forward differences. The second panel of Table 12, labeled “forward differences”
shows the estimates we obtain when using longer forward differences to transform the price equation
and difference out the seller fixed effect. We see that except for video games, point estimates are
not substantially affected. The change is more marked for video games as the estimates goes from
13% to 4-7%, still positive, significant and far from being negligible.
35Horner (2002) proposes a competition model where the equilibrium price is an increasing function ofreputation (see equation B2, p. 659). However, in his model reputation is not public as only loyal customersobserve the seller’s history.
41

Table 12: Robustness checks - Effect of reputation - GMM estimates
BOOKS CD GAMES VIDEO
Specification (9) 0.237 (0.01) 0.201 (0.01) 0.133 (0.01) 0.214 (0.01)
Alternative specifications:
- forward differences:k = 5 0.252 (0.009) 0.179 (0.009) 0.070 (0.005) 0.206 (0.012)k = 10 0.282 (0.012) 0.177 (0.010) 0.039 (0.005) 0.206 (0.021)
- instrument sets Zgit:
further lags{rit−ℓ, sit−ℓ, s
2it−ℓ
}ℓ=0,3,5
0.176 (0.009) 0.165 (0.009) 0.122 (0.006) 0.174 (0.009){rit−ℓ, sit−ℓ, s
2it−ℓ
}ℓ=0,5,10
0.123 (0.011) 0.125 (0.010) 0.111 (0.008) 0.139 (0.011)
mean recent feedback{rit, f it5, sit, s
2it
}0.283 (0.017) 0.224 (0.021) 0.178 (0.010) 0.266 (0.014){
rit, f it10, sit, s2it
}0.232 (0.027) 0.192 (0.023) 0.157 (0.012) 0.242 (0.015)
- xit vector:controlling for sjt 0.236 (0.010) 0.213 (0.013) 0.0860 (0.010) 0.234 (0.010)
Note: All estimates significant at the 1% level. Standard errors in parenthesis.
Coefficients divided by 10.
f itn is the average of the n feedbacks received by seller i before transaction t.
sjt is the number of sales for product j realized before transaction date t.
Using further lags as instruments. In the next two panels, labeled “instrument set”, we
consider alternative instrumentation strategies. The first series of estimates (“further lags”) are
exploiting the assumption that not only the current but also any past value of rating and size
qualifies as an instrument. We thus re-estimate our price equation using two different augmented
instrument sets that include the current values, rit and sit, but also the lagged values t − 3 and
t − 5 (respectively t − 5 and t − 10) in Zgit. We keep the current values in the instrument set in
order to avoid a possible selection bias stemming from very small sellers being excluded from the
estimation. We note that adding these lagged values reduces the point estimates although the effect
of rating remains significant, positive and large. This decrease in the point estimates may come
from the well-known fact that adding more instruments will get the GMM estimate closer to the
OLS estimate (in this case the FOLS estimate), which we found to be essentially 0 (see Table 3).
Using recent feedback scores as instruments. Moving to the next series of estimates (“mean
recent feedback”), we see that adding another, potentially strong, instrument in Zgit yields estimates
42

relatively close to the benchmark ones (if anything the former are larger, pointing toward stronger
effects of rating). The motivation for using the mean of most recent feedback scores is the following.
The instruments aim at explaining a change in reputation between two consecutive first transac-
tions, rit+1 − rit. In the benchmark estimation, we use rit and thus instrument differences with
levels. It is realistic to assume that the recent stream of feedback received by the seller contains
relevant information to predict a change in rating in the short term whereas, following from our
assumptions on price shocks, it should have no direct effect on future price changes. It is thus
reassuring to see in Table 12 that our conclusions are robust to changes in the instrument set that
are not solely based on exploiting the panel dimension (i.e. on using further lags of rating and
size).
Heterogeneity in product demand. The last row of Table 12 pertains to product heterogene-
ity, more precisely to past demand for the product under consideration. Our identification strategy
requires us to control for enough product heterogeneity so that, conditionally on rating and size,
the expected difference in unobserved product characteristics between two consecutive first trans-
actions is equal to 0, see (6). We emphasized the role of the product list price in ensuring that
this assumption will hold. We now want to see whether our estimates are sensitive to adding one
more product attribute in the x vector, namely the number of sales observed for this product on
the web site before transaction t. Note that none of these sales are made by seller i since we are
estimating the model only on first transactions for each seller/product pair. With this variable, we
intend to capture the realized market demand for the product (before a given seller makes his first
transaction). The estimation results in Table 12 show that the effect of rating once again remains
qualitatively similar to what we found with our benchmark specification.
43