
& Japan Investment Overvie Updates and... · Labor intensive, export oriented,import substitute,...
31
Wisnu Wijaya Soedibjo Deputy Chairman for Investment Cooperation, Indonesia Investment Coordinating Board, BKPM Indonesia Investment Updates & Japan Investment Overview Jakarta, 15 February 2019
Transcript of & Japan Investment Overvie Updates and... · Labor intensive, export oriented,import substitute,...
Wisnu Wijaya Soedibjo
Deputy Chairman for Investment Cooperation,
Indonesia Investment Coordinating Board, BKPM
Indonesia Investment Updates& Japan Investment Overview
Jakarta, 15 February2019

Indonesia Investment Updates

Why Indonesia?
Indonesia’s economy is forecast to be the world’s 10th largest by 2025
trillion
GDP Only ASEAN
Member in the G20The largest
economy in ASEAN$1GDP of more
than $1 trillion
(PPP)
Indonesia is the fourth most populous country in the world
Population of
260 million
“Consuming class’
twice the size of the
population ofAustralia
Young and
dynamic people 44% of Indonesians
are aged under 25
Indonesia is a global leader in social media. It has:
More Facebook
and Twitter
users than the
population of
Australia
The world’s third
largest market for
The most active
city for Twitter in
the world: Jakarta
Source: various sources, 2018
44%2x

Indonesia among the top 10 optimist and safest countries
TOP 10 SAFEST COUNTRIES
Country Index Score
Singapore 97
Norway 93
Iceland 93
Finland 93
Uzbekistan 91
Hong Kong 91
Switzerland 90
Canada 90
Indonesia 89
Denmark 88
Source: Gallup World Polls, 2018
TOP 10 OPTIMISTS
Country Net Score
Nigeria +59
Vietnam +55
Indonesia +53
India +46
Philippines +32
Albania +31
Bangladesh +30
Fiji +27
Kosovo +25
Pakistan +20
Source: GallupInternational,2017
TOP 10 HAPPY COUNTRIES
Country Net Score
Fiji +92
Colombia +87
Philippines +84
Mexico +82
Vietnam +77
Kazakhstan +74
Papua New +74 Guinea
Indonesia +68
India +64
Argentina, +64 Netherland
Source: Gallup International,2017
“Maybe we are not the most advanced one, but it turns out
that we are one of the happiest people in the world”President Jokowi at the IMF-WB 2018Annual Meeting

Indonesia in the future... 2030... 2050...
Emerging markets will dominate the world’s top 10
economies in 2050 (GDP at PPPs)

Indonesia is the 4th Most Prospective Investment Destination and its sovereign credit rating continues trending higher
3444
56
777
91111
2036
40USChina India
Indonesia Thailand
Brazil
UKGermany
Mexico Philippines
Spain Vietnam
Singapore Canada
Australia
Source: UNCTAD, 2017

Investment Realisation in Indonesia Reaches Rp721.3 Trillion in 2018 and rise by 4.1%.
2013 2014 2015 2016 2017 2018
DDI FDI
399.2
463.1
545.4
612.8
692.8721.3
↑16.0%
↑17.8%
↑12.4%
↑13.1%
Investment Realisation(IDR Trillion)
↑4.1%
38%
62%

In the last 6 years (2013-2018), FDI in Indonesia is dominated by Asian countries (including Japan)
Asia 73%
Europe12%
America 11%
Africa 2% Australia 2%
2018 (in USD Bil)2013-2018
(in USD Bil)
Rank Cty Invest. Cty Invest.
1 Singapore 9.19 Singapore 43.22
2 Japan 4.95 Japan 25.64
3 China 2.38 China 10.13
4 Hong Kong 2.01 Malaysia 9.67
5 Malaysia 1.77 South Korea 9.24
6 South Korea 1.60 US 9.00
7 US 1.22 Hong Kong 8.35
8 BVI 1.04 Netherlands 7.87
9 Netherlands 0.94 BVI 5.19
10 Australia 0.60 UK 4.52

Priority Sectors for Investment
MaritimeIncluding fisheries and cold storage
Agriculture
The newbig
deal
InfrastructureEnergy, transportation, road, railway, airport, seaport, etc
Manufacturing IndustryLabor intensive, export oriented, import
substitute, and value added industry
Tourism“10 New Bali”
Lifestyle Industrye.g: creative economy, digital
industry
Including
Special Economic
Zone (SEZ)
Industrial Estate (IE)

Investment Climate is one of the critical points that the government is actively trying to improve
The government today is focused on regulation and bureaucracy reform, as well as simplifying the permit and requirements to invest.
IndikatorDB 2017
Ranking
DB 2018 DB 2019
Indonesia’s Doing Business Rank
91 72 73
Starting a Business 151 144 134
Dealing with Construction Permits
116 108 112
Getting Electricity 49 38 33
Registering Property 118 106 100
Getting Credit 62 55 44
Protecting Minority Investors
70 43 51
Paying Taxes 104 114 112
Tradingacross Borders
108 112 116
EnforcingContract 166 145 146
Resolving Insolvency 76 38 36
"Improvement of every indicator must become the priority of ministries and state institutions, so that efforts will be more focused, while concrete targets must be set.” (President Joko Widodo)

Fiscal Incentives Facility
IMPORT DUTY FACILITYMoF Regulation
No.176/PMK.011/2009 jo. MoFRegulation No. 76/PMK.011/2012 jo. MoF Regulation 188/PMK.010/2015
TAX ALLOWANCEGovernment Regulation No.9/2016
• 30% reduction of Corporate Income Tax (for 6 years, 5%each year)
• 145 Eligible business fields
• Exemption of import duty on machineries and equipment• 2 years exemption of import duty on raw materials• Additional 2 years import duty exemption for raw materials
if using locally-produced machineries and equipment (min 30%)
GREEN LANE FACILITY
• Facility for custom clearance at ports in Indonesia for capital goods, machinery or raw material
• For new companies under construction phase• Require BKPM recommendation and LKPM obligation fulfilled

Tax Allowance
Government Regulation No 9/2016
Agriculture • Livestock • Corn Plantation • Soybean Plantation • Rice farming • Tropical fruits plantation
Power Generation • Geothermal • Alternative energy
Oil and Gas Industry • Oil refineries • Liquefied Natural & Petroleum Gas • Lubricants
Manufacturing Industry• Iron and Steel • Clothing • Semi conductors • Electronic components • Computer • Communication devices • Television • Wheel • Pharmaceutical • Cosmetics • Fish and Shrimp processing

Tax HolidayPrimary Amendments of PMK 150/2018

Pioneer Industries
1. integrated upstream basic metals (which covers general smelting activities); 2. integrated oil and gas refining; 3. integrated petrochemicals arising from oil, gas or coal; 4. integrated inorganic basic chemicals; 5. integrated organic base chemicals derived from agricultural, plantation or forestry activities; 6. integrated pharmaceutical raw materials; 7. manufacturing of semi-conductors and other components integral to computers; 8. manufacturing of the main components of communication equipment integral to smartphones; 9. manufacturing of the main components of health equipment integral to irradiation, electro medical, or
electrotherapy equipment; 10. manufacturing of the main components of industrial to electrical motors or internal combustion engines; 11. manufacturing of the main components used in motor vehicle production; 12. manufacturing of the main components integrated with robotics; 13. manufacturing of the main components of vessel production; 14. manufacturing of the main components of aircraft production; 15. manufacturing of the main components of locomotive production; 16. power plant machinery (including waste to power); and 17. economic infrastructure
18. Digital economy
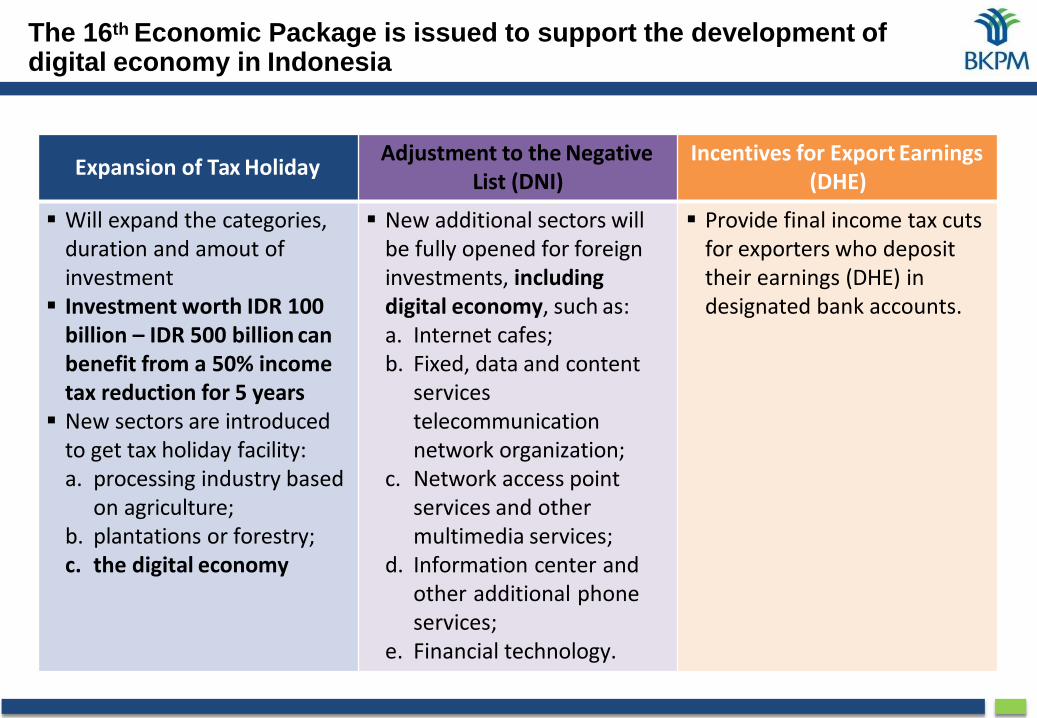
The 16th Economic Package is issued to support the development of digital economy in Indonesia
Expansion of Tax HolidayAdjustment to the Negative
List (DNI)Incentives for Export Earnings
(DHE)
Will expand the categories, duration and amout of investment
Investment worth IDR 100 billion – IDR 500 billion can benefit from a 50% income tax reduction for 5 years
New sectors are introduced to get tax holiday facility:a. processing industry based
on agriculture;b. plantations or forestry;c. the digital economy
New additional sectors will be fully opened for foreign investments, including digital economy, such as:a. Internet cafes;b. Fixed, data and content
services telecommunication network organization;
c. Network access point services and other multimedia services;
d. Information center andother additional phoneservices;
e. Financial technology.
Provide final income tax cuts for exporters who deposit their earnings (DHE) in designated bank accounts.


18 Categories of Pioneer Industry

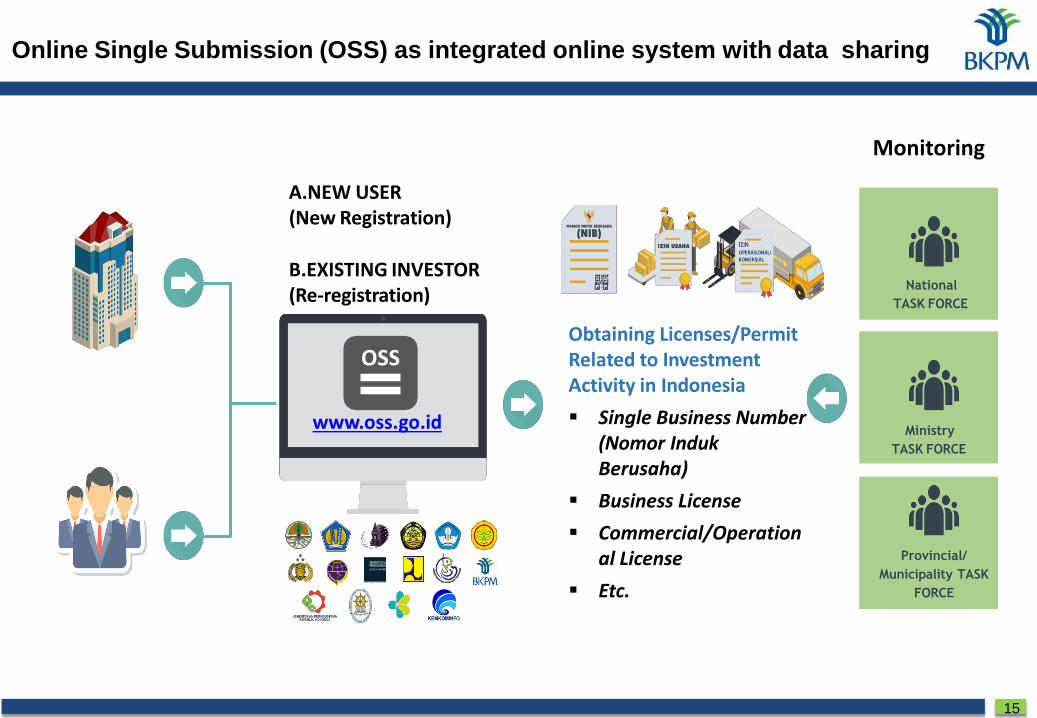
Online Single Submission (OSS) as integrated online system with data sharing
15
OSSObtaining Licenses/Permit Related to Investment Activity in Indonesia
Single Business Number (Nomor Induk Berusaha)
Business License
Commercial/Operational License
Etc.
A.NEW USER (New Registration)
B.EXISTING INVESTOR (Re-registration)
www.oss.go.id
Provincial/
Municipality TASK
FORCE
Ministry
TASK FORCE
National
TASK FORCE
Monitoring

Japan Investment Overview

The Investment Coordinating Board of the Republic of Indonesia
21
Japan Investment Performance (2001-2015)after IJEPA >>><<< before IJEPA

Japan Investment
Contribution to FDI
Japan Investment
Performance Compared to
Total FDI
Japan Investment
Growth (YoY)
after IJEPA >>><<< before IJEPA
15
Ye
ars
(20
01
-20
15
)

IJEPA (2008)
2001 2015
No. RANK OF SECTOR BEFORE IJEPA (2001-2007)
1 Industri Alat Angkutan dan Transportasi Lainnya
2 Industri Logam Dasar, Barang Logam, Mesin dan Elektronik3 Industri Kimia Dasar, Barang Kimia, dan Farmasi4 Industri Karet, Barang dari Karet dan Plastik5 Industri Tekstil
6 Industri Lainnya
7 Perdagangan dan Reparasi8 Jasa Lainnya9 Industri Makanan
10 Konstruksi
No. RANK OF SECTORAFTER IJEPA (2008-2015)
1 Industri Alat Angkutan dan Transportasi Lainnya
2 Industri Logam Dasar, Barang Logam, Mesin dan Elektronik3 Industri Kimia Dasar, Barang Kimia, dan Farmasi4 Perumahan, Kawasan Industri, dan Perkantoran5 Industri Makanan6 Industri Tekstil7 Perdagangan dan Reparasi8 Industri Karet, Barang dari Karet dan Plastik9 Industri Kertas, Barang dari Kertas, dan Percetakan
10 Listrik, Gas dan Air
11 Perumahan, Kawasan Industri dan Perkantoran12 Industri Kertas, Barang dari Kertas, dan Percetakan13 Kehutanan14 Industri Mineral Non Logam15 Hotel dan Restoran16 Industri Kayu17 Transportasi, Gudang dan Telekomunikasi18 Perikanan19 Industri Instrumen Kedokteran, Presisi, Optik, dan Jam
11 Pertambangan12 Jasa Lainnya13 Transportasi, Gudang, dan Telekomunikasi14 Konstruksi
15 Industri Mineral Non Logam16 Industri Lainnya17 Hotel dan Restoran
20 Pertambangan
18 Industri Kayu19 Industri Kulit, Barang dari Kulit dan Sepatu20 Perikanan
Almost no difference in sectors interest before and after IJEPA
Only 4 sectors which are difference (2 sectors in each periods)

3,2 4,2
0,1 0,52,4
6,53,4
0,6
18,3
0,1
45,7
1,7
0,0
5,0
10,0
15,0
20,0
25,0
30,0
35,0
40,0
45,0
50,0
2001-2015
Secondary Sector 2001-2015
Percentage (%)

The Investment Coordinating Board of the Republic of Indonesia
25
Japan Investment to the world2014 – 2018
Investment RealisationBased on Capital Expenditure (USD Million) Excl. financial sectors
Source: fdiMarkets. 2019
Rank Destination Capex %
1 United States 49,949.8 16.5
2 China 26,788.9 8.8
3 Vietnam 23, 563.6 7.8
4 India 17,625.9 5.8
5 Indonesia 17,067.2 5.6
6 Thailand 16,944.9 5.6
7 Malaysia 15,111.2 5.0
8 Myanmar 14,954.3 4.9
9 Mexico 11,906.2 3.9
10 United Kingdom 9,620.2 3.2
Total Top-10 Countries 203,541.2 67.2
Total (110 countries) 303,046.4 100.0%
Rank Company Capex %
1 Mitsui & Co. 29,032.1 9.6
2 Mitsubishi Corporation 27,528.7 9.1
3 Toyota Motor 21,273.0 7.0
4 Marubeni 12,193.8 4.0
5 Sumitomo Group 10,702.4 3.5
6 Nissan 8,814.2 2.9
7 Honda 7,473.8 2.5
8 Aeon Co. Ltd. 6,417.9 2.1
9 Nippon Telegraph & Telephone (NTT) 6,208.9 2.0
10 Shin-Etsu Chemical 4,786.0 1.6
Total Top-10 Companies 134,430.8 44.4
Total (1,084 Companies) 303,046.4 100.0%
Real Estate17%
Coal, Oil and Natural Gas
15%
Automotive OEM12%
Automotive Components
8%
Metals6%
Others42%

The Investment Coordinating Board of the Republic of Indonesia
26
FDI Realisation in Indonesia by CountryJapan ranked 2nd in 2014 – 2018
FDI Realisation in Indonesia by Origin CountryTop-10 Countries Based on Total Capital Expenditure (USD million) 2014 – 2018Excl. oil. gas. and financial sectors
Rank Country 2014 2015 2016 2017 2018 Total
1 Singapore 5.832,1 5.901,2 9.178,7 8.441,6 9.193,2 38.546,8
2 Japan 2.705,1 2.877,0 5.400,9 4.996,2 4.952,8 20.932,0 3 China 800,0 628,3 2.665,3 3.361,2 2.376,6 9.831,4
4 Malaysia 1.776,3 3.077,0 1.115,6 1.213,6 1.774,9 8.957,4
5 Hong Kong, PRC 657,3 937,2 2.248,3 2.116,5 2.011,4 7.970,7
6 South Korea 1.126,6 1.213,5 1.065,8 2.024,6 1.604,7 7.035,2
7 Netherland 1.726,3 1.307,8 1.475,2 1.489,4 943,1 6.941,9
8 USA 1.299,5 893,2 1.161,9 1.992,8 1.217,6 6.565,1
9 British Virgin Islands 624,0 730,5 1.157,3 844,8 1.043,3 4.399,9
10 United Kingdom 1.588,0 503,2 307,3 774,8 271,1 3.444,4
Total (Top 10 Countries) 18.135,3 18.068,8 25.776,3 27.255,6 25.388,7 114.624,7
TOTAL (144 countries) 28.529,7 29.275,9 28.964,1 32.239,8 29.307,9 130.963,9
Source: BKPM, January 2019
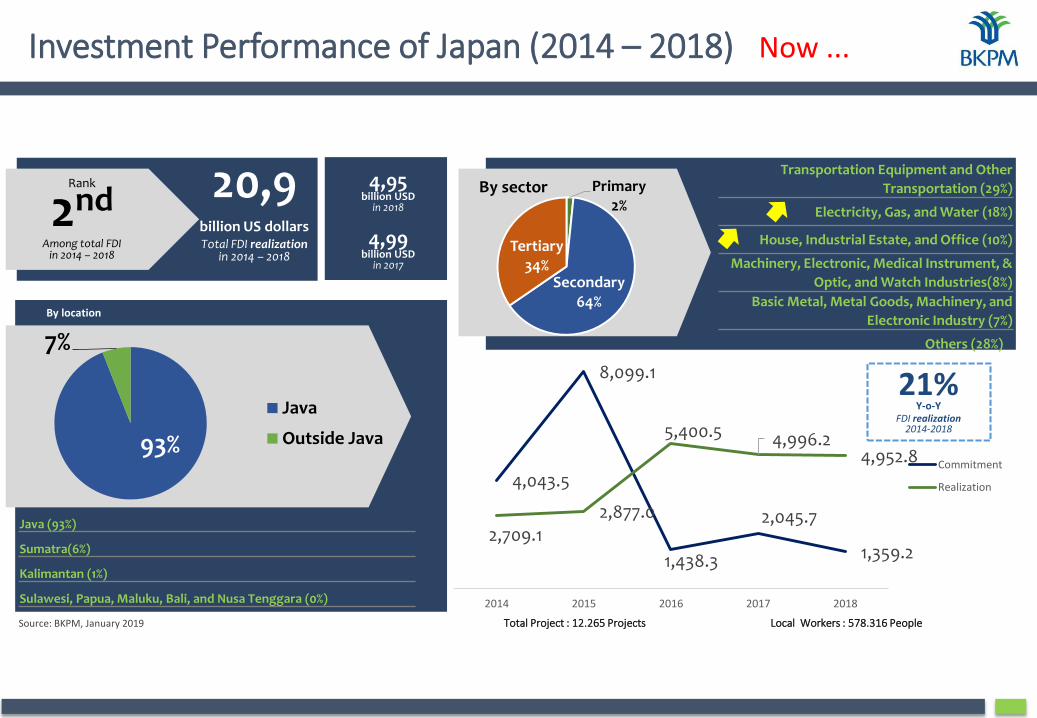
Investment Performance of Japan (2014 – 2018)
Transportation Equipment and Other
Transportation (29%)
Electricity, Gas, and Water (18%)
House, Industrial Estate, and Office (10%)
Machinery, Electronic, Medical Instrument, &
Optic, and Watch Industries(8%)
Basic Metal, Metal Goods, Machinery, and
Electronic Industry (7%)
Others (28%)
20,9billion US dollarsTotal FDI realization
in 2014 – 2018
Rank
2ndAmong total FDI
in 2014 – 2018
By sector
Source: BKPM, January 2019 Total Project : 12.265 Projects Local Workers : 578.316 People
By location
Java (93%)
Sumatra(6%)
Kalimantan (1%)
Sulawesi, Papua, Maluku, Bali, and Nusa Tenggara (0%)
4,95billion USD
in 2018
4,99billion USD
in 2017
93%
7%
Java
Outside Java
21%Y-o-Y
FDI realization2014-2018
Primary2%
Secondary64%
Tertiary34%
4,043.5
8,099.1
1,438.3
2,045.7
1,359.2 2,709.1
2,877.0
5,400.5 4,996.2 4,952.8
2014 2015 2016 2017 2018
Commitment
Realization
Now ...

The Investment Coordinating Board of the Republic of Indonesia
28
Investment Realisation from Japan(2014–2018)
by SectorsExcl. Upstream oil, gas, and financial sectors
Source: BKPM, January 2019
(In Million US$)
Rank Business Field 2014 2015 2016 2017 2018 Total
1Transportation Equipment & Other Transportation Mode Industry
1.260,8 1.180,7 1.876,4 1.007,4 812,0 6.137,2
2 Electricity, Gas and Water 13,7 134,4 604,2 1.175,2 1.865,5 3.793,03 House, Industrial Estate and Office 71,2 519,9 330,1 470,5 607,3 1.998,9
4Machine, Electronic, Medical Instrument, Elect. Equipment, Optic, and Watch Industry
354,8 250,2 403,8 306,6 245,0 1.560,5
5Basic Metal, Metal Goods, Non-Machinery and Its Equipment Industry
158,0 176,1 436,2 507,0 281,6 1.558,9
6Basic Chemical, Chemical and Pharmaceutical Industry
126,3 72,8 733,5 129,5 199,3 1.261,4
7 Food Industry 137,6 88,1 206,5 67,4 87,8 587,38 Mining 49,9 117,6 94,5 244,1 62,9 569,09 Paper Industry 88,7 65,7 27,9 288,8 49,1 520,110 Non-Metal Mineral Industry 8,1 6,1 118,9 210,1 174,7 517,9
Other sectors 436,2 265,5 568,9 589,5 567,7 2.427,8Total (24 sectors) 2.705,1 2.877,0 5.400,9 4.996,2 4.952,8 20.932,0
Primary2%
Secondary64%
Tertiary34%

The Investment Coordinating Board of the Republic of Indonesia
29
Rank Company Business Fields Capex (USD Mn) %
1 Bhimasena Power Indonesia Power Plant and Transmission 1.827,9 8,7
2 Bhumi Jati Power Power Plant 1.582,8 7,6
3 Suzuki Indomobil Motor Spare Parts and Automotive Accessories 878,6 4,2
4 Asahimas Chemical Basic Inorganic Chemical Industry 651,4 3,1
5 Medco Geopower Sarulla Power Plant 575,9 2,8
6 Astra Honda MotorMotorbikes and Motorcycle Components
Industry539,7 2,6
7 Krakatau Nippon Steel Sumikin Steel Rolling Industry 503,3 2,4
8Mitsubishi Motors Krama YudhaIndonesia
Spareparts and Motorcycle Components Industry
442,2 2,1
9 Aeon Mall Indonesia Wholesaler 372,6 1,8
10 Asahimas Flat Glass Tbk. Flat Glass Industry 327,7 1,6
Total Top-10 Companies 7.702,0 36.8
Total (2,352 Companies) 20.932,0 100.0%
Top 10 Japanese Investors in Indonesia (2014 - 2018)Excl. Upstream oil, gas, and financial sectors
Source: BKPM, January 2019
The Japanese Investment both before and after the entry into forced of the IJEPA Agreement is FOCUSED ON SECONDARY SECTORS, especially Automotive Industry
IJEPA Agreement is not only to guarantee the certainty of investing in Indonesia, but also to be POSITIONED JAPANESE TO MAINTAIN ITS DOMINATION IN Certain Sectors in Indonesia
Electricity, Gas And Water as well as Property sectors became THE NEW PRIMA DONNA for Japanese investors in the recent 4 years in Indonesia
the New Scheme of Tax Holiday and other Investment facilities are expected to make Japanese Investors are MORE AGGRESSIVE TO INVEST IN MANY SECTORSin Indonesia
CONCLUSIONS

Indonesia Investment Coordinating Board
Badan Koordinasi Penanaman Modal (BKPM)
THANK YOULET’S INVEST IN INDONESIA
Jl. Jenderal Gatot Subroto No. 44Jakarta 12190 - Indonesia
Tel: (+6221) 525 2008 Fax : (+6221) 525 4945Contact Center : 0807 100 2576E-mail : [email protected]
follow us on
BKPMINDONESIA bkpm
THEBKPMVIDEO bkpm_id
Indonesia InvestmentCoordinating Board
www.investindonesia.go.id


![Industry 4.0: An Overvie · The Industry 4.0 topic emerges from the overlapping of several technological developments involving products and processes [14]. Since the German government](https://static.fdocuments.net/doc/165x107/5ece57c2a59d69109e45e0da/industry-40-an-the-industry-40-topic-emerges-from-the-overlapping-of-several.jpg)


