- …is.documentation.s3.amazonaws.com/Archive/User Guides/insight... · Version: 2.8 Last Updated:...
429
www.InsightSoftware.com Version: 2.8 Last Updated: September 21, 2011 for JD Edwards World and EnterpriseOne EnterEnterpriseOne for JD Edwards World and EnterpriseOne EnterEnterpriseOne
Transcript of - …is.documentation.s3.amazonaws.com/Archive/User Guides/insight... · Version: 2.8 Last Updated:...

www.InsightSoftware.com
Version: 2.8 Last Updated: September 21, 2011
for JD Edwards World and EnterpriseOne EnterEnterpriseOne
for JD Edwards World and EnterpriseOne EnterEnterpriseOne

InsightSoftware.com User Guide www.InsightSoftware.com
Page 2 of 429
Contents
1. Introduction ................................................................................... 5
Welcome ............................................................................................................................................. 5 Using this Guide ................................................................................................................................ 6 Meeting different users’ needs ........................................................................................................ 7 Who should use this guide?............................................................................................................. 7 What skills are required to use this software? ............................................................................... 7
2. Inquiry Interface ............................................................................ 8
Interface .............................................................................................................................................. 8 Modules .............................................................................................................................................. 9 Inquiry Templates ............................................................................................................................ 10 Filters ................................................................................................................................................ 12 Inquiry Result Set ............................................................................................................................ 13 Query by Example ........................................................................................................................... 13 Ribbon and Menus .......................................................................................................................... 14
3. Getting Started ............................................................................ 25
Starting the Application .................................................................................................................. 25 Logging on to the Application........................................................................................................ 26 Application Defaults ........................................................................................................................ 29
4. Making Selections ....................................................................... 30
Overview ........................................................................................................................................... 30 Filter Types ...................................................................................................................................... 33 Working with Edit Filters ................................................................................................................ 37 Working with Group Filters ............................................................................................................ 55 Working with Column Filters .......................................................................................................... 58 Attributes .......................................................................................................................................... 59 Activating Filters ............................................................................................................................. 59 Summary of Filter Selection Features ........................................................................................... 60 Filter Selections ............................................................................................................................... 61 Bringing it All Together ................................................................................................................... 62
5. Running Inquiries ........................................................................ 63
The Result Set .................................................................................................................................. 63 Pivot Inquiry ..................................................................................................................................... 65 User Defined Captions .................................................................................................................... 68 Columns, Sorting & Grouping ........................................................................................................ 73 Formatting ........................................................................................................................................ 92 Descriptions ................................................................................................................................... 124 Setting Titles .................................................................................................................................. 126 Option Switches ............................................................................................................................ 131 Result Set Pop-up Menu ............................................................................................................... 132
6. Aggregation ............................................................................... 133
Subtotaling ..................................................................................................................................... 137 Multiple Aggregations ................................................................................................................... 138 Showing the Detail ........................................................................................................................ 141 Transactional Aggregations ......................................................................................................... 142
7. Managing Inquiries .................................................................... 143
Saving Inquiries ............................................................................................................................. 144
InsightSoftware.com User Guide www.InsightSoftware.com
Page 3 of 429
Opening Inquiries .......................................................................................................................... 145 Open and Save - Folder Management ......................................................................................... 146 Import and Export .RDF files ........................................................................................................ 149 Closing Inquiries ........................................................................................................................... 153 Permissions ................................................................................................................................... 154 Favorites ......................................................................................................................................... 159 Manage Folders ............................................................................................................................. 162
8. Linked inquiries ......................................................................... 168
Follow Links ................................................................................................................................... 174 Advanced: Special Links Functionality ....................................................................................... 176
9. Console Report Design ............................................................. 190
Overview ......................................................................................................................................... 190 Console Preview Mode ................................................................................................................. 191 Console Filter Layout .................................................................................................................... 193 Console Drill Link .......................................................................................................................... 207
10. Export Functionality ............................................................... 208
Export to Excel/PDF ...................................................................................................................... 208 Generic Export Messages............................................................................................................. 209 Excel Options ................................................................................................................................. 211 Print Options .................................................................................................................................. 219
11. Graphing & Charting .............................................................. 232
Creating a Chart ............................................................................................................................. 232 Display ............................................................................................................................................ 232 Controlling the Chart ..................................................................................................................... 234
12. Using Calculations ................................................................. 242
Using Pre-defined Calculations ................................................................................................... 242 Creating New Calculations ........................................................................................................... 243 Default Calculations ...................................................................................................................... 244 Cross Dimensional Calculations ................................................................................................. 248 Conditional Calculations .............................................................................................................. 251 Null Default Calculations .............................................................................................................. 259 Consolidate Conditions Logic...................................................................................................... 259 Copying Calculations .................................................................................................................... 263 Calculations Based on Other Calculations ................................................................................. 264 Removing Calculations ................................................................................................................. 265 Custom Columns ........................................................................................................................... 266
13. Aging Categories .................................................................... 274
As Of Functionality ........................................................................................................................ 277 As Of: Advanced ............................................................................................................................ 280
14. Time Series ............................................................................. 284
Time Series Construction ............................................................................................................. 284 User Defined Captions for Time Series ....................................................................................... 299 Creating a Combo Box for Time Series ....................................................................................... 300
15. Hierarchies .............................................................................. 301
Creating a New Hierarchy ............................................................................................................. 302 Using Grid Hierarchies .................................................................................................................. 310 The Hierarchy Filter ....................................................................................................................... 312 Editing and Removing Hierarchies .............................................................................................. 320

InsightSoftware.com User Guide www.InsightSoftware.com
Page 4 of 429
Importing Hierarchies ................................................................................................................... 326 Grid/Filter Hierarchies ................................................................................................................... 334 Multi Dimension Hierarchies ........................................................................................................ 338 Advanced Single Node Functionality (Ranges and Commas) .................................................. 349 Hierarchies: Row Based Calculations ......................................................................................... 353 Calculation Precedence ................................................................................................................ 369
16. Selectors ................................................................................. 370
Configuration ................................................................................................................................. 370 Defining a New Selector ................................................................................................................ 371 Using Selectors in Filters ............................................................................................................. 379 Using Selectors in Pivoted Columns ........................................................................................... 380 Using Selectors for Security ........................................................................................................ 382 Selectors as Reusable Inquiry Objects ....................................................................................... 384 Selector RIO Subscription Options ............................................................................................. 385 Advanced Selector Logic.............................................................................................................. 389
17. Reusable Inquiry Objects ....................................................... 392
Opening Reusable Inquiry Objects .............................................................................................. 393 Subscribing .................................................................................................................................... 394 RIO Precedence ............................................................................................................................. 394
18. Currency Restatement............................................................ 395
Working with Restatement Period Values .................................................................................. 395 Analyzing the Underlying Exchange Rates ................................................................................ 397 Changing the Restatement Currency .......................................................................................... 398 Restatement Resulting From Two Exchange Rates .................................................................. 399
19. Business Unit Snapshot ......................................................... 401
Inquiry Options - Business Unit Snapshot Settings .................................................................. 402
20. User Defined Filters ................................................................ 403
Activate User Defined Filter Functionality .................................................................................. 403 Set up User Defined Filters........................................................................................................... 404 Filter Considerations When Adding a User Defined Filter ........................................................ 408 Console Considerations: Dependency on Visible Controls ..................................................... 409
21. Inquiry Options ....................................................................... 410
General Tab: Presentation Options ............................................................................................. 411 General Tab: Console Options ..................................................................................................... 412 General Tab: Localization Options .............................................................................................. 413 Advanced Tab ................................................................................................................................ 414
22. User Preferences .................................................................... 418
23. Localization ............................................................................. 424
Localization Rules ......................................................................................................................... 424 Localization: Inquiry Options ....................................................................................................... 425 Localization: User Preferences .................................................................................................... 427 Localization: Advanced ................................................................................................................ 428
24. Further Information ................................................................ 429
Contacts ......................................................................................................................................... 429 Technical Support ......................................................................................................................... 429 Notices and Disclaimer ................................................................................................................. 429

InsightSoftware.com User Guide www.InsightSoftware.com
Page 5 of 429
Welcome Welcome to The Insight
® user guide. Insight
® provides true real time access to JD
Edwards™ World and EnterpriseOne™ systems, delivering enhanced inquiry, aggregation and reporting capabilities with unparalleled performance. Version Winter 2011 comprises of the following licensed modules, all of which are documented in this guide:
Accounts Payable
Accounts Receivable
Advanced Cost Accounting
Budgeting & Forecasting
Configurator
Console
Contract & Service Billing
Customer Relationship Manager
Currency Restatement
Fixed Assets
General Ledger
Homebuilder
Human Resources
Inventory
Job Cost
Manufacturing
Manufacturing Resource Planning
Master File
Payroll
Purchase Order Processing
Reconciler
Sales Order Processing
Tax
Timesheet

InsightSoftware.com User Guide www.InsightSoftware.com
Page 6 of 429
All of the modules offer the following benefits:
A familiar EnterpriseOne™ look and feel. A common interface which works with World, EnterpriseOne™ and
Coexistence systems. They operate directly over the JD Edwards™ files, without duplicating the
data to deliver a Real Time solution. Full drill down to transactions. Data aggregation across all aspects of JD Edwards™ financial data. Leveraging of all key category codes, such as Business Unit, Object, Sub
Ledger, Fixed Asset, Address Book, Customer and Supplier category codes. Inquiries can be loaded, saved, published, printed and exported to Microsoft
Excel at the touch of a button. Roll bars are provided, instead of having to page down the inquiry result set. Sophisticated grouping and sub-totaling of data. Inquiries can be stylized and formatted, including the use of captions and
positioning techniques. Multiple selections on any data item, including Period, Year and Ledger Type. Pre-defined and user-defined Real Time calculations. True, real time exception reporting. Both summary and transaction inquiries with multiple selection capability.
Hierarchy builder, providing management information using user-defined or pre-defined hierarchies and row based calculations.
Using this Guide In order to get the most out of this guide we have used the following symbol to denote areas of special interest, supporting information on a topic and highlighting other important points:
NB IMPORTANT INFORMATION
InsightSoftware.com User Guide www.InsightSoftware.com
Page 7 of 429
Meeting different users’ needs Version Winter 2011 has been designed to cater for a wide range of users‟ needs. There are three main user types available, each providing a specific set of features and functions designed to meet the needs of distinct user audiences.
Console
This interface is designed for end users who want to gain real time access to previously published reports. They have a controlled interface to drill down through the data and can make certain report selections as dictated by the Power User. No knowledge of JD Edwards™ is required.
Power User
Power Users have the ability to create ad hoc inquiries and reports. All features related to the report build process are available to the Power User, together with the ability to publish completed reports to Console users. Power Users usually have some prior knowledge of JD Edwards™.
Configurator/Super User
These are users who require increasingly advanced levels of feature functionality in order to solve ever more sophisticated inquiry and reporting problems. Configurators/Super Users have the ability to completely control the user interface and the templates made available to Power Users. Configurators/Super Users are normally highly experienced JD Edwards™‟ users.
NB THE CONFIGURATOR LICENSE IS AVAILABLE IN INSIGHT®
VERSIONS 8.1.4 AND LATER
Who should use this guide? This user guide is designed to be a definitive reference for Insight
®. Novice and
experienced users alike will find this manual to be a useful guide to understanding all of the feature functionality for all the modules within Insight
®.
What skills are required to use this software? Users should be familiar with the graphical user interface of any one of the following Microsoft operating systems: Windows™ 98, NT, 2000 or XP. Although it is not essential, a basic understanding of JD Edwards™ accounting terminology will also be beneficial.

InsightSoftware.com User Guide www.InsightSoftware.com
Page 8 of 429
Interface Insight
® adopts the most recent Windows Style interface, using a Ribbon Toolbar
which is organized in tabs by common functionality. Figure 2-1 illustrates the main inquiry interface:
Figure 2-1: Interface

InsightSoftware.com User Guide www.InsightSoftware.com
Page 9 of 429
Modules Insight
® currently contains twenty three licensed applications that can be applied via
the Administration Application. These licensed applications are General Ledger, Advanced Cost Accounting, Accounts Payable, Accounts Receivable, Contract & Service Billing, Customer Relationship Planning, Fixed Assets, Homebuilder, Human Resources, Inventory, Job Cost, Manufacturing, Master Data, Material Resource Planning, Payroll, Purchase Order Processing, Sales Order Processing, Tax, Timesheet, Budgeting, Console, Currency Restatement, Configurator, Super User, Reconciler and Designer Express. Most of these applications operate as modules within a single interface and share common functionality. The exceptions are Budgeting, Console and Reconciler, Currency Restatement, Configurator and Super User. Console and Reconciler operate as standalone independent applications. The Configurator and Super User functionality applies across all modules, access to which is discussed in the Configurator/Super User Guide. For easy reference, each module is color coded.
On the main inquiry screen, each module is arranged on its own tab near the top of the screen (Figure 2-2). By „clicking‟ on the relevant tab, you can move from one module to the next.
Figure 2-2: Module Tabs

InsightSoftware.com User Guide www.InsightSoftware.com
Page 10 of 429
Inquiry Templates Within a particular module, users can create different types of inquiries using Inquiry Templates. For example, from within the General Ledger module you can create inquiries using one of the following templates:
Balances template, based on the period summary balances held within the F0902 file.
Weekly Balances template, based on the weekly summary balances held within the F0902B file.
Transactions and Document (Linking Only) inquiry template, based on the transaction data held within the F0911 file.
In addition to these standard pre-built templates, Configurators/Super Users have the ability to create and publish new custom templates to Power Users. The Configurator/Super User may also revoke one or more of the standard templates described above. Please check with your Systems Administrator to confirm which Inquiry Templates have been made available for use.
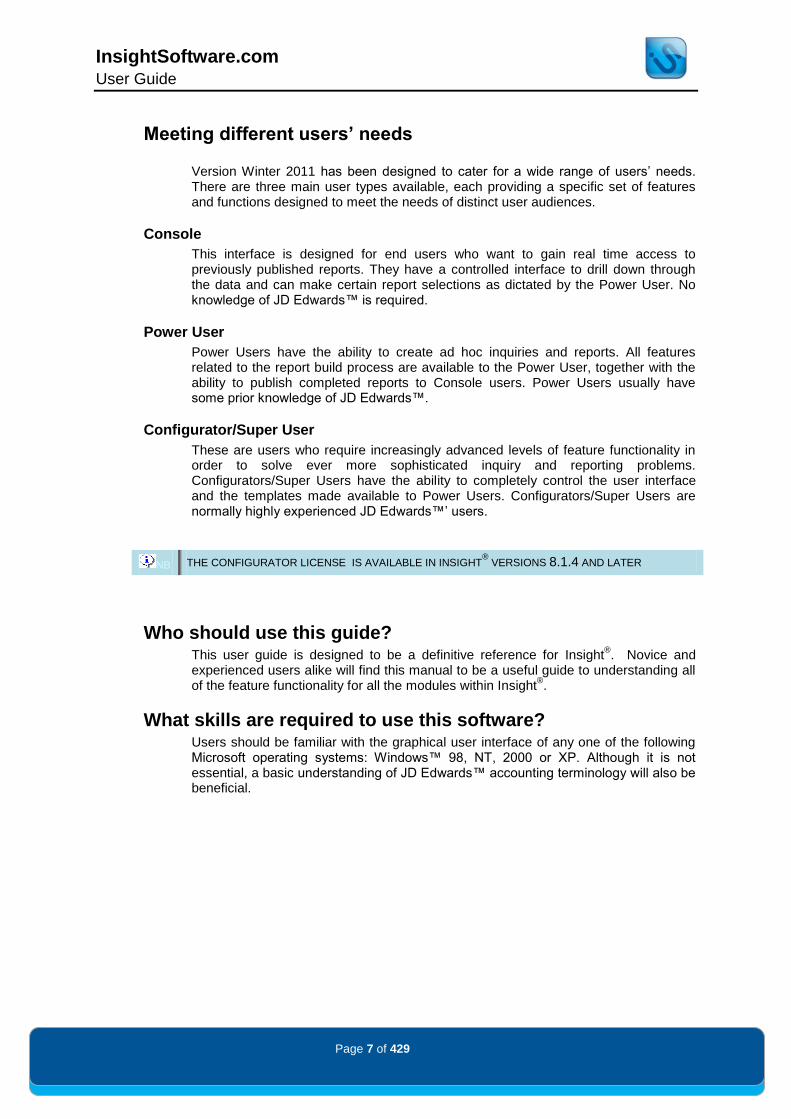
Each template is shown as a Worksheet within its associated module. You can navigate between worksheets by „clicking‟ on the appropriate worksheet tab. Each tab has an associated icon to denote the type of inquiry template, which is shown in Table 2-1 below:
General Ledger
Balances
Weekly Balances
Transactions
Document (Linking Only)
Advanced Cost Accounting
Balances
Cost Assignments
Document (Linking Only)
GL Transactions
Accounts Payable
As of Invoices
As Of Invoices and
Payments
Integrated Invoices and
Payments
Invoices
GL Transactions
Payments
Accounts Receivable
As Of Integrated
Invoices and Receipts
As Of Invoices
Integrated Invoices and
Receipts
Invoices
Receipts
GL Transactions
Contract & Service Billing
Contract Detail
Integrated Service Billing
Invoice Summary
Milestone Progress
GL Transactions
Fixed Assets
Balances
Documents
Transactions

InsightSoftware.com User Guide www.InsightSoftware.com
Page 11 of 429
Home builder
Lot Master
Sales Detail
Sales Summary
Human Resources
Employee
Benefits
Employee
Detail
Employee
History
Job
Information
Inventory
As of
Balances
GL
Transactions
Inventory
Cycle
Count
Item
Balance
Summary
Item
Balances
Item Ledger
Transactions
Job Cost
Balances
HB Option Analysis
Weekly Balances
Transactions
Documents
Manufacturing
PD BOM
WO Parts List
PDM Cost
Component
WO Routing
PDM
Routing
WO Cost
Variance
WO Header
WO Labor
Details
Master File
Account
Master
Account Master
Job Cost
Address
Book Master
Business Unit
Master
Company
Master
Contract Header Master
Contract Header Master
Fixed Asset
Master
Item
Master
Lease
Master
Purchase
Order Header
Sales Order
Header
Work Order
Master
Payroll
Burden
Distribution
Canadian
Pension
Canadian
ROE
Canadian
Tax History
DBA by
Period
Employee
Pay
Transactions
Integrated
Detail
Paycheck
DBA History
Paycheck
History
Paycheck
Stub History
Paycheck
Tax History
Payroll Fiscal
History
Payroll
History
Pre-Payroll
DBA Ledger
Taxes by
Period
Wage
Ledger
InsightSoftware.com User Guide www.InsightSoftware.com
Page 12 of 429
Purchase Order Processing
Non-Stock Purchase
Orders
Stock Purchase
Orders
Received Not Vouchered
Goods Received
Status
GL Transactions
Sales Order Processing
Sales
Commission
Sales
Detail
Sales
Ledger
Transportatio
n
GL
Transactions
Tax
Summary
Taxes
Detail
Taxes
Timesheet
Current
Detail
Current
Summary
Current GL Transactions
History GL
Transactions
History
Summary
History
Detail
Table 2-1: Inquiry Templates
When there are multiple worksheets opened within a module, it will look like Figure 2-3 below.
Figure 2-3: Multiple Worksheets within a Module
An inquiry template is divided into two distinct sections – filters and the inquiry result set.
Filters Filters allow you to select items of data upon which you wish to inquire. For example, an Object Account filter allows you to select particular object accounts so that they can be viewed. Each Inquiry Template has different filters. Figure 2-4 illustrates the filters for the Balances Template in the General Ledger module:
Figure 2-4: Inquiry Filters
InsightSoftware.com User Guide www.InsightSoftware.com
Page 13 of 429
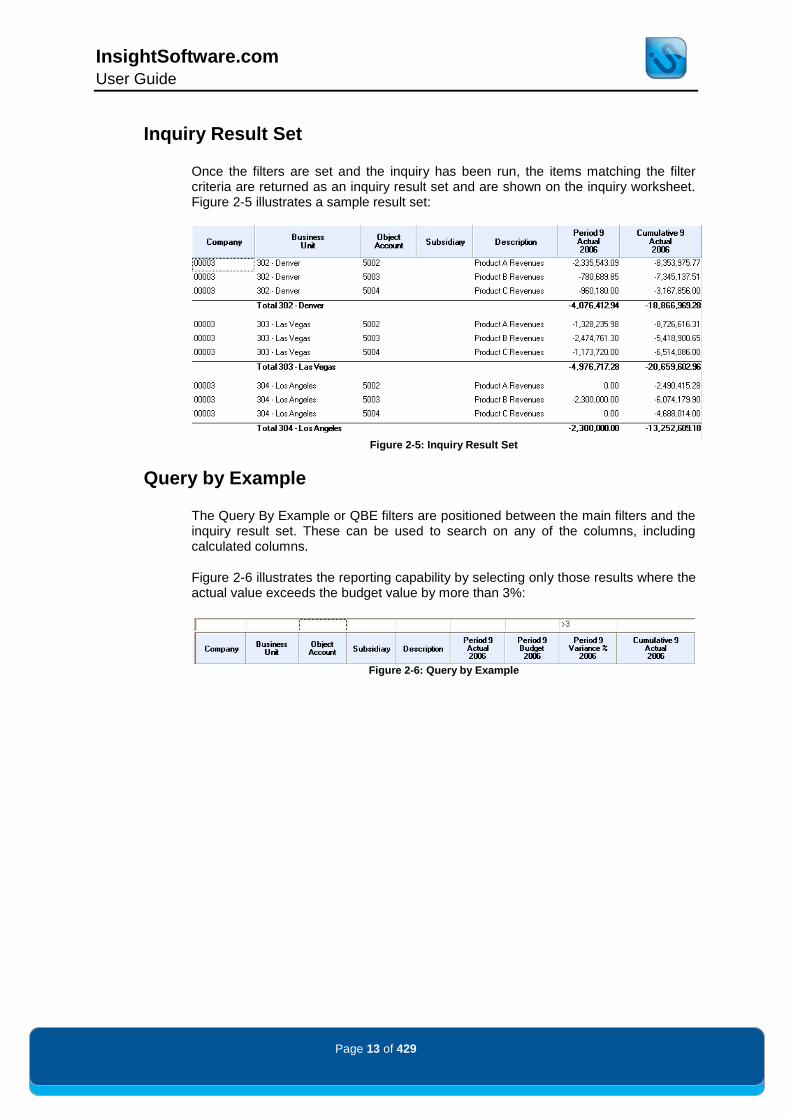
Inquiry Result Set Once the filters are set and the inquiry has been run, the items matching the filter criteria are returned as an inquiry result set and are shown on the inquiry worksheet. Figure 2-5 illustrates a sample result set:
Figure 2-5: Inquiry Result Set
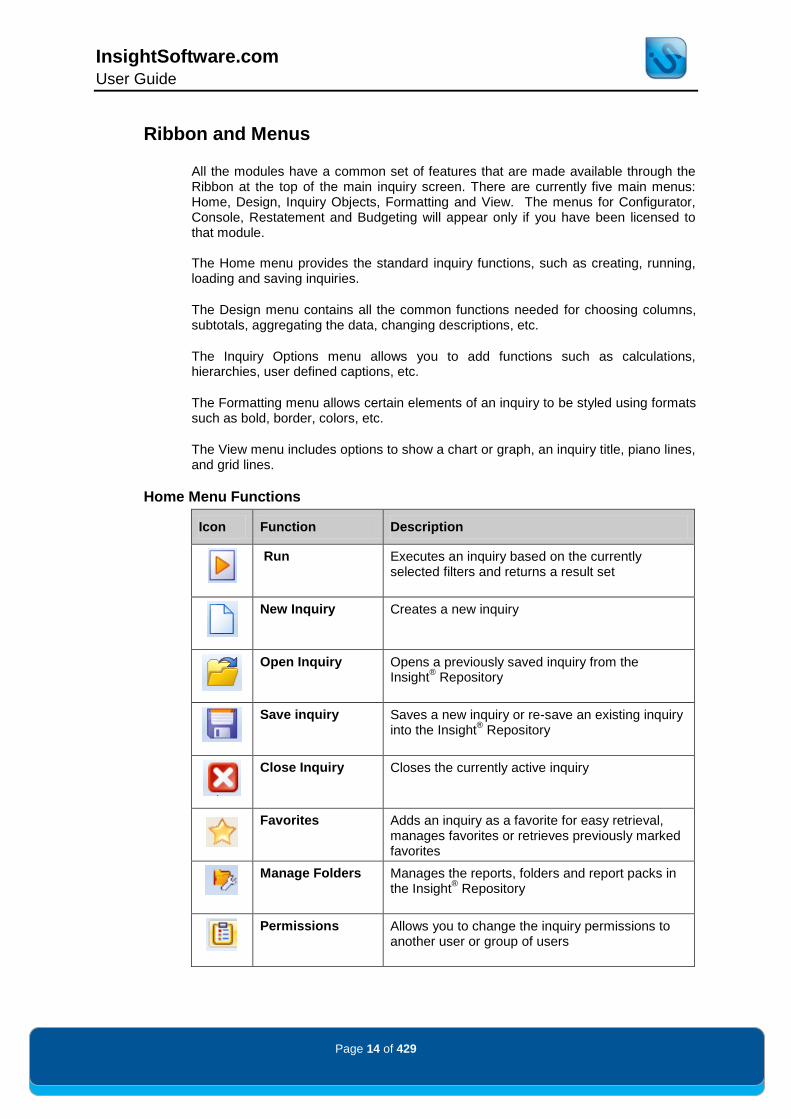
Query by Example The Query By Example or QBE filters are positioned between the main filters and the inquiry result set. These can be used to search on any of the columns, including calculated columns.
Figure 2-6 illustrates the reporting capability by selecting only those results where the actual value exceeds the budget value by more than 3%:
Figure 2-6: Query by Example
InsightSoftware.com User Guide www.InsightSoftware.com
Page 14 of 429
Ribbon and Menus All the modules have a common set of features that are made available through the Ribbon at the top of the main inquiry screen. There are currently five main menus: Home, Design, Inquiry Objects, Formatting and View. The menus for Configurator, Console, Restatement and Budgeting will appear only if you have been licensed to that module. The Home menu provides the standard inquiry functions, such as creating, running, loading and saving inquiries.
The Design menu contains all the common functions needed for choosing columns, subtotals, aggregating the data, changing descriptions, etc.
The Inquiry Options menu allows you to add functions such as calculations, hierarchies, user defined captions, etc.
The Formatting menu allows certain elements of an inquiry to be styled using formats such as bold, border, colors, etc.
The View menu includes options to show a chart or graph, an inquiry title, piano lines, and grid lines.
Home Menu Functions
Icon Function Description
Run Executes an inquiry based on the currently selected filters and returns a result set
New Inquiry Creates a new inquiry
Open Inquiry Opens a previously saved inquiry from the Insight
® Repository
Save inquiry Saves a new inquiry or re-save an existing inquiry into the Insight
® Repository
Close Inquiry Closes the currently active inquiry
Favorites Adds an inquiry as a favorite for easy retrieval, manages favorites or retrieves previously marked favorites
Manage Folders Manages the reports, folders and report packs in the Insight
® Repository
Permissions Allows you to change the inquiry permissions to another user or group of users

InsightSoftware.com User Guide www.InsightSoftware.com
Page 15 of 429
Print Outputs single or multiple result sets in a PDF format for subsequent printing
Excel Exports single or multiple workbooks to Excel
Print Options Sets the page layout attributes that are subsequently used in the PDF
Excel Options Sets the Workbook Attributes that are subsequently used in the Export to Excel
Inquiry Options Sets General (presentation and Console) and Advanced options for the inquiry. This includes missing and blank text and Console loading behavior.
Table 2-2: Home Menu Functions
Design Menu Functions
Icon Function Description
Columns, Sorting & Grouping
Defines specific aggregations and the sorting of the inquiry. Can also set Headers and Totals
Pivot Inquiry Specifies which items appear in the rows or columns of the inquiry result set
Remove Column Removes a column from the inquiry
Hide Column Hides a column from the inquiry
Set Column Heading
Sets a heading for a column in the inquiry
Grand Totals Toggles whether the grand total line is included in the inquiry result set
Totals Toggles whether subtotal lines are included in the inquiry result set
Headers Toggles whether headers are included in the inquiry result set
Zero Balances Toggles whether items with zero balances are included in the inquiry result set

InsightSoftware.com User Guide www.InsightSoftware.com
Page 16 of 429
Sort by Values Toggles sorting and ranking options for the inquiry
Missing Balances Toggles whether missing balances are included in the inquiry result set. (Works only in accordance with the F0901 Account Master.)
Descriptions Includes the descriptions for columns within the inquiry result set. Using the drop down, you can toggle between showing Description, Code or both.
Set Title Sets a main title for the inquiry
Filter Selections View and specify selections for any filter regardless of whether the filter is available on the screen or not
Link Inquiries Defines links between inquiries, creating a relationship between the source and target inquiry
Table 2-3: Design Menu Functions
Inquiry Objects Menu Functions
Icon Function Description
Calculations The calculations function. Existing calculations can be selected for inclusion or new calculations can be defined
Aging Categories The Aging Categories function. Allows you to categorize transactions in specific date ranges.
Time Series The Time Series function. Allows you to define a fixed time span. You can then move a point within the span to see the data changing
Hierarchies Creates hierarchies for aggregating data and producing management information
Selectors The Selectors functionality. Allows you to choose a selector value. You can access the Selectors Setup via the drop down menu next to Selectors, where you can create, edit and remove a selector.
User Defined Captions
The User Defined Captions functionality. Allows you to define custom captions for fields and items throughout your inquiry.
Reusable Inquiry Objects
The Reusable Inquiry Objects (RIO) functionality. Allows you to add Reusable Inquiry Objects to the inquiry. Super Users/Configurators can also move Reusable Inquiry Objects from the current inquiry to the Global or Connection RIO
Table 2-4: Inquiry Objects Menu Functions

InsightSoftware.com User Guide www.InsightSoftware.com
Page 17 of 429
Formatting Menu Functions
Icon Function Description
Default Defines the default formatting styles
Headers Defines the formatting styles for headers
Totals Defines the formatting styles for all totals
Columns Defines the formatting styles for columns
Conditional Defines conditional formatting styles
Priority Sets the priority for all formatting styles
Hierarchies Defines the formatting styles for hierarchy items and/or levels
Bold Toggles whether bold formatting displays on the selected column
Italic Toggles whether italic formatting displays on the selected column
Underline Toggles whether underline formatting displays on the selected column
Left Align Left aligns the column values (available only for data columns)
Center Align Center aligns the column values (available only for data columns)
Right Align Right aligns the column values (available only for data columns)
Border Sets the border style of the selected column
Fill Color Sets the background (fill) color of the selected column
Font Color Sets the font color of the selected column

InsightSoftware.com User Guide www.InsightSoftware.com
Page 18 of 429
Percentage Toggles the percentage symbol formatting on the selected column (available only for data columns)
Increase Decimals
Increases the number of decimal places for the values in the selected column (available only for data columns)
Decrease Decimals
Decreases the number of decimal places for the values in the selected column (available only for data columns)
Remove Formatting
Removes any formatting styles applied to the selected column
Table 2-5: Formatting Menu Functions
View Menu functions
Icon Function Description
Show Chart Toggles whether chart, data or both display in the inquiry
Chart Options Allows you to edit the content and layout of charts
Swap Chart Axes Toggle between showing columns or rows being represented by either the X axis or Y axis (or „series‟)
Vertical Bar Displays chart as a vertical bar chart
Horizontal Bar Displays chart as a horizontal bar chart
Pie Displays chart as a pie chart
Signs Unchanged Displays all values in the chart as they are signed in the data
All Positive Displays all values as positive values in the chart
Reverse Signs Reverses the sign of all values in the chart
Title Toggles whether the main title is displayed in the inquiry
Piano Lines Toggles whether piano lines are included in the inquiry result set

InsightSoftware.com User Guide www.InsightSoftware.com
Page 19 of 429
Grid Lines Toggles whether grid lines are included in the inquiry result set
Table 2-6: View Menu Functions
NB THE APPEARANCE OF THE FOLLOWING MENUS/ICONS IS DEPENDENT ON THE MODULE BEING
ENABLED.
Configurator Menu Functions
Icon Function Description
Filter Layout Opens the Filter Layout dialog, allowing customization of the filters
Reusable Inquiry Objects
Allows you to move Reusable Inquiry Objects from the current inquiry to the Global or Connection RIO
Save As Template Allows you to save the current inquiry as a template
De/Activate Fields Allows you to activate or de-activate any of the filters or columns in any of the tables available within the module being used
Alternate Joins Allows you to configure how tables are joined in the current inquiry
Table 2-7: Configurator Menu Functions
Console Menu Functions
Icon Function Description
Console Preview Toggles the Console preview on/off so that Power Users can visualize the layout of reports for Console users
Console Filter Layout
Opens the Filter Layout dialog within the Console, allowing customization of the filters for Console users
Default Drill Link The default drill link selected here determines which link will be used when double clicking on a value within the Console
Table 2-8: Console Menu Functions

InsightSoftware.com User Guide www.InsightSoftware.com
Page 20 of 429
Restatement Menu Functions
Exchange Rate Displays all exchange rates used in the current report, given the current filter settings
Settings Settings for currency restatement
Table 2-9: Restatement Menu Functions
Budgeting Menu Functions
Cycle Status Opens the Budgeting/Forecasting Cycle Status dialog
Activities Opens the Budgeting/Forecasting Management Dialog
Submission Allows you to enter in a Budgeting/Forecasting submission form
Save Saves your submissions within the Budgeting Repository
Save and Continue
Allows you to save the data you have just entered but does not exit data collection mode
Cancel Exits data collection mode without saving any changes or changing the status
Table 2-10: Budgeting Menu Functions
Some selected Ribbon options can also be accessed via the keyboard. These keyboard shortcuts are identified by „pressing‟ the ALT key (as shown in Figure 2-7). To then „activate‟ the ribbon option „press‟ the associated key displayed on the Ribbon.
Figure 2-7: Ribon Keyboard Shortcuts
InsightSoftware.com User Guide www.InsightSoftware.com
Page 21 of 429
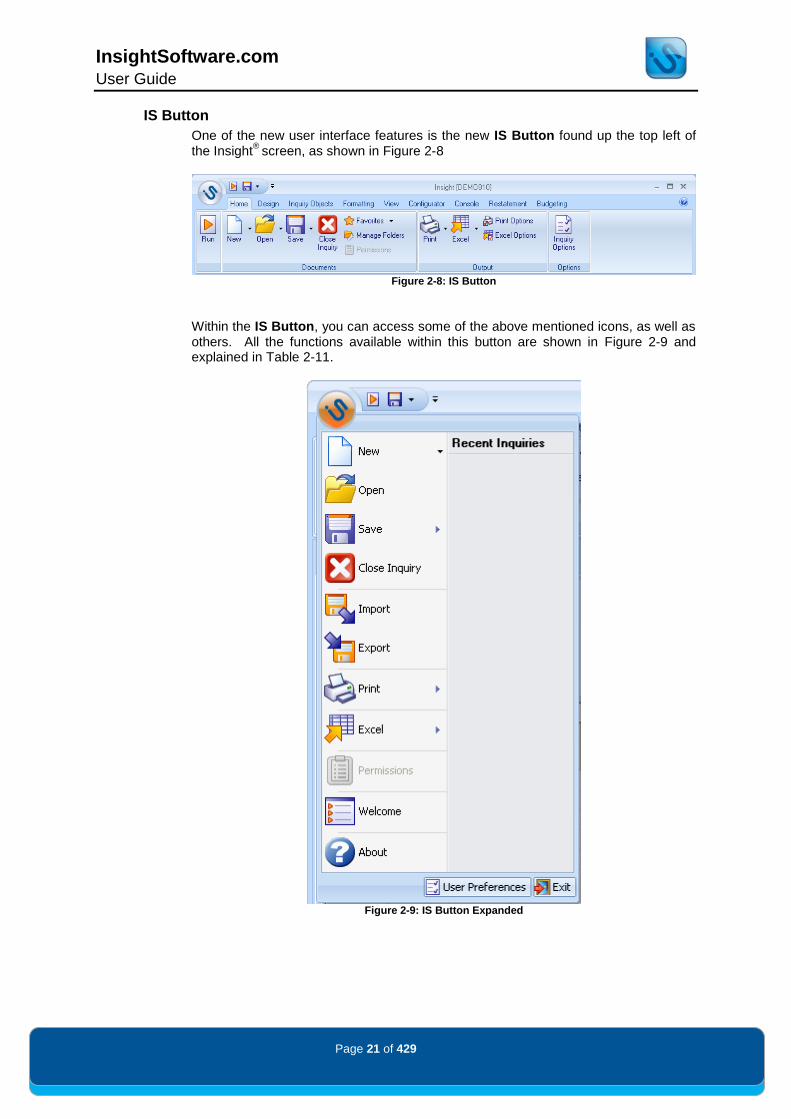
IS Button
One of the new user interface features is the new IS Button found up the top left of the Insight
® screen, as shown in Figure 2-8
Figure 2-8: IS Button
Within the IS Button, you can access some of the above mentioned icons, as well as others. All the functions available within this button are shown in Figure 2-9 and explained in Table 2-11.
Figure 2-9: IS Button Expanded
InsightSoftware.com User Guide www.InsightSoftware.com
Page 22 of 429
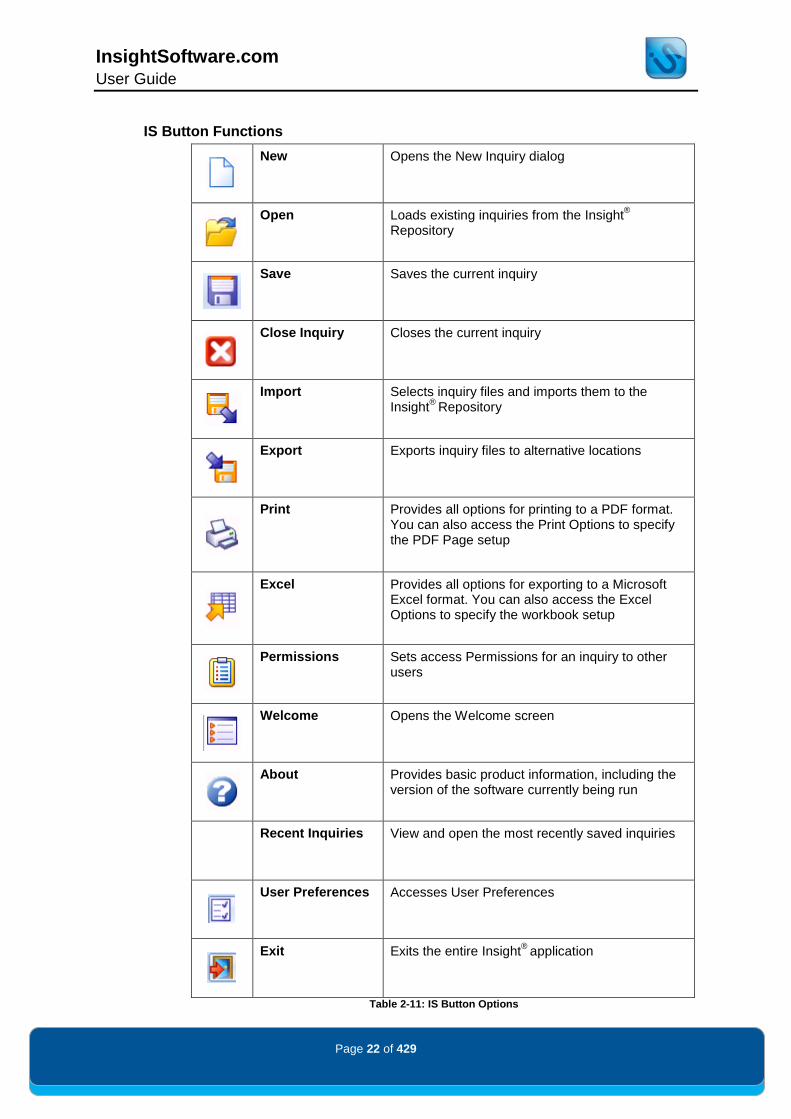
IS Button Functions
New Opens the New Inquiry dialog
Open Loads existing inquiries from the Insight®
Repository
Save Saves the current inquiry
Close Inquiry Closes the current inquiry
Import Selects inquiry files and imports them to the Insight
® Repository
Export Exports inquiry files to alternative locations
Print Provides all options for printing to a PDF format. You can also access the Print Options to specify the PDF Page setup
Excel Provides all options for exporting to a Microsoft Excel format. You can also access the Excel Options to specify the workbook setup
Permissions Sets access Permissions for an inquiry to other users
Welcome Opens the Welcome screen
About Provides basic product information, including the version of the software currently being run
Recent Inquiries View and open the most recently saved inquiries
User Preferences Accesses User Preferences
Exit Exits the entire Insight®
application
Table 2-11: IS Button Options
InsightSoftware.com User Guide www.InsightSoftware.com
Page 23 of 429
Help
The Help Icon, as shown in Figure 2-10, provides access to The InsightSoftware.com Software Documentation Portal. Here you can access user guides for Insight
® users,
Configurators/Super Users, and Administrators of Insight®. You can also view the
What‟s New Guides, which describe the new software features since the last major release.
Figure 2-10: Help Icon
You can also access the About Icon, as shown in Figure 2-11, through the IS Button.
Figure 2-11: About Icon
By „clicking‟ on this icon you will be presented with the following dialog as shown in Figure 2-12. This dialog is very useful as it provides key information: User name, JD Edwards™ Database, Profile, Release Date, License Key and location of the Insight
®
Repository.
Figure 2-12: About Insight
® Dialog

InsightSoftware.com User Guide www.InsightSoftware.com
Page 24 of 429
Quick Access Toolbar
The Quick Access Toolbar allows you to quickly access the operations you access most frequently, such as Run and Save. The Customize Quick Access Toolbar can be customized by clicking on the dropdown menu to the right of the Toolbar, as shown in Figure 2-13.
Figure 2-13: Customize Quick Access Toolbar
From here you can add commands to this Toolbar, such as Print and Export, for a result like Figure 2-14.
Figure 2-14: Customized Quick Access Toolbar

InsightSoftware.com User Guide
Page 25 of 429
Starting the Application There are two ways to start the application. The first method is to „click‟ on the Start button on the Window desktop, move to the All Programs/InsightSoftware.com/Insight path and „click‟ on the Insight menu option. This is shown in Figure 3-1 below:
Figure 3-1: Starting the Application in Windows™
Alternatively, a shortcut to the application may be available directly on the desktop. „Double-clicking‟ on the shortcut icon will start the application.
If the software has been deployed in a Citrix environment, please contact the systems administrator to obtain the necessary access.

InsightSoftware.com User Guide
Page 26 of 429
Logging on to the Application When the application has started, the dialog shown in Figure 3-2 is displayed:
Figure 3-2: Application Login Dialog
First Time Users
When launching the software for the first time, it will need to be configured. Please consult the Administration Guide for further details. Once completed, it is possible to login to the application.
Application Access
Once configured, access the application by entering a valid user name and password. Depending upon the setup, this may either be a standard JD Edwards™ user name or a specific user name, as well as password set up by the application administrator.
When using a standard JD Edwards™ username, the application will pick up Business Unit security from within JD Edwards™ and provide restricted access based on the JD Edwards™ security settings.
Once the username and password has been entered, „click‟ on the Login button to continue. If an invalid user name and password are entered, you will be prompted to re-enter the details. To connect to the system, it is necessary to work with a profile. A profile provides access to a single JD Edwards™ environment. If you only have access to a single profile, the application will continue to login directly to that profile.

InsightSoftware.com User Guide
Page 27 of 429
You may have access to a number of profiles, each providing access to different single environments. In such circumstances, you are presented with a Profile Selection Dialog, as shown in Figure 3-3:
Figure 3-3: Profile Selection Dialog
Select a Profile to work with from the drop down list provided. When a profile has been selected, you have the opportunity to mark the selection as a Default Profile by „checking‟ the Set as Default Profile tick box in the bottom left corner of the dialog.
The system will remember this profile and on subsequent logins, the system will place it in the profile selection box by default. If this box is disabled, this means that the profile selected is already marked as the default profile.
Once selected, „click‟ on the Login button to continue the login process.
InsightSoftware.com User Guide
Page 28 of 429
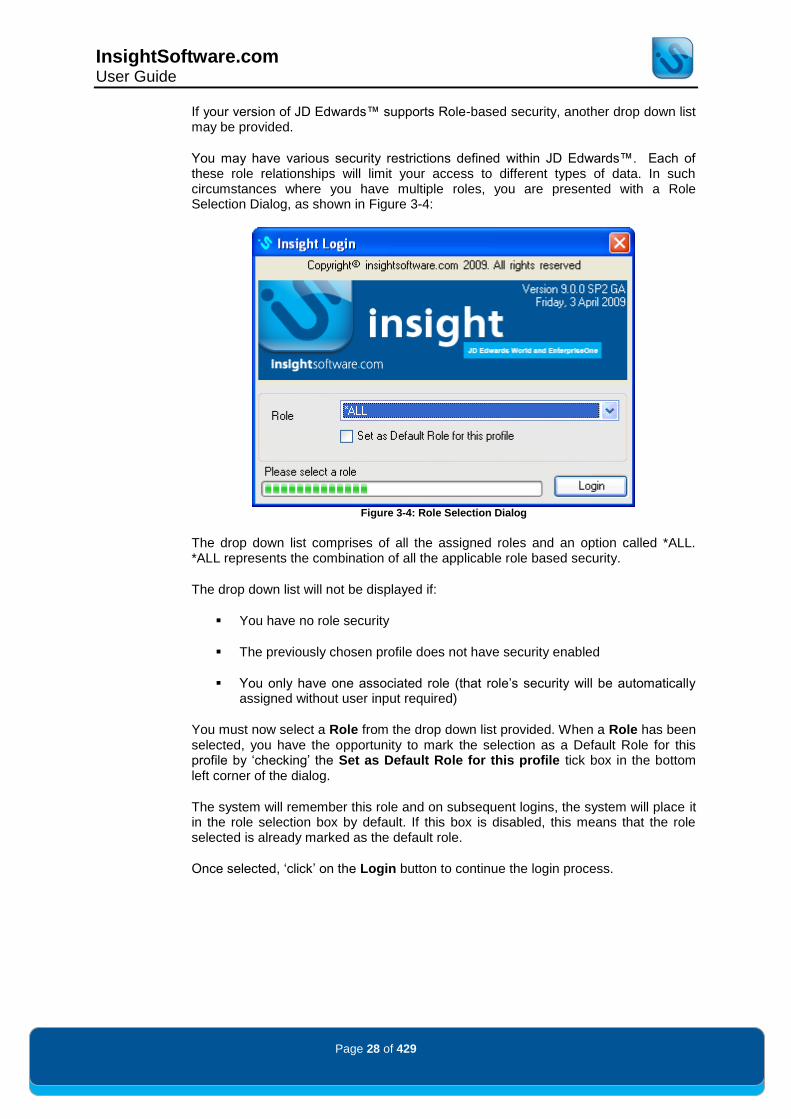
If your version of JD Edwards™ supports Role-based security, another drop down list may be provided.
You may have various security restrictions defined within JD Edwards™. Each of these role relationships will limit your access to different types of data. In such circumstances where you have multiple roles, you are presented with a Role Selection Dialog, as shown in Figure 3-4:
Figure 3-4: Role Selection Dialog
The drop down list comprises of all the assigned roles and an option called *ALL. *ALL represents the combination of all the applicable role based security.
The drop down list will not be displayed if:
You have no role security
The previously chosen profile does not have security enabled
You only have one associated role (that role‟s security will be automatically assigned without user input required)
You must now select a Role from the drop down list provided. When a Role has been selected, you have the opportunity to mark the selection as a Default Role for this profile by „checking‟ the Set as Default Role for this profile tick box in the bottom left corner of the dialog.
The system will remember this role and on subsequent logins, the system will place it in the role selection box by default. If this box is disabled, this means that the role selected is already marked as the default role.
Once selected, „click‟ on the Login button to continue the login process.
InsightSoftware.com User Guide
Page 29 of 429
Application Defaults When the user name and password have been authenticated, the login screen will disappear and you will see the Welcome screen. During this startup process, the application carries out a number of tasks in readiness for using the application. These tasks are:
1. Determining which modules are licensed to the user and enabling them accordingly.
2. Retrieving various JD Edwards™‟ settings, including the current fiscal date period and year, and Business Unit security settings. In addition, the application checks a number of Automatic Accounting Instructions (AAI) to determine the start of the Balance Sheet and Income Statement object accounts.
3. Retrieving user preference settings, such as the filters to be used and the inquiry
views that will be enabled.
4. Retrieving user profile settings, such as the user‟s inquiry favorites.
The application may take a few minutes to fully activate depending on various factors such as the specifications of the client machine, the location of the JD Edwards™ server and the configuration of the profile. While this is occurring, the standard Windows™ hourglass icon will appear. A progress update is available by viewing the messages in the progress bar that appears on screen. When this initialization process has been completed, a welcome message will be shown at the bottom of the main inquiry screen. This is illustrated in Figure 3-5below.
Figure 3-5: Welcome Message in the Status Bar

InsightSoftware.com User Guide
Page 30 of 429
Overview When the program has initialized and you have logged on to the application, you are presented with the Welcome screen shown in Figure 4-1:
Figure 4-1: Welcome Screen
NB
IN RESPONSE TO CUSTOMER FEEDBACK, THE STANDARD TEMPLATES PROVIDED WITH
INSIGHT®
WERE REDESIGNED. IN THE FOLLOWING EXAMPLES, WE ARE USING THE NEW
BALANCES TEMPLATE, WHICH REPLACES THE PERIOD SUMMARY TEMPLATE. IF YOU ARE
UPGRADING, YOU WILL HAVE ACCESS TO BOTH YOUR ORIGINAL AND THE NEW TEMPLATES.

InsightSoftware.com User Guide
Page 31 of 429
„Click‟ on the New button on the left-hand panel to display the dialog shown in Figure 4-2.
Figure 4-2: Creating a New Inquiry
Now select the module you wish to work with and the type of inquiry you want to create. This is done by „clicking‟ on the relevant module tab, highlighting the appropriate inquiry template and then „clicking‟ on the OK button to proceed.
Subsequent new inquiries within the same module can also be created directly from the Home Ribbon Tab without entering the New Inquiry dialog. This is done by „clicking‟ on the down arrow to the right of the New Inquiry icon. This produces a list of inquiry templates that are available within the current module and from which you can make a selection. This is shown in Figure 4-3 below:
Figure 4-3: New Template Toolbar Selections
When an inquiry has been selected, a new inquiry view worksheet is created. It will be given a default name of the inquiry template. For example, if you selected the Balances inquiry template, the default name will be Balances. The name is also prefixed by an icon with a letter to denote the type of inquiry. For example, an inquiry with a red icon and the letter „P‟ would indicate that the inquiry displays period balances. The red indicates it is in the General Ledger module. This can be changed when saving the inquiry.

InsightSoftware.com User Guide
Page 32 of 429
Once a new inquiry has been created, you are presented with the main inquiry screen. Figure 4-4 illustrates the Balances inquiry within the General Ledger module. While there are different inquiry modules containing many different inquiry templates, they all function in a similar way.
Figure 4-4: Balances Inquiry within General Ledger Module
The system is now ready for you to begin making selections. To do this, it is necessary to define the selection criteria which the application will use to extract data from the JD Edwards™ database. These criteria can be defined by making a selection in each of the white boxes in the top half of the screen. These boxes are known as filters.
NOTE
EACH FILTER SELECTION REDUCES THE POSSIBLE VOLUME OF DATA BEING RETURNED IN AN
INQUIRY RESULT SET BY CUTTING IT DOWN TO THE DESIRED SUBSET. IF NO SELECTIONS ARE
MADE, THE ENTIRE DATABASE FOR THE DEFAULT PERIOD, YEAR AND LEDGER TYPE WILL BE
RETURNED.

InsightSoftware.com User Guide
Page 33 of 429
Filter Types Each aspect of data within the JD Edwards™ system has an associated filter. The filters that are presented on an inquiry template vary from template to template and across the various different modules. This guide will not attempt to describe every single filter and column within Insight
®, as there are over 2,200! However, it is
important to explain the different filter types that are available within the system and how to use them.
Standard Edit Filter
The most common type filter is the Standard Edit Filter. This is shown in Figure 4-5:
Figure 4-5: Standard Edit Filter
This type of filter allows you to make selections by typing selections directly into the filter, or by using the associated Visual Assist dialog to make selections.
Date Filters
The Date Filter, shown in Figure 4-6, allows you to select a range of dates using from the From and To filter controls.
Figure 4-6: Date Filter
Date filters are quite different from the standard edit filters. For most templates, when a date filter is shown, a wildcard (*) is displayed in both the From and To fields. This means that all the dates within the system are selected.
To change either the From or To date, „click‟ into one of the date fields. This will have the effect of displaying today‟s date in both fields. This is shown in Figure 4-7.
Figure 4-7: Defaulting to Today’s Date
A button with an asterisk (*) will also appear on the right-hand side of the To date filter. Clicking on this button will remove the dates and the wildcard asterisk is placed back in the From and To date filters.
InsightSoftware.com User Guide
Page 34 of 429
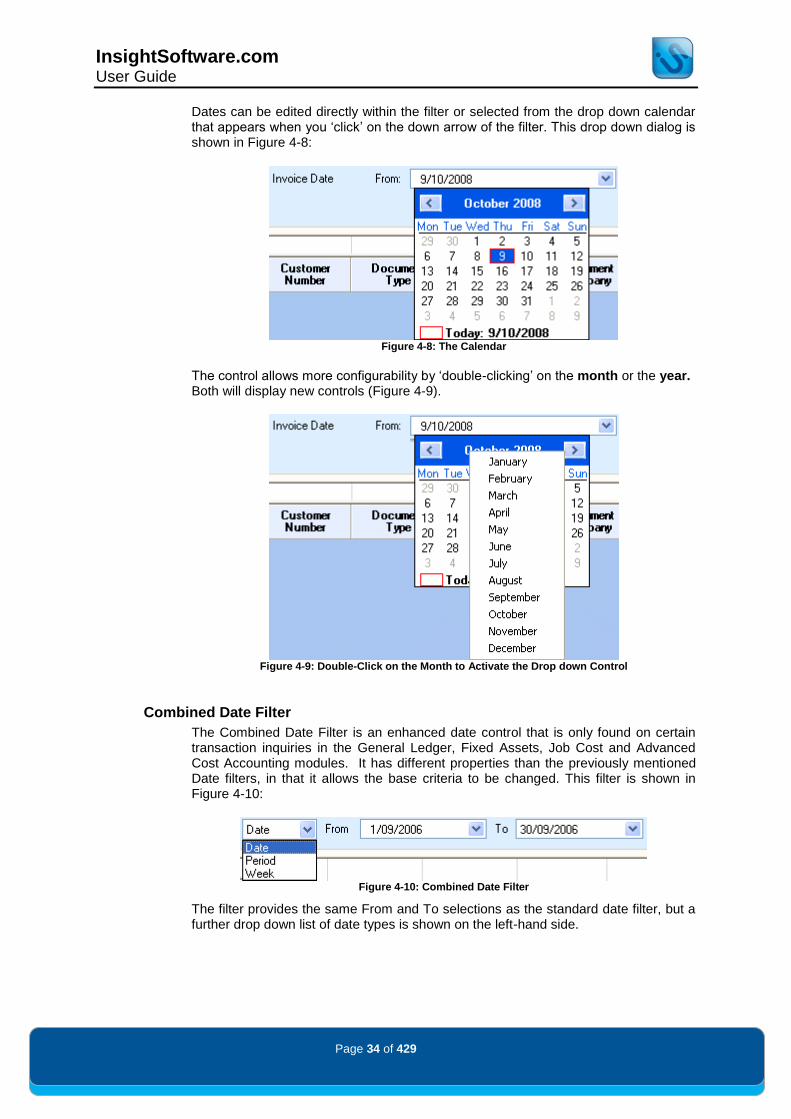
Dates can be edited directly within the filter or selected from the drop down calendar that appears when you „click‟ on the down arrow of the filter. This drop down dialog is shown in Figure 4-8:
Figure 4-8: The Calendar
The control allows more configurability by „double-clicking‟ on the month or the year. Both will display new controls (Figure 4-9).
Figure 4-9: Double-Click on the Month to Activate the Drop down Control
Combined Date Filter
The Combined Date Filter is an enhanced date control that is only found on certain transaction inquiries in the General Ledger, Fixed Assets, Job Cost and Advanced Cost Accounting modules. It has different properties than the previously mentioned Date filters, in that it allows the base criteria to be changed. This filter is shown in Figure 4-10:
Figure 4-10: Combined Date Filter
The filter provides the same From and To selections as the standard date filter, but a further drop down list of date types is shown on the left-hand side.

InsightSoftware.com User Guide
Page 35 of 429
Changing to Period modifies the filter controls to select Period numbers and years, rather than specific dates. This is shown in Figure 4-11:
Figure 4-11: Combined Date Filter using Periods
This filter can also be used to select weeks. The Weekly mode operates in the same manner as the Period mode. This is shown in Figure 4-12.
Figure 4-12: Filter Set to Week Settings
This filter cannot be disabled. This is a safety feature to prevent the inquiry searching across the entire Account Ledger (F0911).
NOTE
THE COMBINED DATE FILTER DEFAULTS TO THE JD EDWARDS™ CURRENT PERIOD (GENERAL
ACCOUNTING CURRENT PERIOD FOR COMPANY 00000).
Date Filters
The term Date Filter is used to describe the numeric date items that appear as columns in the result set. For example, in the Balances inquiry of the General Ledger module, the Period filter contains all the date values, since this is how JD Edwards™ stores the data.
There is only one Date Filter per inquiry screen, and it is presented as a Standard Edit Filter. However, instead of selecting items that describe the result set (labels) i.e. Business Unit – Central Branch, you can select the date values which hold the numerical information, e.g. Period 6. This is shown in Figure 4-13:
Figure 4-13: Date Filter
When working with Accounts Payable, Accounts Receivable, Homebuilder or Tax modules there is no Period time series. Instead the Date Filter is represented as a Values filter. The Values filter presents a disparate set of numerical data values. In Accounts Receivable, examples would include the Gross Amount, Open Amount and Payment Amount.
Group Filters
Group Filters are a special type of Standard Edit Filter and share many common features, such as the option to type directly into the filter and use a Visual Assist. The unique aspect of a Group Filter is its ability to work with multiple sets of related items.
Group Filters are used to group category codes together, for example, or Subledgers across different Subledger types (Figure 4-14):
Figure 4-14: Group Filter
The illustration above shows how you are able to make multiple selections from Business Unit Category Code 1 and combine them with other selections from Business Unit Category Code 2. The use of this type of filter is discussed in more detail later in this chapter.

InsightSoftware.com User Guide
Page 36 of 429
Hierarchy Filters
The Hierarchy Filter allows you to select and apply selection criteria to any hierarchies that have been created. Hierarchies are discussed in more detail in a later chapter. Figure 4-15 provides an example of a Hierarchy Filter:
Figure 4-15: Hierarchy Filter
The filter essentially contains two components – the drop down list on the left-hand side, from which you can select the hierarchy to use, and the edit filter on the right which allows you to select the level of the hierarchy you wish to show.
Column Filters
A Column Filter describes a set of items that do not have a Query Assist. This is the most common type of filter within Insight
®.
Since the item set does not have a Query Assist, it is not shown on the main filter panel, but instead can only be filtered using the Query By Example feature as shown in Figure 4-16.
Figure 4-16: Column Filter
See the Query by Example section for further detail on this feature.

InsightSoftware.com User Guide
Page 37 of 429
Working with Edit Filters There are different types of edit filters – the Standard Edit Filter, the Group Filter, the Date Filter and the Hierarchy Filter. While these filters have their own unique characteristics, they also have common functionality in how they are used to select criteria. There are two ways a filter can be used to define selection criteria in an inquiry - manual entry or assist selection using Visual Assists.
Manual Entry
The manual entry process involves typing the desired selection directly into the filter using the following process:
1. „Click‟ within the filter 2. Type in the value. 3. Using the left mouse button, „click‟ out of the filter (or alternatively press Tab
on the keyboard), which validates the value that has been entered.
Leaving a filter selection set to an asterisk (*) forces the application to return all selections for that filter.
If the value is not a valid selection, it will be highlighted with a red background to show that an error has been made. In these circumstances, „click‟ back into the filter and modify the selection. „Clicking‟ out of the filter will re-validate the selection. Figure 4-17 and Figure 4-18 illustrate a valid and invalid selection based on the Object Account filter:
Figure 4-17: A Valid Object Account Selection
Figure 4-18: An Invalid Object Account Selection
Each filter is primed to accept different values and syntaxes, depending upon the dimension being selected. For example, whereas the Ledger Type filter will accept a combination of numbers, letters and symbols, the Year filter will only accept numeric values.
Multiple selections can be made using the same technique as long as values are separated by a comma (,) character. Figure 4-19 illustrates how Object Accounts 5010 and 5020 have been selected for inclusion in the inquiry result set:
Figure 4-19: Multiple Object Account Selections
When multiple values are entered into a particular filter, the background color of the filter is changed to green. This is for visual purposes only and does not change the functionality of the application.

InsightSoftware.com User Guide
Page 38 of 429
When making multiple selections, the application validates each selection to ensure that it is acceptable. If any of the selections are invalid, the whole filter is shown in red. This means that one, more than one, or all of the selections are invalid. This can be determined by moving the mouse cursor over the filter. When this is done, a help message will appear to explain which of the entries are invalid. This is shown in Figure 4-20:
Figure 4-20: An Invalid Selection Based on Multiple Selections
NB THE APPLICATION VALIDATES MANUAL FILTER ENTRIES BASED ON THE MODEL BUSINESS
UNIT(S) DEFINED DURING THE APPLICATION CONFIGURATION PROCESS. THEREFORE IT IS
POSSIBLE THAT THE USER MAY ENTER WHAT THEY CONSIDER TO BE A VALID ENTRY, ONLY FOR
IT TO BE REJECTED AS BEING INVALID. IN SUCH CASES IT IS HIGHLY PROBABLE THAT THE
ENTRY HAS NOT BEEN INCLUDED WITHIN THE MODEL BUSINESS UNIT. THIS SCENARIO CAN BE
AVOIDED THROUGH THE USE OF QUERY ASSISTS OR ACCOUNT RANGES. BOTH OF THESE
TOPICS ARE COVERED FURTHER ON IN THIS CHAPTER.
Attempting to run an inquiry based on invalid selection criteria will cause the system to display an error message such as the one shown in Figure 4-21. The message will identify the selections that need changing:
Figure 4-21: An Invalid Selection Message

InsightSoftware.com User Guide
Page 39 of 429
Visual Assist Selection
An alternative method to making manual filter selections is to use the Query Assist selection screens. Query Assists are there to make defining filter selections easier. They are available for each filter within the application.
To activate the Assist, „click‟ on a filter and a flashlight icon will appear to the right-hand side of the filter. „Clicking‟ on the icon will present the Assist for that particular filter. Figure 4-22 shows the Assist search screen for the Object Account filter:
Figure 4-22: Assist for the Object Account Filter
The text at the top of the Query Assist details the filter currently being worked with. The Query Assist dialog is split vertically into two halves. The left panel displays a list of available selections. The right panel displays the list of current selections.

InsightSoftware.com User Guide
Page 40 of 429
Query Assist Toolbar
At the top of the Assist screen, a toolbar provides a range of useful functions, as shown in Table 4-1:
Icon Function Description
Find
Locates and displays all items matching the current search criteria, ready for selection.
Clear Clears the list of current and available selections.
Export to Excel
Outputs the results of the Query Assist dialog to Microsoft Excel™.
Outputs the results of the Query Assist dialog to PDF format.
Sequence
Sequence and group the list of available selections.
Show Tree Displays all available items in a tree layout.
Split
Organizes individual items such as category codes and periods available for selection onto separate tabs. (This feature is only available on the data and group filters)
Table 4-1: Visual Assist Toolbar Controls
InsightSoftware.com User Guide
Page 41 of 429
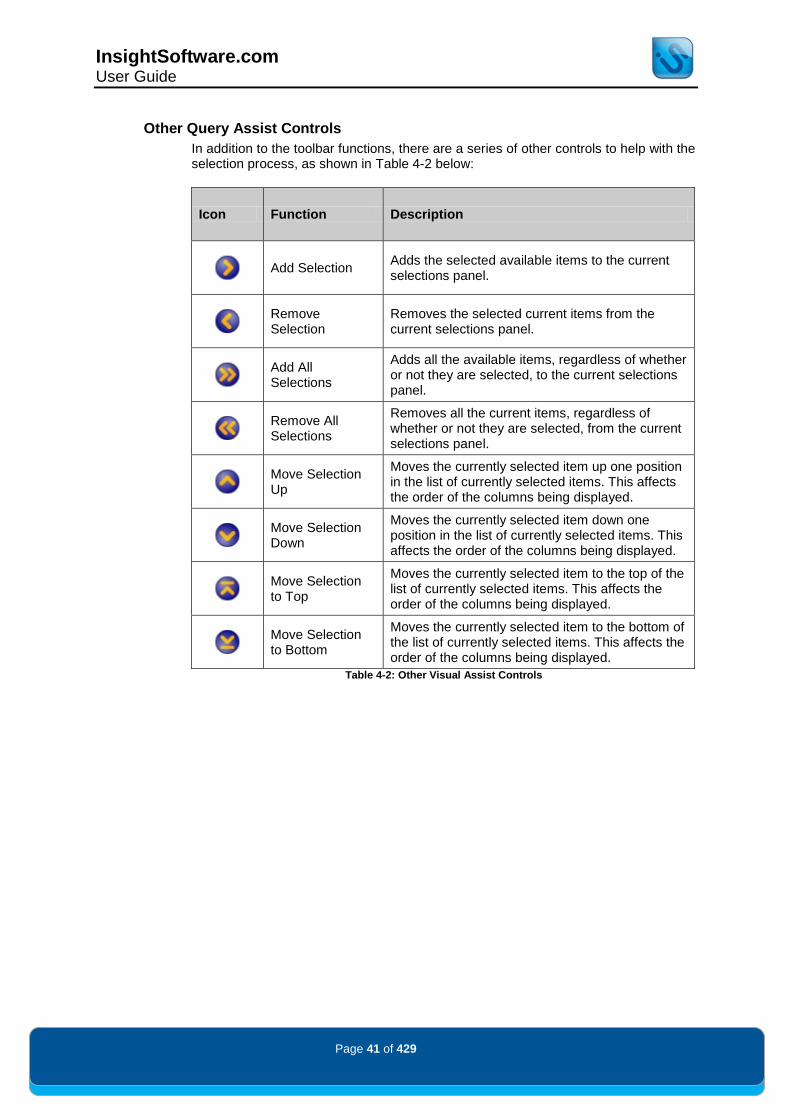
Other Query Assist Controls
In addition to the toolbar functions, there are a series of other controls to help with the selection process, as shown in Table 4-2 below:
Icon Function Description
Add Selection
Adds the selected available items to the current selections panel.
Remove Selection
Removes the selected current items from the current selections panel.
Add All Selections
Adds all the available items, regardless of whether or not they are selected, to the current selections panel.
Remove All Selections
Removes all the current items, regardless of whether or not they are selected, from the current selections panel.
Move Selection Up
Moves the currently selected item up one position in the list of currently selected items. This affects the order of the columns being displayed.
Move Selection Down
Moves the currently selected item down one position in the list of currently selected items. This affects the order of the columns being displayed.
Move Selection to Top
Moves the currently selected item to the top of the list of currently selected items. This affects the order of the columns being displayed.
Move Selection to Bottom
Moves the currently selected item to the bottom of the list of currently selected items. This affects the order of the columns being displayed.
Table 4-2: Other Visual Assist Controls
InsightSoftware.com User Guide
Page 42 of 429
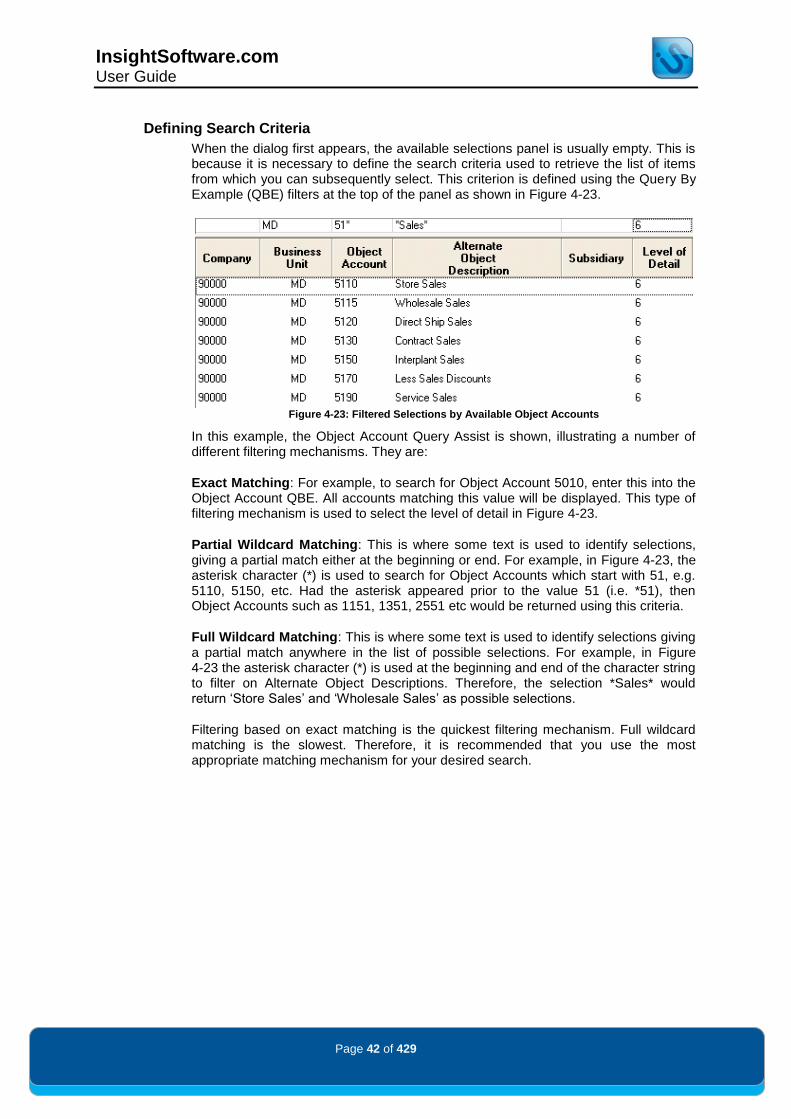
Defining Search Criteria
When the dialog first appears, the available selections panel is usually empty. This is because it is necessary to define the search criteria used to retrieve the list of items from which you can subsequently select. This criterion is defined using the Query By Example (QBE) filters at the top of the panel as shown in Figure 4-23.
Figure 4-23: Filtered Selections by Available Object Accounts
In this example, the Object Account Query Assist is shown, illustrating a number of different filtering mechanisms. They are:
Exact Matching: For example, to search for Object Account 5010, enter this into the Object Account QBE. All accounts matching this value will be displayed. This type of filtering mechanism is used to select the level of detail in Figure 4-23.
Partial Wildcard Matching: This is where some text is used to identify selections, giving a partial match either at the beginning or end. For example, in Figure 4-23, the asterisk character (*) is used to search for Object Accounts which start with 51, e.g. 5110, 5150, etc. Had the asterisk appeared prior to the value 51 (i.e. *51), then Object Accounts such as 1151, 1351, 2551 etc would be returned using this criteria.
Full Wildcard Matching: This is where some text is used to identify selections giving a partial match anywhere in the list of possible selections. For example, in Figure 4-23 the asterisk character (*) is used at the beginning and end of the character string to filter on Alternate Object Descriptions. Therefore, the selection *Sales* would return „Store Sales‟ and „Wholesale Sales‟ as possible selections.
Filtering based on exact matching is the quickest filtering mechanism. Full wildcard matching is the slowest. Therefore, it is recommended that you use the most appropriate matching mechanism for your desired search.

InsightSoftware.com User Guide
Page 43 of 429
As with the example in Figure 4-23, filters can be combined together and a combination of different filtering mechanisms can be used. It is also possible to enter multiple filter criteria within a single QBE filter. For example, to search for items with either „Banks‟ or „Sales‟ in the object account description, the QBE would be as shown in Figure 4-24:
Figure 4-24: Multiple Filter Criteria within the Object Account Description QBE
To enter a filter, „double click‟ in the white space above the relevant column and type in the search criteria. When all of the appropriate QBE filter criteria have been defined, press the Find icon on the toolbar. This will search for all items that match the criteria. Any results returned are shown within the available selections panel. The number of items returned is shown on the status bar at the bottom of the dialog.
If no QBE filter criteria are defined and you press the Find button, all of the available items will be returned unfiltered. Depending upon the filter in question, a warning message may appear on any unfiltered selections. This is shown below.
These messages can be switched off by „clicking‟ the Don’t show again checkbox on the warning message as shown in Figure 4-25.
Figure 4-25: Filter Warning Message
These warning messages appear on filters with potentially large result sets. However, they can be turned on and off in the Warnings dialog. The Warnings dialog is covered further on in this guide.
NB WHEN WORKING WITH THE OBJECT ACCOUNT AND SUBSIDIARY FILTERS, THE MODEL BUSINESS
UNIT (SET DURING THE CONFIGURATION PROCESS) IS USED IN THE QBE BUSINESS UNIT
COLUMN. THIS CAN BE CHANGED BY „DOUBLE-CLICKING‟ IN THE RELEVANT QBE FILTER AND
TYPING NEW SEARCH CRITERIA.
Each Query Assist has its own unique column filters and will display different columns of information from which selections can be made. It is therefore essential that the correct filter is selected before „clicking‟ on the assist icon.

InsightSoftware.com User Guide
Page 44 of 429
Making Selections
Once the list of available selections has been created, you must choose the items to be included in the filter, which will form the basis for the inquiry.
Single Selections
To make just one selection from the list of available items, highlight the item to include by „clicking‟ using the left mouse button and either „double-clicking‟ „clicking‟ on the Add Selection arrow button to include the item in the list of current selections.
Figure 4-26 illustrates the addition of the Object Account 5010 - Store Sales in the current list of selections:
Figure 4-26: Single Selection on Object Account

InsightSoftware.com User Guide
Page 45 of 429
Multiple Selections
To select a range of items, „click‟ on the first item in the range and hold down the SHIFT key and then select the last item required. Alternatively, „click‟ and hold the button down while moving the mouse down the list. Release the button when all of the required items are selected. This is shown in Figure 4-27.
Figure 4-27: Multiple Selections over a Continuous Range
InsightSoftware.com User Guide
Page 46 of 429
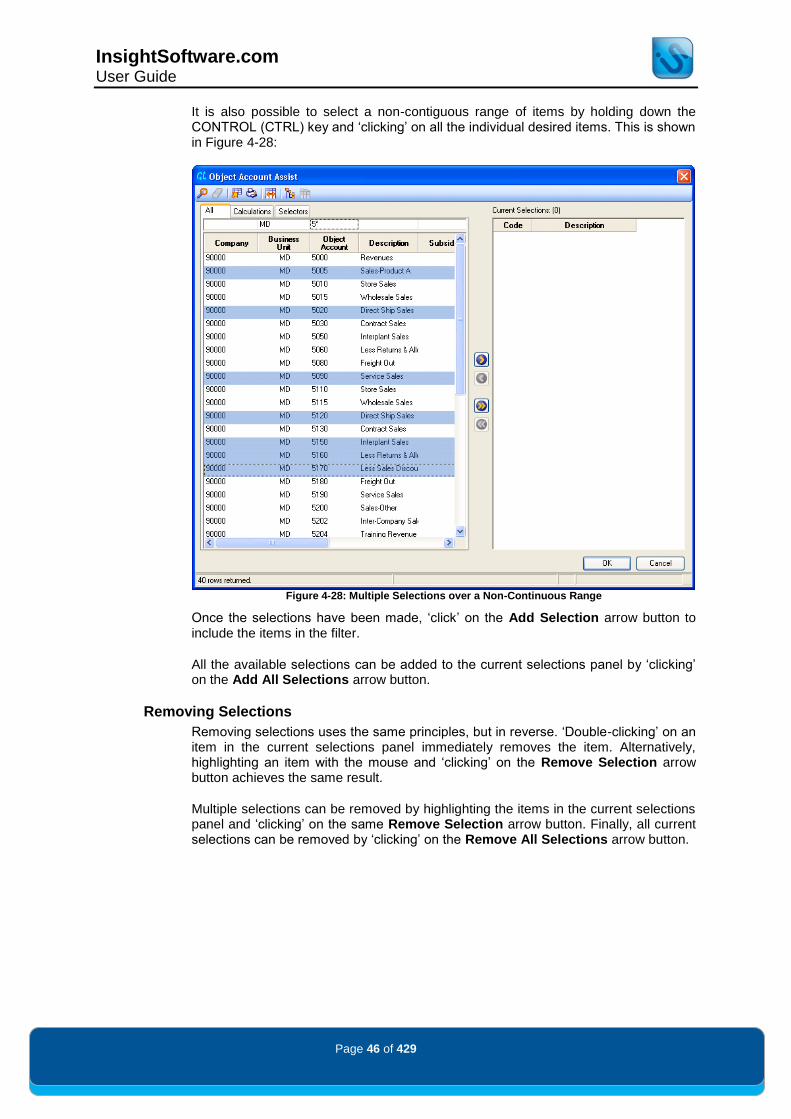
It is also possible to select a non-contiguous range of items by holding down the CONTROL (CTRL) key and „clicking‟ on all the individual desired items. This is shown in Figure 4-28:
Figure 4-28: Multiple Selections over a Non-Continuous Range
Once the selections have been made, „click‟ on the Add Selection arrow button to include the items in the filter.
All the available selections can be added to the current selections panel by „clicking‟ on the Add All Selections arrow button.
Removing Selections
Removing selections uses the same principles, but in reverse. „Double-clicking‟ on an item in the current selections panel immediately removes the item. Alternatively, highlighting an item with the mouse and „clicking‟ on the Remove Selection arrow button achieves the same result.
Multiple selections can be removed by highlighting the items in the current selections panel and „clicking‟ on the same Remove Selection arrow button. Finally, all current selections can be removed by „clicking‟ on the Remove All Selections arrow button.

InsightSoftware.com User Guide
Page 47 of 429
Moving Selections
Selections organized into columns within the inquiry result set can also be ordered within the assist dialog using the move buttons. By default, these move buttons are available within the Period, Year and Ledger Type Query Assists. In addition, this functionality is extended to other filters that have been set as columns using the Pivot Inquiry dialog.
For those filters that meet these criteria, the order of the items within the current selections panel becomes significant. The topmost item appears first in the inquiry result set, followed by the second item, and so forth.
This order can be changed by using the move buttons at the bottom of the assist dialog. To move a selection, firstly highlight it by selecting it and „clicking‟ on the Move Selection Up button or the Move Selection Down button to move the highlighted selection up or down one place at a time. The other two buttons move the highlighted selection directly to the top or bottom of the list. Figure 4-29 shows the after effect of moving items within the current selections:
Figure 4-29: Moving Selections
Confirming Selections
When all of the required selections have been made and put in the correct order, they can be set in the filter by „clicking‟ on the OK button. To avoid making new selections, the Cancel button can be clicked at any time.

InsightSoftware.com User Guide
Page 48 of 429
Other Assist Functions
The other assist functions available are:
Clear
The Clear button clears down both the current list of selections shown on the right panel and the available selections on the left panel. The clear function also removes the QBE filter settings and restores them back to their defaults.
Export to Excel
The Export to Excel option exports the list of available selections to Microsoft Excel™.
Print to PDF
The Print to PDF option outputs the list of available selections to a PDF file.
Sequence
Sequence orders the list of available selections by sorting based on a single column or a range of columns. „Clicking‟ on the Sequence icon on the toolbar produces a dialog, as shown in Figure 4-30:
Figure 4-30: Modified Sequence Order for the Object Account Assist Dialog

InsightSoftware.com User Guide
Page 49 of 429
Show Tree
The Show Tree function allows a user to view Query Assist data in a hierarchical structure. This is often useful when there are several tabs associated with the data, such as with group or data filters. By default, when searching within a group filter such as a category code, you have to switch between different tabs as shown in Figure 4-31.
Figure 4-31: Standard Business Unit Category Code Query Assist
By enabling the Show Tree function, the data is displayed in a hierarchical structure (Figure 4-32).
Figure 4-32: Show Tree Enabled on Business Unit Category Code Query Assist
InsightSoftware.com User Guide
Page 50 of 429
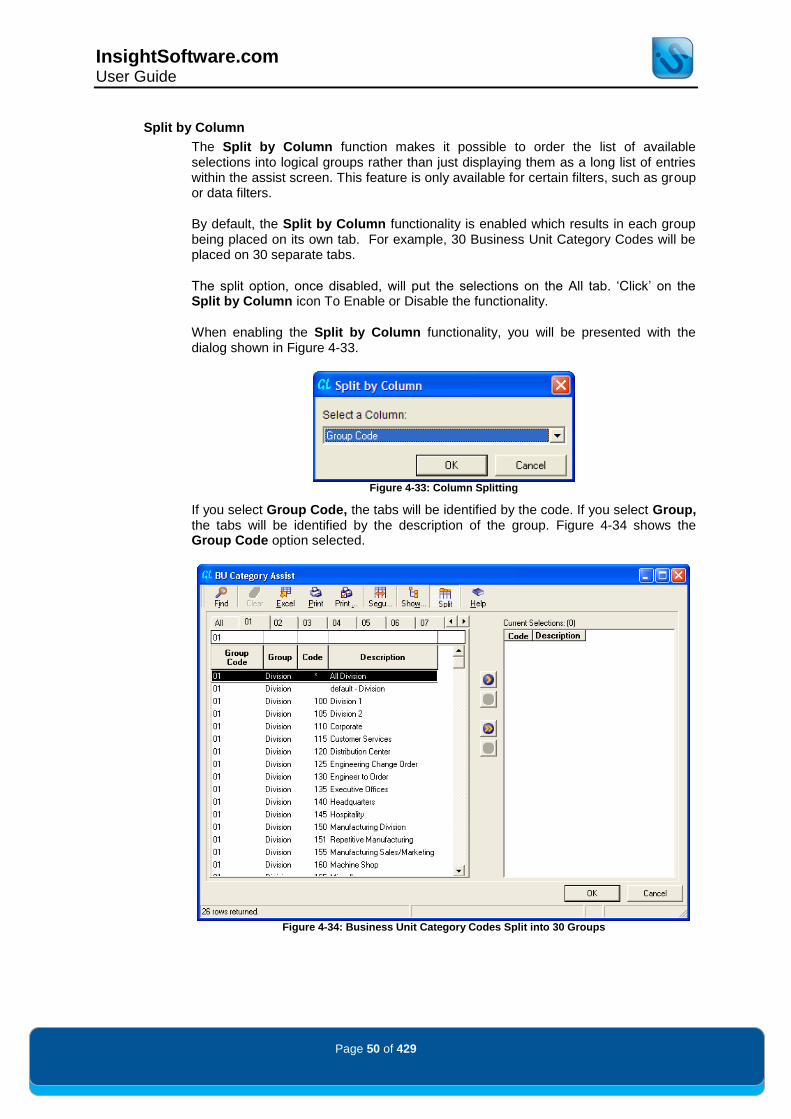
Split by Column
The Split by Column function makes it possible to order the list of available selections into logical groups rather than just displaying them as a long list of entries within the assist screen. This feature is only available for certain filters, such as group or data filters.
By default, the Split by Column functionality is enabled which results in each group being placed on its own tab. For example, 30 Business Unit Category Codes will be placed on 30 separate tabs.
The split option, once disabled, will put the selections on the All tab. „Click‟ on the Split by Column icon To Enable or Disable the functionality.
When enabling the Split by Column functionality, you will be presented with the dialog shown in Figure 4-33.
Figure 4-33: Column Splitting
If you select Group Code, the tabs will be identified by the code. If you select Group, the tabs will be identified by the description of the group. Figure 4-34 shows the Group Code option selected.
Figure 4-34: Business Unit Category Codes Split into 30 Groups
InsightSoftware.com User Guide
Page 51 of 429
Existing Selections
The Query Assists can be used to make selections again and again. On subsequent visits to the assist dialog, your previous selections are shown in the current selections panel. Additional items can be added using the techniques described above, or alternatively, before new selections are made, the current selections can be cleared down using the Clear button.
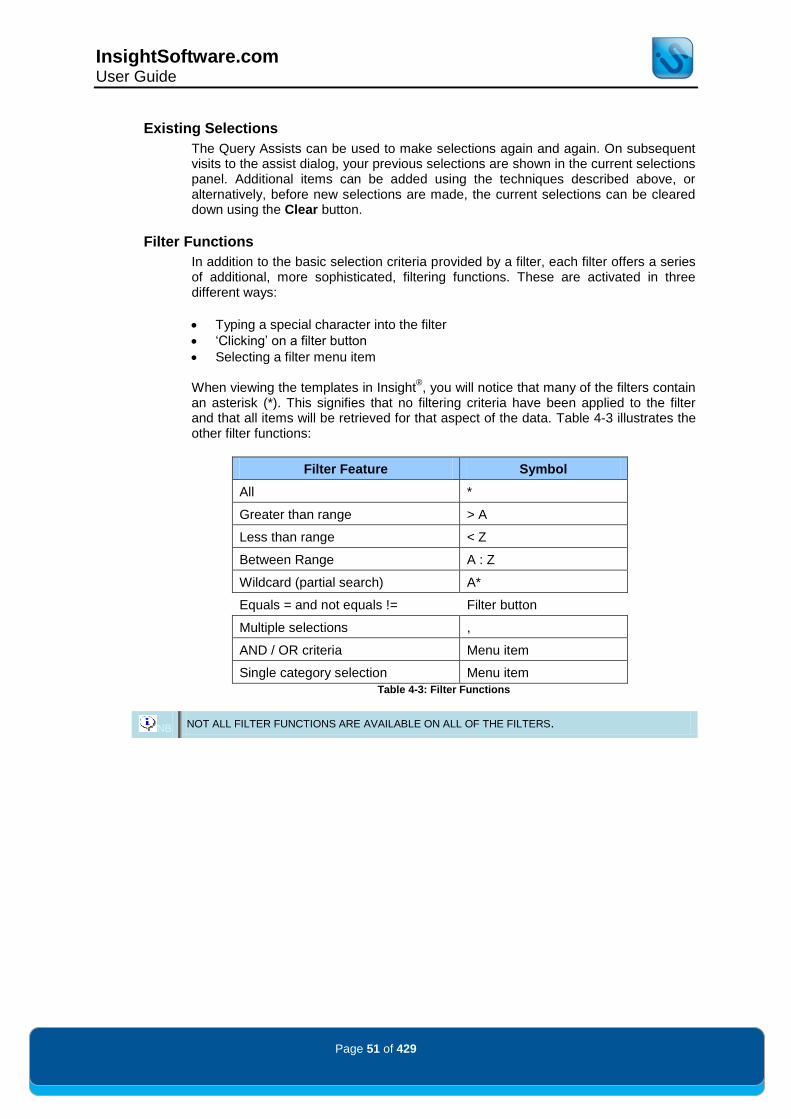
Filter Functions
In addition to the basic selection criteria provided by a filter, each filter offers a series of additional, more sophisticated, filtering functions. These are activated in three different ways:
Typing a special character into the filter
„Clicking‟ on a filter button
Selecting a filter menu item When viewing the templates in Insight
®, you will notice that many of the filters contain
an asterisk (*). This signifies that no filtering criteria have been applied to the filter and that all items will be retrieved for that aspect of the data. Table 4-3 illustrates the other filter functions:
Filter Feature Symbol
All *
Greater than range > A
Less than range < Z
Between Range A : Z
Wildcard (partial search) A*
Equals = and not equals != Filter button
Multiple selections ,
AND / OR criteria Menu item
Single category selection Menu item
Table 4-3: Filter Functions
NB NOT ALL FILTER FUNCTIONS ARE AVAILABLE ON ALL OF THE FILTERS.

InsightSoftware.com User Guide
Page 52 of 429
Working with Ranges
Filters such as Object Account and Business Unit are able to work with ranges. This feature is only available for manual entry within the filter itself, rather than with the Query Assist. However, when using the Query Assist, any ranges that have been manually set are shown. Ranges can be handled in one of three ways (Table 4-4):
Syntax Example Description
x:y (Between) 1000:2000 Selects Object Account codes from 1000 to 2000
>x (Greater than) >2000 Selects Object Account codes greater than 2000
<x (Less than) <2000 Selects Object Account codes less than 2000
Table 4-4: Ranges
Furthermore, it is possible to combine multiple „between‟ clauses with the same filter selection, as well as a „between‟ clause with other single selections. This is done by using the comma (,) separator, as shown below. Figure 4-35 shows all accounts between 5000 and 6000, as well as 7001:
Figure 4-35: Multiple Selections

InsightSoftware.com User Guide
Page 53 of 429
Range Logic
Comparing „Between‟ ranges with „Greater than‟ and „Less than‟ ranges does not necessarily produce the same results. For example, a range selection of 1000:2000 is not the same as a selection „>1000, <2000‟ (Greater Than 1000, Less Than 2000). Table 4-5 illustrates the range logic differences:
Values Range 1000:2000
Greater Than 1000
Less Than 2000
Greater Than 1000 OR Less
Than 2000
700 700 700 700 700
800 800 800 800 800
900 900 900 900 900
1000 1000 1000 1000 1000
1100 1100 1100 1100 1100
1200 1200 1200 1200 1200
1300 1300 1300 1300 1300
1400 1400 1400 1400 1400
1500 1500 1500 1500 1500
1600 1600 1600 1600 1600
1700 1700 1700 1700 1700
1800 1800 1800 1800 1800
1900 1900 1900 1900 1900
2000 2000 2000 2000 2000
2100 2100 2100 2100 2100
2200 2200 2200 2200 2200
2300 2300 2300 2300 2300
2400 2400 2400 2400 2400
2500 2500 2500 2500 2500
2600 2600 2600 2600 2600
Table 4-5: Range Logic
The first column indicates the range of values available in a notional Object Account structure.
The second column indicates the behavior of the example range filter „1000:2000‟. As is shown, the values selected for a result would be those which fall between (and include) the lower and upper values for the range.
The third column depicts the behavior of the example „>1000‟ and, as expected, the result would be those values which are greater than the value indicated.
The fourth column depicts the behavior of an example filter „<2000‟. Again, as expected, the values returned are those which are less than the value used for the filter.
The final column is an example of what happens when „Greater Than‟ and „Less Than‟ filters are combined. The result includes every member in our example account structure. The reason why the full dimension is returned is that the comma separator in a multiple selection can be considered as an „OR‟. For example, if a user asks for „Item (A), Item (B)‟ then they expect to see a result that includes the first member requested OR the second. What the last example asks for is greater Than 1000 OR less than 2000. This condition includes every member in the dimension since they are all higher than one value or less than the other.

InsightSoftware.com User Guide
Page 54 of 429
Wildcards
It is also possible to perform wildcard filtering on the Object Account and Business Unit filters. There are a number of wildcard searches that can be done which combine the use of the asterisk (*) together with part of the filter selection.
Partial Wildcard Matching: Here, a piece of text is used to partially identify selections that match either at the beginning or the end. For example, the asterisk character (*) is used to search for object accounts that start with 51, i.e. if using 51*, Object Accounts such as 5110 and 5150 would be returned. Had the asterisk appeared prior to the value 51, i.e. *51, then using this criteria, Object Accounts such as 1151, 1351, 2551, etc. would be returned.
Full Wildcard Matching: Here, a piece of text is used to partially identify selections that match anywhere in the list of possible selections. For example, the asterisk character (*) could be used at the beginning and end of the character string to filter on Object Accounts using the character 5. Therefore the selection *5* would return Object Accounts such as 5010, 1350 and 7015.
Equal To / Not Equal To
The equal to / not equal to toggle button is used as a modifier to include or exclude the items selected within the filter. By default, this switch is set to automatically search for results that match the criteria in the filter. Therefore the result set matches or is equal to the filter selection, as shown in Figure 4-36:
Figure 4-36: Equal to Filter Selection
To change this default behavior to the opposite effect, „click‟ on the Equal to (=) icon, changing it to a Not equal to (!=) icon, as shown in Figure 4-37. „Clicking‟ this icon again returns the icon back to an „Equal to‟ status.
Figure 4-37: Not Equal to Filter Selection
The Not equal to option cannot be used when using an asterisk (*) (all selections) as this would mean „exclude all‟ and would mean that no results are ever returned.
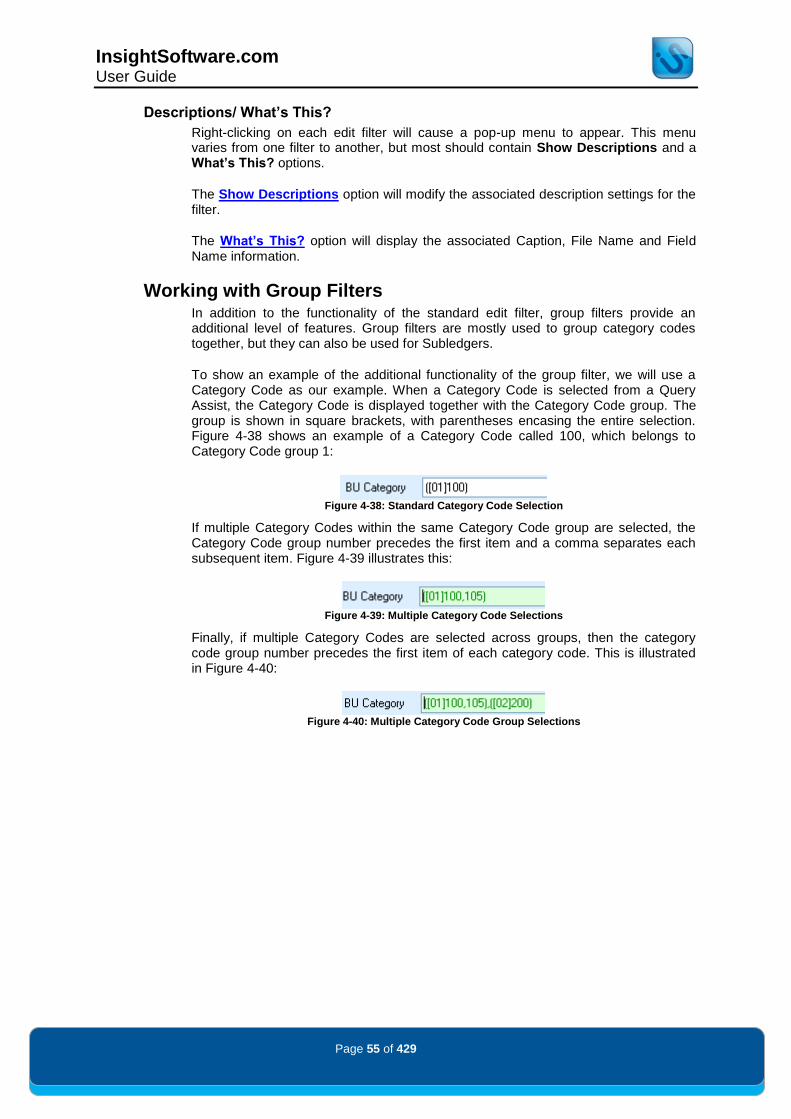
InsightSoftware.com User Guide
Page 55 of 429
Descriptions/ What’s This?
Right-clicking on each edit filter will cause a pop-up menu to appear. This menu varies from one filter to another, but most should contain Show Descriptions and a What’s This? options.
The Show Descriptions option will modify the associated description settings for the filter.
The What’s This? option will display the associated Caption, File Name and Field Name information.
Working with Group Filters In addition to the functionality of the standard edit filter, group filters provide an additional level of features. Group filters are mostly used to group category codes together, but they can also be used for Subledgers.
To show an example of the additional functionality of the group filter, we will use a Category Code as our example. When a Category Code is selected from a Query Assist, the Category Code is displayed together with the Category Code group. The group is shown in square brackets, with parentheses encasing the entire selection. Figure 4-38 shows an example of a Category Code called 100, which belongs to Category Code group 1:
Figure 4-38: Standard Category Code Selection
If multiple Category Codes within the same Category Code group are selected, the Category Code group number precedes the first item and a comma separates each subsequent item. Figure 4-39 illustrates this:
Figure 4-39: Multiple Category Code Selections
Finally, if multiple Category Codes are selected across groups, then the category code group number precedes the first item of each category code. This is illustrated in Figure 4-40:
Figure 4-40: Multiple Category Code Group Selections

InsightSoftware.com User Guide
Page 56 of 429
Working with a Single Category Code Group
As an alternative, to avoid the use of this standard syntax, it is possible to set a default Category Code group. To do this, „right-click‟ on the Category Code field and select Category, followed by the Category Code required as the default. Figure 4-41 illustrates how Category Code Group 3 is selected:
Figure 4-41: Setting a Default Category Code Group
To select more than one group, repeat the process, selecting each group required. To return to the standard method of selection, „right-click‟ again and select Category, followed by the All Categories option.
AND/OR Criteria
When working with multiple Category Code groups, it is possible to provide more precise filtering based on combinations of the groups selected using AND/OR functionality.
Using a simple example of two Category Code selections - one from Category Code Group 1 and one from Category Code Group 2 - it is possible to specify whether or not the inquiry should match on the combination of both items selected, i.e. the Category Code group 1 selection and the Category Code group 2 selection. This is likely to produce relatively few results because all of the criteria need to be met for an item to feature in the result set.
Alternatively, it is possible to specify whether the software should match either of the items in each group, i.e. match the Category Code Group 1 selections or the Category Code Group 2 selections. This normally produces a larger number of results than the „and‟ function, as the inquiry results only need to match one of the two selections.

InsightSoftware.com User Guide
Page 57 of 429
In Table 4-6, you can see which items would be selected when filtering on the „Marketing Division‟ in Category Code Group 1 and the „North American Region‟ in Category Code Group 2:
Division Region AND OR
Marketing Europe N Y
Marketing North America Y Y
Marketing Australia N Y
Sales Europe N N
Sales North America N Y
Sales Australia N N
Table 4-6: Using AND/OR Criteria
The AND/OR logic can be changed by „right-clicking‟ on the Category Code filter and selecting the appropriate option shown in Figure 4-42. By default, Category Codes are set to use the AND criteria:
Figure 4-42: Setting the AND/OR Option
There is one further option that appears on the pop-up menu when using a group filter, which is the Display Padding Characters option. This option enables the display of any leading spaces or zeros from the code. This is purely for presentational purposes and has no effect on the result set.
NB ONLY THE CODES AND ATTRIBUTES THAT HAVE BEEN CHOSEN FOR INCLUSION WHEN
CONFIGURING THE APPLICATION ARE AVAILABLE FOR SELECTION. PLEASE REFER TO THE
ADMINISTRATION GUIDE FOR MORE DETAILS.

InsightSoftware.com User Guide
Page 58 of 429
Working with Column Filters The final set of filters is made up of column filters. These filters do not have a Query Assist. The columns appear in the main inquiry result set itself rather than appearing as a dedicated filter within the filter set at the top of the screen.
Columns are filtered using the Query By Example (QBE) feature. A series of QBE filters appear above each column in the result set (including those columns which have an associated filter). To set a column filter, type the criteria into the QBE filter.
The syntax for the criteria depends upon what is being asked. Table 4-7 indicates the syntax for each filter criteria, using the Document Number column as an example:
Function Syntax Example Explanation
Equal to = or blank =6 List all the transactions where the document number is equal to 6
Not Equal to != or <> !=6 List all the transactions for every document number except document number 6.
Greater than > >6 List all the transactions where the document number is greater than 6.
Less than < <6 List all the transactions where the document number is less than 6.
In the range of : 2:6 List all the transactions with a document number between 2 and 6.
Multiples , 2,6 List all the transactions with a document number 2 or 6
Table 4-7: QBE Filter Syntax
The QBE functionality can be used for any columns within the result set, not just the column types. This can include the value and label columns which also have a standard filter.
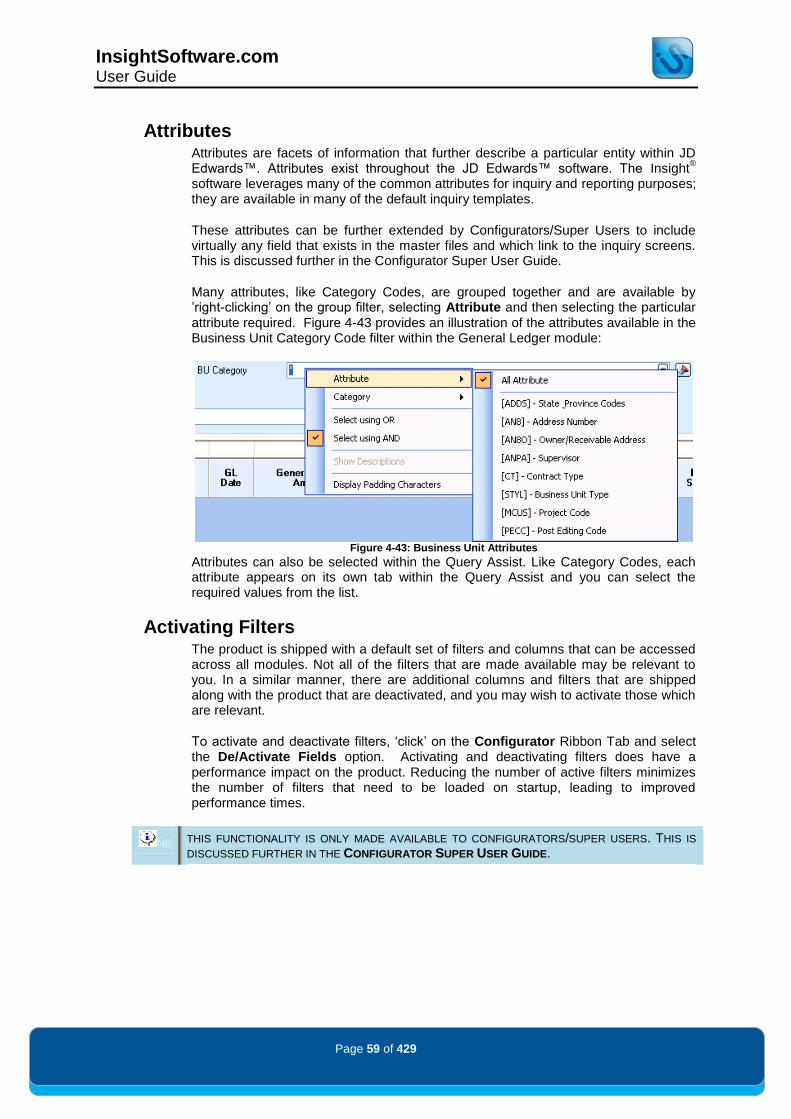
InsightSoftware.com User Guide
Page 59 of 429
Attributes Attributes are facets of information that further describe a particular entity within JD Edwards™. Attributes exist throughout the JD Edwards™ software. The Insight
®
software leverages many of the common attributes for inquiry and reporting purposes; they are available in many of the default inquiry templates.
These attributes can be further extended by Configurators/Super Users to include virtually any field that exists in the master files and which link to the inquiry screens. This is discussed further in the Configurator Super User Guide.
Many attributes, like Category Codes, are grouped together and are available by ‟right-clicking‟ on the group filter, selecting Attribute and then selecting the particular attribute required. Figure 4-43 provides an illustration of the attributes available in the Business Unit Category Code filter within the General Ledger module:
Figure 4-43: Business Unit Attributes
Attributes can also be selected within the Query Assist. Like Category Codes, each attribute appears on its own tab within the Query Assist and you can select the required values from the list.
Activating Filters The product is shipped with a default set of filters and columns that can be accessed across all modules. Not all of the filters that are made available may be relevant to you. In a similar manner, there are additional columns and filters that are shipped along with the product that are deactivated, and you may wish to activate those which are relevant.
To activate and deactivate filters, „click‟ on the Configurator Ribbon Tab and select the De/Activate Fields option. Activating and deactivating filters does have a performance impact on the product. Reducing the number of active filters minimizes the number of filters that need to be loaded on startup, leading to improved performance times.
NB THIS FUNCTIONALITY IS ONLY MADE AVAILABLE TO CONFIGURATORS/SUPER USERS. THIS IS
DISCUSSED FURTHER IN THE CONFIGURATOR SUPER USER GUIDE.

InsightSoftware.com User Guide
Page 60 of 429
Summary of Filter Selection Features While each inquiry template is different, the following summary in Table 4-8 helps to explain all of the filter functions, on a filter by filter basis, for each filter on the Period Summary inquiry template in the General Ledger module:
Features by Filter
Sele
ct A
ll (*)
Gre
ate
r Than
>
Less T
han <
Range
s X
:Y
Wild
card
A*
Mu
lti-Entry
A,B
,C
Equal/N
ot
Equal
AN
D/O
R
Sin
gle
Cate
go
ry
Object Account
Subsidiary
Period
Year
Company
Business Unit
Object Cat Code
BU Cat Code
Ledger Type
Sub Ledger/Type
Sub Ledger Cat Code
Roll Up/Detail
PE Code
Currency Code
Table 4-8: Summary of Features by Individual GL Filter
However, due to the possible customization options within an inquiry, the information in Table 4-8 is not always a constant. For example, removing a value as a pivoted column will mean that the use of filters is extended. Normally, pivoted columns require literal values to be entered.
For example, in the preceding Table 4-8, Period, Ledger and Year are by default set as pivoted columns, explaining their limited use of filters. If they were removed as a pivoted column, then the allowed filters would increase. The concept of pivoting through Pivot Inquiry is covered in a later chapter.
Another example is the use of group filters, which requires a user to specify an attribute or associated category to search by. When these are specified, more filter functionality becomes available for the specified attribute/category.
The group filter logic is applicable to fields such as Object Category Codes, where a category code must be specified (from a selection) before the inquiry can use additional filters.

InsightSoftware.com User Guide
Page 61 of 429
Filter Selections The Filter Selection dialog allows you to quickly see a summary of each populated filter within an inquiry/template (see Figure 4-44). This dialog is available within the Design Ribbon Tab, within the Setup section of the ribbon.
Figure 4-44: Filter Selections Dialog
The secondary tab Make Selections (Figure 4-45) provides another mechanism for editing the filters within the inquiry.
Figure 4-45: Make Selections Tab of Filter Selections
InsightSoftware.com User Guide
Page 62 of 429
Bringing it All Together This chapter has introduced the concept of filters within an inquiry template. There are many different types of filters, including the standard edit filter, the date filter, the combined date filter, the group filter, the hierarchy filter and the column filter. Each filter offers varying degrees of functionality in order to provide the most flexible method for defining an inquiry.
When all of the filters have been set, the criteria for an inquiry are complete and you are ready to run an inquiry. Details of how to do this and how to manipulate the result set are covered in the next chapter.
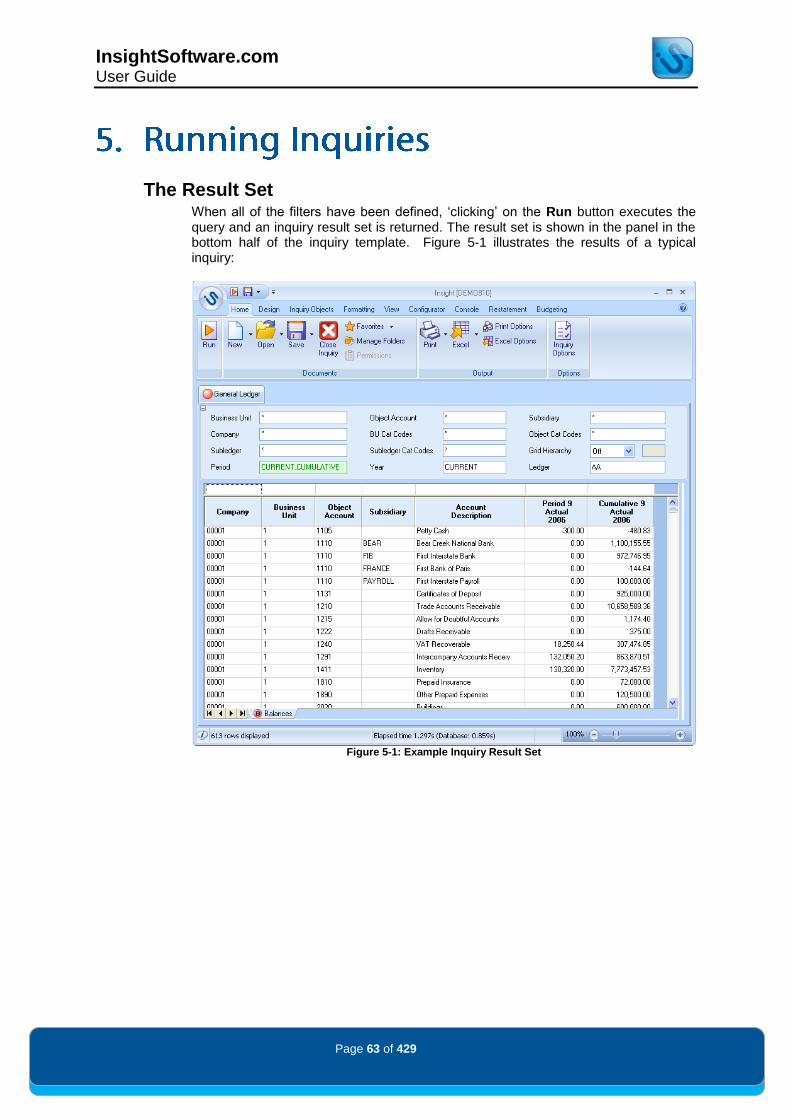
InsightSoftware.com User Guide
Page 63 of 429
The Result Set When all of the filters have been defined, „clicking‟ on the Run button executes the query and an inquiry result set is returned. The result set is shown in the panel in the bottom half of the inquiry template. Figure 5-1 illustrates the results of a typical inquiry:
Figure 5-1: Example Inquiry Result Set

InsightSoftware.com User Guide
Page 64 of 429
How the Results are Organized
The result set is split into two distinct parts: the result labels and the result values.
The result labels are the left-most columns and provide the descriptors to uniquely identify the row values. Typically, these include the Object Account, Business Unit and Company names, or other qualifying selections.
The result values are organized into a repeating structure based on how the filters are set in the column axis of the inquiry. These columns are structured such that every combination of each column axis filter is displayed. These are displayed as blocks that repeat for each „outer-most‟ item. By default, the outer-most item is the Period filter, but you can reorder these items.
Figure 5-2 illustrates a typical inquiry in which the results are structured into two years (2005 and 2006), with a second level covering Periods 6 and 7. There is a final layer organizing actual and budget figures:
Figure 5-2: How Columns are Structured and Organized
Once a result set has been returned using the following features of the product, it can be manipulated in a number of different ways.

InsightSoftware.com User Guide
Page 65 of 429
Pivot Inquiry To use this feature, „click‟ on the Design Ribbon Tab and select Pivot Inquiry. (This feature was formerly known as Inquiry Structure).
The Pivot Inquiry dialog shown in Figure 5-3 has two purposes. The first is to orientate data with each filter either presented as row or column item. The second is to set the row order of the column headings in the result set. By default, the Period filter is placed first, followed by the Ledger Type and finally, Year.
Figure 5-3: Pivot Inquiry Dialog
The dialog is split into two panels. The row selections are on the left and the column selections are on the right.
To move a selection from a row to a column or vice versa (known as „pivoting‟ the data), first highlight the selection to be moved and „click‟ on the left or right arrow key to move it from one panel to the other. Alternatively „double clicking‟ on the item will also move it from one panel to the other.
The double arrow keys move the entire list of selections from one panel into the other. It is important to note though that there must always be at least one item in the row and one in the column when completed. Furthermore, in the associated data filter, which in this example is taken from a Balances (Period Summary) Inquiry in the General Ledger module, the Period selections must always be presented as a „column‟.
To change the column order, highlight the dimension to move and „click‟ on the Up, Down, Top or Bottom buttons to re-sequence the columns.
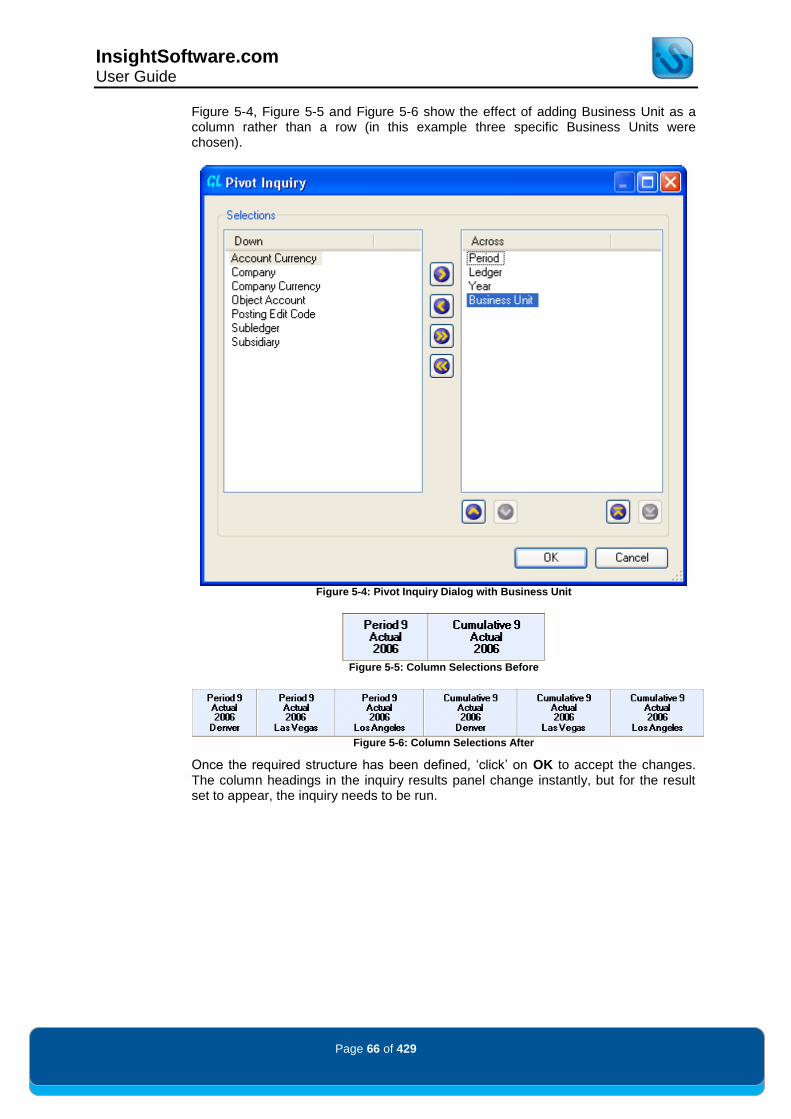
InsightSoftware.com User Guide
Page 66 of 429
Figure 5-4, Figure 5-5 and Figure 5-6 show the effect of adding Business Unit as a column rather than a row (in this example three specific Business Units were chosen).
Figure 5-4: Pivot Inquiry Dialog with Business Unit
Figure 5-5: Column Selections Before
Figure 5-6: Column Selections After
Once the required structure has been defined, „click‟ on OK to accept the changes. The column headings in the inquiry results panel change instantly, but for the result set to appear, the inquiry needs to be run.

InsightSoftware.com User Guide
Page 67 of 429
NB WHEN PIVOTING A ROW TO A COLUMN, THE SELECTED ROW MUST BE FILTERED.
For example, filtering on Business Units Denver (302), Las Vegas (303) and Las Angeles (304) would be an acceptable selection for column display, but an asterisk (*) would not be permitted. In such circumstances, if the Business Unit is placed in the column with an asterisk selected, then the message shown in Figure 5-7 is displayed:
Figure 5-7: Message when Pivoting Wildcard (*) Selections
If you „click‟ on Yes, the Visual Assist screen will be displayed for that filter - in this instance, the Business Unit filter. Here you can now stipulate which Business Units are to be selected.
If you „click‟ on No, the selection in the filter changes to be the first item available in the filter, i.e. Business Unit 1.
If you use the Pivot Inquiry function, you can use the Descriptions dialog to choose how to show row headings as column headings. You can define whether to display codes only, descriptions only, or a combination of codes and descriptions. Figure 5-8 shows an example with Business Unit code and description:
Figure 5-8: Column Headings Show Both the Codes and the Descriptions for the Business Units

InsightSoftware.com User Guide
Page 68 of 429
User Defined Captions This feature provides a way of setting captions for both column dimensions (items) and filters.
Column Item Captions
The User Defined Captions feature makes it possible to change the descriptions of the columns in the inquiry result set. A more user-friendly title for an item can be displayed rather than using the system name or code from JD Edwards™.
For example, the Ledger Type „AA – General Ledger‟ could be represented with a caption called „Actual‟. This would then appear in the result set.
Assigning a new caption to a dimension will mean that it will always display with the caption you have chosen. For example, you might choose to display „Period 1‟ with the User Defined Caption „January‟ throughout your inquiry.
Each individual caption is displayed as a separate row. One common use for User Defined Captions is to provide the literal month name for a period as shown in Figure 5-9.
Figure 5-9: User Defined Captions Period Example

InsightSoftware.com User Guide
Page 69 of 429
User Defined Captions can be applied to any of the inquiry‟s column headings (Including headings that were pivoted through Pivot Inquiry).
The finished inquiry will display your chosen captions wherever there are User Defined Captions for the Period, Ledger and Year (Figure 5-10):
Figure 5-10: The Finished Inquiry, Showing User Defined Captions
„Click‟ on the New button to create a new caption. This will launch the Define Caption dialog. Select the Field for which you wish to define a new caption from the drop down list (Figure 5-11):
Figure 5-11: Define Capability Dialog
Once you have specified your chosen Field, you can use a Query Assist to select which to value(s) you wish to apply your caption. Alternatively, you can manually type the values into the Item filter (in this case, Period). This is shown in Figure 5-12.
Figure 5-12: Define Caption Query Assist
Enter your chosen caption in the New Caption field and „click‟ OK. The new caption will then be included in the main User Defined Captions dialog.
When all changes are complete, „click‟ on the OK button to update the inquiry.
NB SOME TEMPLATES MAY COME WITH PRE-EXISTING USER DEFINED CAPTIONS. THESE CAN BE
EDITED OR REMOVED AS NEEDED FOR USER REQUIREMENTS.

InsightSoftware.com User Guide
Page 70 of 429
Field Captions
The User Defined Captions feature makes it possible to change the caption of any field, which is then reflected throughout the software. „Click‟ on the Fields tab. In the following example (Figure 5-13), the GL Balances Template already comes with User Defined Captions for the associated fields.
Figure 5-13: User Defined Captions: Fields Tab
„Click‟ on the New button to create a new caption, as shown in Figure 5-14.
Figure 5-14: Define Caption Dialog for Fields
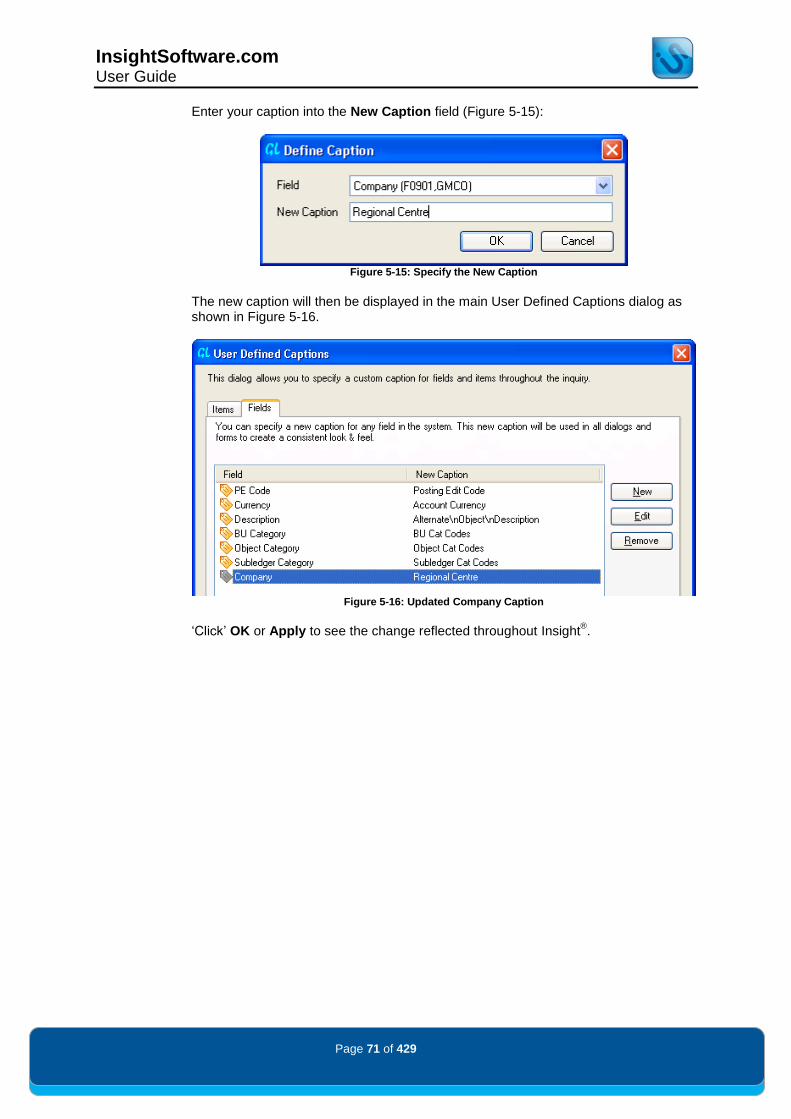
InsightSoftware.com User Guide
Page 71 of 429
Enter your caption into the New Caption field (Figure 5-15):
Figure 5-15: Specify the New Caption
The new caption will then be displayed in the main User Defined Captions dialog as shown in Figure 5-16.
Figure 5-16: Updated Company Caption
„Click‟ OK or Apply to see the change reflected throughout Insight
®.

InsightSoftware.com User Guide
Page 72 of 429
The caption for Company will then be changed throughout the software. Common examples are shown below.
Figure 5-17: Change Shown in Column Heading
Figure 5-18: Change Shown in Columns, Sorting and Grouping
Figure 5-19: Change Shown in Descriptions Dialog
Figure 5-20: Change Shown in Pivot Inquiry
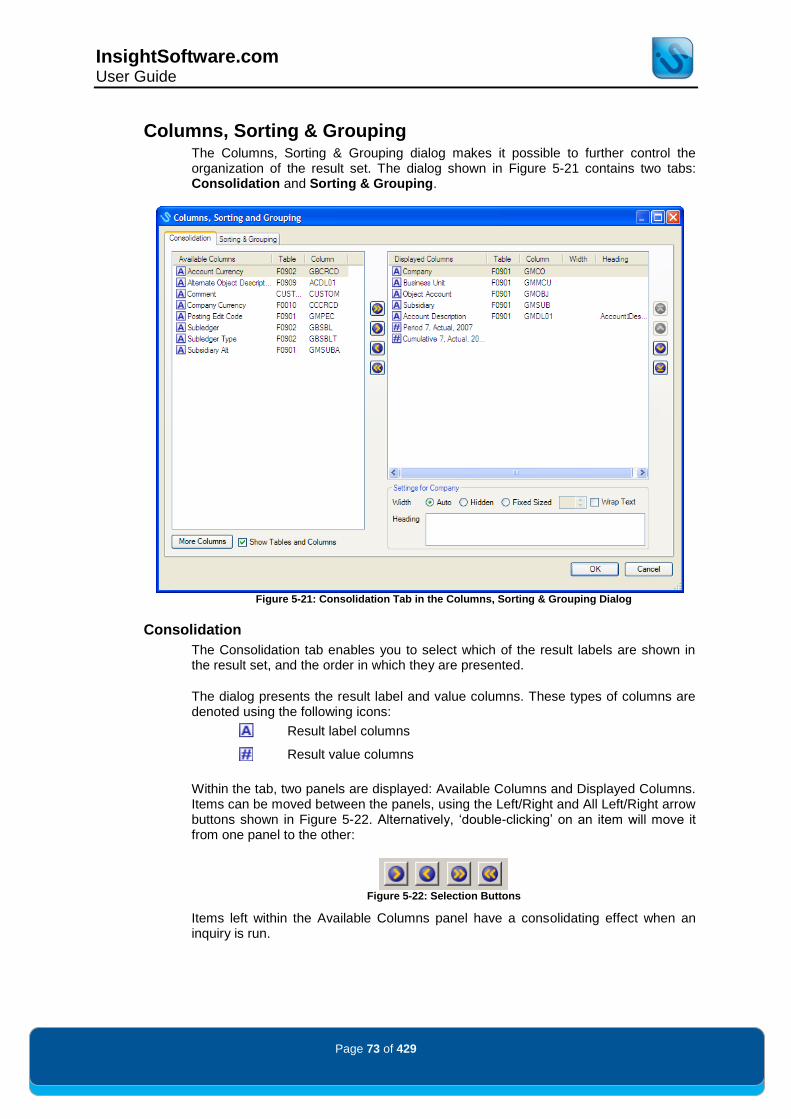
InsightSoftware.com User Guide
Page 73 of 429
Columns, Sorting & Grouping The Columns, Sorting & Grouping dialog makes it possible to further control the organization of the result set. The dialog shown in Figure 5-21 contains two tabs: Consolidation and Sorting & Grouping.
Figure 5-21: Consolidation Tab in the Columns, Sorting & Grouping Dialog
Consolidation
The Consolidation tab enables you to select which of the result labels are shown in the result set, and the order in which they are presented.
The dialog presents the result label and value columns. These types of columns are denoted using the following icons:
Result label columns
Result value columns
Within the tab, two panels are displayed: Available Columns and Displayed Columns. Items can be moved between the panels, using the Left/Right and All Left/Right arrow buttons shown in Figure 5-22. Alternatively, „double-clicking‟ on an item will move it from one panel to the other:
Figure 5-22: Selection Buttons
Items left within the Available Columns panel have a consolidating effect when an inquiry is run.
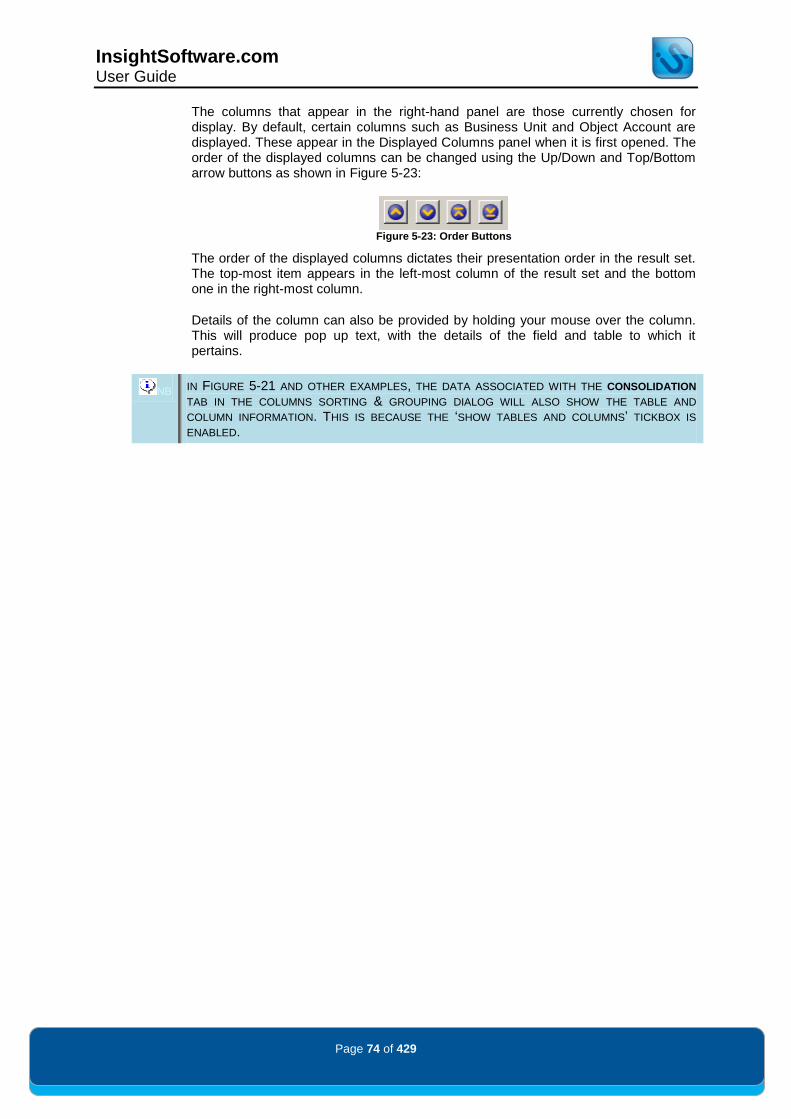
InsightSoftware.com User Guide
Page 74 of 429
The columns that appear in the right-hand panel are those currently chosen for display. By default, certain columns such as Business Unit and Object Account are displayed. These appear in the Displayed Columns panel when it is first opened. The order of the displayed columns can be changed using the Up/Down and Top/Bottom arrow buttons as shown in Figure 5-23:
Figure 5-23: Order Buttons
The order of the displayed columns dictates their presentation order in the result set. The top-most item appears in the left-most column of the result set and the bottom one in the right-most column.
Details of the column can also be provided by holding your mouse over the column. This will produce pop up text, with the details of the field and table to which it pertains.
NB IN FIGURE 5-21 AND OTHER EXAMPLES, THE DATA ASSOCIATED WITH THE CONSOLIDATION
TAB IN THE COLUMNS SORTING & GROUPING DIALOG WILL ALSO SHOW THE TABLE AND
COLUMN INFORMATION. THIS IS BECAUSE THE „SHOW TABLES AND COLUMNS‟ TICKBOX IS
ENABLED.

InsightSoftware.com User Guide
Page 75 of 429
More Columns
The Available and Displayed Columns are not the only columns that can be included within the inquiry. By „clicking‟ on the More Columns icon in the bottom-left side of the Columns, Sorting & Grouping dialog, you will open up the Add Columns dialog shown in Figure 5-24.
NB THIS FUNCTIONALITY IS ONLY MADE AVAILABLE TO CONFIGURATORS/SUPER USERS. THIS IS
DISCUSSED FURTHER IN THE CONFIGURATOR/SUPER USER GUIDE.
Figure 5-24: Add Columns Dialog
By „clicking‟ on the Plus Icon you can expand out the columns for the associated table. Then you can select the columns you require by „clicking‟ on the associated check box as shown in Figure 5-25.
Figure 5-25: Selecting a New Column

InsightSoftware.com User Guide
Page 76 of 429
Once you are done with your selections, „click‟ on OK and this will return you back to the Consolidation tab in the Columns, Sorting & Grouping dialog.
In this example, Account ID from the Account Balances (F0902) was selected. As you can see in Figure 5-26, Account ID has been added to the list of available columns in the left pane of the dialog.
Figure 5-26: Account ID is added to the Available Columns
Column Settings for Heading/Width
The bottom-right side of the Columns, Sorting & Grouping dialog under the Consolidation tab allows you to specify the heading or width of a Displayed Column. This will automatically default to the column that is highlighted in the Displayed Column pane and will update the title of this dialog. In Figure 5-27 you can see that Company is selected in the Displayed Columns and that you can modify its settings. You can specify the width of the column to be:
Auto (will increase automatically depending on the column‟s text) Hidden (size is set to zero) Fixed Size (manually set the column width in terms of the number of
characters)
Wrap Text can be used in any column and the maximum characters is dependent on screen size, but is around 5000 characters with wrap text OFF and 20,000 characters with wrap text ON
Figure 5-27: Column Settings for Company
NB COLUMNS PREVIOUSLY HIDDEN CAN BE RE-DISPLAYED BY HIGHLIGHTING THE COLUMN AND
UNCHECKING THE HIDE COLUMN BOX.
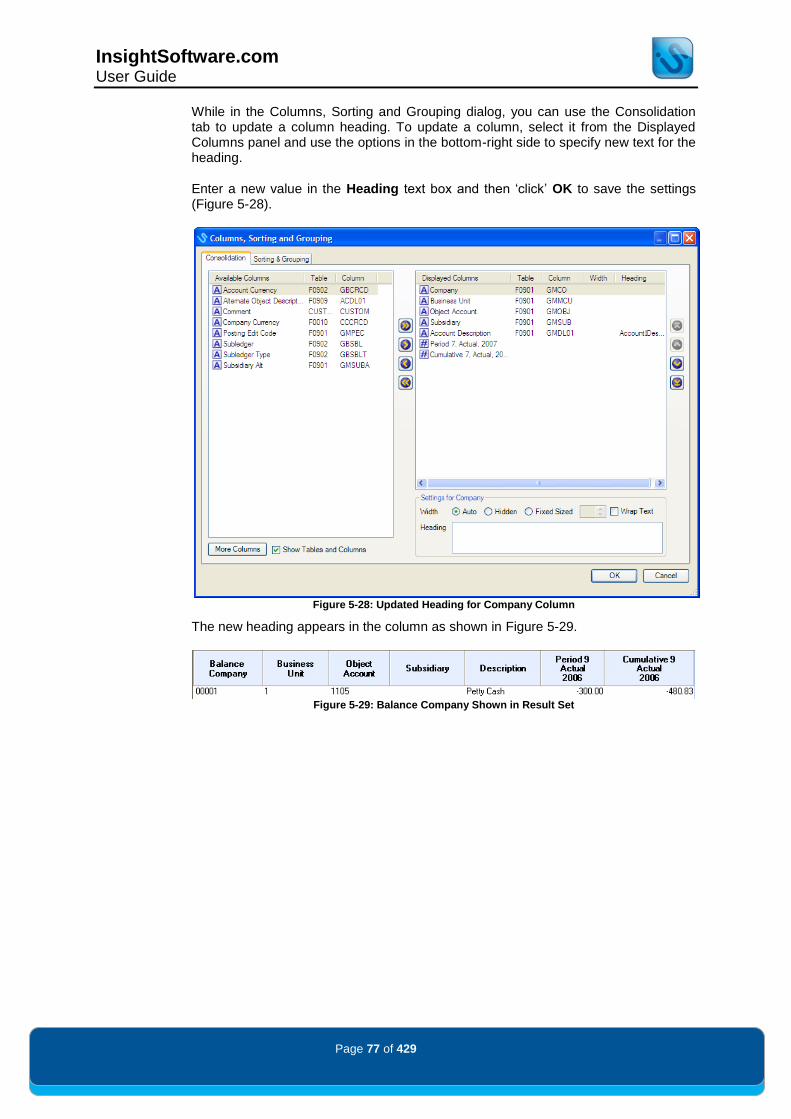
InsightSoftware.com User Guide
Page 77 of 429
While in the Columns, Sorting and Grouping dialog, you can use the Consolidation tab to update a column heading. To update a column, select it from the Displayed Columns panel and use the options in the bottom-right side to specify new text for the heading.
Enter a new value in the Heading text box and then „click‟ OK to save the settings (Figure 5-28).
Figure 5-28: Updated Heading for Company Column
The new heading appears in the column as shown in Figure 5-29.
Figure 5-29: Balance Company Shown in Result Set
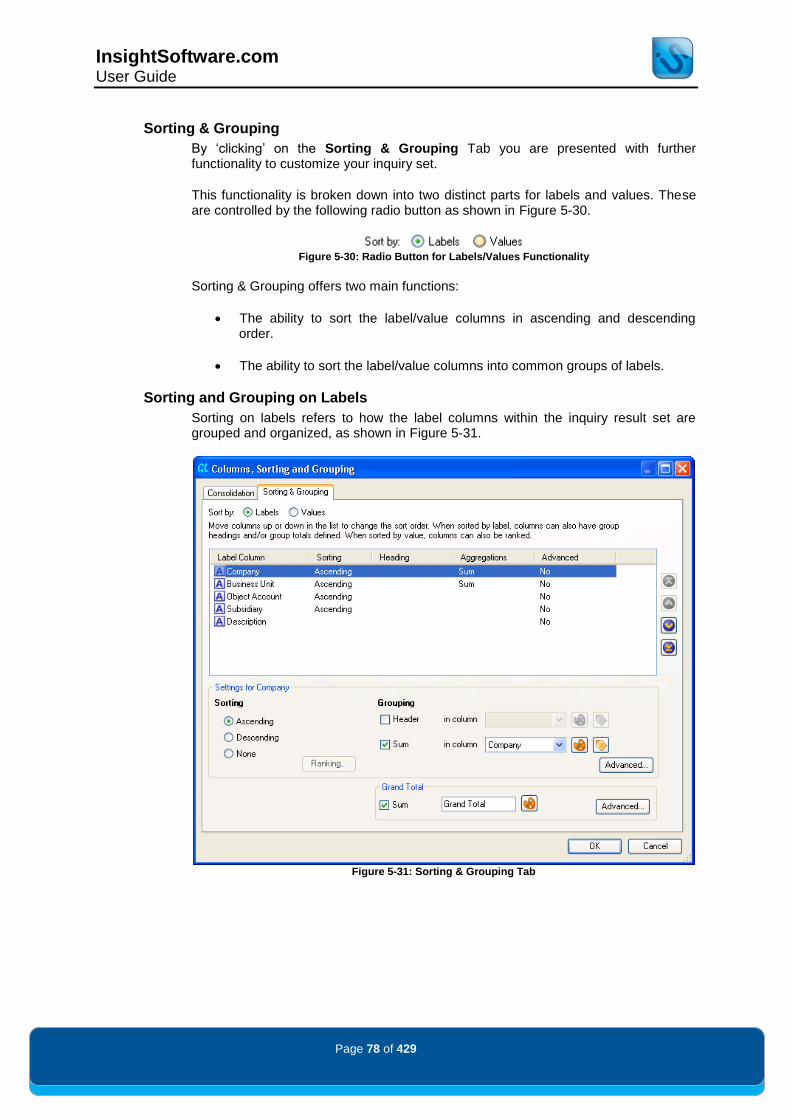
InsightSoftware.com User Guide
Page 78 of 429
Sorting & Grouping
By „clicking‟ on the Sorting & Grouping Tab you are presented with further functionality to customize your inquiry set.
This functionality is broken down into two distinct parts for labels and values. These are controlled by the following radio button as shown in Figure 5-30.
Figure 5-30: Radio Button for Labels/Values Functionality
Sorting & Grouping offers two main functions:
The ability to sort the label/value columns in ascending and descending order.
The ability to sort the label/value columns into common groups of labels.
Sorting and Grouping on Labels
Sorting on labels refers to how the label columns within the inquiry result set are grouped and organized, as shown in Figure 5-31.
Figure 5-31: Sorting & Grouping Tab

InsightSoftware.com User Guide
Page 79 of 429
Whatever item is at the top of the Label Column is the primary sequence. The order of the remaining Label Columns in the list dictates the subsequent sequencing. For example, if Object Account is the primary sequence and Business Unit is the secondary sequence, then the Business Unit labels will be sequenced within a particular Object Account. Figure 5-32 illustrates this concept:
Figure 5-32: Columns to Sort
To change the sort order, highlight the item to move and use the Up, Down, Top or Bottom buttons shown in Figure 5-33:
Figure 5-33: Order Buttons
Once a column has been selected, you can choose whether the sort order should be Ascending, Descending or None by selecting a radio button option from the Sorting options.
It is possible to add secondary, tertiary, etc. sorting criteria by selecting more columns to sort upon. The top-most columns in the list always take precedence. This precedence can be changed using the up/top/down/bottom arrow buttons. These can also be referred to as nested groups, when one group of columns is grouped within another.
This basic sorting process will be applied to all the rows within the result set, and the result set will fundamentally remain the same size, but it will be re-arranged into a different order.
NB IF A LABEL DOESN‟T HAVE ANY SORTING SPECIFIED (SORTING SET TO NONE), „CLICKING‟ OK
AND EXITING THE SCREEN WOULD MOVE THE LABEL COLUMN TO THE BOTTOM OF THE LIST. THIS IS BECAUSE IT IS NO LONGER AFFECTING THE SEQUENCING ON THE INQUIRY.
The Columns, Sorting and Grouping features can be used independently of each other. It is not mandatory to sort an inquiry after changing the column selections, as the application will always attempt to automatically sequence the data in an appropriate manner.
When the required modifications have been made, „click‟ on the OK button to accept the changes. The inquiry will need to be run in order to see the effect of the selections made.

InsightSoftware.com User Guide
Page 80 of 429
Sorting and Grouping on Values
Sorting and grouping on value columns operates in a similar fashion to sorting and grouping on label columns, except the sorting rules are now applied to the actual data columns in the result set. This allows you to rank items such as revenues by Business Unit, showing the highest revenue generative first, or listing the top-ten best-selling products.
These sorting rules can be set by „clicking‟ on the Sorting & Grouping tab within the Columns, Sorting & Grouping dialog, and then selecting the Values radio button in the top-left corner.
Figure 5-34: Result Set Sorted by Period 9 Values
As shown in Figure 5-34, Period 9 has been selected as the primary sorting column. You can select which columns are to be sorted using the same techniques as Sorting & Grouping on Labels.
A difference between sorting by labels instead of by values is the ability to further restrict the sorted result set by using the Ranking capability. For example, this would allow you to show only the top-10 highest values from the sorted result set. To use the ranking capability, „click‟ the Ranking button.
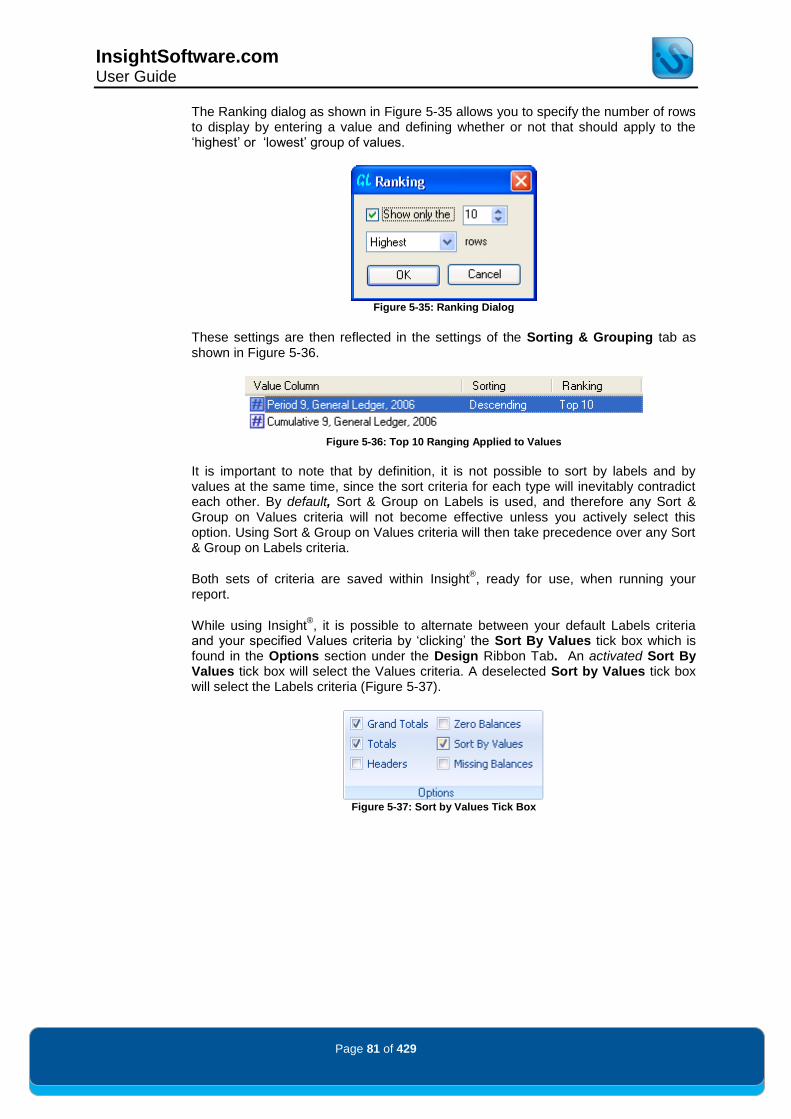
InsightSoftware.com User Guide
Page 81 of 429
The Ranking dialog as shown in Figure 5-35 allows you to specify the number of rows to display by entering a value and defining whether or not that should apply to the „highest‟ or „lowest‟ group of values.
Figure 5-35: Ranking Dialog
These settings are then reflected in the settings of the Sorting & Grouping tab as shown in Figure 5-36.
Figure 5-36: Top 10 Ranging Applied to Values
It is important to note that by definition, it is not possible to sort by labels and by values at the same time, since the sort criteria for each type will inevitably contradict each other. By default, Sort & Group on Labels is used, and therefore any Sort & Group on Values criteria will not become effective unless you actively select this option. Using Sort & Group on Values criteria will then take precedence over any Sort & Group on Labels criteria.
Both sets of criteria are saved within Insight®, ready for use, when running your
report.
While using Insight®, it is possible to alternate between your default Labels criteria
and your specified Values criteria by „clicking‟ the Sort By Values tick box which is found in the Options section under the Design Ribbon Tab. An activated Sort By Values tick box will select the Values criteria. A deselected Sort by Values tick box will select the Labels criteria (Figure 5-37).
Figure 5-37: Sort by Values Tick Box

InsightSoftware.com User Guide
Page 82 of 429
Figure 5-38 illustrates a consolidated Business Unit inquiry that has been sorted based on the revenues generated by each Business Unit in Period 9.
Figure 5-38: Sorting Based on Period 9 Values
Notice that the order of the Business Unit labels has now given way to the sort order of the Period 9 data column.

InsightSoftware.com User Guide
Page 83 of 429
Header and Total Functionality
Once the sorting of your data has been established, you can now start to specify sorting elements that will group your data such as Totals and Grand Totals.
The following functionality is best applied to label columns. Only the Grand Total functionality (introduced later) can be applied to value columns. For this section we will be using label columns unless expressly mentioned otherwise.
Within the Sorting & Grouping tab is a list of your displayed columns. Each of these can be modified to include Header, Sum and Advanced Total information, breaking down your inquiry into more complex analytical levels.
In the following example we will use a GL Balances template and use some of the preset default settings to create a modified inquiry.
The default settings (Figure 5-39) show that Company is set to Sort Ascending and is first in the sort order. It also has Sum aggregations.
If required, Business Unit, Object Account and all the other Label Columns can also be set to have different Headers, Sums and Advanced Total Information.
Figure 5-39: Default Sorting & Grouping Settings for GL Balances Template
Figure 5-40 shows the basic settings associated with Company, which is a label column.
Figure 5-40: Grouping Settings for Company
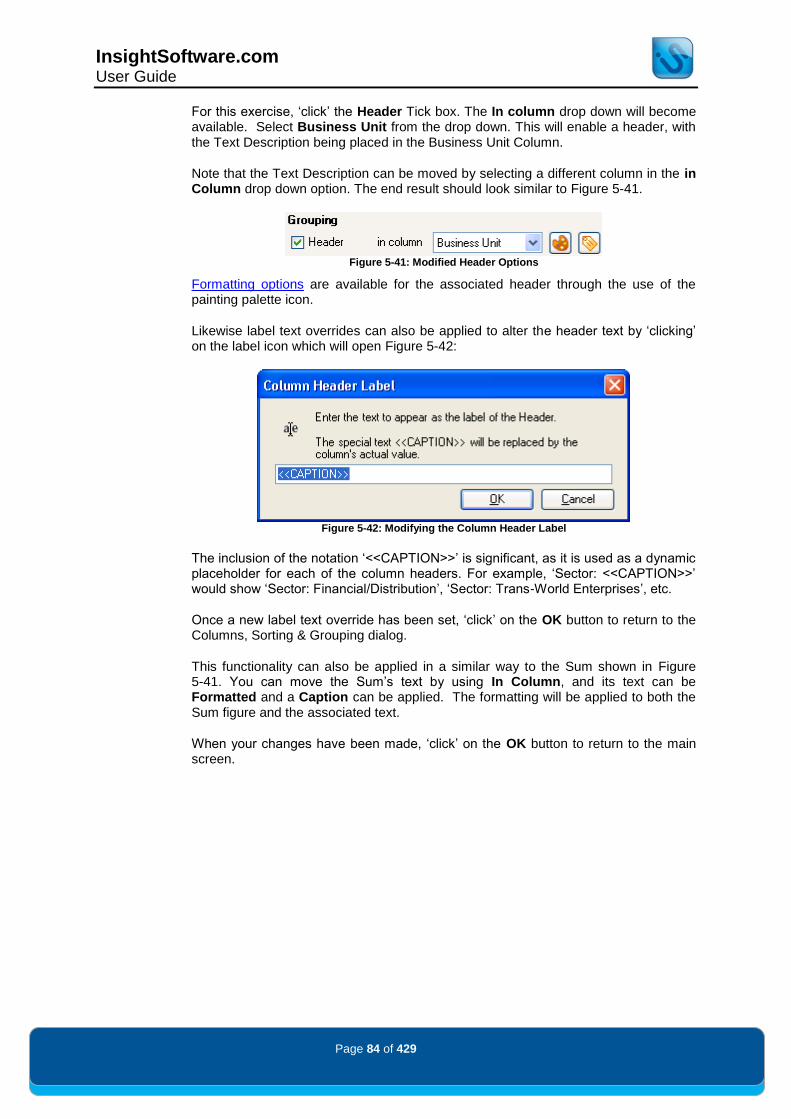
InsightSoftware.com User Guide
Page 84 of 429
For this exercise, „click‟ the Header Tick box. The In column drop down will become available. Select Business Unit from the drop down. This will enable a header, with the Text Description being placed in the Business Unit Column.
Note that the Text Description can be moved by selecting a different column in the in Column drop down option. The end result should look similar to Figure 5-41.
Figure 5-41: Modified Header Options
Formatting options are available for the associated header through the use of the painting palette icon.
Likewise label text overrides can also be applied to alter the header text by „clicking‟ on the label icon which will open Figure 5-42:
Figure 5-42: Modifying the Column Header Label
The inclusion of the notation „<<CAPTION>>‟ is significant, as it is used as a dynamic placeholder for each of the column headers. For example, „Sector: <<CAPTION>>‟ would show „Sector: Financial/Distribution‟, „Sector: Trans-World Enterprises‟, etc.
Once a new label text override has been set, „click‟ on the OK button to return to the Columns, Sorting & Grouping dialog.
This functionality can also be applied in a similar way to the Sum shown in Figure 5-41. You can move the Sum‟s text by using In Column, and its text can be Formatted and a Caption can be applied. The formatting will be applied to both the Sum figure and the associated text.
When your changes have been made, „click‟ on the OK button to return to the main screen.

InsightSoftware.com User Guide
Page 85 of 429
The final step is to enable the features. Under the Design Ribbon Tab, you can enable all of the Headers, Totals and Grand Totals within the Options section of the dialog.
Some of these may be already enabled by default in the template/inquiry you are using.
NB THE OPTIONS REFERENCED HERE CONTROL ALL OF THEIR ASSOCIATED ELEMENTS. FOR
EXAMPLE, IF YOU ENABLE HEADERS, YOU WILL ENABLE ALL OF THE SPECIFIED HEADERS IN
THE INQUIRY. LIKEWISE IF YOU DISABLE HEADERS, NONE WILL BE DISPLAYED.
Figure 5-43 is an example of an inquiry that has been customized by the functionality included in Columns, Sorting and Grouping.
The Company header was moved to the Object Account column before being formatted and given a suitable column header label.
A header was also added for Business Unit and was placed in the Object Account column. This was also formatted and given a suitable label in this column.
The Group Total for Business Unit was modified with a new label text override and appropriate formatting.
Due to these changes, the Company, Business Unit and Subsidiary columns were then set to a width of „Hidden‟ (still remaining as a displayed column) which made the inquiry more concise. See Figure 5-43 below.
Figure 5-43: GL Balances Template with Modified Column Sorting and Grouping Options

InsightSoftware.com User Guide
Page 86 of 429
Advanced Totals
The following section details a Heading and Group Total based on a Sum. However, Sum is only one of the available functions that can be utilized through Columns, Sorting and Grouping.
Within the Sorting & Grouping Tab there are Advanced buttons associated with both the Grouping and Grand Total sections (see Figure 5-44). This Advanced functionality has additional functionality than Sorting and Grouping tab.
Figure 5-44: Advanced Buttons Shown for Grouping and Grand Total Sections
The Grouping‟s Advanced button opens the following dialog as shown in Figure 5-45.
Figure 5-45: Advanced Functionality for Columns, Sorting and Grouping

InsightSoftware.com User Guide
Page 87 of 429
This screen consists of three main areas:
Aggregation Level – This allows you to select and view the list of columns brought through from the Sorting & Grouping Tab and for each, assign aggregation operations.
Operation Summary – Allows you to view and reorder the different aggregation operations, and for each shows how many columns the aggregation is applied to, the associated label text and on which column the text will be placed. Selecting an aggregation allows its settings to be edited in the Settings For area below.
Settings For – Allows you to select the columns that the selected aggregation will be applied to.
o The Column List is a dynamic view that changes depending on the operation highlighted in the Operation Summary. Provides a way of assigning an operation to an individual column.
Note: The Settings For view has built-in logic to limit columns displayed. For example, having an average on business unit names would not make any sense, but having an average on a period amount would.
o Display Text - Here you can change the text associated with the aggregation and apply formatting to it by clicking on the paint palette. The In Column area allows you to pick the column that the text will be displayed in.
Seven operations are included within this dialog:
Header – Used primarily for display of text associated with a header (note that when this is selected, there are no columns available in the dynamic column list).
Sum – This operation will sum the data associated with the specified column(s). The sum is based on the data displayed within the inquiry. This operation is the basis for all the totals in Columns, Sorting and Grouping.
Average – This operation will take the average for the specified column(s). This calculation will be based on the data displayed within the inquiry.
Count – This operation will count all the lines displayed on the inquiry for the specified column(s).
Maximum – This operation will compare all of the values displayed on the inquiry to find the maximum value for the specified column(s).
Minimum - This operation will compare all of the values displayed on the inquiry to find the minimum value for the specified column(s).
Unique Count – This operation will compare all of the values displayed to build a count of unique values for the specified column(s).

InsightSoftware.com User Guide
Page 88 of 429
Advanced Functionality Example
Using the previous GL Balances example, you can add additional operations to provide more reporting functionality.
„Click‟ on the Aggregation Level and select Business Unit. „Click‟ on Sum in the Operation Summary. As shown in Figure 5-46, you will see the Sum Operation which was already applied by default to Period 9 and Cumulative Period 9.
Figure 5-46: Sum Operation Applied to Business Unit
It may be useful to see the Maximum and Minimum amounts for these Revenue Accounts. To do this, „click‟ the tick boxes next to Maximum and Minimum in the Operation Summary. This will enable their associated Column List. „Click‟ on Maximum and the Column List will update to reflect the available columns.

InsightSoftware.com User Guide
Page 89 of 429
You can also modify the Display Text, Formatting and the associated in column for which it will be placed in. Modify the Display Text to „Max Revenue Account <<CAPTION>>‟, set the appropriate formatting and change the in column to „Description‟. The result of these changes are shown in Figure 5-47.
Figure 5-47: Maximum Operation Applied to the Business Unit Column
Highlight Minimum in the Operation Summary. Both Period 9 and Cumulative 9 will have their tick boxes enabled. Modify the Display Text to „Min Revenue Account <<CAPTION>>‟, the in Columns to „Description‟ and apply appropriate formatting.
„Click‟ on OK to save your operation changes and then „click‟ on OK again to exit the Columns Sorting and Grouping dialog.

InsightSoftware.com User Guide
Page 90 of 429
Your results should look like Figure 5-48.
Figure 5-48: GL Balances Result
NB THE ABOVE FUNCTIONALITY WAS APPLIED TO THE GROUPING LEVEL. HOWEVER, BY
„CLICKING‟ ON THE GRAND TOTAL‟S ADVANCED BUTTON UNDER THE SORTING& GROUPING
TAB, YOU WILL BE PRESENTED WITH THE SAME DIALOGS.
These operations, when applied at a Grand Total level, can then be applied across all the data results (effectively ignoring any Sorting/Grouping you have previously specified).

InsightSoftware.com User Guide
Page 91 of 429
Alternate Joins
The Alternate Joins dialog (Figure 5-49) allows you to configure how the underlying JD Edwards™ tables are linked together in the associated inquiry.
The addition of any columns from new tables via Columns, Sorting and Grouping will be affected by these settings in terms of the data result set.
Figure 5-49: File Links Tab on Inquiry Options Dialog
NB THE ABILITY TO CHANGE THE LINK IS ONLY MADE AVAILABLE TO CONFIGURATORS/SUPER
USERS. THIS ABILITY IS DISCUSSED FURTHER IN THE CONFIGURATOR/SUPER USER GUIDE.

InsightSoftware.com User Guide
Page 92 of 429
Formatting The Insight
® product has a range of formatting options. Formats can be applied in
one of two ways, either interactively, using the formatting toolbar icons, or via the formatting dialog.
Interactive Formatting
The interactive formatting options allow you to instantly apply formats to the columns of the inquiry result set. The formatting options vary between value columns and label columns.
Note: Custom columns are one exception to the rule in that they can have formatting functionality associated with value columns.
Table 5-1 shows the available options:
Formatting Option Label Column
Billable? Y/N
Value Column
Bold
Italic
Underline
Left Align
Center Align
Right Align
Border
Fill Color
Font Color
Percent
Increase Decimals
Decrease Decimals
Remove Formatting
Table 5-1: Formatting Options
To apply an interactive format, „click‟ on the column header of the column required or within a single cell in the column. Next „click‟ on the required formatting option icon within the Formatting Ribbon Tab and the chosen style will be applied to the entire column.
Continuing with the Balances example introduced in Columns, Sorting and Grouping, we can see the effects of additional column based formatting.

InsightSoftware.com User Guide
Page 93 of 429
Figure 5-50 illustrates the effect of applying a bold style to the Cumulative Period column and a fill color to the Period 6 column:
Figure 5-50: Interactive Formatting Example
For this example, we can see that the formatting applied to Period 9 and Cumulative Period 9 is being overwritten by the formatting on the headings.
The order in which formatting is applied is controlled through the use of priorities. In this example, the heading has a higher priority than the column formatting.
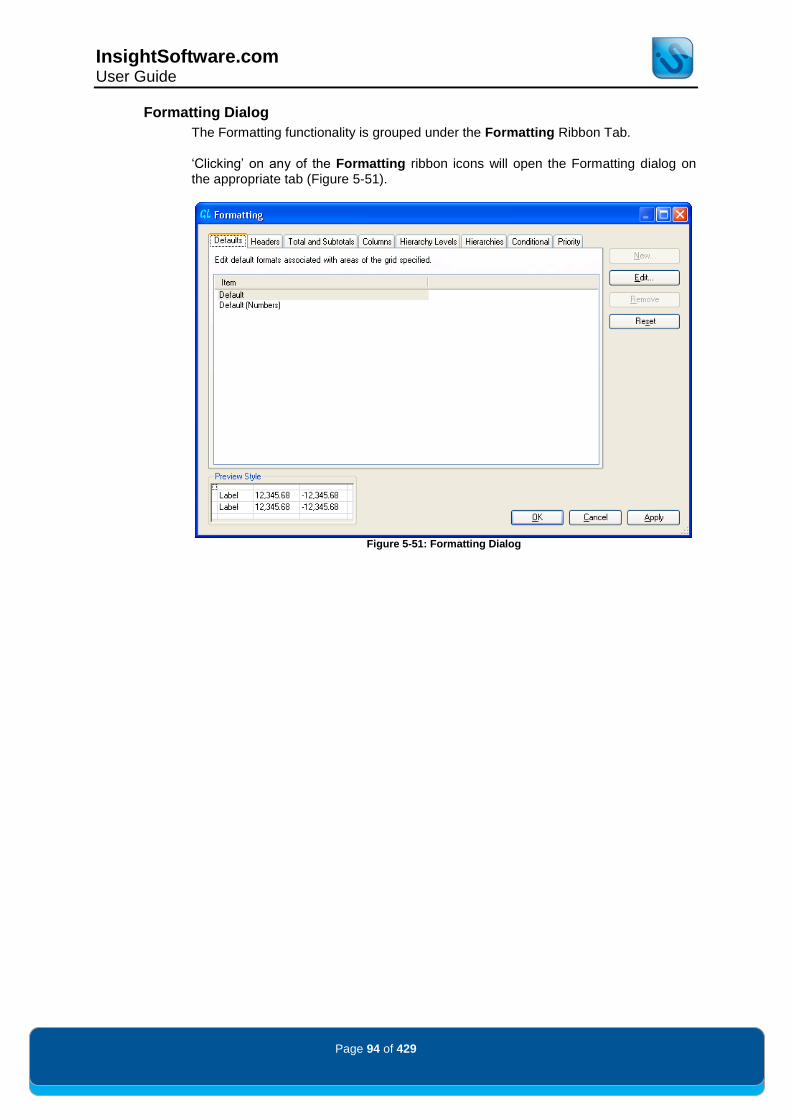
InsightSoftware.com User Guide
Page 94 of 429
Formatting Dialog
The Formatting functionality is grouped under the Formatting Ribbon Tab.
„Clicking‟ on any of the Formatting ribbon icons will open the Formatting dialog on the appropriate tab (Figure 5-51).
Figure 5-51: Formatting Dialog

InsightSoftware.com User Guide
Page 95 of 429
Defining & Changing Column Formats
For each formatted column, a unique style reference is created. These styles can be viewed, modified and added from within the Formatting dialog.
Figure 5-52 illustrates how two styles have been created by interactive formatting.
NB IN THE BOTTOM LEFT OF THE FORMATTING DIALOG, THERE IS A PREVIEW STYLE FIELD. THIS
WILL DISPLAY THE HIGHLIGHTED FORMAT ITEM, ASSISTING YOU WHEN THERE ARE MULTIPLE
FORMATS SPECIFIED FOR AN INQUIRY.
Figure 5-52: Formatting Styles

InsightSoftware.com User Guide
Page 96 of 429
New styles can be created by „clicking‟ on the New button, or existing styles can be modified by „clicking‟ on the Edit button.
If a new column style is created, then the dialog in Figure 5-53 is shown:
Figure 5-53: Creating a New Column Style
With the dialog, only the columns that have yet to have a style applied to them are shown for selection. Highlight the column required and „click‟ on the OK button. This will present a similar dialog to the one shown in Figure 5-54.

InsightSoftware.com User Guide
Page 97 of 429
The following dialog (Figure 5-54) is created as a result of editing the „Ledger AA, Period CUMULATIVE, Year CURRENT‟ column previously shown in Figure 5-50. As you can see, the Preview (Row & Column style) is correctly showing the previously defined Bold style setting.
Figure 5-54: Editing the Formatting Style for the Cumulative Period
Defining formats using this method provides a greater range of styling options, as there are options available that are not provided through Formatting Ribbon Tab options.
Formats are organized into three tabs. The options in the General tab, as shown above in Figure 5-54 can only be applied to data columns.
The formats on this dialog are grouped together by the Override Inherited Formats. This tick box controls the associated inheritance properties. Only when this is ticked do the associated functions become enabled. Likewise only one associated function needs to be enabled for the others to affect formatting priority.

InsightSoftware.com User Guide
Page 98 of 429
The following options are included within the Override Inherited Formats group:
Prefix - Provides a prefix character to the data values. These are used to signify the currency of the value. This can be $, £, € or none.
Suffix - Provides suffix character(s) to the data values. These are k, K, K/M/B,„s, „S, %, € or none.
Decimal Places - Increases or decreases the decimal places shown.
Thousands Separator - Toggles whether a thousand separator is used.
Show negatives in red - Toggles to show negative data values in red.
The use of the minus sign is also significant to Reverse Signs, as it allows you to show revenues as positive numbers.
No Positive Sign/Always Show Sign/Parenthesize Negatives – stipulates how value signs are treated.
External to the Override Inherited Formats are the following format controls:
Alignment - Sets the alignment of the data value so that it is either left, center or right aligned.
Divisor - Allows data values to be divided down or multiplied up.
* Note that the Priority inheritance is not linked to any other control.

InsightSoftware.com User Guide
Page 99 of 429
The Appearance tab shown in Figure 5-55 displays other formatting options.
Figure 5-55: Appearance Formatting Tab
To change any of the colors, „click‟ on the drop down color control for the Font Color or Back Color. This causes a color palette to appear from which the desired colors can be chosen. This is shown in Figure 5-56:
Figure 5-56: Font Color Drop Down Control
NB THE FONT COLOR AND BACK COLOR ARE THE SAME CONTROLS THAT ARE INCLUDED WITHIN
THE FORMATTING RIBBON.

InsightSoftware.com User Guide
Page 100 of 429
Additional colors are also available by „clicking‟ on the More Colors icon at the bottom of the control. This will display the dialog shown in Figure 5-57.
Figure 5-57: Color Dialog
„Clicking‟ on the Custom tab of the Color Dialog also reveals further configurable options (Figure 5-58).
Figure 5-58: Further Configurable Options for the Color Dialog
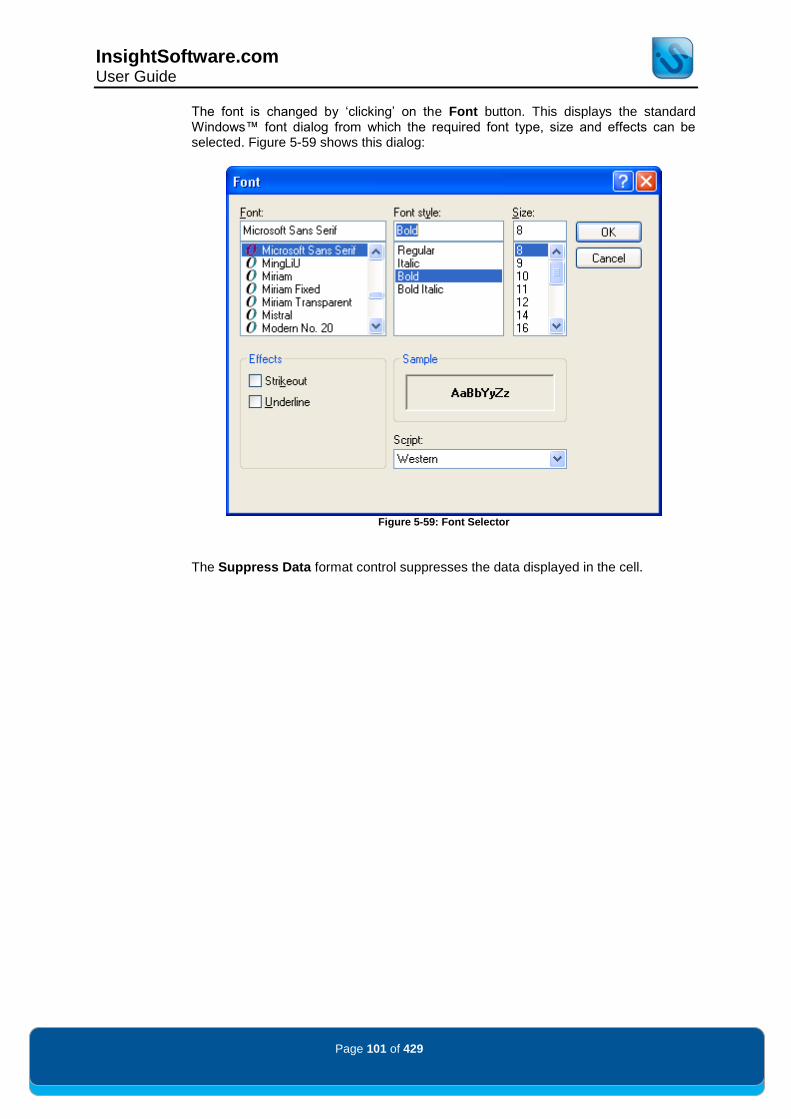
InsightSoftware.com User Guide
Page 101 of 429
The font is changed by „clicking‟ on the Font button. This displays the standard Windows™ font dialog from which the required font type, size and effects can be selected. Figure 5-59 shows this dialog:
Figure 5-59: Font Selector
The Suppress Data format control suppresses the data displayed in the cell.
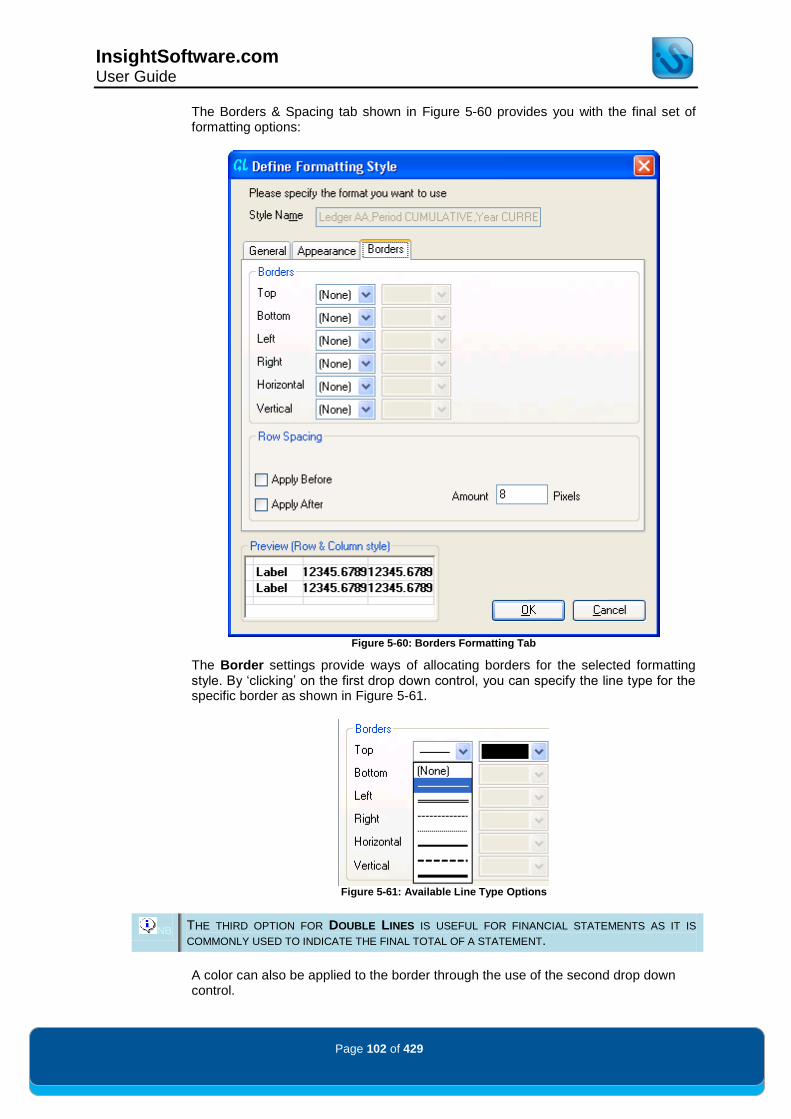
InsightSoftware.com User Guide
Page 102 of 429
The Borders & Spacing tab shown in Figure 5-60 provides you with the final set of formatting options:
Figure 5-60: Borders Formatting Tab
The Border settings provide ways of allocating borders for the selected formatting style. By „clicking‟ on the first drop down control, you can specify the line type for the specific border as shown in Figure 5-61.
Figure 5-61: Available Line Type Options
NB THE THIRD OPTION FOR DOUBLE LINES IS USEFUL FOR FINANCIAL STATEMENTS AS IT IS
COMMONLY USED TO INDICATE THE FINAL TOTAL OF A STATEMENT.
A color can also be applied to the border through the use of the second drop down control.

InsightSoftware.com User Guide
Page 103 of 429
The Row Spacing settings provide ways of adding white space for rows to the selected formatting style. This is often used to provide a blank row between different groups defined within the Columns, Sorting and Grouping dialog.
„Click‟ on OK to accept the changes.
Totals and Subtotals
In addition to column-based formats, formats can also be applied to Totals and Subtotals in the rows.
Using the previous Balances example, „clicking‟ on the Totals and Subtotals tab of the Formatting dialog will reveal various format styles, as shown in Figure 5-62:
Figure 5-62: Total and Subtotal Formatting
Depending on the inquiry, some of these styles may be supplied with the product. For the standard Balances Template, you will see default formatting on Group Sum for Object Account, Grand Total, Total on Business Unit and Total on Company.
While it is possible to edit these default styles, it is not possible to remove them or create new styles since these are automatically managed by the system. Editing a style reveals the Define Formatting dialog, and the formats can be changed in the usual way.
All other remaining styles in this list are derived from the operations functionality included within the Columns, Sorting and Grouping dialog.

InsightSoftware.com User Guide
Page 104 of 429
Headers
In addition to setting formats for subtotals, it is also possible to set formats for headers. This is done by „clicking‟ on the Headers tab and selecting the header you wish to change. The Headers tab is shown in Figure 5-63:
Figure 5-63: Defining a Header Format
Header formats are set in the same way as subtotal formats, as discussed earlier.

InsightSoftware.com User Guide
Page 105 of 429
Hierarchies
Totals and subtotals are not the only row-based formats that can be used. Individual nodes within hierarchies can also have row-based formats applied to them. Figure 5-64 illustrates the Hierarchies tab of the Formatting dialog:
Figure 5-64: Hierarchy Node Formats
Formats can be set for each node of a hierarchy.
NB NEW FORMATS CANNOT BE CREATED MANUALLY.
Editing each format is done by „clicking‟ on the Edit button and applying the required formatting in the usual manner.

InsightSoftware.com User Guide
Page 106 of 429
Hierarchies Levels
Levels within hierarchies can also have row-based formats applied to them.
Figure 5-65 illustrates the Hierarchy Levels tab of the Formatting dialog:
Figure 5-65: Hierarchy Level Formatting
Formats can be set for each level of the hierarchy. New formats cannot be created manually, but rather a new format style is automatically created by the system for each new level introduced into the hierarchy.
By the same definition, it is not possible to change any of the captions, as these are picked up directly from the name which you provide when defining the hierarchy.
Editing each format is done by „clicking‟ on the Edit button and applying the required formatting in the usual manner.

InsightSoftware.com User Guide
Page 107 of 429
Conditional Formatting
Conditional Formatting provides greater flexibility when using formatting functionality within inquiries.
This formatting is directly based on user-defined criteria within rows and columns. Therefore because conditions and report results vary, the formatting can automatically change to highlight information for additional reporting clarity.
Figure 5-66 illustrates the Conditional Formatting tab of the Formatting dialog:
Figure 5-66: Conditional Formatting

InsightSoftware.com User Guide
Page 108 of 429
To define a new set of formatting conditions, „click‟ on the New button. The Conditional Formatting dialog will open, as shown in Figure 5-67.
Figure 5-67: Create New Conditional Formatting
Enter a Name that will be a useful reference, as it will appear on the Formatting screen under the Conditional tab.

InsightSoftware.com User Guide
Page 109 of 429
The next step is to define your conditions. The Conditional Formatting dialog will initially be populated with a standard condition that you will need to override.
A condition initially consists of an item and an associated selection.
An item is a label column or dimension upon which you can choose to base your conditional format. For example, if using a General Ledger Balance Template, the default available items would be label columns, Ledger, Period and Year.
NB ITEMS THAT ARE NOT INCLUDED UNDER THE LABEL COLUMN DEFINITION ARE COLUMNS THAT
WERE PIVOTED USING PIVOT INQUIRY. IF YOU WERE TO ADD „BUSINESS UNIT‟ AS A COLUMN
THROUGH PIVOT INQUIRY, THIS WOULD BE INCLUDED WITHIN THE ITEM COMBO BOX AS WELL.
Based on the chosen item, the Selection section of the Conditional Formatting dialog is then updated with the associated parameters.
If you selected Label Columns, all of the displayed columns chosen in Columns, Sorting and Grouping will be available as a label column within the Selection section of the dialog. This is shown in Figure 5-68.
Figure 5-68: Label Columns Available for a Condition
Once you select the applicable label column, you have the option to search for either the Item or the Text.
If you use the Item option, the field below switches to a standard filter field with a Query Assist option (Figure 5-69).
Figure 5-69: Item Option Selected with Associated Query Assist

InsightSoftware.com User Guide
Page 110 of 429
If you „click‟ on the Text option as shown in Figure 5-70, the underlying field changes from the previous Query Assist to a plain text entry system.
Figure 5-70: Text Option Selected with Associated Text Entry Field
If you selected the other Item options (i.e. pivoted columns) the underlying fields will switch to a standard filter field with a Query Assist and a field with greater/lesser/equal/range functionality, as shown in Figure 5-71.
Figure 5-71: Item Option Selected
Once your condition(s) are finalized, the Apply To section specifies the way in which the formatting will be applied to the resulting data set. This can either be limited to Value Cells, Label Cells or even to the Entire Row.
Set Format is then used to specify the format that will be applied to all the conditions involved.
Use of Multiple Conditions
A single condition is useful for quick formatting; however Conditional Formatting can also work with multiple conditions.
The New and Remove functions assist with the creation of multiple conditions. „Clicking‟ on New creates another condition and likewise, Remove will remove a condition.
When there is more than one condition, the radio buttons for And and Or will be enabled as shown in Figure 5-72.
Figure 5-72: And/Or Conditional Control
Having And selected means that for data to be selected, all conditions must be fulfilled.
Having Or selected means that any of the conditions will act independently.

InsightSoftware.com User Guide
Page 111 of 429
Conditional Formatting Example
The following example (Figure 5-73) takes you through the setup of a conditional format with multiple conditions. The end goal is to format Expense Accounts for Business Unit 3 that are greater than twenty thousand.
Figure 5-73: Expense Example Inquiry
After specifying the name of the conditional format, follow the below steps.
Ensure that your Item is set to Label Columns and that the Label Column specified is Business Unit.
Within the Business Unit field, you can either directly enter the business unit (in this example, Business Unit 3) or use the associated Query Assist to select the business unit.

InsightSoftware.com User Guide
Page 112 of 429
Your conditional formatting dialog should look similar to Figure 5-74:
Figure 5-74: First Condition Specified by Conditional Format Example
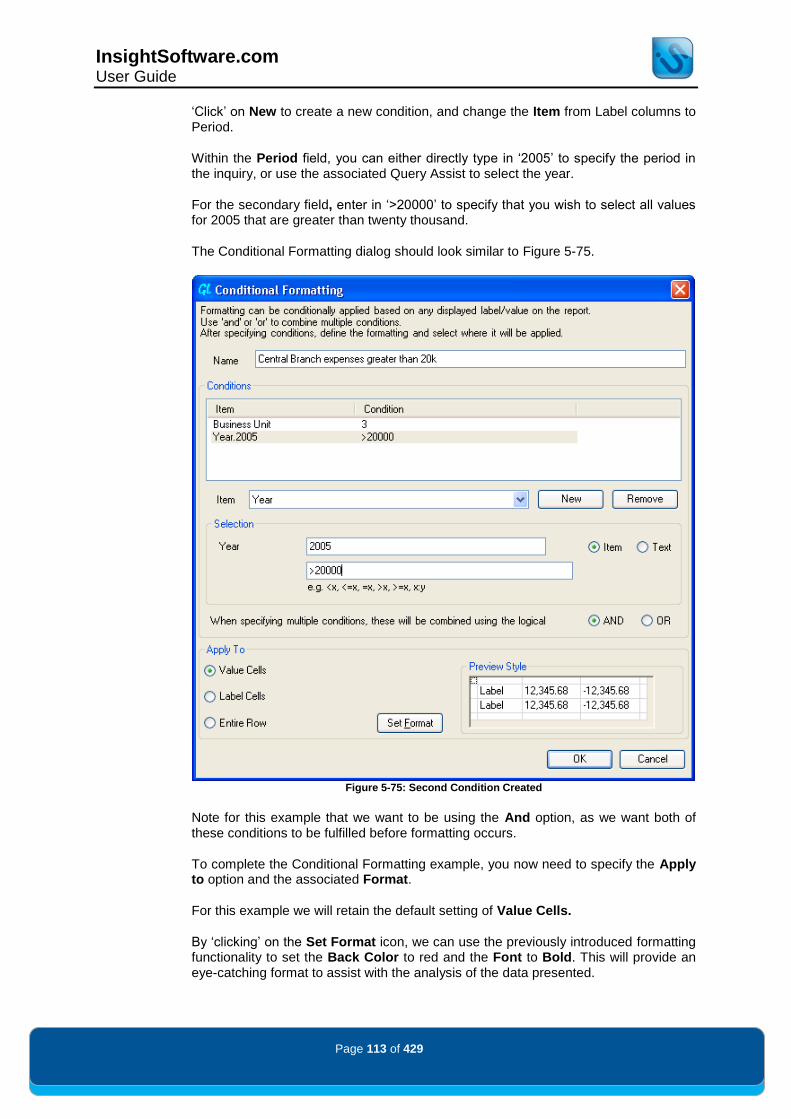
InsightSoftware.com User Guide
Page 113 of 429
„Click‟ on New to create a new condition, and change the Item from Label columns to Period.
Within the Period field, you can either directly type in „2005‟ to specify the period in the inquiry, or use the associated Query Assist to select the year.
For the secondary field, enter in „>20000‟ to specify that you wish to select all values for 2005 that are greater than twenty thousand.
The Conditional Formatting dialog should look similar to Figure 5-75.
Figure 5-75: Second Condition Created
Note for this example that we want to be using the And option, as we want both of these conditions to be fulfilled before formatting occurs.
To complete the Conditional Formatting example, you now need to specify the Apply to option and the associated Format.
For this example we will retain the default setting of Value Cells.
By „clicking‟ on the Set Format icon, we can use the previously introduced formatting functionality to set the Back Color to red and the Font to Bold. This will provide an eye-catching format to assist with the analysis of the data presented.
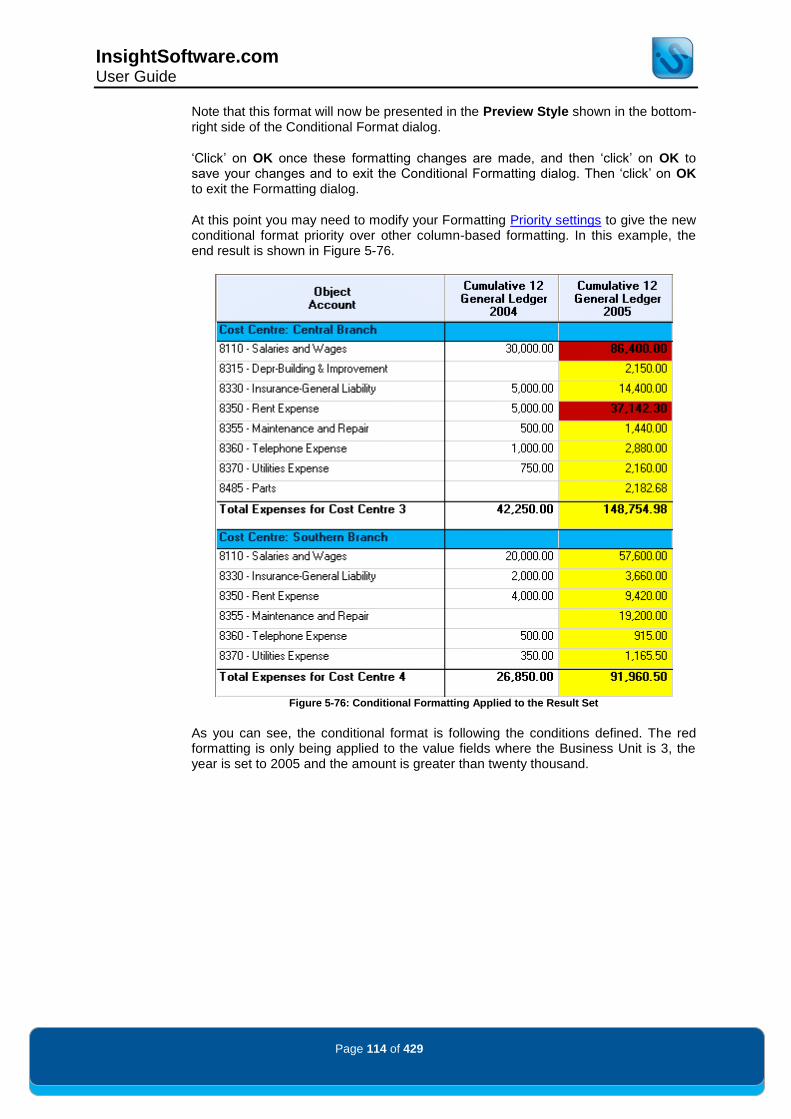
InsightSoftware.com User Guide
Page 114 of 429
Note that this format will now be presented in the Preview Style shown in the bottom-right side of the Conditional Format dialog.
„Click‟ on OK once these formatting changes are made, and then „click‟ on OK to save your changes and to exit the Conditional Formatting dialog. Then „click‟ on OK to exit the Formatting dialog.
At this point you may need to modify your Formatting Priority settings to give the new conditional format priority over other column-based formatting. In this example, the end result is shown in Figure 5-76.
Figure 5-76: Conditional Formatting Applied to the Result Set
As you can see, the conditional format is following the conditions defined. The red formatting is only being applied to the value fields where the Business Unit is 3, the year is set to 2005 and the amount is greater than twenty thousand.

InsightSoftware.com User Guide
Page 115 of 429
Stop Light Functionality
As part of conditional formatting you can also use the Stop Light functionality.
The Stop Light functionality was introduced to provide an additional user-friendly method for the normal conditional formatting process. The functionality is capable of grading data into a series of backing colors of red, yellow and green.
To create a Stop Light, „click‟ on the New Stop Light icon that exists within the Formatting Dialog under the Conditional Tab (see Figure 5-66).
This will bring up the Stop Lighting dialog shown in Figure 5-77.
Figure 5-77: Stop Light Dialog
As with standard conditional formatting, a Stop Light requires a name. „Click‟ into the text field next to Name and enter your text. Next, define what Item on which you are going to base your conditional format. By „clicking‟ the down arrow next to Item, you will be presented with available Items.
Unlike conditional formatting, the Stop Light is limited to columns that have been pivoted through Pivot Inquiry.
Once you have chosen an item, the selection area title will dynamically change to reflect your choice. For example, in Figure 5-77, the item is Ledger so the selection field title reads „Ledger‟. If your chosen item was Period, the selection field title would read „Period‟ and so on.
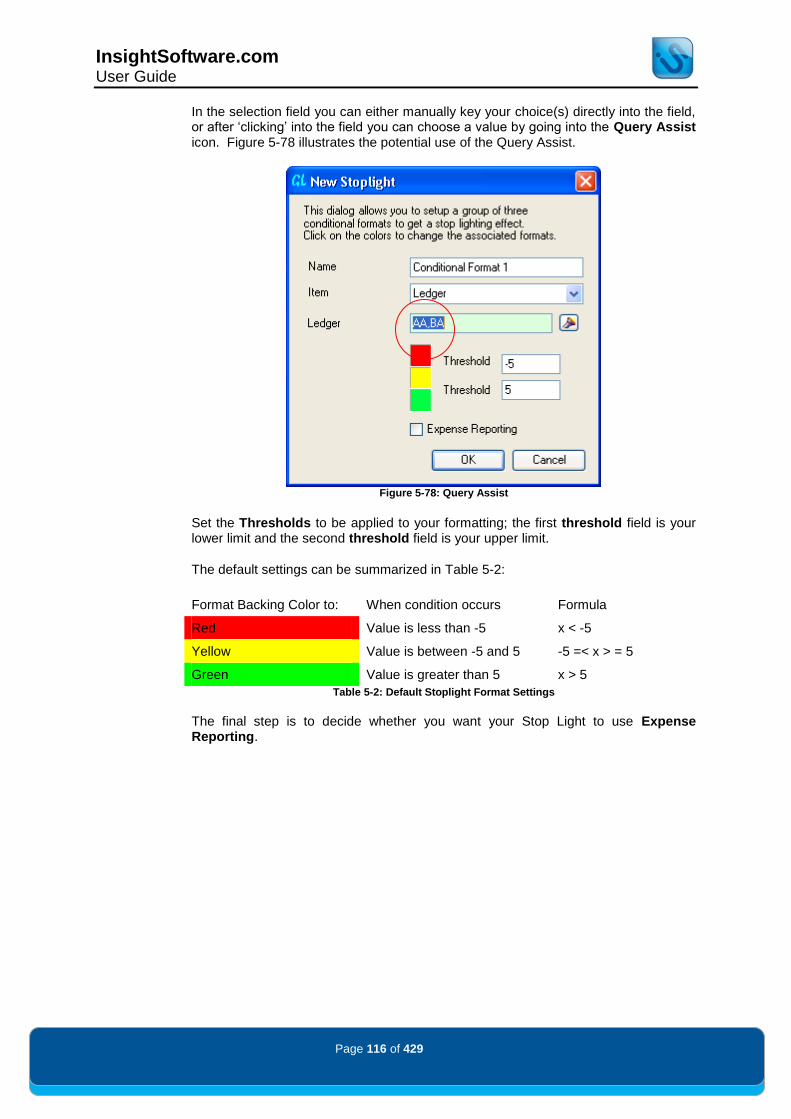
InsightSoftware.com User Guide
Page 116 of 429
In the selection field you can either manually key your choice(s) directly into the field, or after „clicking‟ into the field you can choose a value by going into the Query Assist icon. Figure 5-78 illustrates the potential use of the Query Assist.
Figure 5-78: Query Assist
Set the Thresholds to be applied to your formatting; the first threshold field is your lower limit and the second threshold field is your upper limit.
The default settings can be summarized in Table 5-2:
Format Backing Color to: When condition occurs Formula
Red Value is less than -5 x < -5
Yellow Value is between -5 and 5 -5 =< x > = 5
Green Value is greater than 5 x > 5
Table 5-2: Default Stoplight Format Settings
The final step is to decide whether you want your Stop Light to use Expense Reporting.

InsightSoftware.com User Guide
Page 117 of 429
Expense Reporting
The Expense Reporting tick box shown in Figure 5-77 allows you to activate functionality that recognizes differences in account behavior.
Within most accounting systems, double entry bookkeeping means accounts like Revenues will be recorded as a negative figure; likewise expenses are recorded as positive figures. Within JD Edwards™ this polarization also takes place.
With the Stop Light functionality, we set negative values below a threshold to be red and positive values above a threshold to green.
With Revenues, Expenses and other accounts, the Stop Lighting functionality needs to be reversed. Revenue accounts should be set to green if they have a negative amount, and likewise expense should be set to red if they are negative as this is an incorrect state for an expense account. By enabling Expense Reporting, the underlying system switches the formatting to take this into account.
This is done through the use of Automatic Accounting Instructions (AAI) held within the JD Edwards™ ERP system.
Technical Explanation
The identification of accounts that need to have their formatting changed is done through the use of a specific AAI. An AAI is used by JD Edwards™ to provide accounting structures for specific object accounts and to allow processes like Annual/Monthly closes.
The following table is only a subset of all AAIs provided by JD Edwards™.
NB A STANDARD AAI SERIES IS CRITICAL FOR THE EXPENSE REPORTING FUNCTIONALITY TO
WORK CORRECTLY.
AAI Description
GLG3 Beginning Assets
GLG4 Retained Earnings
GLG6 Beginning Revenues
GLG7 Ending Revenues
GLG11 Beginning Other Income
GLG13 Beginning Other Expenses
Table 5-3: Standard AAIs
Using the above AAIs, the Expense Reporting feature will reverse the formatting for any object accounts that fit into the following:
Equal to or greater than GLG3, but less than GLG4 -1
Equal to or greater than GLG6 up to GLG7 (Including GLG7)
Equal to or greater than GLG11 but less than GLG13 -1 For example, if GLG3 was linked to Object Account 4000 and GLG4 was linked to Object Account 4980, the range of object accounts to be formatted differently would be 4000:4979

InsightSoftware.com User Guide
Page 118 of 429
Example
In the example shown in Figure 5-79, we are using the Stop Light feature to highlight half-year revenue and expense figures from one Business Unit.
Figure 5-79: Stop Light Example
The Stop Light shown above will highlight with the following ranges:
Red – Less than zero
Yellow – Greater or equal to zero, equal to or less than 200,000
Green – Greater than 200,000
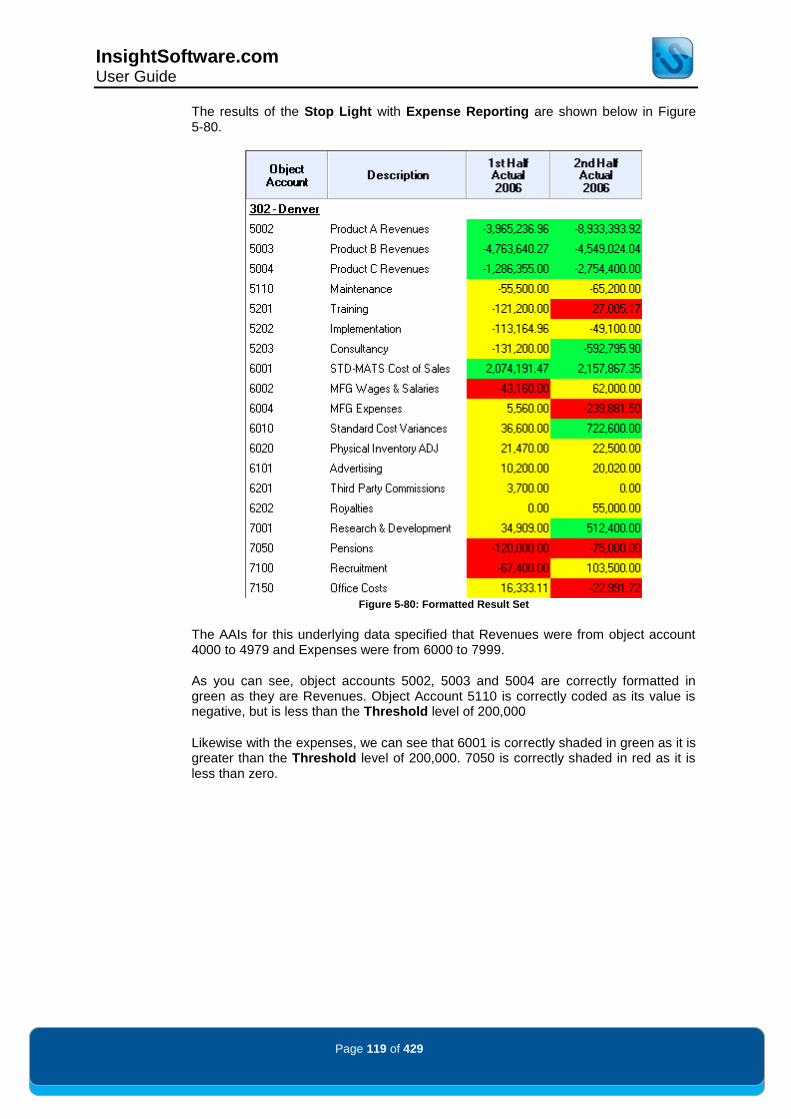
InsightSoftware.com User Guide
Page 119 of 429
The results of the Stop Light with Expense Reporting are shown below in Figure 5-80.
Figure 5-80: Formatted Result Set
The AAIs for this underlying data specified that Revenues were from object account 4000 to 4979 and Expenses were from 6000 to 7999.
As you can see, object accounts 5002, 5003 and 5004 are correctly formatted in green as they are Revenues. Object Account 5110 is correctly coded as its value is negative, but is less than the Threshold level of 200,000
Likewise with the expenses, we can see that 6001 is correctly shaded in green as it is greater than the Threshold level of 200,000. 7050 is correctly shaded in red as it is less than zero.

InsightSoftware.com User Guide
Page 120 of 429
Default Formats
In addition to the individual format styles, it is possible to set a default style that applies to all the label or data columns within an inquiry.
To set a default style, „click‟ on the Defaults tab within the Formatting dialog as shown in Figure 5-81:
Figure 5-81: Default Formats
Highlight the default that you wish to change (labels or numbers), „click‟ on the Edit button and the standard dialog for defining formats will appear. Set the formats in the usual way and „click‟ on the OK button to return to the main format dialog.
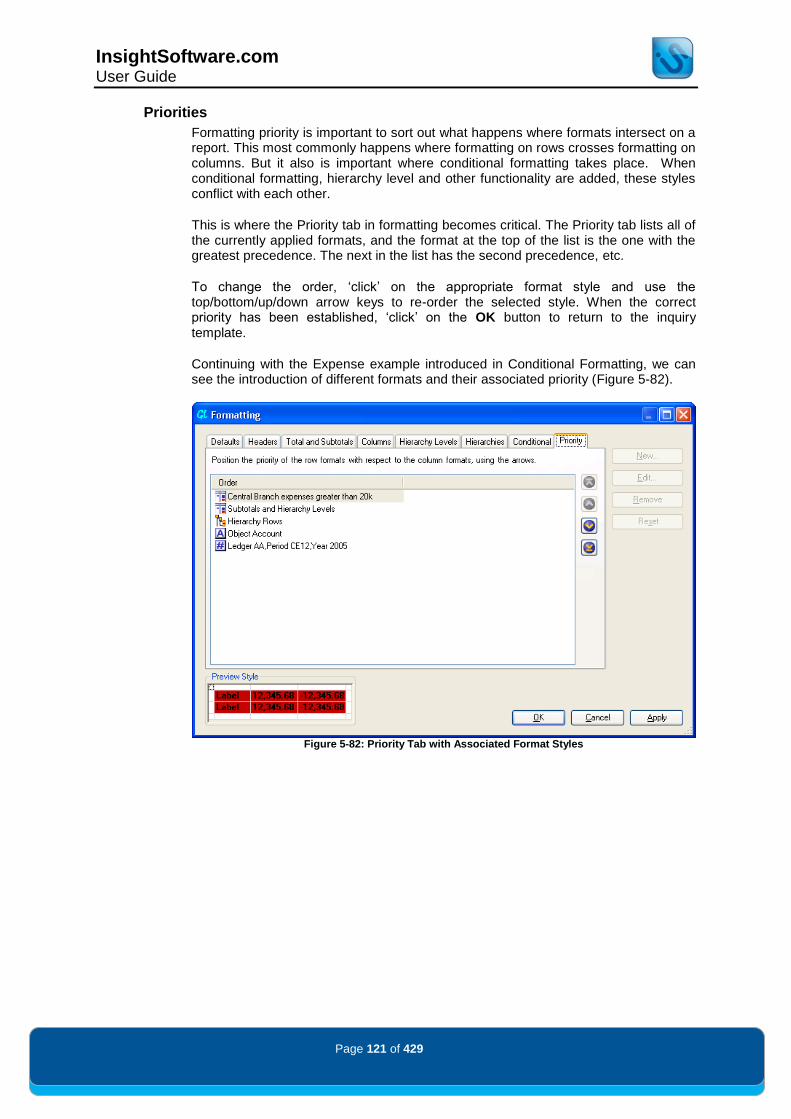
InsightSoftware.com User Guide
Page 121 of 429
Priorities
Formatting priority is important to sort out what happens where formats intersect on a report. This most commonly happens where formatting on rows crosses formatting on columns. But it also is important where conditional formatting takes place. When conditional formatting, hierarchy level and other functionality are added, these styles conflict with each other.
This is where the Priority tab in formatting becomes critical. The Priority tab lists all of the currently applied formats, and the format at the top of the list is the one with the greatest precedence. The next in the list has the second precedence, etc.
To change the order, „click‟ on the appropriate format style and use the top/bottom/up/down arrow keys to re-order the selected style. When the correct priority has been established, „click‟ on the OK button to return to the inquiry template.
Continuing with the Expense example introduced in Conditional Formatting, we can see the introduction of different formats and their associated priority (Figure 5-82).
Figure 5-82: Priority Tab with Associated Format Styles
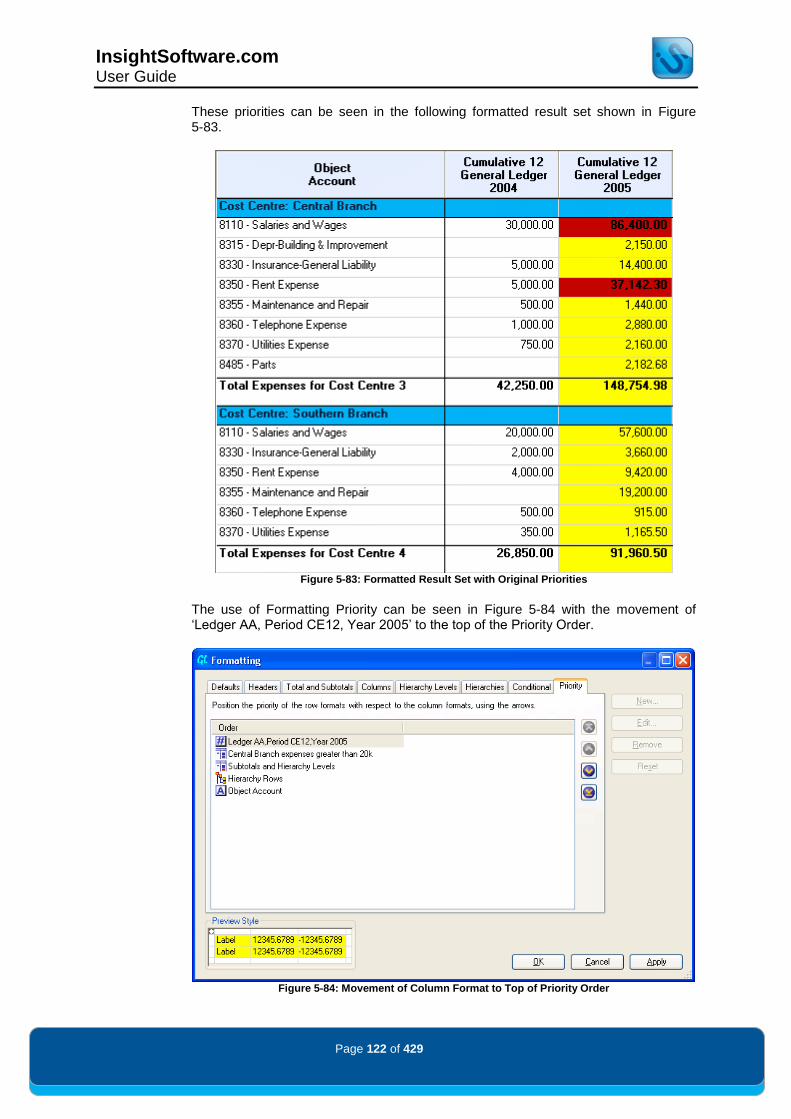
InsightSoftware.com User Guide
Page 122 of 429
These priorities can be seen in the following formatted result set shown in Figure 5-83.
Figure 5-83: Formatted Result Set with Original Priorities
The use of Formatting Priority can be seen in Figure 5-84 with the movement of „Ledger AA, Period CE12, Year 2005‟ to the top of the Priority Order.
Figure 5-84: Movement of Column Format to Top of Priority Order

InsightSoftware.com User Guide
Page 123 of 429
As you can see in Figure 5-85, the Header formatting associated with „Subtotal Rows and Hierarchy Levels‟ and also the Conditional Formatting associated with „Central Branch expenses greater than 20k‟ is now obscured by the column formatting.
Figure 5-85: Formatted Result Set with Revised Priorities

InsightSoftware.com User Guide
Page 124 of 429
Descriptions Within Insight
®, it is possible to display the descriptions alongside codes for certain
columns in the inquiry result set. Company, Business Unit and Subledger are just some of the items for which is it possible to display associated descriptions.
Note: Descriptions are not available on user-defined Subledgers (X, Y and Z).
These descriptions can be consistently applied across all of the modules using the Descriptions dialog shown in Figure 5-86. „Click‟ on the Descriptions icon on the Design Ribbon Tab to do this. Alternatively, „right-click‟ on the column and select the Descriptions option:
Figure 5-86: Descriptions Dialog
The panel on the left organizes different filters and attributes into groups. There will always be a Main Filters option containing the key filters which drive the particular inquiry template being used.
The other groups vary from one inquiry template to the next. Each group can be expanded to show the next level of detail. For example, the Business Unit group is further organized into Attribute and Category, representing the attributes and category codes of the Business Unit. Once a group has been selected, the dimensions which belong to that group are shown.

InsightSoftware.com User Guide
Page 125 of 429
To set a particular item, first highlight it and then select one of the following:
Code: Displays only the code associated with the filter.
Description: Displays only the description associated with the filter.
Code and Description: Displays both the code and description associated with the filter.
Custom: Provides a method of defining custom descriptions with specific text strings.
To open the associated dialog (Figure 5-87),‟click‟ on a particular Item, „click‟ on the Custom radio button and then „click‟ the Customize button.
Figure 5-87: Custom Description Setting Dialog for Business Unit
Different descriptions can be modified via the Add, Edit and Remove buttons. However please note that only the Description Detail that is top of the list will be applied.
„Click‟ OK to return back to the main Description Dialog.
You also have the option of showing a description for any blank items by „checking‟ the Show Blank Code Description box in the lower right-hand corner of the dialog.
You can choose to show codes, descriptions, or a combination of codes and descriptions for items in rows or in column headings.

InsightSoftware.com User Guide
Page 126 of 429
Setting Titles Within each inquiry it is possible to set a title. This title can subsequently be shown on screen and can be included in any export to Excel or printed output to PDF.
To set a title, „click‟ on the Set Title icon which exists within the Design Ribbon Tab. This produces a dialog as shown in Figure 5-88.
Figure 5-88: Inquiry Title Dialog
A title can be comprised of static text and dynamic selections, based on the settings within particular inquiry filters. Type text in the title edit box at the top of the dialog. This can be combined with dynamic selections by picking elements from the drop down list of filters and „clicking‟ on the Add button.
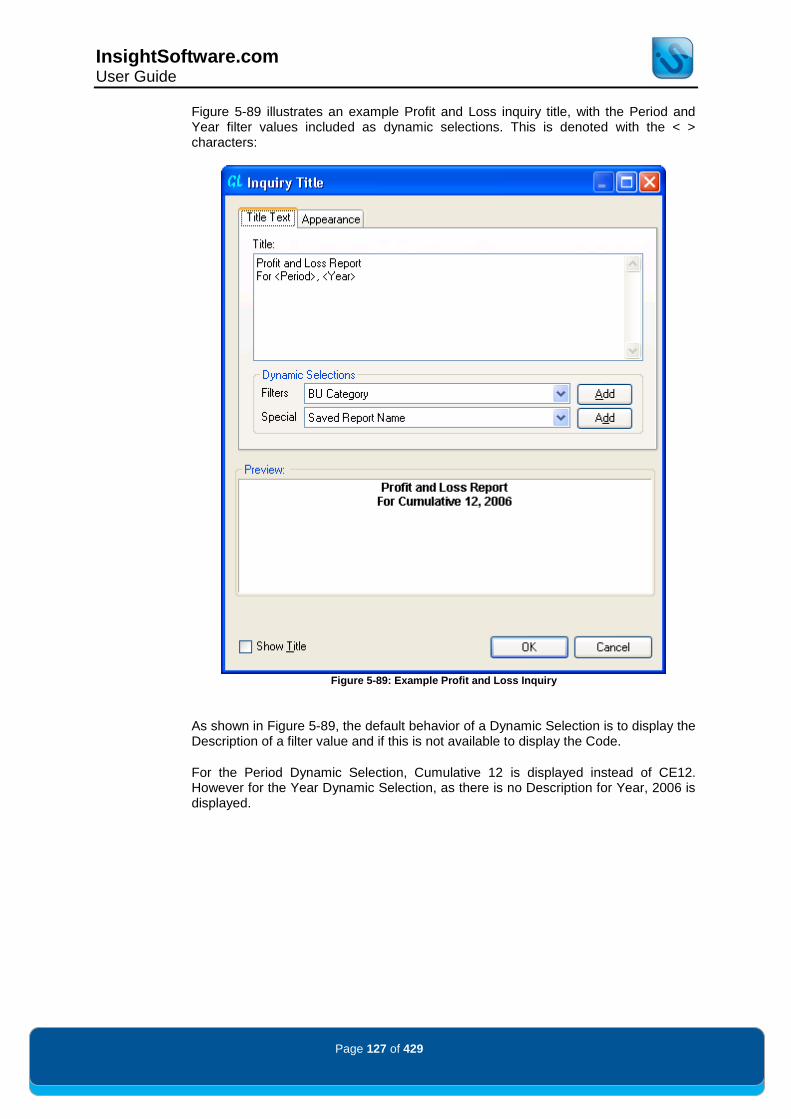
InsightSoftware.com User Guide
Page 127 of 429
Figure 5-89 illustrates an example Profit and Loss inquiry title, with the Period and Year filter values included as dynamic selections. This is denoted with the < > characters:
Figure 5-89: Example Profit and Loss Inquiry
As shown in Figure 5-89, the default behavior of a Dynamic Selection is to display the Description of a filter value and if this is not available to display the Code.
For the Period Dynamic Selection, Cumulative 12 is displayed instead of CE12. However for the Year Dynamic Selection, as there is no Description for Year, 2006 is displayed.
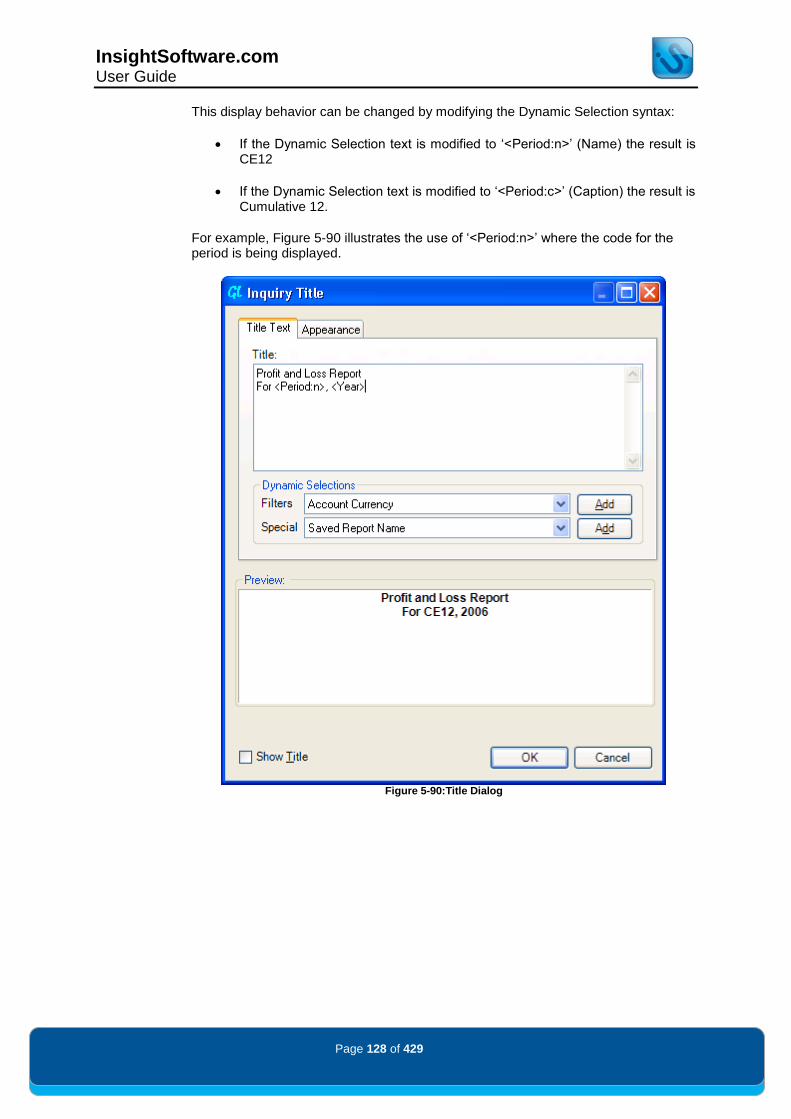
InsightSoftware.com User Guide
Page 128 of 429
This display behavior can be changed by modifying the Dynamic Selection syntax:
If the Dynamic Selection text is modified to „<Period:n>‟ (Name) the result is CE12
If the Dynamic Selection text is modified to „<Period:c>‟ (Caption) the result is Cumulative 12.
For example, Figure 5-90 illustrates the use of „<Period:n>‟ where the code for the period is being displayed.
Figure 5-90:Title Dialog

InsightSoftware.com User Guide
Page 129 of 429
Dynamic Selections can also be edited to manage multiple items selected in a filter. Figure 5-91 shows the Title Preview when the Period Filter is populated with 4 Cumulative Periods, CE3, CE6, CE9 and CE12.
Figure 5-91: Title Preview with multiple items in an associated filter
Using the example above, we need to only display one of the items in the Period Filter. Dynamic Selections can be used to only display the third Period in the filter by modifying the syntax to „<Period:n:3>‟, as shown in Figure 5-92.
Figure 5-92: One period selector displayed through the use of Dynamic Selectors

InsightSoftware.com User Guide
Page 130 of 429
When the title has been set, it is possible to change its display by clicking on the Appearance tab as per Figure 5-93.
Figure 5-93: Appearance Tab of Inquiry Title Dialog
All the options here follow the standard formatting controls. At all times you can see a preview of how the title will appear at the bottom of the dialog. When all of the settings have been completed, „click‟ on the OK button to return to the inquiry template.

InsightSoftware.com User Guide
Page 131 of 429
Option Switches Within the Design Ribbon Tab, there are several toggle switches in the Options section. These tick boxes activate and de-activate certain features within the inquiry result set. They enable/disable the following functions:
Grand Total
Totals
Headers
Hide Detail sets whether headers and totals display without the detail lines A report showing details:
Figure 5-94: Hide Detail Disabled
A report hiding details:
Figure 5-95: Hide Detail Enabled
Zero Balances
The Sort by Values switches between the Sort By Labels (disabled) and Sort By Values (enabled) options.
Missing Balances is only available if the associated capability has been enabled for the associated user or group. (Please refer to the Administration and Configuration Guide for setting this capability.)

InsightSoftware.com User Guide
Page 132 of 429
Result Set Pop-up Menu The various features described in this section of the guide are also available by „right-clicking‟ on a column within the result set. Depending upon whether you „click‟ on a label column or a value column, certain options will be available. A complete list is shown below:
Format Column: Allows you to apply a formatting style to the column. This action can also be achieved in the Formatting dialog.
Remove Column: Deletes the column from the result set. This action can also be achieved in the Columns, Sorting & Grouping dialog.
Hide Column: Hides the column in the result set. This action can also be achieved in the Columns, Sorting & Grouping dialog.
Freeze Column: Freezes all left-most columns from this point, which means when scrolling occurs, those columns always remain displayed on screen.
Descriptions: Allows you to switch between the Descriptions settings of „Code‟, „Description‟ and „Code and Description”. This action can also be achieved in the Description dialog.
Set Column Heading: Allows you to enter a heading for the associated column. This action can also be achieved in the Columns, Sorting & Grouping dialog.
Follow Links: Allows you to drill down or „drill across‟ to other linked inquiries. A list of links is provided on a sub-menu. This action is also available by „double-clicking‟ on a row in the result set.

InsightSoftware.com User Guide
Page 133 of 429
In addition to the basic inquiry capability of the product, Insight
® can also be used to
perform true, real time aggregations of data. This is extremely useful in delivering high level management information that is derived from the base data held within the JD Edwards™ system.
By default, when performing an inquiry, the result set is shown with all the key filter columns displayed. For example, in the Balances Template of the General Ledger module, details of the Company, Business Unit, Object Account and Subsidiary are shown, together with the description of the Business Unit/Object Account/Subsidiary. This is shown in Figure 6-1:
Figure 6-1: Main Filter Columns within the Inquiry Result Set
By including these columns in the result set, you can see a detailed breakdown of each summary balance. For example, in Figure 6-2 you can see how the Object Accounts 5010 – Store Sales and 5020 – Direct Ship Sales are broken down with the respective values shown for each Company, Business Unit, etc. (Please note in this screen shot we have disabled the Totals and Grand Totals.)
Figure 6-2: A Non-Aggregated Result Set Based on Object Account

InsightSoftware.com User Guide
Page 134 of 429
However, there are occasions when producing the total for each object account is all that is required. By summarizing this information, you can see a high-level picture of the same data without having to examine all the detail. This summarized information can be derived using the Columns, Sorting and Grouping dialog shown in Figure 6-3:
Figure 6-3: Columns, Sorting and Grouping Dialog
The data is essentially aggregated by removing the columns you do not wish to see within the result set, and including those which you wish to aggregate.
For example, removing all of the columns with the exception of the Object Account and its description, would aggregate the data across all Companies and Business Units to produce a total for each Object Account.

InsightSoftware.com User Guide
Page 135 of 429
The range of accounts can be filtered in the usual way. Figure 6-4 shows the results of an aggregation of all revenue accounts within the range of 5000 to 6000 across all Companies and Business Units. Figure 6-5 illustrates the settings within the Columns Sorting and Grouping dialog to achieve this aggregated result set:
Figure 6-4: Aggregation by Object Account
Figure 6-5: Aggregation by Object Account Settings

InsightSoftware.com User Guide
Page 136 of 429
This concept can be applied to any column. For example, if you then wanted to view the same revenue accounts, but this time consolidated by Business Unit, the Business Unit rather than the Object Account/Description fields would be selected in the Columns, Sorting and Grouping dialog, as shown in Figure 6-6 and Figure 6-7.
Figure 6-6: Aggregation by Business Unit
Figure 6-7: Aggregation by Business Unit Settings

InsightSoftware.com User Guide
Page 137 of 429
Subtotaling When aggregating the data by a single item, such as Object Account or Business Unit (as in the previous examples), the result set will aggregate up to a single figure for each Object Account or Business Unit respectively.
As a result, the use of the Totals feature is not advisable, as it will duplicate the total for each line item in the result set (see Figure 6-8). It is therefore advisable to switch the Totals feature off when aggregating over single items:
Figure 6-8: Aggregations with Totals Enabled

InsightSoftware.com User Guide
Page 138 of 429
Multiple Aggregations The aggregation feature also works across multiple items. For example, Figure 6-9 illustrates a combination of two Business Unit Category Codes being used to aggregate revenue detail; firstly to produce aggregated divisional totals and then subsequently by region, before finally providing a breakdown by Business Unit:
Figure 6-9: Multiple Aggregations by Business Unit Category Code
When using multiple aggregation items, the use of subtotaling becomes relevant again since it is useful to provide overall totals by division and region in the aforementioned example. The order and sequencing is also relevant when working with multiple items.

InsightSoftware.com User Guide
Page 139 of 429
Figure 6-10 illustrates the order in which the items are presented, and Figure 6-11 illustrates the sequence in which the data is presented:
Figure 6-10: Multiple Aggregations by Business Unit Category Code Settings
Figure 6-11: Multiple Aggregations by Business Unit Category Sequencing
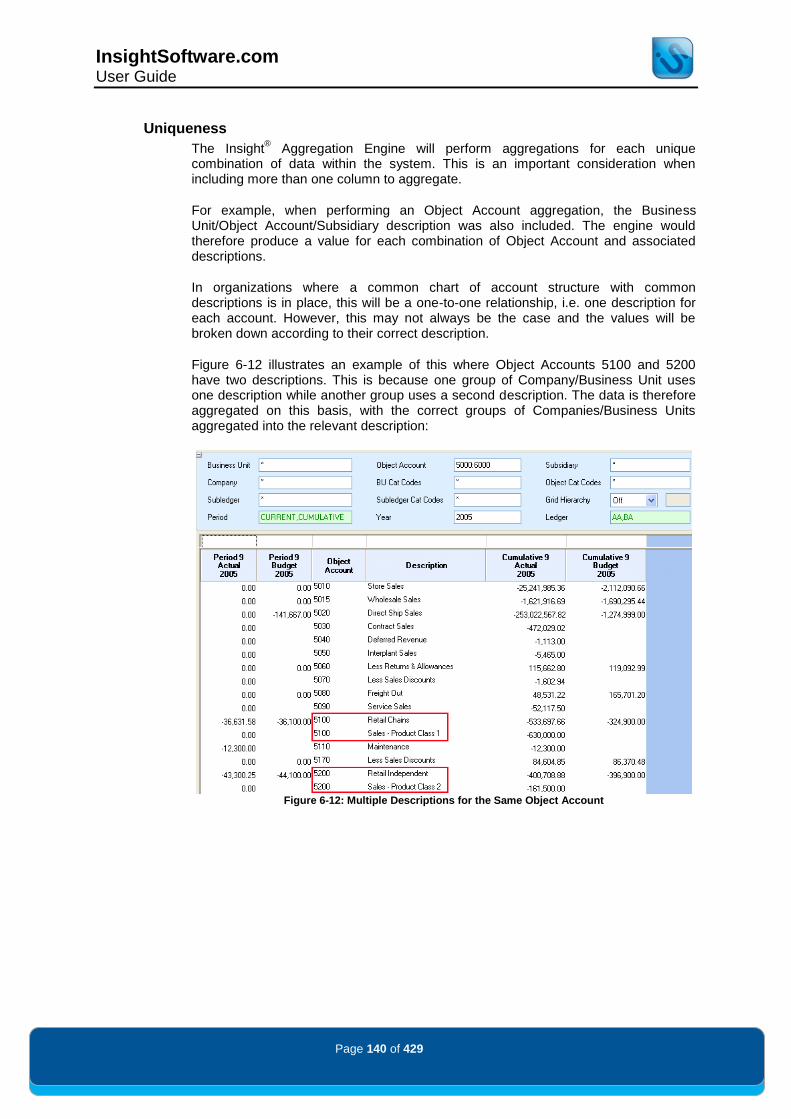
InsightSoftware.com User Guide
Page 140 of 429
Uniqueness
The Insight® Aggregation Engine will perform aggregations for each unique
combination of data within the system. This is an important consideration when including more than one column to aggregate.
For example, when performing an Object Account aggregation, the Business Unit/Object Account/Subsidiary description was also included. The engine would therefore produce a value for each combination of Object Account and associated descriptions.
In organizations where a common chart of account structure with common descriptions is in place, this will be a one-to-one relationship, i.e. one description for each account. However, this may not always be the case and the values will be broken down according to their correct description.
Figure 6-12 illustrates an example of this where Object Accounts 5100 and 5200 have two descriptions. This is because one group of Company/Business Unit uses one description while another group uses a second description. The data is therefore aggregated on this basis, with the correct groups of Companies/Business Units aggregated into the relevant description:
Figure 6-12: Multiple Descriptions for the Same Object Account

InsightSoftware.com User Guide
Page 141 of 429
Showing the Detail When using the aggregation feature, a common requirement is to be able to link or drill down to the underlying detail. Since each number is an aggregation, being able to break down a value into its constituent summary balance is highly desirable.
In the case of aggregated inquiries, default links are included within some of the standard templates. (For the GL Period Summary template, the option is Show Details; for the GL Balances template, the option is Default Balances View.)
To access these default links, „right-click‟ the specified row in the result set and then select either Default Balances View or Show Details from the Follow links pop-up menu. The option for the GL Balances Template is shown in Figure 6-13.
Figure 6-13: Default Balances Link Available Option
Having executed the Follow Link Show Details option, a new inquiry view is created showing the summary details, as shown in Figure 6-14. This acts as a normal inquiry template from which you can subsequently drill down to the transactional detail, if required:
Figure 6-14: Underlying Summary Values by Business Unit

InsightSoftware.com User Guide
Page 142 of 429
Transactional Aggregations The aggregation capability is not just restricted to summary balances, but can also be used with transactional and other inquiries throughout the product. Again, the Columns Sorting and Grouping dialog is made available, and you can create the aggregated inquiry by removing columns in the same way as you would when working with summary balances.
Figure 6-15 illustrates an example aggregated transactional inquiry based on document types and document numbers in the General Ledger module. Figure 6-16 shows the selections made to achieve this.
Figure 6-15: Transaction Aggregated Inquiry
Figure 6-16: Transactional Aggregated Inquiry Settings

InsightSoftware.com User Guide
Page 143 of 429
This chapter focuses on the general management and storage of user inquiries. For saving/loading inquiries and sharing them with other users, the product uses a storage facility known as a Repository. This Repository is set up by the system administrator when Insight
® is first installed. The dialogs and controls for opening and
saving inquiries to the Repository are similar to those used to access files elsewhere within Windows™.
Icon Function Description
Back Go back to the last selection within the tree
Forward After using „Back‟, go to your most recent
selections
Up To Parent Move your selection up the tree directly to the
parent level
Go To Your Folder
Return to your own „My Inquiries‟ folder
Create New Folder
Create a new folder
Copy Copy the selected object to the clipboard
Cut Cut the selected object from its current location to
the clipboard
Paste Paste from the clipboard
Delete Delete the selected object
Refresh Refresh the dialog‟s contents
Show/Hide the Workspace Tree
Show/Hide the workspace tree on the left side of the dialog
View Switches from Details to List view
Table 7-1: Functions to Manage Inquiries

InsightSoftware.com User Guide
Page 144 of 429
Saving Inquiries Inquiries can be saved at any point using the Save icon on the Quick Access Tool Bar, via the IS Button or through the Home Ribbon Tab. If the inquiry has not been previously saved, you are presented with the Save Inquiry As dialog, shown in Figure 7-1 below.
Figure 7-1: Save As Inquiry Dialog
When you save an inquiry for the first time, you will not see any other objects within the dialog. This is due to the way that they are inside their own personal My Inquiries folder. By default, this dialog will initially open within your own „My Inquiries‟ folder.
To save an inquiry, provide an inquiry name by typing the desired name into the Name box and „click‟ on the OK button.
You can create folders within your My Inquiries folder. As the number of created inquiries grows, it becomes more convenient to organize them into folders.
To create a folder, „click‟ on the Create New Folder icon. This will open the following New Folder dialog. Enter in the name of your folder as shown in Figure 7-2.
„Click‟ on OK to return back to the Save Inquiry As dialog.
Figure 7-2: New Folder Dialog
Your new folder can be renamed by „right-clicking‟ on the folder name and selecting the Rename option. Type the new name (In this example „Balance Sheet‟) and press OK.
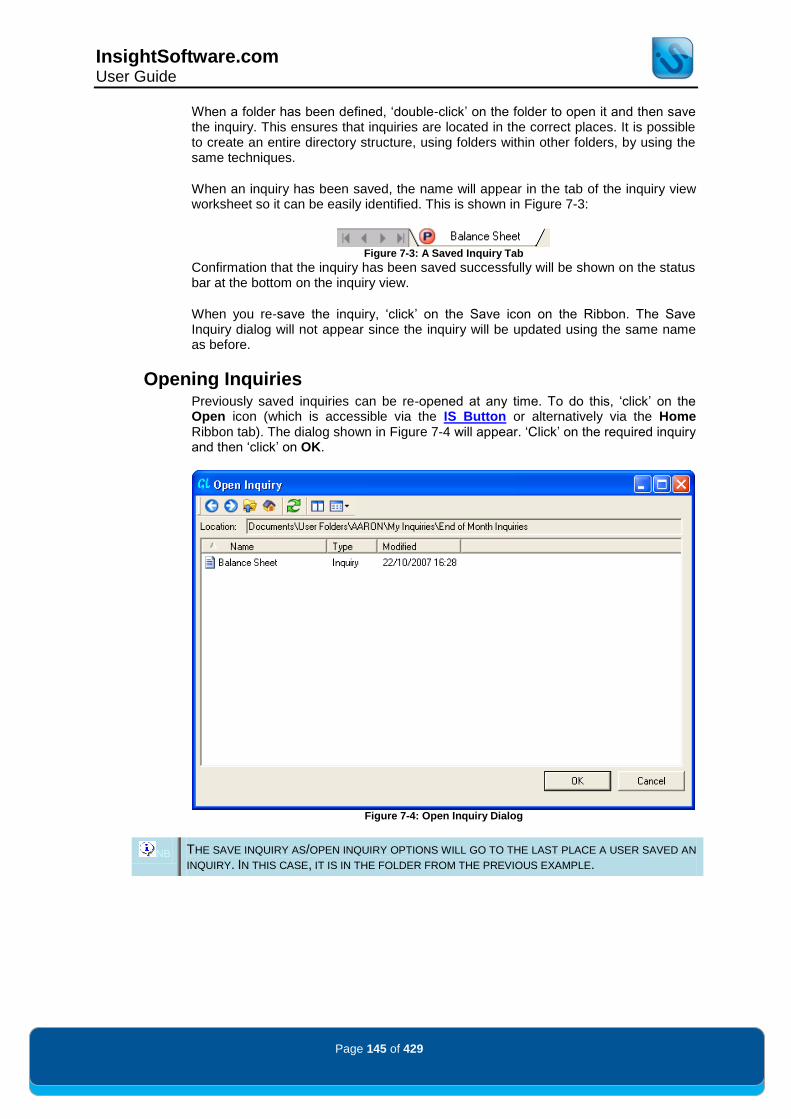
InsightSoftware.com User Guide
Page 145 of 429
When a folder has been defined, „double-click‟ on the folder to open it and then save the inquiry. This ensures that inquiries are located in the correct places. It is possible to create an entire directory structure, using folders within other folders, by using the same techniques.
When an inquiry has been saved, the name will appear in the tab of the inquiry view worksheet so it can be easily identified. This is shown in Figure 7-3:
Figure 7-3: A Saved Inquiry Tab
Confirmation that the inquiry has been saved successfully will be shown on the status bar at the bottom on the inquiry view.
When you re-save the inquiry, „click‟ on the Save icon on the Ribbon. The Save Inquiry dialog will not appear since the inquiry will be updated using the same name as before.
Opening Inquiries Previously saved inquiries can be re-opened at any time. To do this, „click‟ on the Open icon (which is accessible via the IS Button or alternatively via the Home Ribbon tab). The dialog shown in Figure 7-4 will appear. „Click‟ on the required inquiry and then „click‟ on OK.
Figure 7-4: Open Inquiry Dialog
NB THE SAVE INQUIRY AS/OPEN INQUIRY OPTIONS WILL GO TO THE LAST PLACE A USER SAVED AN
INQUIRY. IN THIS CASE, IT IS IN THE FOLDER FROM THE PREVIOUS EXAMPLE.

InsightSoftware.com User Guide
Page 146 of 429
Open and Save - Folder Management Just as in Windows™, it is possible to carry out folder management from within the Save Inquiry As/Open Inquiry dialogs.
The folder structure can be revealed by navigating through the folders and sub-folders by „double-clicking‟ on them. Alternatively, by selecting Show/Hide the Workspace Tree, the dialog changes to show the Workspace, as shown in Figure 7-5.
Figure 7-5: Open Inquiry Dialog with Workspace Tree Enabled
Just as it is possible to rename a folder, inquiries can also be renamed. This is done by „right-clicking‟ on the inquiry that you want to rename and selecting the Rename option.
From the same pop-up menu, it is also possible to delete any unwanted inquiries or folders. If the Delete option is selected, you will be prompted with an „Are you sure you want to delete „x‟?‟ message (Figure 7-6).
Figure 7-6: Confirm Deletion Dialog

InsightSoftware.com User Guide
Page 147 of 429
It is also possible to change how inquiries and folders are represented by „clicking‟ on the down arrow to the right of the View icon. This forms part of the standard Windows™ functionality to view the contents of the Repository in Details or List mode. Details mode is shown below in Figure 7-7.
Figure 7-7: Detail Mode List

InsightSoftware.com User Guide
Page 148 of 429
NB MOST DIALOGS WITHIN INSIGHT ARE CAPABLE OF BEING RESIZED TO FIT THE PRESENTED DATA
(AS SHOWN IN FIGURE 7-8).
Figure 7-8: Stretched Open Inquiry Dialog
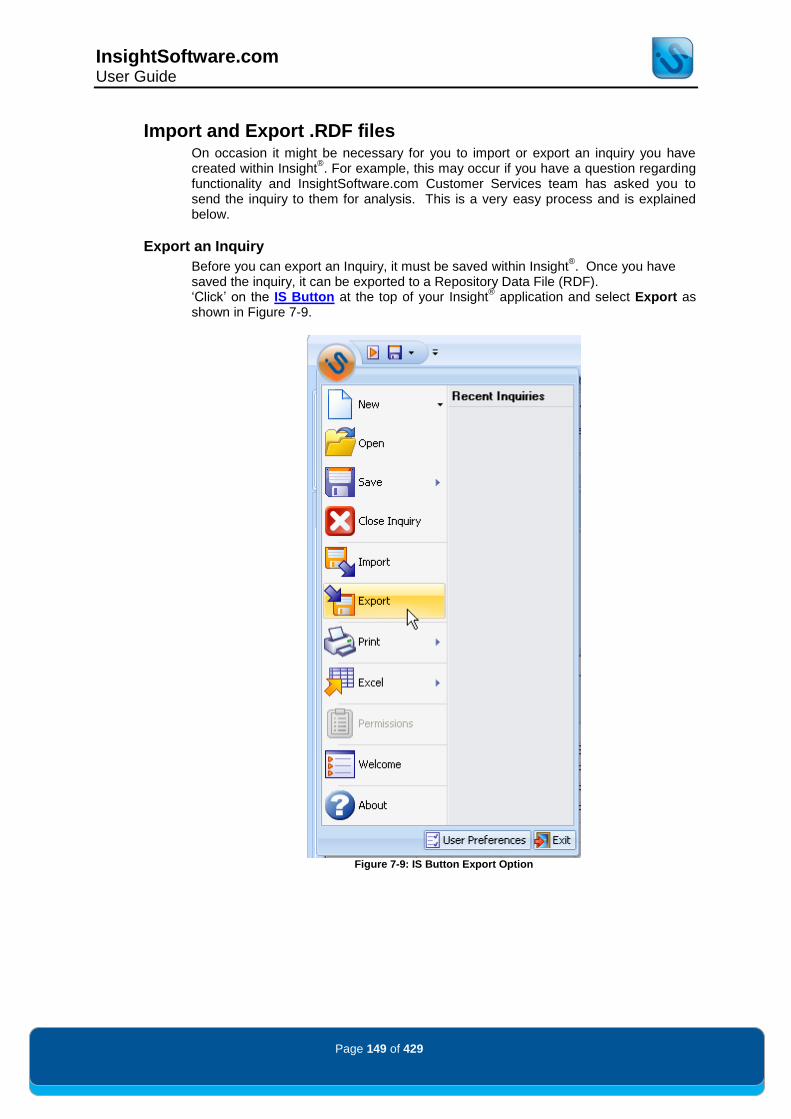
InsightSoftware.com User Guide
Page 149 of 429
Import and Export .RDF files On occasion it might be necessary for you to import or export an inquiry you have created within Insight
®. For example, this may occur if you have a question regarding
functionality and InsightSoftware.com Customer Services team has asked you to send the inquiry to them for analysis. This is a very easy process and is explained below.
Export an Inquiry
Before you can export an Inquiry, it must be saved within Insight®. Once you have
saved the inquiry, it can be exported to a Repository Data File (RDF). „Click‟ on the IS Button at the top of your Insight
® application and select Export as
shown in Figure 7-9.
Figure 7-9: IS Button Export Option

InsightSoftware.com User Guide
Page 150 of 429
This will display the dialog shown in Figure 7-10.
Figure 7-10: Save Exported Inquiry
After exporting an inquiry, the .RDF file can now be attached to an email or saved for later use.

InsightSoftware.com User Guide
Page 151 of 429
Import an Inquiry
To import an .RDF inquiry file, you need to „click‟ on the IS Button at the top of your Insight
® application and select Import as shown in Figure 7-11.
Figure 7-11: IS Button Import Option
After selecting Import, navigate to the .RDF file that you want to import and „click‟ Open.
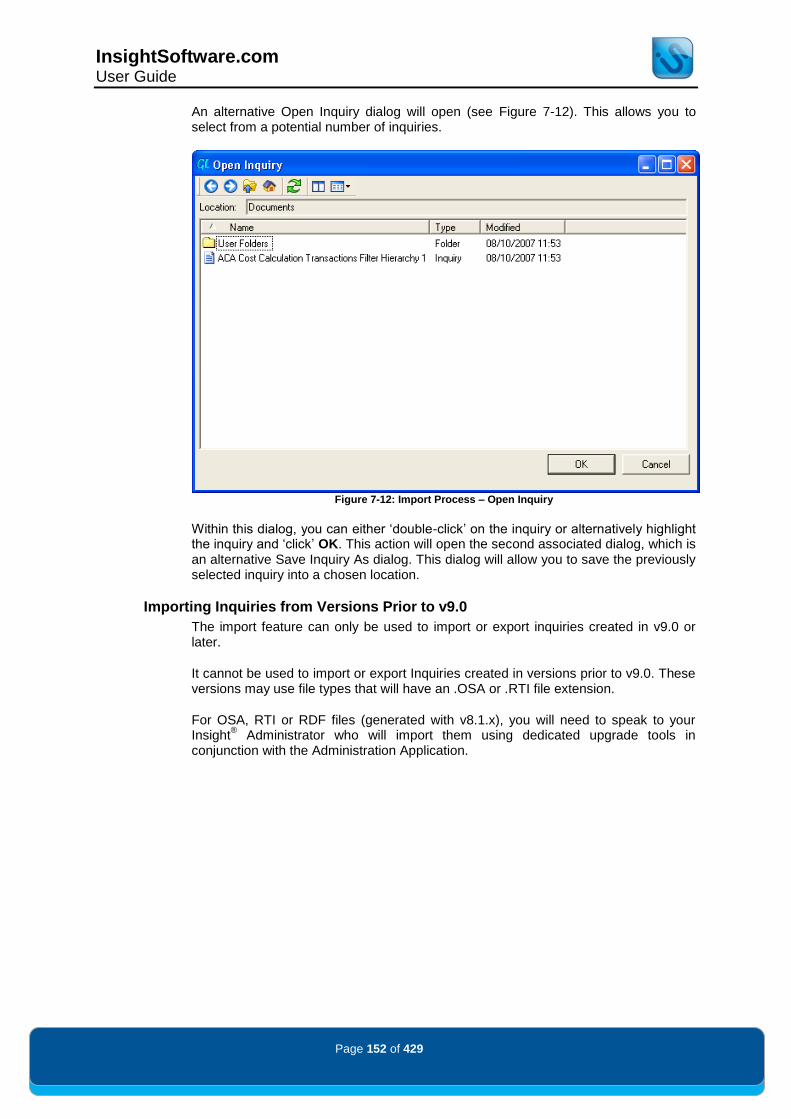
InsightSoftware.com User Guide
Page 152 of 429
An alternative Open Inquiry dialog will open (see Figure 7-12). This allows you to select from a potential number of inquiries.
Figure 7-12: Import Process – Open Inquiry
Within this dialog, you can either „double-click‟ on the inquiry or alternatively highlight the inquiry and „click‟ OK. This action will open the second associated dialog, which is an alternative Save Inquiry As dialog. This dialog will allow you to save the previously selected inquiry into a chosen location.
Importing Inquiries from Versions Prior to v9.0
The import feature can only be used to import or export inquiries created in v9.0 or later.
It cannot be used to import or export Inquiries created in versions prior to v9.0. These versions may use file types that will have an .OSA or .RTI file extension.
For OSA, RTI or RDF files (generated with v8.1.x), you will need to speak to your Insight
® Administrator who will import them using dedicated upgrade tools in
conjunction with the Administration Application.

InsightSoftware.com User Guide
Page 153 of 429
Closing Inquiries Inquiries are closed by „clicking‟ on the IS Button and selecting Close as shown in Figure 7-13. Alternatively, you can also select Close from within the Home Ribbon Tab.
Figure 7-13: IS Button Close Inquiry Option
This closes the active inquiry template within the active module. It also closes inquiries currently in memory; their definitions, which are stored in the inquiry Repository, are unaffected. Before an inquiry is closed, you will be prompted to confirm whether you are sure that this is what you wish to do (as per Figure 7-14).
Figure 7-14: Close Inquiry Prompt Dialog

InsightSoftware.com User Guide
Page 154 of 429
Permissions
Permission Introduction
When an inquiry has been saved, it is initially only available to the author. However, there may be occasions when a user wishes to share inquiries with other users. This can be achieved using the Permissions capabilities of the product.
To provide permissions for an inquiry, „click‟ on the IS Button at the top of your Insight
® application and select Permissions as shown in Figure 7-15. (The
Permissions dialog is also included within the Home Ribbon Tab within the Document Section).
Figure 7-15: IS Button Permissions Option
NB THE PERMISSIONS ICON WILL ONLY BECOME AVAILABLE WHEN YOU HAVE SAVED THE
INQUIRY/TEMPLATE. UNTIL THIS IS DONE, THE ICON WILL BE GREYED OUT.

InsightSoftware.com User Guide
Page 155 of 429
The Permissions for Inquiry dialog shown in Figure 7-16 displays all of the users and groups that you have permissions to see. The permissions to see other users/groups are granted to you by the Insight
® Administrator.
These user/groups are usually organized based on roles or groupings within JD Edwards™ own security model or on an ad-hoc basis. „Clicking‟ on the plus (+) sign next to a group will reveal the users and sub groups within.
Figure 7-16: Permissions Dialog
When working with Permissions, there are several different types of permissions that can be assigned. These are shown in the right pane of the dialog, as shown above.

InsightSoftware.com User Guide
Page 156 of 429
To grant another person the ability to run your inquiry, highlight the user on the left and through the use of the Status radio buttons, set the Read type to Granted. This can also be done by „right-clicking‟ the option on the type itself (Figure 7-17). Now „click‟ on OK.
Figure 7-17: Permission Example
NB THIS APPROACH REQUIRES THAT BOTH USERS HAVE ACCESS TO A SHARED FOLDER (WHERE
USERS HAVE BEEN GRANTED READ AND CREATE PERMISSIONS).
Permissions allow for tighter security over inquiries, folders and other Insight
®
objects. This is introduced in greater detail in the next section.
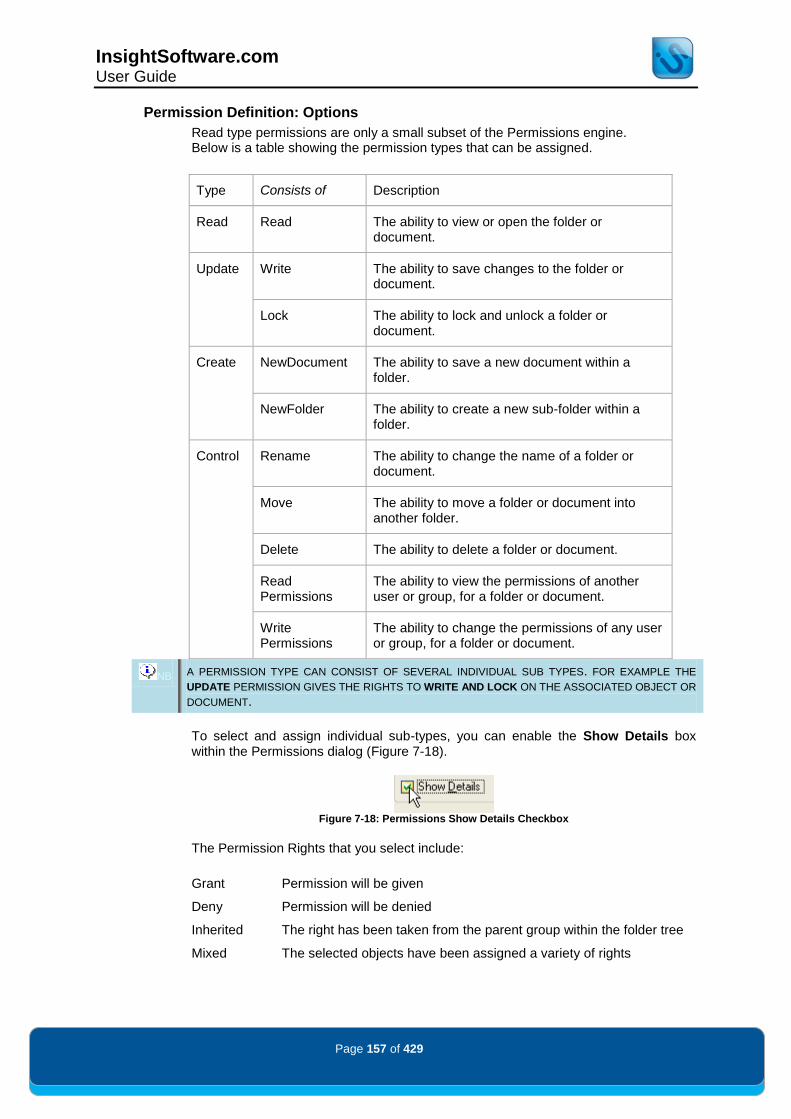
InsightSoftware.com User Guide
Page 157 of 429
Permission Definition: Options
Read type permissions are only a small subset of the Permissions engine. Below is a table showing the permission types that can be assigned.
NB A PERMISSION TYPE CAN CONSIST OF SEVERAL INDIVIDUAL SUB TYPES. FOR EXAMPLE THE
UPDATE PERMISSION GIVES THE RIGHTS TO WRITE AND LOCK ON THE ASSOCIATED OBJECT OR
DOCUMENT.
To select and assign individual sub-types, you can enable the Show Details box within the Permissions dialog (Figure 7-18).
Figure 7-18: Permissions Show Details Checkbox
The Permission Rights that you select include:
1. Grant 2. Permission will be given
3. Deny 4. Permission will be denied
5. Inherited 6. The right has been taken from the parent group within the folder tree
7. Mixed 8. The selected objects have been assigned a variety of rights
Type Consists of Description
Read Read The ability to view or open the folder or document.
Update Write The ability to save changes to the folder or document.
Lock The ability to lock and unlock a folder or document.
Create NewDocument The ability to save a new document within a folder.
NewFolder The ability to create a new sub-folder within a folder.
Control
Rename The ability to change the name of a folder or document.
Move The ability to move a folder or document into another folder.
Delete The ability to delete a folder or document.
Read Permissions
The ability to view the permissions of another user or group, for a folder or document.
Write Permissions
The ability to change the permissions of any user or group, for a folder or document.

InsightSoftware.com User Guide
Page 158 of 429
Permission Definition: Users
Users within Insight® can belong to groups or have roles, the default and largest of
which is called Everyone. (Within Permissions we refer to groups of users but this is interchangeable with roles.)
When assigning access rights within Permissions, you can give rights to individual users or to group(s). Users will inherit rights from the group they belong to, unless those rights are then expressly denied to the individual user.
If a user is within multiple groups and has been assigned contradictory rights, Insight®
will allow any assigned right that has been granted.
If a user has been assigned more rights than a group they belong to, rights will not automatically transfer to the group.
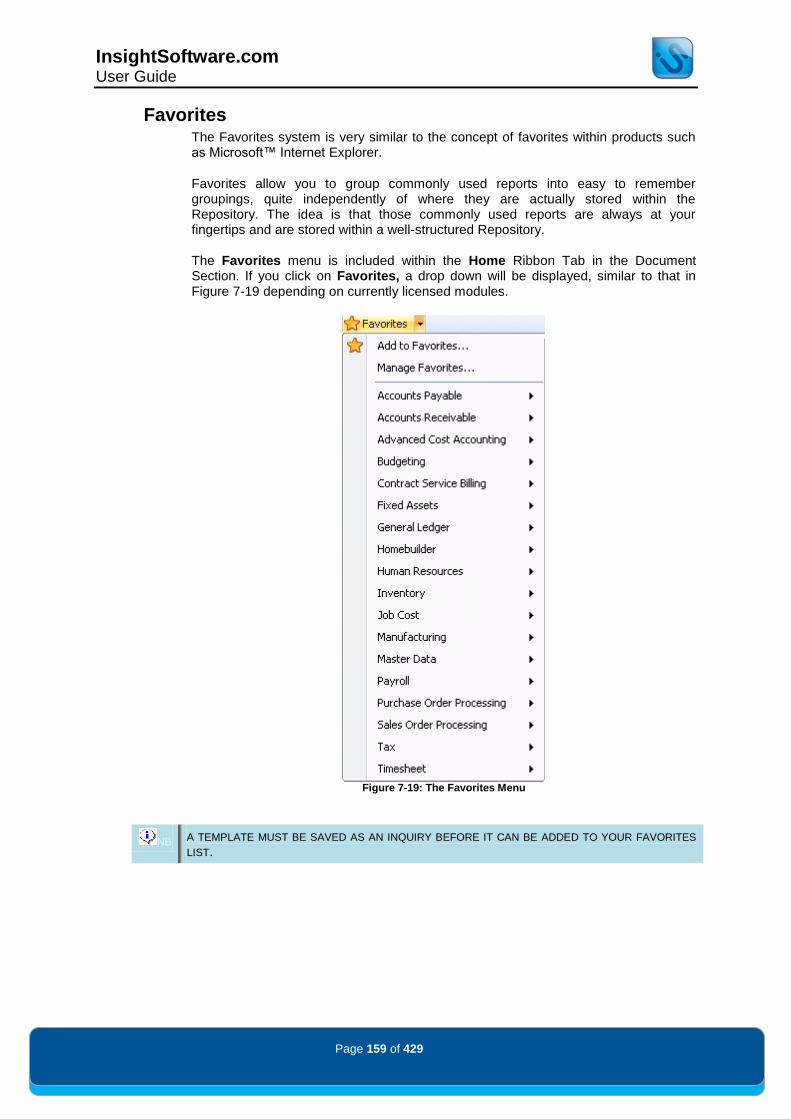
InsightSoftware.com User Guide
Page 159 of 429
Favorites The Favorites system is very similar to the concept of favorites within products such as Microsoft™ Internet Explorer.
Favorites allow you to group commonly used reports into easy to remember groupings, quite independently of where they are actually stored within the Repository. The idea is that those commonly used reports are always at your fingertips and are stored within a well-structured Repository.
The Favorites menu is included within the Home Ribbon Tab in the Document Section. If you click on Favorites, a drop down will be displayed, similar to that in Figure 7-19 depending on currently licensed modules.
Figure 7-19: The Favorites Menu
NB A TEMPLATE MUST BE SAVED AS AN INQUIRY BEFORE IT CAN BE ADDED TO YOUR FAVORITES
LIST.

InsightSoftware.com User Guide
Page 160 of 429
Selecting Add to Favorites displays the dialog shown in Figure 7-20:
Figure 7-20: Add Favorite Dialog
The Favorites area comes with a sub-folder for each module already defined.
If necessary, you can also create your own additional Favorite folder through the Create New Folder icon.
To add your inquiry, select the folder where you wish to store the favorite, type the name by which it will be known (this does not have to be the same as the name under which it is stored in the Repository) and „click‟ on OK to create it.
The new item will now be found in the Favorites menu, as shown in Figure 7-21:
Figure 7-21: A New Favorite Added to the Drop Down Menu
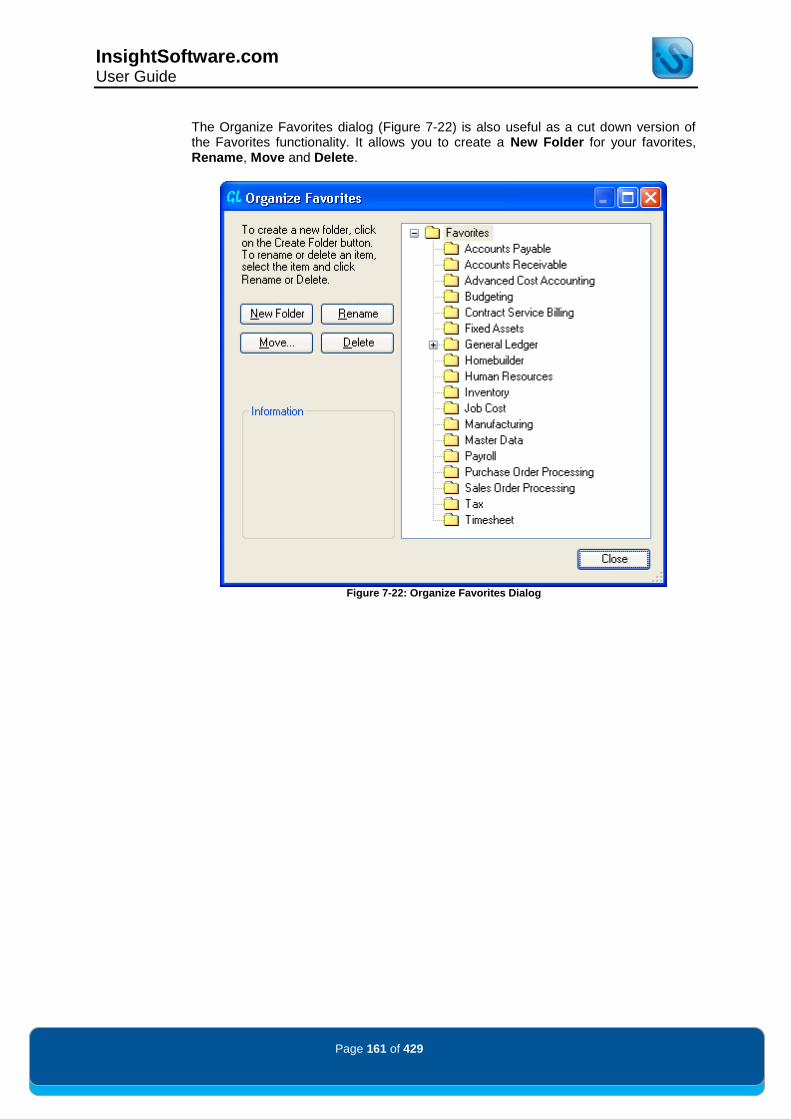
InsightSoftware.com User Guide
Page 161 of 429
The Organize Favorites dialog (Figure 7-22) is also useful as a cut down version of the Favorites functionality. It allows you to create a New Folder for your favorites, Rename, Move and Delete.
Figure 7-22: Organize Favorites Dialog
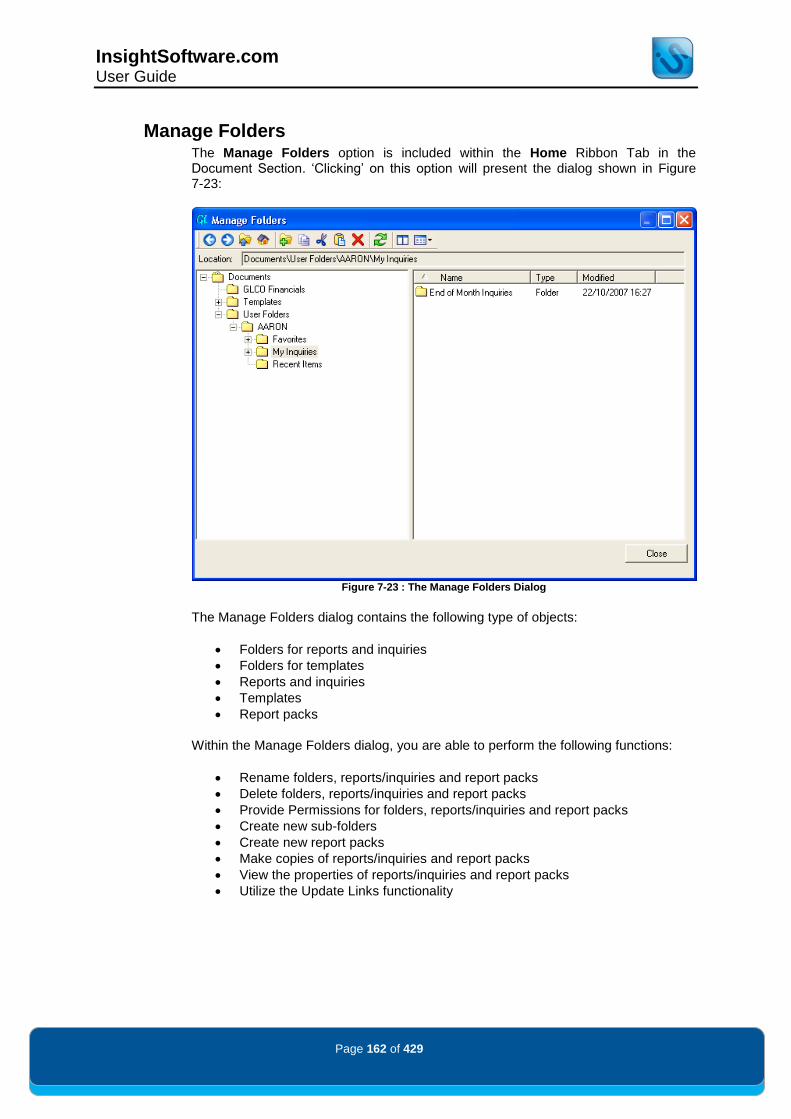
InsightSoftware.com User Guide
Page 162 of 429
Manage Folders The Manage Folders option is included within the Home Ribbon Tab in the Document Section. „Clicking‟ on this option will present the dialog shown in Figure 7-23:
Figure 7-23 : The Manage Folders Dialog
The Manage Folders dialog contains the following type of objects:
Folders for reports and inquiries
Folders for templates
Reports and inquiries
Templates
Report packs
Within the Manage Folders dialog, you are able to perform the following functions:
Rename folders, reports/inquiries and report packs
Delete folders, reports/inquiries and report packs
Provide Permissions for folders, reports/inquiries and report packs
Create new sub-folders
Create new report packs
Make copies of reports/inquiries and report packs
View the properties of reports/inquiries and report packs
Utilize the Update Links functionality

InsightSoftware.com User Guide
Page 163 of 429
Access to these functions is achieved by a dynamic pop-up menu which appears when you „right-click‟ on one of the nodes in the folder hierarchy on the left panel, on any of the icons on the right panel, or in the white space of the right panel.
Depending upon what has been selected (i.e. a folder, inquiry, template, etc.); the pop-up menu will present a series of options which are relevant to that particular object. Therefore, not all functions are available for all objects.
NB ALL OF THE MANAGE FOLDERS FUNCTIONALITY IS IN ACCORDANCE WITH THE PERMISSIONS
GRANTED TO THE USER. IF OBJECTS ARE NOT VISIBLE OR FUNCTIONALITY IS NOT PROVIDED, THIS WILL BE DIRECTLY RELATED TO THE USER‟S PERMISSIONS.
Renaming a Folder or Inquiry
A folder or inquiry can be renamed by selecting the relevant folder or inquiry, „clicking‟ again and then typing the new name. Alternatively, „right-click‟ on the object, select the Rename option and type in the new name.
Deleting a Folder or Inquiry
To delete a folder or inquiry, select the object with the mouse, „right-click‟ and select the Delete option.
Providing Permissions on a Folder or Inquiry
To provide Permissions on a folder or inquiry, select the object with the mouse, „right-click‟ and select the Permissions option. Select the relevant users or groups to whom you wish to grant permissions and „click‟ on the OK button.
Create a New Sub-Folder
To create a new sub-folder, either select the folder under which you wish to create a sub-folder and „right click‟. Alternatively you can „right click‟ in the white space on the right panel.
In the associated pop-up menu under the New tree there is an option called Folder. A new dialog will appear, allowing you to type in the name of your new folder. „Click‟ OK to create the folder.

InsightSoftware.com User Guide
Page 164 of 429
Create a New Report Pack
Creating a new report pack allows you to group together a series of reports and inquiries from within the same module or across modules. You can then subsequently open the pack, which will load all of the reports and inquiries within the pack and run the first one.
To create a new report pack, either „right-click‟ on the folder under which you wish to create a report pack, or alternatively „right-click‟ in the white space on the right panel. Within the „right-click‟ menu under the New tree, there is an option called Report Pack. This will present the dialog shown in Figure 7-24:
Figure 7-24: New Report Pack Dialog
The first step in the process is to define a name for the pack. By default the name „New Report Pack‟ is provided, however you can type over this name with that of your own choosing.
The next step is to define a description for the report pack in the Description field.
Finally, select the reports and inquiries to include in the report pack by „clicking‟ on the Add button.

InsightSoftware.com User Guide
Page 165 of 429
This will open up an Open dialog (Figure 7-25). Navigate through this dialog to select the associated inquiry and then „click‟ on Open.
Figure 7-25: Open Dialog for Choosing Inquiries in a Report Pack
This action will add the inquiry to the Inquiries Panel (Figure 7-26).
Figure 7-26: Create Report Pack Dialog with Added Inquiry
You can add as many reports to the pack as you require. These reports can come from the same folder or different folders.
There are some restrictions on what can be included in a report pack. For example, it is not possible to include folders, templates or other report packs. Also it is not possible to include inquiries and reports that originate from different data connections since Insight
® only connects to one environment at a time.

InsightSoftware.com User Guide
Page 166 of 429
Once this process is complete, „click‟ on the OK button. The new report pack will be shown in the folder in which it was created. Be sure to grant permissions to other users if you want them to be able to access the report pack. (In this case they would need permissions to the report pack itself as well as the inquiries contained within the report pack.)
Making a Copy of an Inquiry or Report Pack
To make a copy of an inquiry or report pack, select the object, „right-click‟ and select the Copy option. „Right-click‟ in the required location and then select Paste. If the location is the same, the new inquiry or pack will be prefixed with „Copy of‟.
Viewing the Properties of an Object
To view the properties of an object, highlight it, „right-click‟ and select Properties. This will produce the dialog shown in Figure 7-27:
Figure 7-27: General Tab in the Properties Dialog
The General tab in the Properties dialog shows various information and settings:
Type – Displays whether the object is an inquiry, report pack, template, folder, shortcut, etc.
Location – Where the object exists in the Repository Created – Date and time of object creation Created by – User who created the object Modified – Last date and time that the object was modified Modified by – Last user to modify the object Accessed – Last date and time that the object was accessed (opened) Stored Size – Actual size of the Inquiry (useful for disk space analysis) Attributes – General attributes associated with an object

InsightSoftware.com User Guide
Page 167 of 429
The Associations Tab enhances this information by presenting Object Dependencies.
In Figure 7-28, you can see that the Balance Sheet inquiry is not dependent on any other items (items which this item depends on). However the inquiry does have other items dependent on it (items which depend on this item). This includes two shortcuts and one report pack.
Figure 7-28: Associations Tab in the Properties Dialog
This relationship would be reversed if you were looking at the properties of a Shortcut. In the „Items which this item depends on‟ section, you would see the target inquiry of the shortcut and the items which depend on this item field would be empty.

InsightSoftware.com User Guide
Page 168 of 429
In their simplest form, inquiry worksheets act as single, independent entities, which are used in isolation of each other. However, in certain instances it may be relevant to integrate a series of inquiries together to provide a coherent financial picture.
The inquiry linking feature of the product allows you to do this and provides sophisticated parameter passing techniques to pass data from one inquiry to another. Given the complex nature of this feature, it is best illustrated by an example.
In Figure 8-1, a revenue inquiry has been created. This inquiry provides aggregated revenues across all Companies and Business Units:
Figure 8-1: An Aggregated Revenue Inquiry
Within the Revenue inquiry, the requirement is to be able to further analyze any of the aggregated object accounts either by Business Unit or by Subledger. This analysis is provided by two separate inquiries that have been previously saved in the Repository.
However, in this instance, the user wishes to be able to a) open these subsequent inquiries by „clicking‟ on one of the object accounts in the Revenue inquiry, and b) use the object account selected to filter subsequent selections on the other inquiries. For example, if you „click‟ on the object account 5020 – Direct Ship Sales, this value will be used in the object account filter of the other inquiry to select accounts in the inquiry result set.

InsightSoftware.com User Guide
Page 169 of 429
This introduces the concept of a „source‟ inquiry and a „target‟ inquiry. In this example, there are three inquiries:
Consolidated Revenue Inquiry (source)
View by Business Unit (target)
View by Sub Ledger (target)
The View by Business Unit (target) inquiry is shown in Figure 8-2. Note that the Object Account filter is currently set to an asterisk (*), indicating all object accounts will be returned based on the current filter settings.
Figure 8-2: View by Business Unit Target Inquiry
The reason why the Object Account filter has not been set in this example is that the user does not want to pre-select an object account, but rather dynamically set it based on the selection made in the Revenue inquiry.

InsightSoftware.com User Guide
Page 170 of 429
Using the previous Consolidated Revenue Inquiry example, specify your link by „clicking‟ on the Link Inquiries icon which exists in the Design Ribbon Tab within the Setup Section. This will show the Linked Inquires dialog, as shown in Figure 8-3.
Figure 8-3: Linked Inquiries Dialog
This dialog lists all of the currently available links for the inquiry. Here you can create new link, edit existing links or remove any unwanted links. To create a new link, „click‟ on the New button. This will produce the dialog shown in Figure 8-4. When displayed, enter a Name for the new link.
Figure 8-4: Create a New Link Dialog
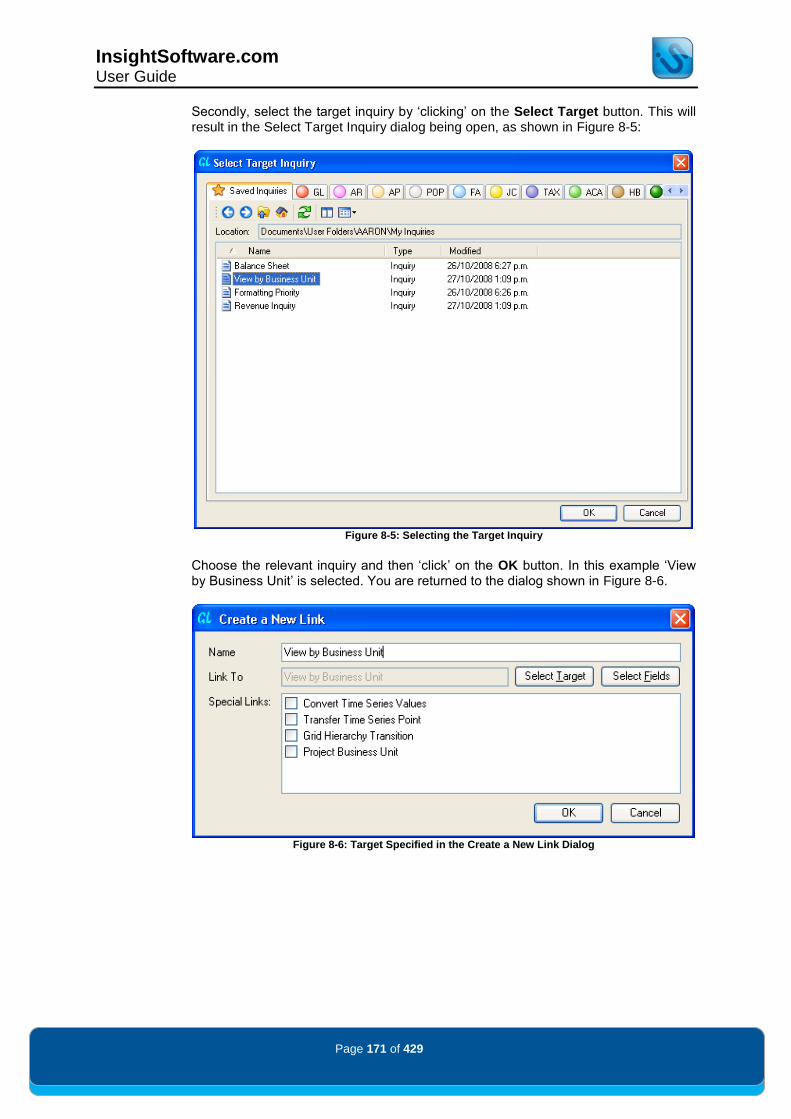
InsightSoftware.com User Guide
Page 171 of 429
Secondly, select the target inquiry by „clicking‟ on the Select Target button. This will result in the Select Target Inquiry dialog being open, as shown in Figure 8-5:
Figure 8-5: Selecting the Target Inquiry
Choose the relevant inquiry and then „click‟ on the OK button. In this example „View by Business Unit‟ is selected. You are returned to the dialog shown in Figure 8-6.
Figure 8-6: Target Specified in the Create a New Link Dialog

InsightSoftware.com User Guide
Page 172 of 429
You now have the choice of whether or not to pass filter parameters from the source to the target inquiry. If this is not required, „click‟ on the OK button to complete the link definition.
However, if parameters are to be included within the target inquiry, „click‟ on the Select Fields button and the Define Link Inquiry Pass Values dialog will open (Figure 8-7):
Figure 8-7: Passing Values in a Linked Inquiry
In Figure 8-7, the Object Account filter has been chosen. The selection mode has been defined as Set. This will overwrite the existing selections in the filter on the target inquiry. Had this been defined as Add, the selections would be appended to any existing selections in that filter of the target inquiry.
In our example, the selected object account in the source inquiry will replace the filter selections in the target inquiry.
If a currency field is being passed as a parameter, you have the option as to whether the currency is translated by „ticking‟ the Translate Currency tick box. This only applies for sites that have a currency code of „ „(or Blank – not Null), which will then be translated into an * (or All).
When all the relevant selections have been made, „click‟ OK to return to the link inquiry dialog, and then „click‟ on the OK button again.
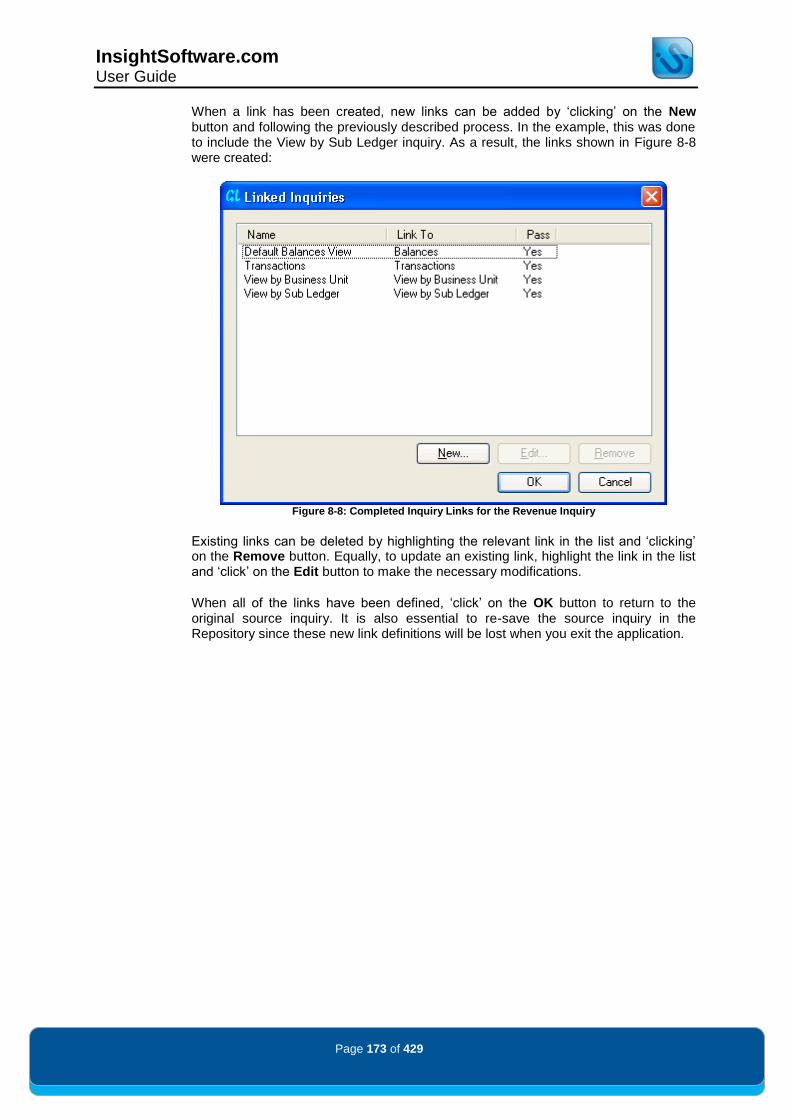
InsightSoftware.com User Guide
Page 173 of 429
When a link has been created, new links can be added by „clicking‟ on the New button and following the previously described process. In the example, this was done to include the View by Sub Ledger inquiry. As a result, the links shown in Figure 8-8 were created:
Figure 8-8: Completed Inquiry Links for the Revenue Inquiry
Existing links can be deleted by highlighting the relevant link in the list and „clicking‟ on the Remove button. Equally, to update an existing link, highlight the link in the list and „click‟ on the Edit button to make the necessary modifications.
When all of the links have been defined, „click‟ on the OK button to return to the original source inquiry. It is also essential to re-save the source inquiry in the Repository since these new link definitions will be lost when you exit the application.

InsightSoftware.com User Guide
Page 174 of 429
Follow Links The Follow links option allows you to navigate from one inquiry to another.
By using the Linked Inquiries defined in the previous section, we can see that by „right-clicking‟ on the result set, we have all the four Linked Inquiry options as shown in Figure 8-9.
Figure 8-9: Follow Links Functionality
Figure 8-10 illustrates the View by Business Unit inquiry, having linked through from the source revenue inquiry, passing the object account 5020 – Direct Ship Sales into the Object Account filter of the target inquiry:
Figure 8-10: View By Business Unit inquiry with 5020 in the Object Account Filter

InsightSoftware.com User Guide
Page 175 of 429
To assist client usage, within the standard templates provided in Insight® there are
multiple pre-defined links that are available.
If you are upgrading from a previous version, you will have the GL Period Summary Template which has:
Go to Transactions: Navigates from a summary inquiry to a transactional inquiry.
Show Details: Shows the composite summary details behind aggregated inquiries.
Show Commitments: Shows the associated purchase orders for an object account. (Note: This requires a Purchase Order Processing Module license.)
If you are using Version Winter 2011 for the first time, you will have the GL Balances Template which has:
Default Balances View: Shows the composite summary details behind aggregated inquiries.
Transactions: Navigates from a summary inquiry to a transactional inquiry.
On transactional inquiries there is one default pre-defined link which allows you to navigate to the document inquiry template. Other modules have different links. In addition, as linked inquiries are created, these too become available for selection.
NB LINKS CAN BE CREATED FOR CROSS-MODULE PURPOSES. IT IS POSSIBLE TO DRILL FROM
YOUR AP – ORIGINAL INVOICE TEMPLATE TO POP – GOODS RECEIVED STATUS TEMPLATE
USING CUSTOM LINKS. FOR ANOTHER EXAMPLE, YOU CAN DRILL FROM YOUR ACCOUNTS
RECEIVABLE – ORIGINAL INVOICE TEMPLATE TO YOUR SALES ORDER PROCESSING – SALES
DETAIL TEMPLATE.
At any one time, one of the links acts as a default. This is illustrated with a check mark next to the link name. As shown in Figure 8-9, the default is the „View by Business Unit‟ inquiry. This can be changed at any time by selecting an alternative link. The default governs what happens if a user „double-clicks‟ on a row within the result set.
In addition to this checkmark is a row shown below the result set. Next to the Elapsed time (with database time in parenthesis) is Double click for link, which reveals what the default link would be if a user were to double click on a value. A condensed version of this row is shown in Figure 8-11.
Figure 8-11: Condensed Row below Result Set

InsightSoftware.com User Guide
Page 176 of 429
Advanced: Special Links Functionality
Special Links are provided for situations where Selected Pass Values are not enough for the business requirement. They are specific for certain templates and certain functionality.
Special Links are included within the Create a New Link dialog shown in Figure 8-12.
Figure 8-12: Create a New Link Dialog
Special Links can be Enabled/Disabled by clicking their associated tick box. The following sections introduce some of the most commonly used Special Links.
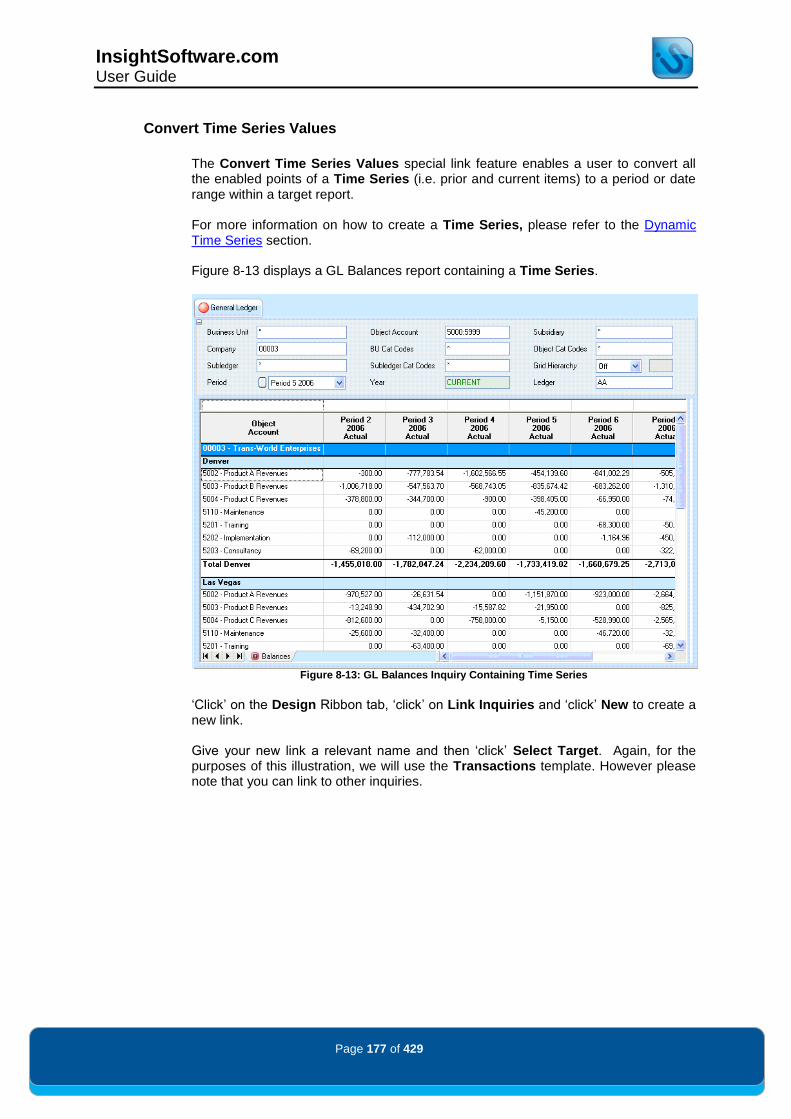
InsightSoftware.com User Guide
Page 177 of 429
Convert Time Series Values
The Convert Time Series Values special link feature enables a user to convert all the enabled points of a Time Series (i.e. prior and current items) to a period or date range within a target report. For more information on how to create a Time Series, please refer to the Dynamic Time Series section. Figure 8-13 displays a GL Balances report containing a Time Series.
Figure 8-13: GL Balances Inquiry Containing Time Series
„Click‟ on the Design Ribbon tab, „click‟ on Link Inquiries and „click‟ New to create a new link. Give your new link a relevant name and then „click‟ Select Target. Again, for the purposes of this illustration, we will use the Transactions template. However please note that you can link to other inquiries.

InsightSoftware.com User Guide
Page 178 of 429
After you have selected a Target, you can select a variety of fields for which the information will be transferred to your target report. Figure 8-14 shows the Define Link Inquiry Pass Values dialog.
Figure 8-14: Define Link Inquiry Pass Values
„Double-click‟ the values you wish to pass to your target report and then „click‟ OK. In this example we have chosen Business Unit, Object Account, Period and Year.
Next, activate the Special Link required to Convert Time Series Values as shown in Figure 8-15.
Figure 8-15: Convert Time Series Values Special Link
Once the new link is defined, you can return to the main inquiry screen. „Click‟ OK and then OK again.
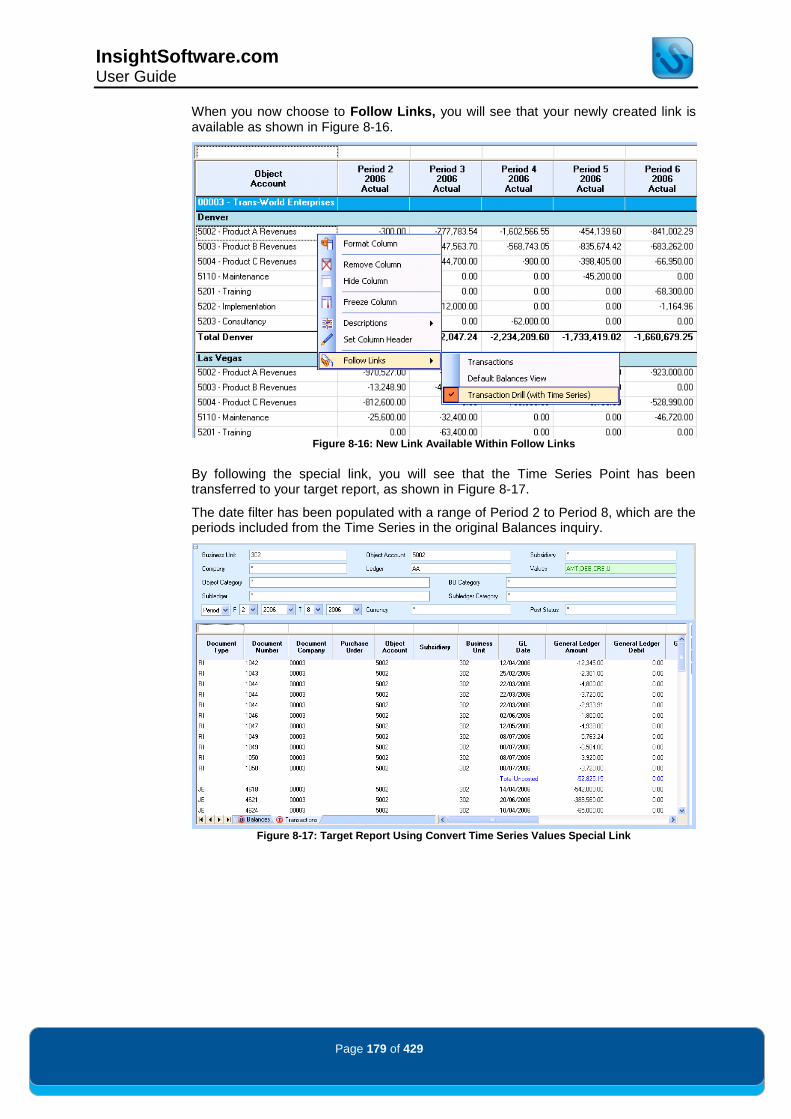
InsightSoftware.com User Guide
Page 179 of 429
When you now choose to Follow Links, you will see that your newly created link is available as shown in Figure 8-16.
Figure 8-16: New Link Available Within Follow Links
By following the special link, you will see that the Time Series Point has been transferred to your target report, as shown in Figure 8-17.
The date filter has been populated with a range of Period 2 to Period 8, which are the periods included from the Time Series in the original Balances inquiry.
Figure 8-17: Target Report Using Convert Time Series Values Special Link

InsightSoftware.com User Guide
Page 180 of 429
Transfer Time Series Point
The Transfer Time Series Point special link feature enables a user to transfer the current point of a Time Series to a target report. In order for the feature to work, the base report and the target report must contain the same Time Series (or a time series that is based on the same dimensions). An easy way to re-use an identical time series is by using the Reusable Inquiry Objects (RIO) feature. (For more information on this feature, please refer to the Configurator/Super User Guide.) In Figure 8-18, we have created a GL Balances report containing a Time Series. This report displays information at the Business Unit level, and we will create a linked inquiry which will display the information in more detail.
Figure 8-18: GL Balances Inquiry Containing Time Series
Go to Link Inquiries (through the Design Ribbon tab) and „click‟ New to create a new link. Give your new link a relevant name and then „click‟ Select Target.
NB YOUR TARGET REPORT MUST CONTAIN AN IDENTICAL TIME SERIES TO THAT OF THE BASE
REPORT FROM WHICH YOU ARE CREATING THE LINK. THIS MUST HAVE BEEN CREATED AND
SAVED BEFORE ATTEMPTING TO CREATE THE SPECIAL LINK.
After you have selected a Target, you can select a variety of fields for which the information will be transferred to filters within your target report. It is not always necessary to define pass values, but it may considerably increase the speed of your target report if you decide to include them.

InsightSoftware.com User Guide
Page 181 of 429
In this example, Figure 8-19 shows the Selected Pass Values of Business Unit and Object Account chosen in the Define Link Inquiry Pass Values dialog.
Figure 8-19: Define Link Inquiry Pass Values
Select the values you wish to pass to your target report and then „click‟ OK.
To activate the Transfer Time Series Point special link, select the box next to the description. Figure 8-20 shows the Transfer Time Series Point selected.
Figure 8-20: Transfer Time Series Point Special Link
Return to the main inquiry screen. „Click‟ OK and then OK again.
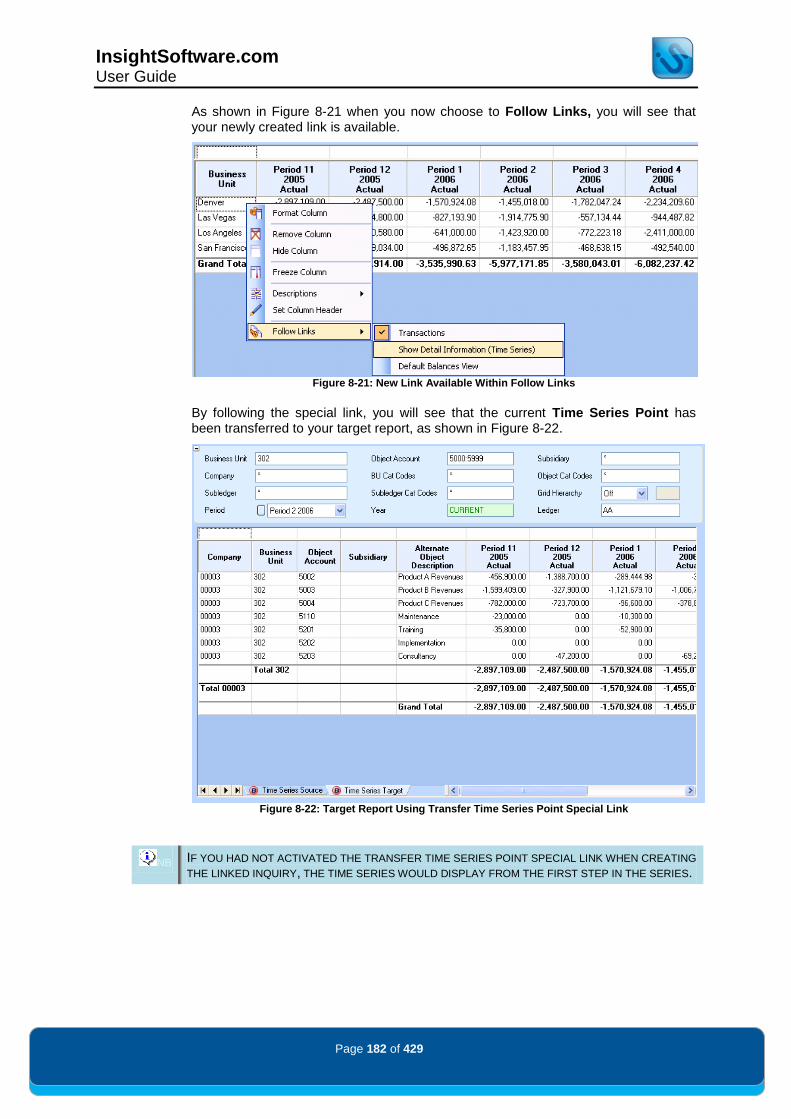
InsightSoftware.com User Guide
Page 182 of 429
As shown in Figure 8-21 when you now choose to Follow Links, you will see that your newly created link is available.
Figure 8-21: New Link Available Within Follow Links
By following the special link, you will see that the current Time Series Point has been transferred to your target report, as shown in Figure 8-22.
Figure 8-22: Target Report Using Transfer Time Series Point Special Link
NB IF YOU HAD NOT ACTIVATED THE TRANSFER TIME SERIES POINT SPECIAL LINK WHEN CREATING
THE LINKED INQUIRY, THE TIME SERIES WOULD DISPLAY FROM THE FIRST STEP IN THE SERIES.

InsightSoftware.com User Guide
Page 183 of 429
Grid Hierarchy Transition
The Grid Hierarchy Transition special link is designed to transfer a specific point from a hierarchy into a target report. In order for the feature to work, the base report and the target report must contain the same hierarchy.
The Grid Hierarchy Transition special link feature will pass through the item from the base report to the target report and then display with Item & Descendants, therefore giving more detail.
An easy way to re-use an identical hierarchy is by using the Reusable Inquiry Objects (RIO) feature. (For more information on this feature, please refer to the Configurator/Super User Guide.)
In Figure 8-23 we have created a Profit & Loss Summary report based on a Grid Hierarchy. We have limited the report to the top three levels of display. We need to create a linked inquiry which will display the items in more detail.
Figure 8-23: Profit and Loss Report Containing a Grid Hierarchy

InsightSoftware.com User Guide
Page 184 of 429
Go to Link Inquiries (through the Design Ribbon tab) and „click‟ New to create a new link. Give your new link a relevant name and then „click‟ Select Target.
NB IMPORTANT: REMEMBER THAT YOUR TARGET REPORT MUST CONTAIN AN IDENTICAL
HIERARCHY TO THAT OF THE BASE REPORT FROM WHICH YOU ARE CREATING THE LINK. THIS
MUST HAVE BEEN CREATED AND SAVED BEFORE ATTEMPTING TO CREATE THE SPECIAL LINK.
After you have selected a Target, you can select a variety of fields for which the information will be transferred to filters within your target report. It is not always necessary to define pass values, but it may considerably increase the speed of your target report if you decide to include them.
Figure 8-24 shows that for this example, we have chosen Company to populate in the Define Link Inquiry Pass Values dialog.
Figure 8-24: Define Link Inquiry Pass Values
„Double-click‟ the values you wish to pass to your target report and „click‟ OK.
To activate the Grid Hierarchy Transition special link, select the box next to the description. Figure 8-25 shows the Grid Hierarchy Transition.
Figure 8-25: Grid Hierarchy Transition Special Link
Return to the main inquiry screen by „clicking‟ OK and then OK again.

InsightSoftware.com User Guide
Page 185 of 429
Figure 8-26 shows that when you Follow Links, you will see that your newly created link is available.
Figure 8-26: New Link Available Within Follow Links
By following the special link, you will see that the point of the hierarchy has been passed through to the filter of the hierarchy, as shown in Figure 8-27.
You will notice that the target report contains more detail from the hierarchy. This is because the settings from the special link display Item & Descendants, meaning you are seeing all the underlying nodes that make up Object Account 5001.
Figure 8-27: Target Report Using Grid Hierarchy Transition Special Link
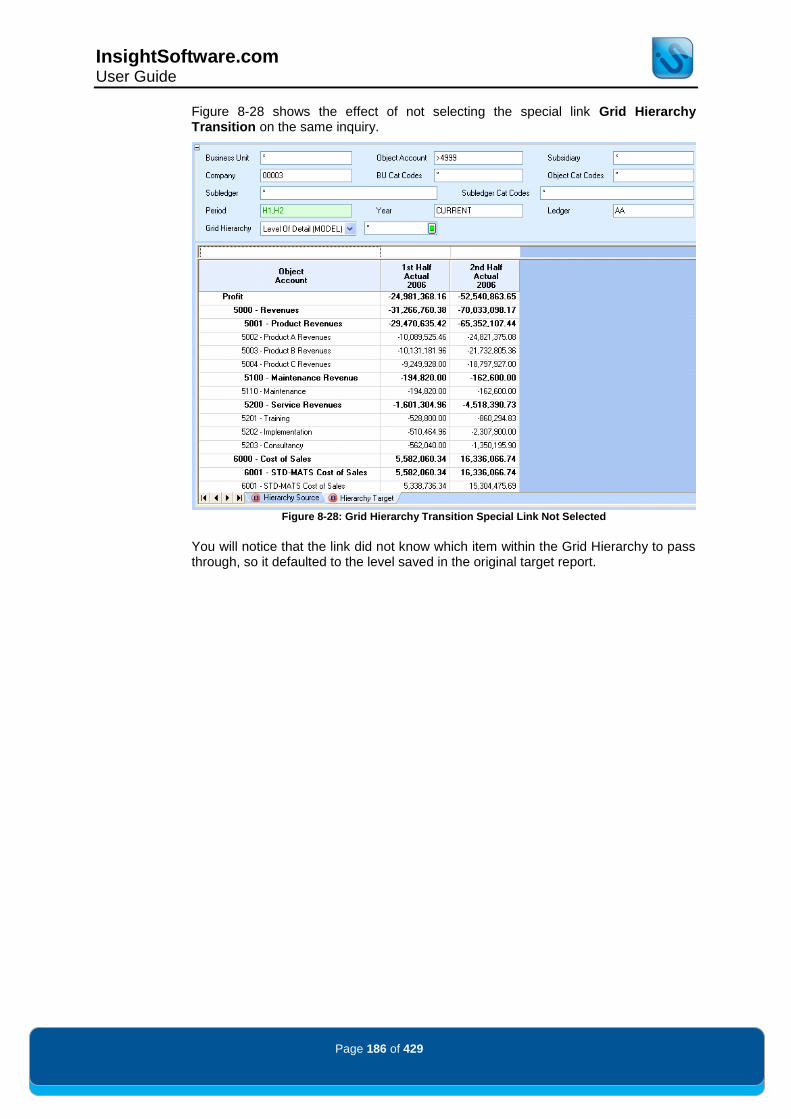
InsightSoftware.com User Guide
Page 186 of 429
Figure 8-28 shows the effect of not selecting the special link Grid Hierarchy Transition on the same inquiry.
Figure 8-28: Grid Hierarchy Transition Special Link Not Selected
You will notice that the link did not know which item within the Grid Hierarchy to pass through, so it defaulted to the level saved in the original target report.
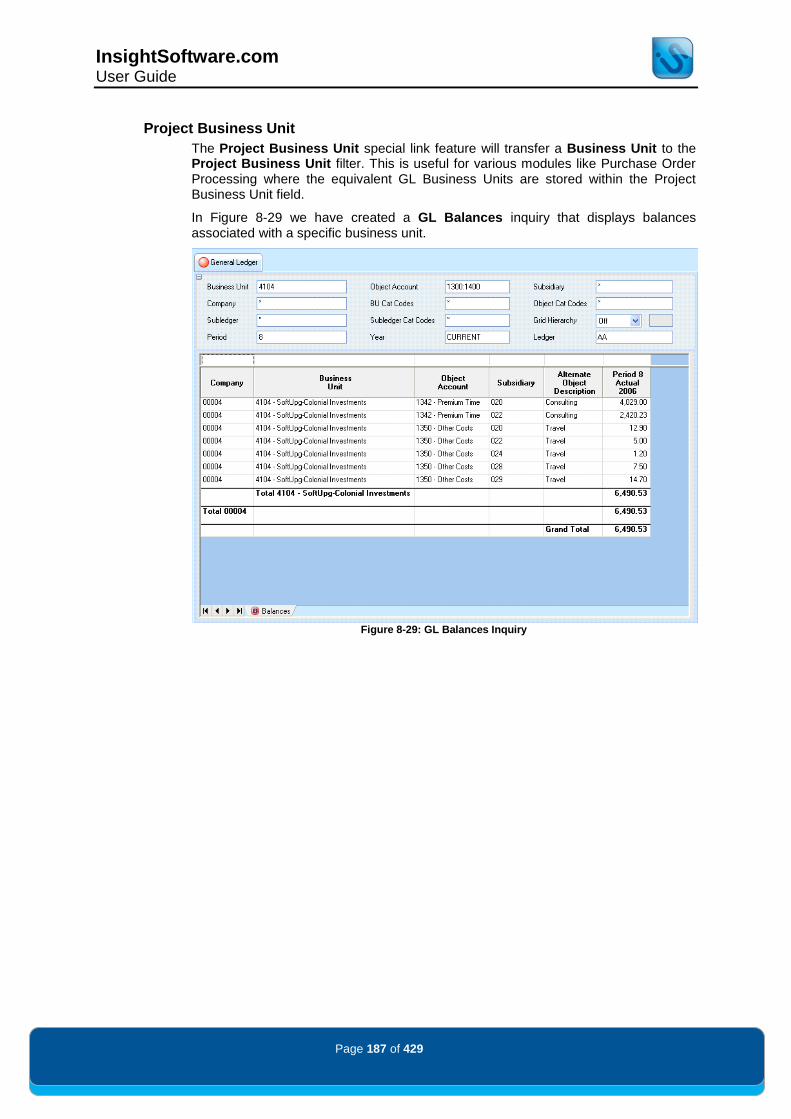
InsightSoftware.com User Guide
Page 187 of 429
Project Business Unit
The Project Business Unit special link feature will transfer a Business Unit to the Project Business Unit filter. This is useful for various modules like Purchase Order Processing where the equivalent GL Business Units are stored within the Project Business Unit field.
In Figure 8-29 we have created a GL Balances inquiry that displays balances associated with a specific business unit.
Figure 8-29: GL Balances Inquiry

InsightSoftware.com User Guide
Page 188 of 429
Go to Link Inquiries (through the Design Ribbon tab) and „click‟ New to create a new link. Give your new link a relevant name and then „click‟ Select Target.
Figure 8-30 shows that for this example, we have chosen Object Account, Subsidiary and Company for the Define Link Inquiry Pass Values dialog.
Figure 8-30: Define Link Inquiry Pass Values
„Double-click‟ the values you wish to pass to your target report and then „click‟ OK.
To activate the Project Business Unit special link, select the box next to the description, as shown in Figure 8-31.
Figure 8-31: Grid Hierarchy Transition Special Link
Return to the main inquiry screen. „Click‟ OK and then OK again.
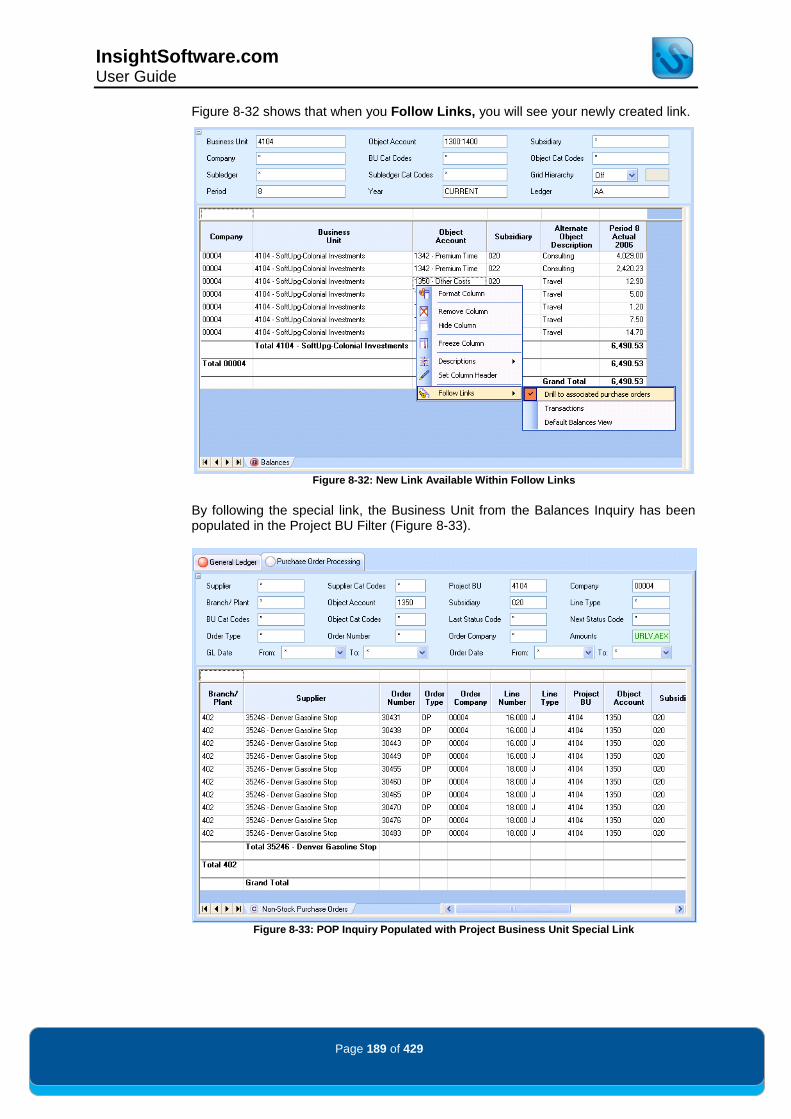
InsightSoftware.com User Guide
Page 189 of 429
Figure 8-32 shows that when you Follow Links, you will see your newly created link.
Figure 8-32: New Link Available Within Follow Links
By following the special link, the Business Unit from the Balances Inquiry has been populated in the Project BU Filter (Figure 8-33).
Figure 8-33: POP Inquiry Populated with Project Business Unit Special Link

InsightSoftware.com User Guide
Page 190 of 429
Overview So far in this guide we have discussed how to build new inquiries and reports, set the filters, run the inquiries, format them, etc. For many ad-hoc type inquiries, this is the full extent to which the product is used. However, Insight
® is increasingly being used
to create elegant reports that are published to end users who use the Console product.
The Console is an end user viewing tool with limited interactivity that is used to view reports generated by other users.
These Console users have been granted read permissions to the associated folder and inquiries, allowing them to view the inquiries. By default, a Console user viewing a report does not have access to any of the filters to be able to make selections. The report designer decides whether this capability should be given to end users of the report. If the report designer wants to provide full or limited access to certain filters within the report, this can be done through the Console Filter Layout dialog. So, as a user, what is the process involved in providing permissions to reports and inquiries to Console users? And how do they control what functionality they have access to? There are three controls associated with Console Report Design which are included within the Console Ribbon Tab:
Console Preview
Console Filter Layout
Default Drill Link

InsightSoftware.com User Guide
Page 191 of 429
Console Preview Mode Once a report has been completed and even as it is being built, a user can „preview‟ how the report will look and work, should it be provided to a Console user.
This is done by „clicking‟ on the Console Preview icon on the Console Ribbon Tab. This visually changes the settings for the report so that you now view the report as if you were using the Console.
Figure 9-1illustrates a report as seen in the normal „Inquiry Mode‟.
Figure 9-1: Consolidated Business Unit Inquiry within Insight
®
NB THE FILTERS DISPLAYED IN CONSOLE PREVIEW MODE ARE CONTROLLED USING CONSOLE
FILTER LAYOUT. TO EDIT THE FILTERS DISPLAYED IN INQUIRY MODE, YOU WILL NEED TO USE
FILTER LAYOUT, WHICH IS ONLY AVAILABLE WITH A CONFIGURATOR OR SUPER USER LICENSE.

InsightSoftware.com User Guide
Page 192 of 429
Figure 9-2 shows the same report with the Console Preview switched on. Notice that all of the filters have been removed and white space has been introduced. Two filter controls have been specified by the Power User. The idea here is that the report looks like „a piece of paper on the screen‟ and yet it remains interactive and real time:
Figure 9-2: The Same Report Shown with Console Preview Mode Switched On
Each time Console Preview is switched on, it is necessary to re-run the inquiry by „clicking‟ on the Run icon.
At this stage, the report remains completely interactive. It means that all of the toolbar features are still available and changes can be made to the report at any time. Any changes that are made are „remembered‟ when switching back out of Console Preview and are applied in the standard Inquiry Mode, so none of your changes are lost.

InsightSoftware.com User Guide
Page 193 of 429
Console Filter Layout
NB THE CONSOLE FILTER LAYOUT CAN ONLY BE USED TO EDIT FILTERS THAT ARE DISPLAYED
WITHIN CONSOLE PREVIEW OR WHEN A USER HAS BEEN LOGGED INTO THE CONSOLE.
IT IS COMPLETELY INDEPENDENT FROM FILTER LAYOUT WHICH IS FOUND IN THE
CONFIGURATOR RIBBON TAB. FILTER LAYOUT REQUIRES A CONFIGURATOR OR SUPER USER
LICENSE AND CAN ONLY EDIT FILTERS THAT ARE NOT DEFINED WITHIN CONSOLE PREVIEW
MODE.
ALL THE INFORMATION SHOWN BELOW CAN BE APPLIED TO FILTER LAYOUT, ALLOWING
CONFIGURATORS OR SUPER USERS THE ABILITY TO CREATE COMPLEX INQUIRIES FOR POWER
USERS.
Console Filter Layout provides a way for Power Users to design reports for Console Users, specifically through the addition/modification and deletion of filters within the inquiry.
The Console Filter Layout tool (accessed through the Console Ribbon Tab) is shown below in Figure 9-3.
Figure 9-3: Console Filter Layout Dialog
The Console Filter Layout dialog is split into two sections. On the left panel is a list of all the different filters that can be accessed and all of the different Controls that can be used.
On the right-hand side is a panel that allows you to design the layout of all the filters.
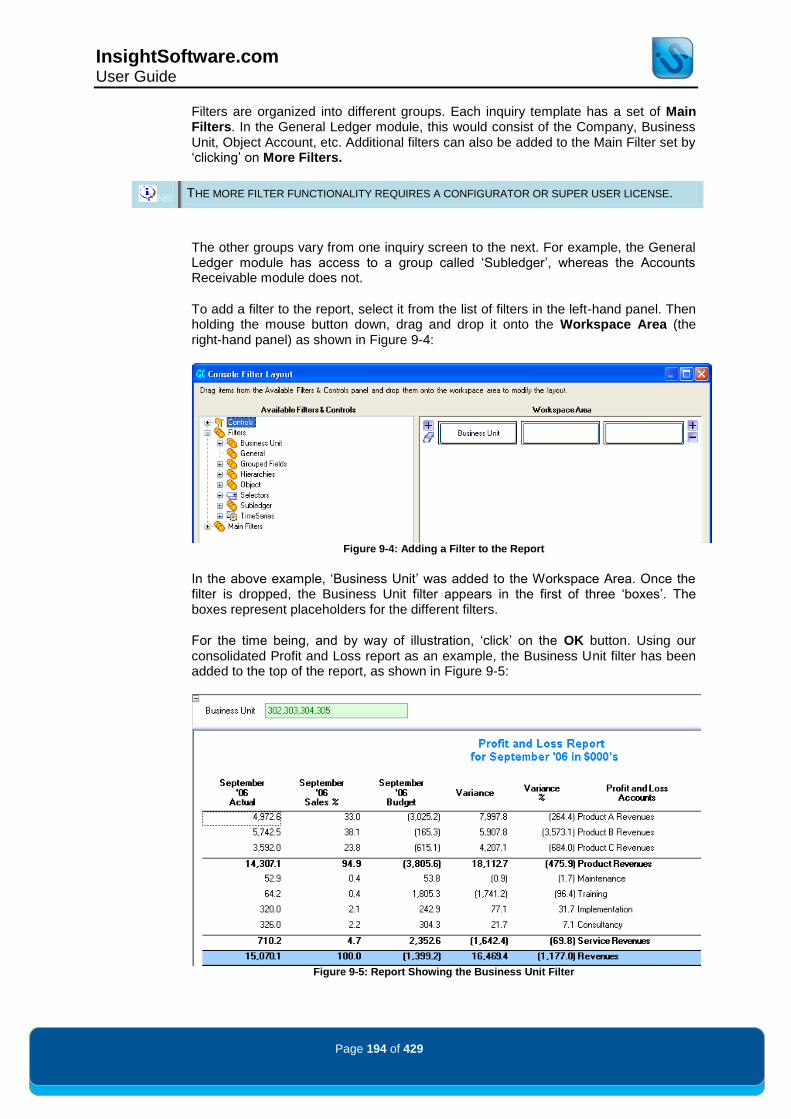
InsightSoftware.com User Guide
Page 194 of 429
Filters are organized into different groups. Each inquiry template has a set of Main Filters. In the General Ledger module, this would consist of the Company, Business Unit, Object Account, etc. Additional filters can also be added to the Main Filter set by „clicking‟ on More Filters.
NB THE MORE FILTER FUNCTIONALITY REQUIRES A CONFIGURATOR OR SUPER USER LICENSE.
The other groups vary from one inquiry screen to the next. For example, the General Ledger module has access to a group called „Subledger‟, whereas the Accounts Receivable module does not.
To add a filter to the report, select it from the list of filters in the left-hand panel. Then holding the mouse button down, drag and drop it onto the Workspace Area (the right-hand panel) as shown in Figure 9-4:
Figure 9-4: Adding a Filter to the Report
In the above example, „Business Unit‟ was added to the Workspace Area. Once the filter is dropped, the Business Unit filter appears in the first of three „boxes‟. The boxes represent placeholders for the different filters.
For the time being, and by way of illustration, „click‟ on the OK button. Using our consolidated Profit and Loss report as an example, the Business Unit filter has been added to the top of the report, as shown in Figure 9-5:
Figure 9-5: Report Showing the Business Unit Filter

InsightSoftware.com User Guide
Page 195 of 429
The Business Unit filter represents a Standard Edit Filter, in that it has a Query Assist from which you can make selections or the required company can be typed directly into the filter.
Workspace Area
Returning to the Filter Layout dialog, when we added the Business Unit filter, there were two other „boxes‟ or placeholders in the first row. Essentially the Workspace Area will allow two other filters to be added to the report.
Additional filters are added using similar techniques to the one used with the first filter, except any new filters need to be dropped directly onto one of the two placeholders.
You can control the number of filters that are present on the line, using the + and – buttons on the right-hand side of the row. You can also control the number of rows of filters that are available by „clicking‟ on the + or eraser buttons on the left-hand side of the row.
The Workspace Area can support a minimum of one filter per row and a maximum of four. In addition, it can support a minimum of one row and a maximum of eight, making 32 the total number of filters than can be added to a single inquiry. Figure 9-6 provides an illustration of this:
Figure 9-6: Filter Dialog with Available Placeholders
Default Layout
At any time it is possible to undo any recent changes and revert back to the previously applied changes by „clicking‟ on the Reset button within the Filter Layout dialog.

InsightSoftware.com User Guide
Page 196 of 429
Controls
So far we have been working with the Standard Edit Filter. However, there are other types of control that be used. They are:
Drop Down Filter – takes the current selection in the filter being applied and presents the items in a drop down list.
Hierarchy Filter – uniquely reserved for selecting any hierarchies used in the report.
Information Filter – takes the current selections in the filter being applied and displays them on screen. These selections cannot be changed.
In a separate part of the dialog are various Group Filter. A Group Filter operates in the same way as the Standard Edit Filter, but is used for groups of items such as category codes, etc. To use these filter types, drag and drop the relevant control onto the Workspace Area prior to adding the actual filter to it. We will continue to use the consolidated Profit and Loss report as our example. We have already added the Business Unit dimension as a standard filter. Now we will add the company filter selections and display then in a drop down filter. To do this, first add the drop down filter on the Workspace Area by dragging and dropping it from the list of controls on the left panel and dropping it on the second placeholder next to Business Unit, as shown in Figure 9-7:
Figure 9-7: Adding a Drop Down Filter Control
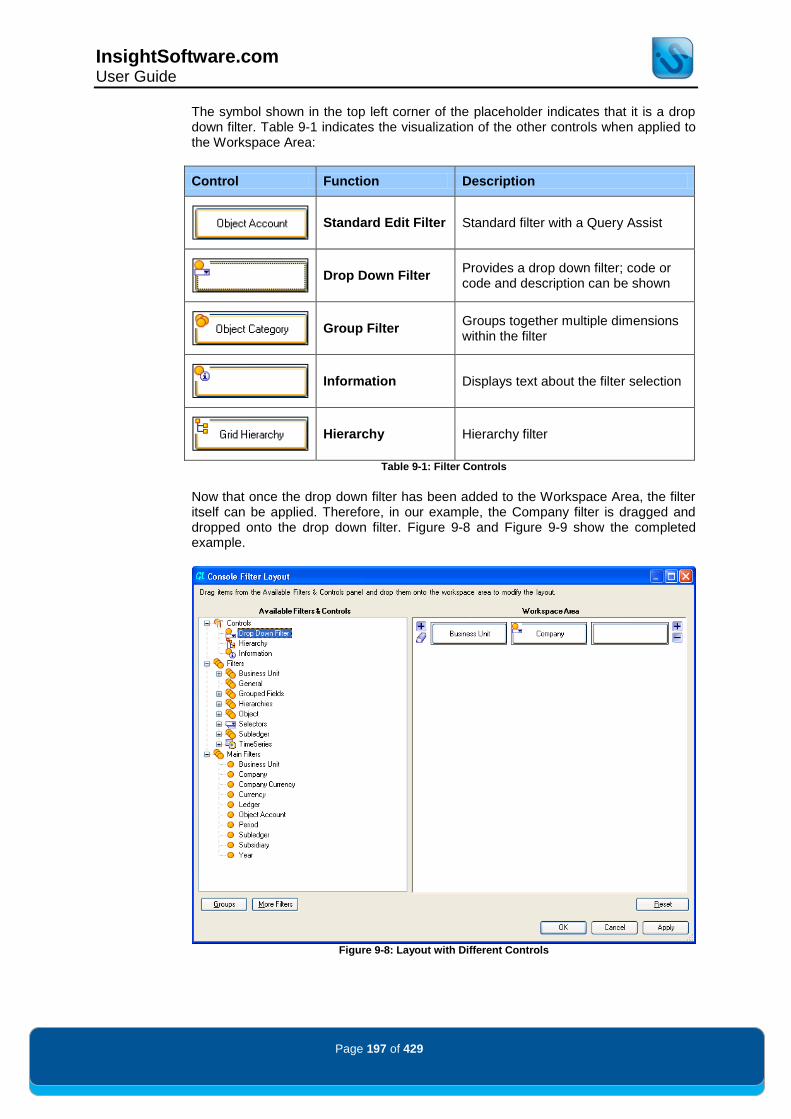
InsightSoftware.com User Guide
Page 197 of 429
The symbol shown in the top left corner of the placeholder indicates that it is a drop down filter. Table 9-1 indicates the visualization of the other controls when applied to the Workspace Area:
Control Function Description
Standard Edit Filter Standard filter with a Query Assist
Drop Down Filter
Provides a drop down filter; code or code and description can be shown
Group Filter
Groups together multiple dimensions within the filter
Information Displays text about the filter selection
Hierarchy Hierarchy filter
Table 9-1: Filter Controls
Now that once the drop down filter has been added to the Workspace Area, the filter itself can be applied. Therefore, in our example, the Company filter is dragged and dropped onto the drop down filter. Figure 9-8 and Figure 9-9 show the completed example.
Figure 9-8: Layout with Different Controls

InsightSoftware.com User Guide
Page 198 of 429
Figure 9-9: Resulting Report with Different Controls Applied
Filter Manipulation
Within the Workspace Area, it is possible to further manipulate the filters and the function they perform. The first series of features allow you to re-order the filter items. This is done using drag and drop techniques.
The order of the filters can be changed by „clicking‟ on a filter in the Workspace area, then holding the mouse and moving to the new location where it needs to be placed. The icon changes to indicate the action being performed. These icons are shown below in Table 9-2.
Icon Explanation
Swap the filter being dragged with the filter in the current position.
Take the filter being dragged and insert it before this position.
Take the filter being dragged and insert it after this position.
Invalid drop zone for the filter being dragged.
Table 9-2: Re-ordering Filters

InsightSoftware.com User Guide
Page 199 of 429
„Right-clicking‟ on a filter within the Workspace Area also provides you with a series of filter manipulation options. These vary depending upon the type of filter; however the following two features are available for all filters:
Removing Filters
All filters or placeholders can be removed by „right-clicking‟ on the filter/placeholder and selecting the Remove option.
Please note that removing a filter does not remove any values that were previously within the filter – these values will still affect the result set. To see these values without adding the filter back, you can use Filter Selections.
Renaming Filters
Any filter can be renamed by „right-clicking‟ on the filter and selecting the Rename option. This will produce the dialog shown in Figure 9-10:
Figure 9-10: Renaming Filters
Type the new name in the field and „click‟ on the OK button.
This only renames the filter itself. Other references in the product, such as the name shown in the column of the result set, have to be set independently. To have this populated in the filter and throughout Insight
®, it is recommended that you use User
Defined Captions.
What’s This?
If filters have been renamed in Filter Layout and you are unsure as to what an individual filter actually controls, you can see the field name and file name by „right-clicking‟ on the filter and then selecting What’s This?, as shown in Figure 9-11.
Figure 9-11: ‘What's This?’ on Filters

InsightSoftware.com User Guide
Page 200 of 429
The Information dialog shows that „Cost Centre‟ has been renamed from the original JD Edwards™ Caption „Business Unit‟. The Information dialog also specifies the File Name and the Field Name (Figure 9-12):
Figure 9-12: The Information From ‘What's This’?
Standard Edit Filter-Specific Features
The edit filter has three further options. These can be set individually or used in conjunction with each other to achieve particular effects.
Each option can be toggled on by „right-clicking‟ on the filter and selecting the appropriate option as shown in Figure 9-13.
Figure 9-13: Available Right Click Options
This will place a check mark next to the option. Turning the feature off is achieved using the same method.
Read Only: Prevents the user from typing into the filter. However, the user is still able to make or change selections using the Query Assist. This forces users to make a valid selection.
No VA: Removes the Query Assist from the control, preventing the user from making selections this way (Figure 9-14):
Figure 9-14: Filter Set To No VA
The combination of both modes will result in the following filter which will not provide a Query Assist or manual entry (Figure 9-15):
Figure 9-15: Filter Set to Read Only and No VA

InsightSoftware.com User Guide
Page 201 of 429
Lock VA: This locks down the Query Assist so that the user can only work with the selections that have previously been made by the Power User. „Clicking‟ on the Query Assist will show the selections that have been made available. These selections have been pre-determined by the Power User while in the Inquiry Mode. When the Query Assist is locked in this way, the features available within the Query Assist are restricted and visually a little different, as shown in Figure 9-16:
Figure 9-16: Locked Query Assist
Group Filter-Specific Features
The group filter has one further option that can be set as shown in Figure 9-17.
Read Only: Prevents the user from typing into the filter. However, the user is still able to make or change selections using the Query Assist. This forces the user to always make a valid selection.
Figure 9-17: Group Filter Specific Features

InsightSoftware.com User Guide
Page 202 of 429
Drop Down Filter - Specific Features
The drop down filter has three additional features that can be set by the user (Figure 9-18):
Figure 9-18: Drop Down Filter Options
This Drop Down filter (without modification) is shown in Figure 9-19:
Figure 9-19: Company Drop Down Filter
Show Description Only: Displays only the description of the selected items in the filter (Figure 9-20):
Figure 9-20: Company Drop down Filter with Show Description Only Enabled
Show Code and Description: Displays both the item code and its associated description (Figure 9-21):
Figure 9-21: Company Drop down Filter with Show Code and Description Enabled
Show All (*) Member: Provides the user with the ability to choose all selections within the dimension to which the filter relates in addition to those pre-selected by the Power User (Figure 9-22):
Figure 9-22: Company Drop Down Filter with Show All (*) Member Enabled
Some of these functions can be used together. Figure 9-23 shows the combination of Show Code and Description and Show All (*) Member.
Figure 9-23: Both Functions Applied to the Company Drop Down Filter
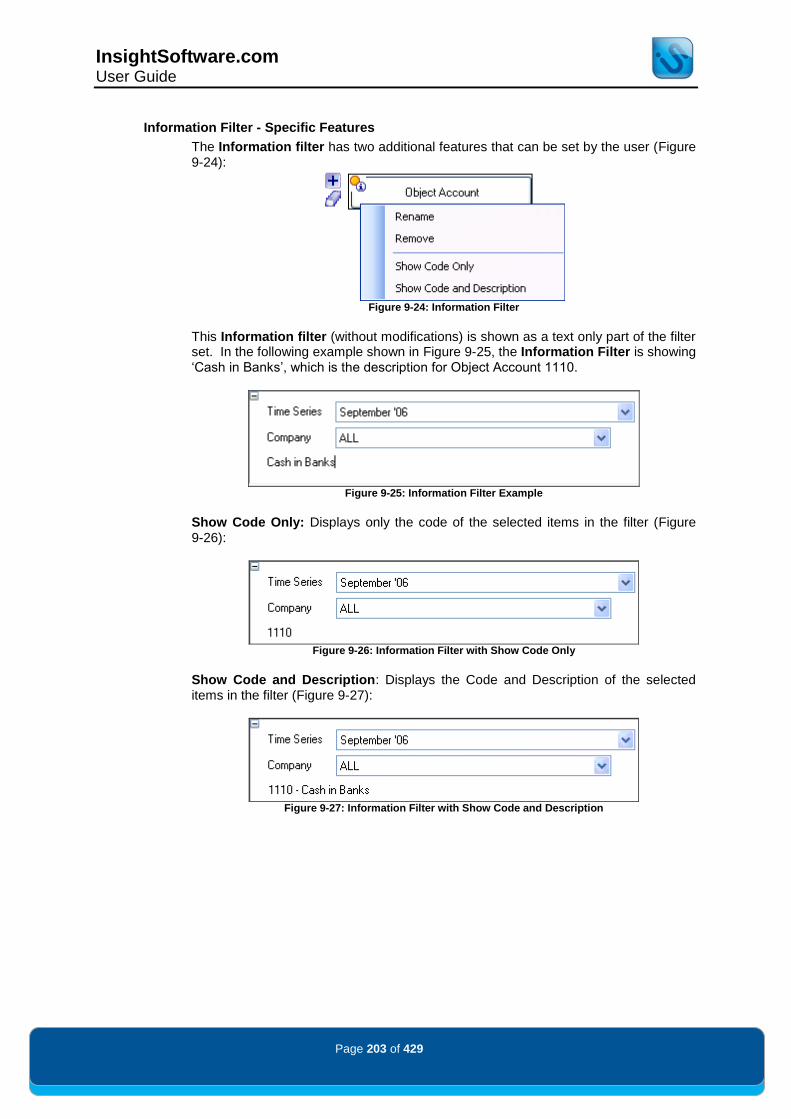
InsightSoftware.com User Guide
Page 203 of 429
Information Filter - Specific Features
The Information filter has two additional features that can be set by the user (Figure 9-24):
Figure 9-24: Information Filter
This Information filter (without modifications) is shown as a text only part of the filter set. In the following example shown in Figure 9-25, the Information Filter is showing „Cash in Banks‟, which is the description for Object Account 1110.
Figure 9-25: Information Filter Example
Show Code Only: Displays only the code of the selected items in the filter (Figure 9-26):
Figure 9-26: Information Filter with Show Code Only
Show Code and Description: Displays the Code and Description of the selected items in the filter (Figure 9-27):
Figure 9-27: Information Filter with Show Code and Description

InsightSoftware.com User Guide
Page 204 of 429
Groups and Grouped Fields
Groups facilitate the grouping of common sets of items into a single filter. Examples of this include Category Codes and Subledgers. By „clicking‟ on the Groups button within the Console Filter Layout dialog, it is possible for the user to manage existing groups that have been set up or to create new groups of items.
„Clicking‟ on the Groups button produces the dialog shown in Figure 9-28:
Figure 9-28: Managed Groups Dialog

InsightSoftware.com User Guide
Page 205 of 429
Editing Groups
Existing groups can be edited by highlighting the required group and „clicking‟ on the Edit button. This will produce the dialog shown in Figure 9-29:
Figure 9-29: Edit Grouped Fields Dialog
Within this dialog, you can add or remove sets of data items such as Category Codes using the left and right arrow keys. The order of the sets can be controlled using the up and down arrow keys.
A practical example of this is where the product is shipped with 30 Business Unit category code groups, but within a particular installation only, Category Code 1, 2 and 3 are used. All of the other Category Codes can be removed from the group, leaving just a restricted, but highly relevant, set of codes for the Console user (Figure 9-30).
Figure 9-30: Restricted Business Unit Category Code filter

InsightSoftware.com User Guide
Page 206 of 429
Creating New Groups
As an alternative to editing the existing groups, new groups can be created. „Click‟ on the New button within the Manage Grouped Fields dialog. The following New Grouped Field dialog will be displayed, as shown in Figure 9-31.
Figure 9-31: Creating a New Group
Here you must specify a new name for the group and select its type. Within the General Ledger module, there are three types – Object, Business Unit and Subledger. Other modules have other groups. „Click‟ on OK to continue.
Next, „click‟ on the Edit button. This will present the same dialog as the one used for editing the groups and is used in the same manner. Once the new group has been created, return to the Manage Grouped Fields dialog and „click‟ on the OK button.
This group will now be available for inclusion in the report under the Grouped Fields node in the left-hand panel of the Filter Layout dialog.
Renaming Groups
To rename a group, highlight it in the list and „click‟ on the Rename button. The dialog shown in will be displayed. Change the name by entering the new title for the group in the Name field, as shown in Figure 9-32, and „click‟ on the OK button.
Figure 9-32: Rename Group Dialog
Deleting Groups
To delete a group, highlight it in the list and „click‟ on the Remove button. You will be prompted to confirm that you wish to delete the group. „Click‟ on Yes to confirm if this is the required action.
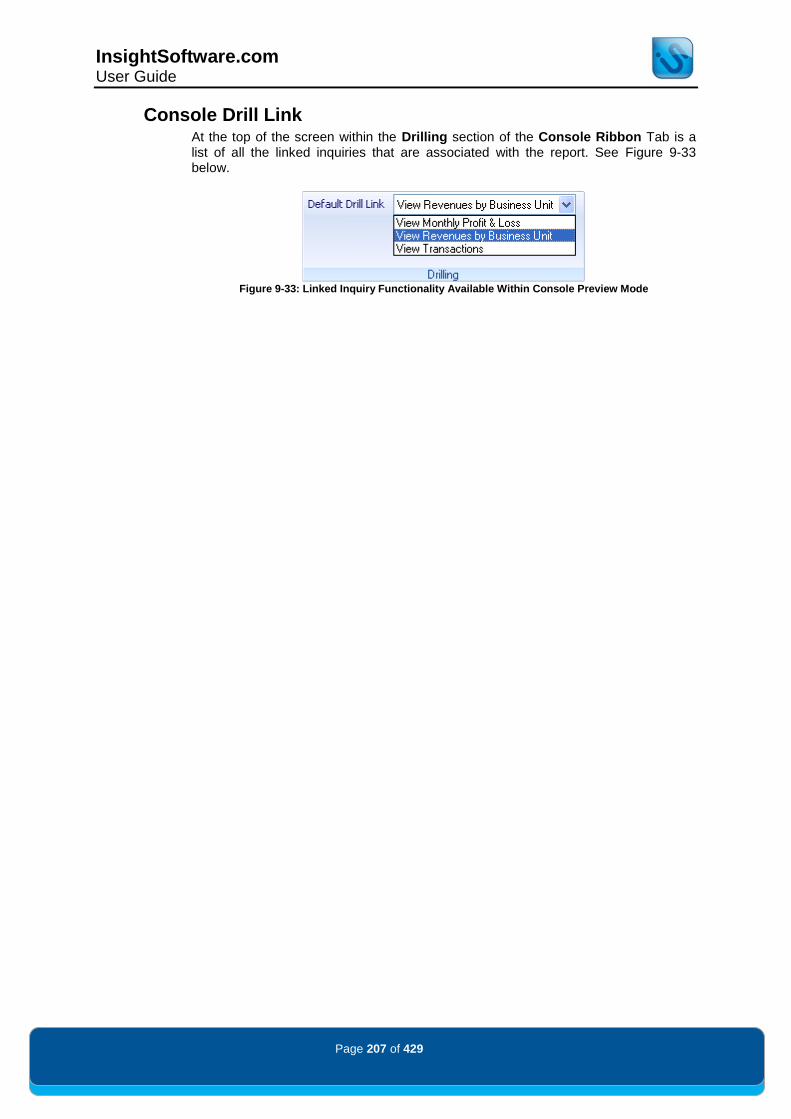
InsightSoftware.com User Guide
Page 207 of 429
Console Drill Link At the top of the screen within the Drilling section of the Console Ribbon Tab is a list of all the linked inquiries that are associated with the report. See Figure 9-33 below.
Figure 9-33: Linked Inquiry Functionality Available Within Console Preview Mode

InsightSoftware.com User Guide
Page 208 of 429
Export to Excel/PDF Insight
® allows for result sets to be exported into an Excel compatible file or a PDF
format. Exporting to a PDF format (known as printing) provides a static file for later analysis. Both commands are available within the Home Ribbon tab, or alternatively found within the IS Button, as shown in Figure 10-1:
Figure 10-1: Highlighted Print/Export Functions on the IS Button

InsightSoftware.com User Guide
Page 209 of 429
In addition to this, the contents of a Query Assist can also be exported as shown in Figure 10-2.
Figure 10-2: Highlighted Excel/Print Icons
Generic Export Messages
Export Size Warning
When exporting to Excel/PDF for the first time, the Print Warning dialog shown in Figure 10-3 will be displayed, notifying you that the result set may take some time to print. This is to help avoid printing out large result sets by mistake. If you do not wish to keep being presented with this dialog, you can turn it off for subsequent printing by „clicking‟ the Don’t show again tick box. See Figure 10-3 below.
Figure 10-3: Print Warning Dialog

InsightSoftware.com User Guide
Page 210 of 429
Exporting Report Pack/Multiple Open Inquiries
When exporting a report pack containing several inquiries, or when there are multiple open inquiries, the Print Type (for printing) or Export Type (for Excel export) dialog will be displayed. This is so that it is possible for the user to choose whether to export all the inquiries or just the currently selected one.
Figure 10-4: Print Type Dialog
The three options are: o Current Inquiry as document: This will export only the current inquiry o All inquiries into single document: This will export all the inquiries
within the report pack or alternatively all the open inquiries into one export document
o All inquiries as individual documents: This will export all the inquiries
within the report pack or alternatively all the open inquiries into an individual document. Once completed, the dialog shown in Figure 10-5 will be displayed.
Figure 10-5: Completed Export Message
NB THE EXPORT/PRINT TYPE DIALOG WILL ONLY APPEAR FOR THE FIRST TIME WHEN PRINTING
FROM THE RIBBON (AS YOUR SETTING IS REMEMBERED FOR THE SESSION). TO SEE THIS
DIALOG AGAIN, YOU WILL NEED TO EXPORT TO PRINT/EXCEL VIA THE IS BUTTON.
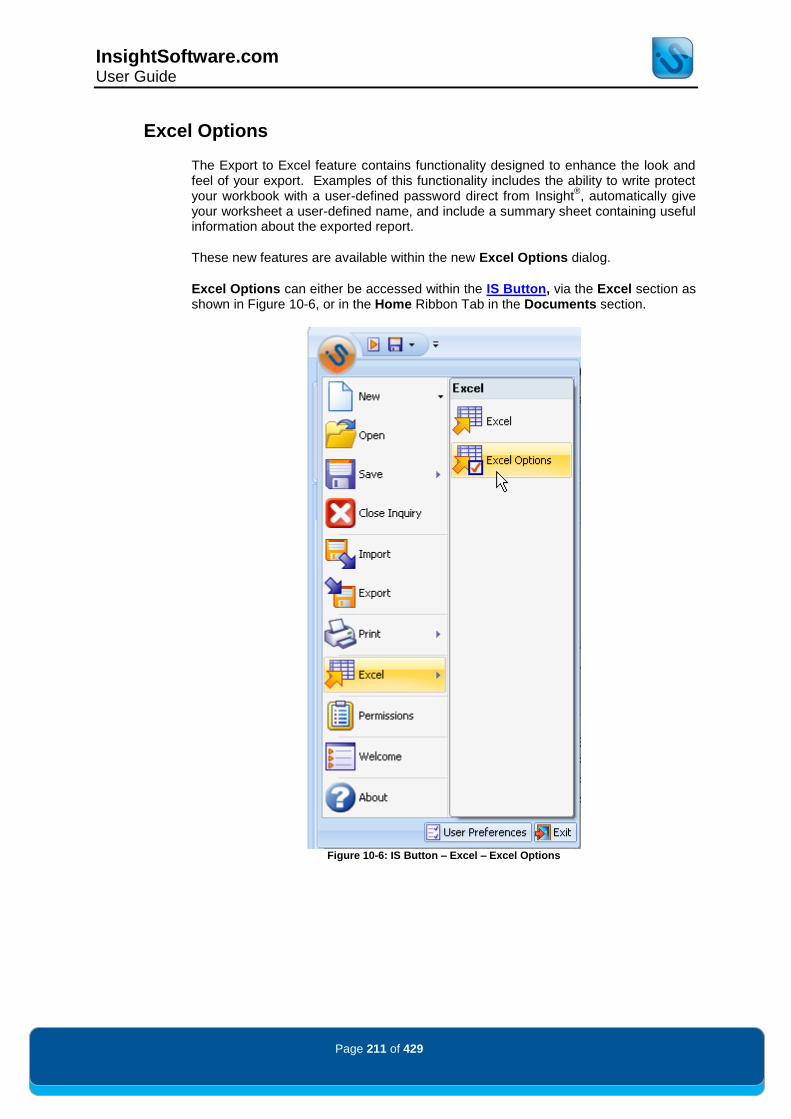
InsightSoftware.com User Guide
Page 211 of 429
Excel Options
The Export to Excel feature contains functionality designed to enhance the look and feel of your export. Examples of this functionality includes the ability to write protect your workbook with a user-defined password direct from Insight
®, automatically give
your worksheet a user-defined name, and include a summary sheet containing useful information about the exported report.
These new features are available within the new Excel Options dialog.
Excel Options can either be accessed within the IS Button, via the Excel section as shown in Figure 10-6, or in the Home Ribbon Tab in the Documents section.
Figure 10-6: IS Button – Excel – Excel Options
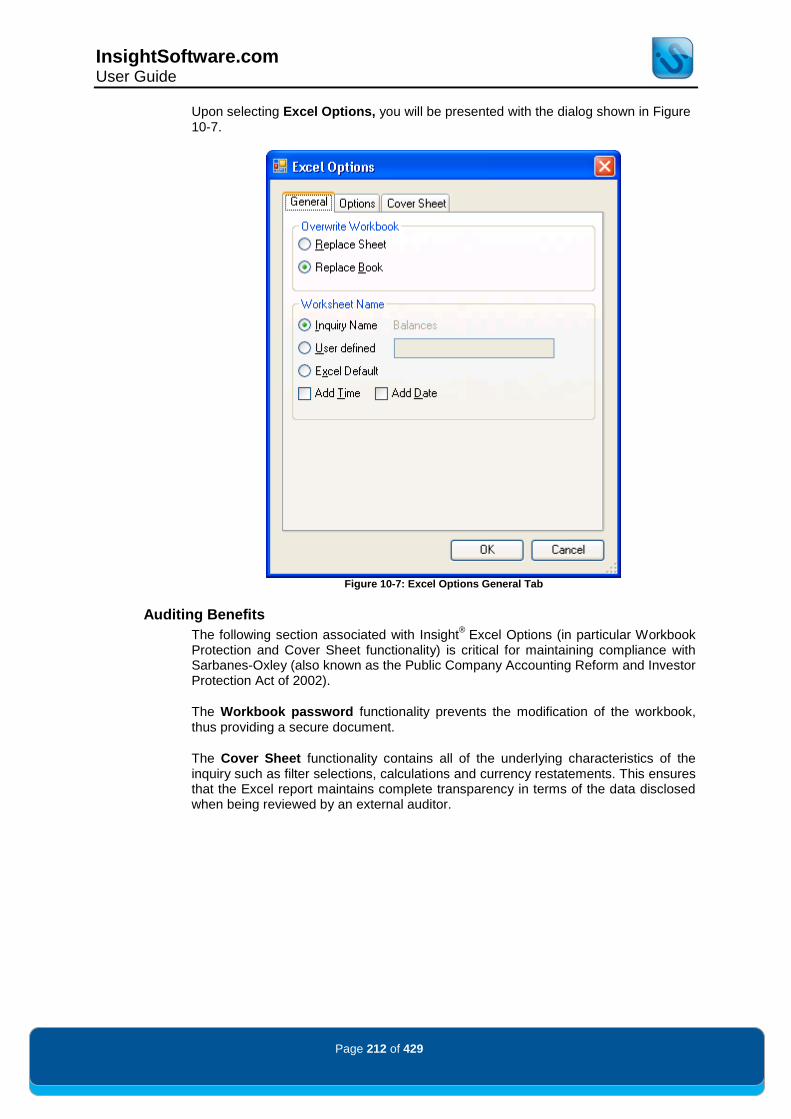
InsightSoftware.com User Guide
Page 212 of 429
Upon selecting Excel Options, you will be presented with the dialog shown in Figure 10-7.
Figure 10-7: Excel Options General Tab
Auditing Benefits
The following section associated with Insight®
Excel Options (in particular Workbook Protection and Cover Sheet functionality) is critical for maintaining compliance with Sarbanes-Oxley (also known as the Public Company Accounting Reform and Investor Protection Act of 2002).
The Workbook password functionality prevents the modification of the workbook, thus providing a secure document.
The Cover Sheet functionality contains all of the underlying characteristics of the inquiry such as filter selections, calculations and currency restatements. This ensures that the Excel report maintains complete transparency in terms of the data disclosed when being reviewed by an external auditor.
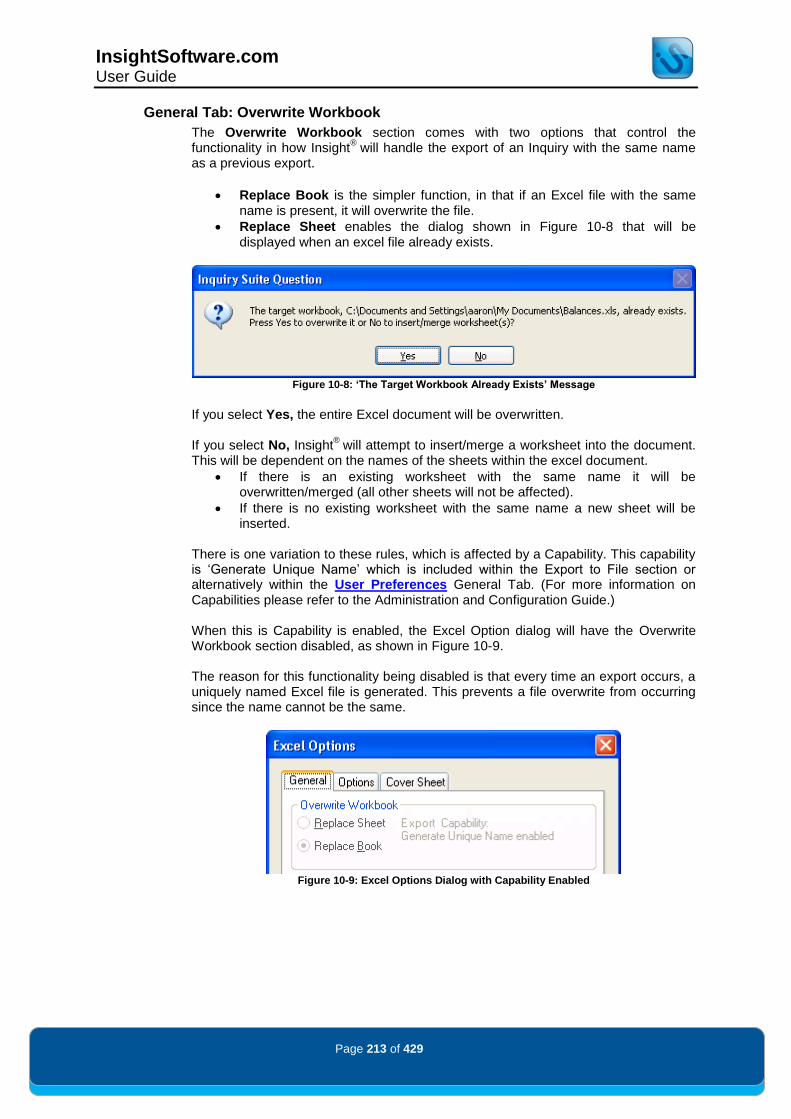
InsightSoftware.com User Guide
Page 213 of 429
General Tab: Overwrite Workbook
The Overwrite Workbook section comes with two options that control the functionality in how Insight
® will handle the export of an Inquiry with the same name
as a previous export.
Replace Book is the simpler function, in that if an Excel file with the same name is present, it will overwrite the file.
Replace Sheet enables the dialog shown in Figure 10-8 that will be displayed when an excel file already exists.
Figure 10-8: ‘The Target Workbook Already Exists’ Message
If you select Yes, the entire Excel document will be overwritten. If you select No, Insight
® will attempt to insert/merge a worksheet into the document.
This will be dependent on the names of the sheets within the excel document.
If there is an existing worksheet with the same name it will be overwritten/merged (all other sheets will not be affected).
If there is no existing worksheet with the same name a new sheet will be inserted.
There is one variation to these rules, which is affected by a Capability. This capability is „Generate Unique Name‟ which is included within the Export to File section or alternatively within the User Preferences General Tab. (For more information on Capabilities please refer to the Administration and Configuration Guide.) When this is Capability is enabled, the Excel Option dialog will have the Overwrite Workbook section disabled, as shown in Figure 10-9. The reason for this functionality being disabled is that every time an export occurs, a uniquely named Excel file is generated. This prevents a file overwrite from occurring since the name cannot be the same.
Figure 10-9: Excel Options Dialog with Capability Enabled

InsightSoftware.com User Guide
Page 214 of 429
General Tab: Worksheet Name
The Worksheet Name section of the dialog, as shown in Figure 10-10, controls the functionality surrounding the name of the Worksheet within the exported excel file.
Figure 10-10: Worksheet Name Section of the Dialog
There are three main options available:
Inquiry Name will use the Inquiry Name as the worksheet name
User Defined allows any value entered in the field to be used as the worksheet name
Excel Default will use the Excel standard new worksheet name (for most instances this should be Sheet1)
In addition to these, you also have two tick boxes which will add a prefix to the worksheet name:
Add Time will prefix a 24 hour time such as 14.36
Add Date will prefix a text based date such as „19 Nov 2008‟ If for example you specified Excel Default with Add Time and Add Date, you would get ‟14.36 19 Nov 2008 Sheet 1‟.

InsightSoftware.com User Guide
Page 215 of 429
Options Tab
This tab of the Excel Options defines specific file details (Figure 10-11):
Figure 10-11: Options Tab
Export Location allows a user to specify where the excel file will be generated. Workbook Protection provides functionality to password protect your workbook. You need to „check‟ the box next to Enable Workbook protection, „enter‟ a Password, and then repeat again within the Confirm Password field.
Depending on your version of Excel, you will receive a similar message to Figure 10-12 or Figure 10-13 when trying to edit your Excel file.
Figure 10-12: Standard Excel 2007 Message
Figure 10-13: Standard Excel 2003 Message
By following the instructions included in this message box, you will be able to enter the previously specified password and edit the excel file.

InsightSoftware.com User Guide
Page 216 of 429
Cover Sheet Tab
The default selection in this screen is to not include a Cover Sheet, as shown in Figure 10-14:
Figure 10-14: Default Disabled Cover Sheet Tab
Checking the box next to Include Cover Sheet will include the selections on the Cover Sheet. By default, certain selections are already enabled as shown Figure 10-15.
Figure 10-15: Enabled Cover Sheet Tab

InsightSoftware.com User Guide
Page 217 of 429
The individual selections are: o Product Version: displays the version of Insight
® in which the export was
created
o Report name: includes the report name
o Report title: includes the report title
o Location: includes the file location of the inquiry
o Creator: includes the user name of the inquiry creator
o User: includes the name of the user producing the Excel file
o Date/time: includes the current date and time
o Filter selections: includes the filter selections
o Calculations: includes the calculations used in the inquiry
o Restatements: includes the currency restatement values used in the inquiry
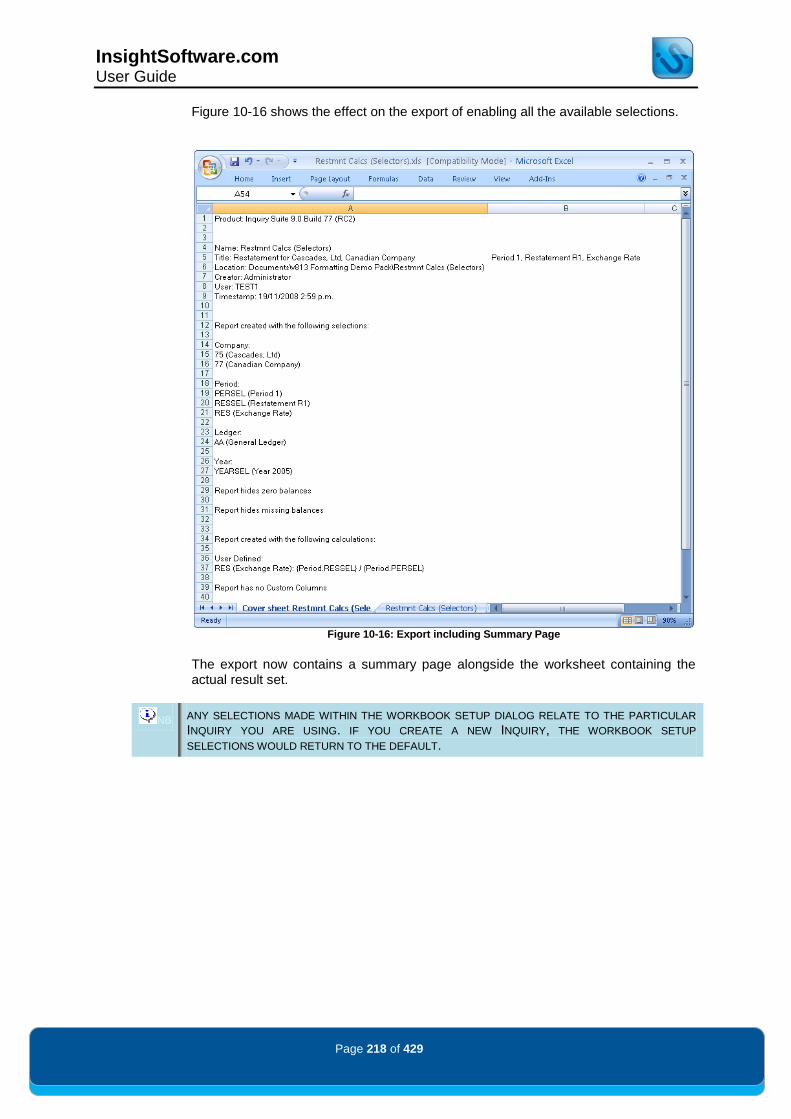
InsightSoftware.com User Guide
Page 218 of 429
Figure 10-16 shows the effect on the export of enabling all the available selections.
Figure 10-16: Export including Summary Page
The export now contains a summary page alongside the worksheet containing the actual result set.
NB ANY SELECTIONS MADE WITHIN THE WORKBOOK SETUP DIALOG RELATE TO THE PARTICULAR
INQUIRY YOU ARE USING. IF YOU CREATE A NEW INQUIRY, THE WORKBOOK SETUP
SELECTIONS WOULD RETURN TO THE DEFAULT.

InsightSoftware.com User Guide
Page 219 of 429
Print Options All of the options associated with Printing are stored within Print Options.
Print Options can be accessed either within the IS Button, via the Print section, as in Figure 10-17, or in the Home Ribbon Tab in the Documents section.
Figure 10-17: IS Button Print Options

InsightSoftware.com User Guide
Page 220 of 429
The Print Options dialog is shown below in Figure 10-18.
Figure 10-18: Print Options General Tab
Auditing Benefits
Using Insight®
Print Options is critical for maintaining compliance with Sarbanes-Oxley (also known as the Public Company Accounting Reform and Investor Protection Act of 2002).
The Cover Page tab functionality contains all of the underlying characteristics of the inquiry such as filter selections, calculations and currency restatements. This ensures that the PDF report maintains complete transparency in terms of the data disclosed when being reviewed by an external auditor.

InsightSoftware.com User Guide
Page 221 of 429
General Tab
The General tab of the Print Options dialog is divided into four sections:
Shape
o Page Size: sets the paper size on which the PDF output should be produced
o Orientation: sets the orientation of the output, either portrait or landscape mode
Layout
o Center horizontally: centers the output horizontally on the page
o Center vertically: centers the output vertically on the page
Scaling
o Preserve Aspect Ratio: ensures that the report will not be distorted when using the various scaling functions described below. Sometimes it may be necessary to shrink/stretch the image to fit your printing requirements, but this is not normally the case and should be left checked in most cases.
o None: presents the printed output over as many pages as is necessary (both from a width and height perspective) to contain all the columns and rows within the report
o Fit to Height: the rows of the inquiry result set will be printed on a single page. Depending upon the number of columns in the result set, the width is adjusted (if the aspect ratio has been set to be maintained) to occupy whatever space it needs to show the completed result set.
o Fit to Page: the rows and columns of the inquiry result set will be printed on no more than a single page. If the aspect ratio is not maintained, then the result set is scaled to occupy the full width and height of the page. If the aspect ratio is maintained, either the width or height is compromised to eliminate distortion.
o Fit to Width: the columns of the inquiry result set will be printed on a single page. Depending upon the number of rows in the result set, the height is adjusted (if the aspect ratio has been set to be maintained) to occupy whatever space it needs to show the completed result set.
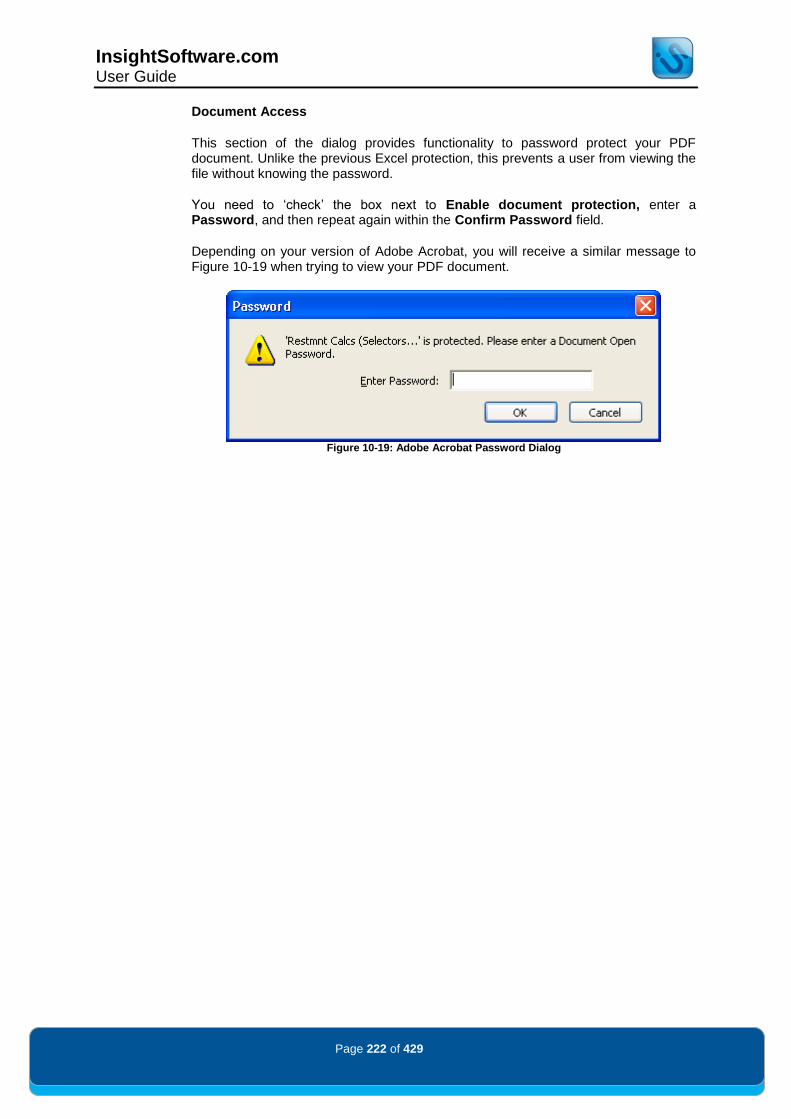
InsightSoftware.com User Guide
Page 222 of 429
Document Access
This section of the dialog provides functionality to password protect your PDF document. Unlike the previous Excel protection, this prevents a user from viewing the file without knowing the password.
You need to „check‟ the box next to Enable document protection, enter a Password, and then repeat again within the Confirm Password field.
Depending on your version of Adobe Acrobat, you will receive a similar message to Figure 10-19 when trying to view your PDF document.
Figure 10-19: Adobe Acrobat Password Dialog

InsightSoftware.com User Guide
Page 223 of 429
Cover Page Tab
The default selection in this screen is to not include a Cover Sheet as shown in Figure 10-20.
Figure 10-20: Default Disabled Cover Page Tab
Checking the box next to Include Cover Sheet will include the selections on the Cover Page. By default, certain selections are already enabled as shown in Figure 10-21.
Figure 10-21: Cover Page Defaults

InsightSoftware.com User Guide
Page 224 of 429
The individual selections are: o Product Version: displays the version of Insight
® that created the export
o Report name: includes the report name
o Report title: includes the report title
o Location: includes the file location of the inquiry
o Creator: includes the user name of the creator of the inquiry
o User: includes the name of the user producing the PDF output
o Date/time: includes the current date and time
o Filter selections: includes the filter selections
o Calculations: includes the calculations used in the inquiry
o Restatements: includes the currency restatement values used in the inquiry
o Logo: specifies that a logo will be displayed. To customize this icon, „click‟ on the associated control. This will open the dialog shown in Figure 10-22.
Specify the File and the Display Dimensions for the new Logo to be displayed.
Figure 10-22: Logo Dialog
o Page Numbers: „Checking‟ this option specifies that page numbers will be displayed on the Cover Page

InsightSoftware.com User Guide
Page 225 of 429
Figure 10-23 shows the effect on the export of enabling all the available selections.
Figure 10-23: Cover Page Example

InsightSoftware.com User Guide
Page 226 of 429
Report Tab
The Report Tab of the Print Options is divided up into two sections relating to Template and Page Break Settings, as shown in Figure 10-24.
Figure 10-24: Report Tab of Print Options

InsightSoftware.com User Guide
Page 227 of 429
Report Tab: Template
The Template section of this dialog shown in Figure 10-25 provides a method of adding Header and Footer information to each page of the PDF.
Figure 10-25: Template Section of Report Tab
o Show title: includes the report title in the header
o Show logo: places the default Insight®
logo in the top right-hand corner. This logo can be changed and personalized to include a company logo or other image.
o Show privacy message: places the text „Private and Confidential‟ in the bottom left-hand corner
o Show date/time: places the current date and time in the bottom left-hand corner
o Show page numbers: places the page number in the bottom right-hand corner. There is also the option of changing the Show Page Number Output by using the drop down control, which will switch between displaying just the current page number (page i) or alternatively the current page number with the total number of pages (page I of t).

InsightSoftware.com User Guide
Page 228 of 429
Report Tab: Page Break
The Page Break section of this dialog (Figure 10-26) provides a method of breaking the data displayed into different pages on the export.
Figure 10-26: Page Break Section of Report Tab
o Break after Subtotals: sets page breaks by each subtotal set in the inquiry
o Break by filter selection: sets page breaks by the selections made within the filters. There are two options for this functionality:
o All Combinations: includes in the PDF output all the data returned by the inquiry filter selections. The dialog displays a total of the number of page breaks which the current settings will return.
o Selected Combinations: allows you to select a subset of the data returned by the inquiry filters. „Click‟ on „…‟ to launch the Member Selections dialog shown in Figure 10-27. Select a Filter in the left dialog and check the Code you wish to break by in the PDF output.
Figure 10-27: Member Selection Dialog
o Generate Pages without Data: generates blank pages in the PDF output for selections that return no data
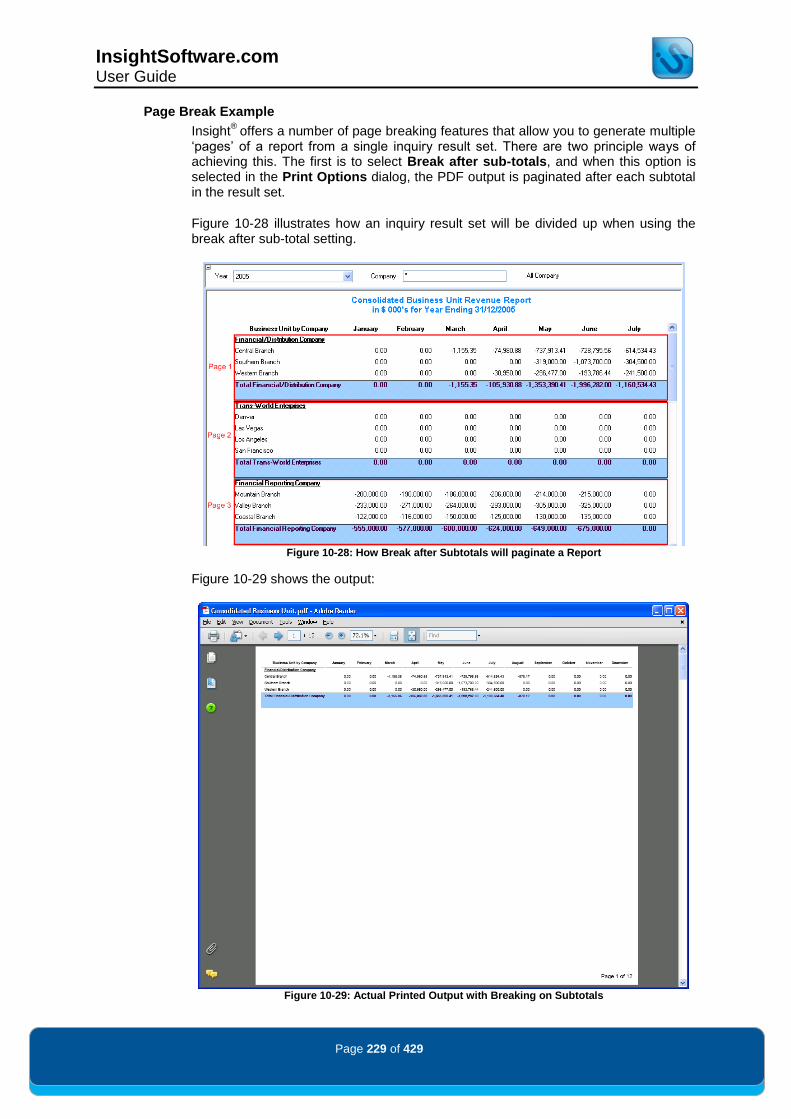
InsightSoftware.com User Guide
Page 229 of 429
Page Break Example
Insight®
offers a number of page breaking features that allow you to generate multiple „pages‟ of a report from a single inquiry result set. There are two principle ways of achieving this. The first is to select Break after sub-totals, and when this option is selected in the Print Options dialog, the PDF output is paginated after each subtotal in the result set.
Figure 10-28 illustrates how an inquiry result set will be divided up when using the break after sub-total setting.
Figure 10-28: How Break after Subtotals will paginate a Report
Figure 10-29 shows the output:
Figure 10-29: Actual Printed Output with Breaking on Subtotals
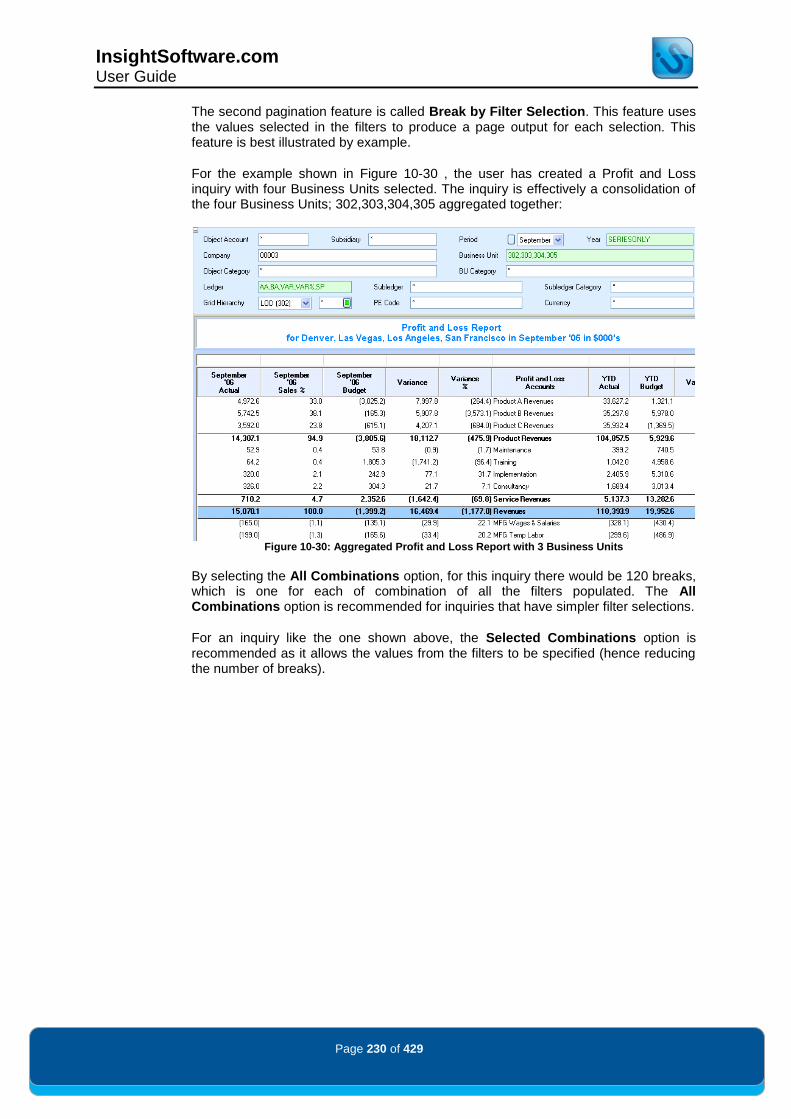
InsightSoftware.com User Guide
Page 230 of 429
The second pagination feature is called Break by Filter Selection. This feature uses the values selected in the filters to produce a page output for each selection. This feature is best illustrated by example.
For the example shown in Figure 10-30 , the user has created a Profit and Loss inquiry with four Business Units selected. The inquiry is effectively a consolidation of the four Business Units; 302,303,304,305 aggregated together:
Figure 10-30: Aggregated Profit and Loss Report with 3 Business Units
By selecting the All Combinations option, for this inquiry there would be 120 breaks, which is one for each of combination of all the filters populated. The All Combinations option is recommended for inquiries that have simpler filter selections.
For an inquiry like the one shown above, the Selected Combinations option is recommended as it allows the values from the filters to be specified (hence reducing the number of breaks).

InsightSoftware.com User Guide
Page 231 of 429
In the example shown in Figure 10-31, we are using the Selected Combinations functionality to only select the four values within the Business Unit filter.
Figure 10-31: Selected Combinations – Member Selection Dialog
When printed, a profit and loss report is produced for each of the business units and placed on a separate page within a single PDF file. This is shown in Figure 10-32.
Figure 10-32: Example PDF Output Using the Break by Filter Selection Option

InsightSoftware.com User Guide
Page 232 of 429
Insight
® can display report data in graph or chart form. This tool gives you complete
control over all aspects of the appearance of charts, including chart type, axis settings and regression lines.
Where applicable, a legend or key is displayed with each chart, allowing you to identify the series by color as shown in Figure 11-1.
Figure 11-1: An Example of an Inquiry Incorporating a Chart
Creating a Chart To display a chart in your report, „click‟ on the View Ribbon Tab and select the option from the Show Chart icon in the Chart Options section.
The Graphing/Charting feature uses the content of an open inquiry and allows you to view the data using one of a range of possible chart types, giving you control over chart layout and formatting. Charts appear both on screen and in printed output. Insight
® does not support exporting charts to Excel.
Display You can switch between chart, spreadsheet and mixed modes using the ribbon‟s Show Chart Control as shown in Figure 11-2:
Figure 11-2: Show Chart Control within the Ribbon
NB THE SHOW CHART CONTROL ONLY AFFECTS THE DISPLAY OF THE CHART WITHIN INSIGHT®.
WHEN PRINTING TO PDF, THE GRAPH IS DISPLAYED ON A SEPARATE PAGE.
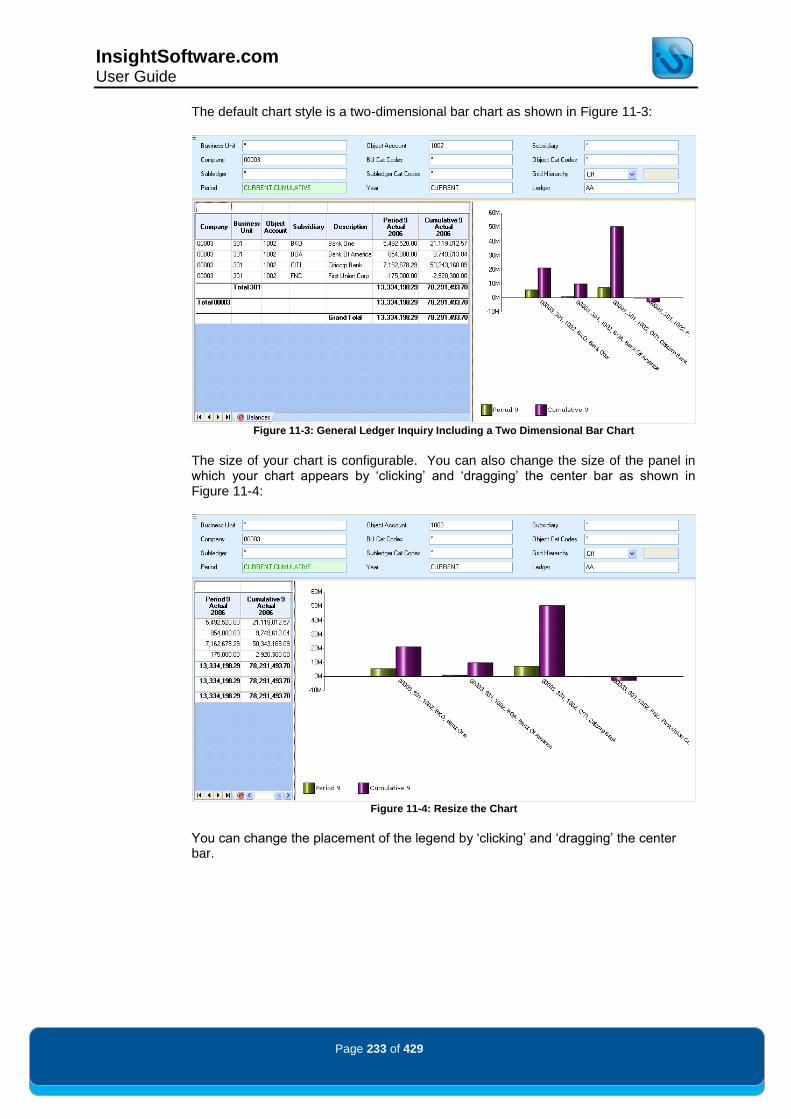
InsightSoftware.com User Guide
Page 233 of 429
The default chart style is a two-dimensional bar chart as shown in Figure 11-3:
Figure 11-3: General Ledger Inquiry Including a Two Dimensional Bar Chart
The size of your chart is configurable. You can also change the size of the panel in which your chart appears by „clicking‟ and „dragging‟ the center bar as shown in Figure 11-4:
Figure 11-4: Resize the Chart
You can change the placement of the legend by „clicking‟ and „dragging‟ the center bar.

InsightSoftware.com User Guide
Page 234 of 429
Controlling the Chart Chart rendering is controlled through the Chart Option dialog. The dialog can be displayed either by „right-clicking‟ the chart and selecting Chart Options, or „clicking‟ on the Chart Options icon in the View Ribbon Tab.
The Chart Type tab
The Chart Type tab (see Figure 11-5) controls the look and type of the chart. Here you can choose between multiple types of charts.
Figure 11-5: The Chart Type Tab
Bar Chart: Vertical Bar with Line Overlays type (the default chart type) is shown in Figure 11-6.
Figure 11-6: Vertical Bar with Line Overlays

InsightSoftware.com User Guide
Page 235 of 429
Bar Chart: Horizontal Bar type is shown in Figure 11-7.
Figure 11-7: Horizontal Bar
Line Based Charts: Area with Line Overlays type (similar to a stacked line chart) is shown in Figure 11-8.
Figure 11-8: Area with Line Overlays
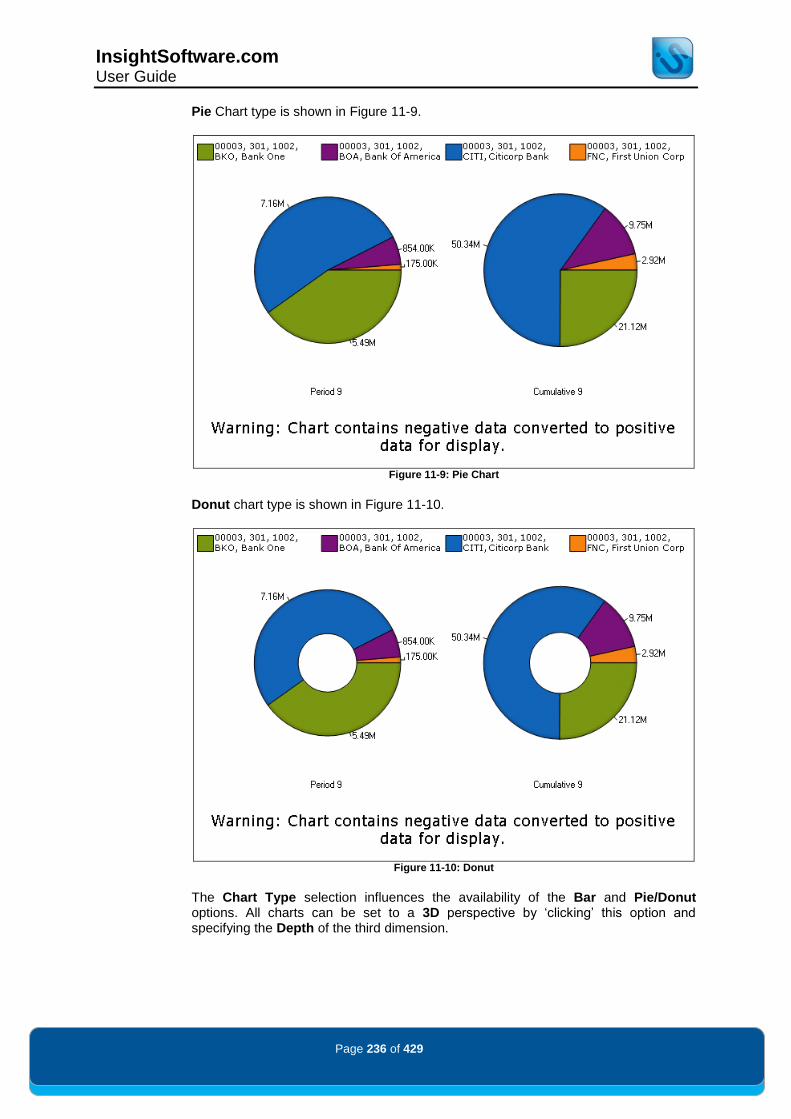
InsightSoftware.com User Guide
Page 236 of 429
Pie Chart type is shown in Figure 11-9.
Figure 11-9: Pie Chart
Donut chart type is shown in Figure 11-10.
Figure 11-10: Donut
The Chart Type selection influences the availability of the Bar and Pie/Donut options. All charts can be set to a 3D perspective by „clicking‟ this option and specifying the Depth of the third dimension.
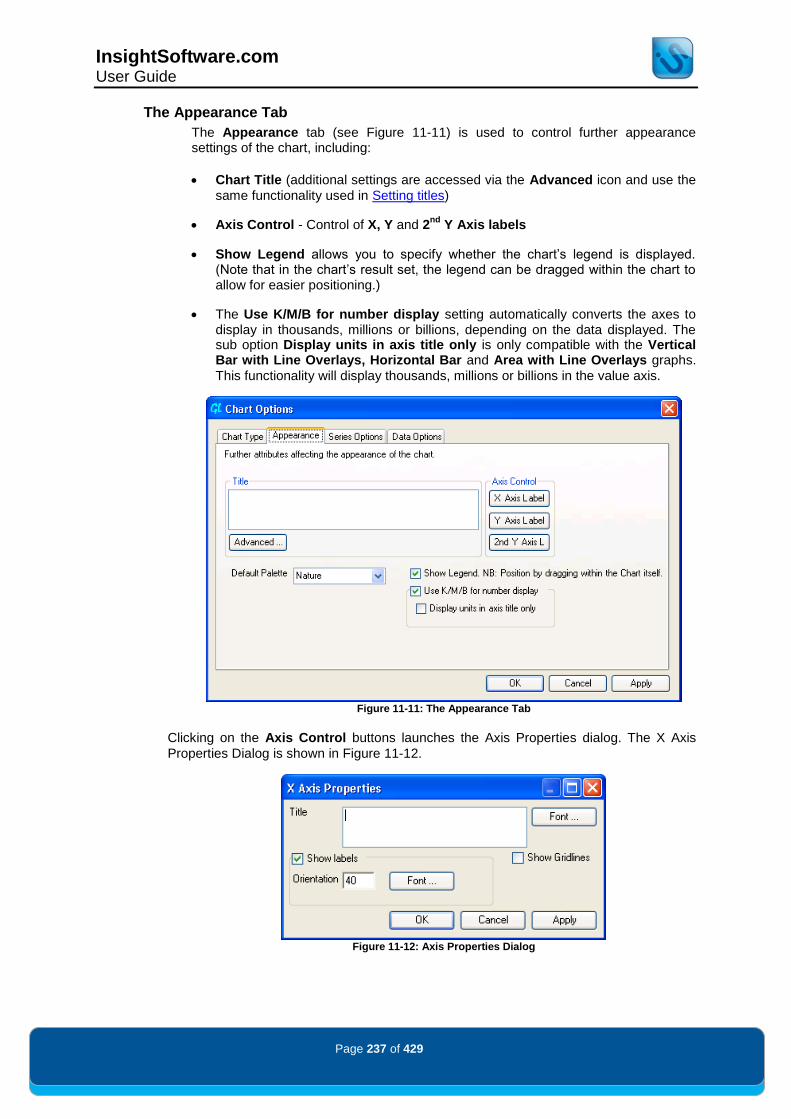
InsightSoftware.com User Guide
Page 237 of 429
The Appearance Tab
The Appearance tab (see Figure 11-11) is used to control further appearance settings of the chart, including:
Chart Title (additional settings are accessed via the Advanced icon and use the
same functionality used in Setting titles)
Axis Control - Control of X, Y and 2nd
Y Axis labels
Show Legend allows you to specify whether the chart‟s legend is displayed. (Note that in the chart‟s result set, the legend can be dragged within the chart to allow for easier positioning.)
The Use K/M/B for number display setting automatically converts the axes to display in thousands, millions or billions, depending on the data displayed. The sub option Display units in axis title only is only compatible with the Vertical Bar with Line Overlays, Horizontal Bar and Area with Line Overlays graphs.
This functionality will display thousands, millions or billions in the value axis.
Figure 11-11: The Appearance Tab
Clicking on the Axis Control buttons launches the Axis Properties dialog. The X Axis
Properties Dialog is shown in Figure 11-12.
Figure 11-12: Axis Properties Dialog
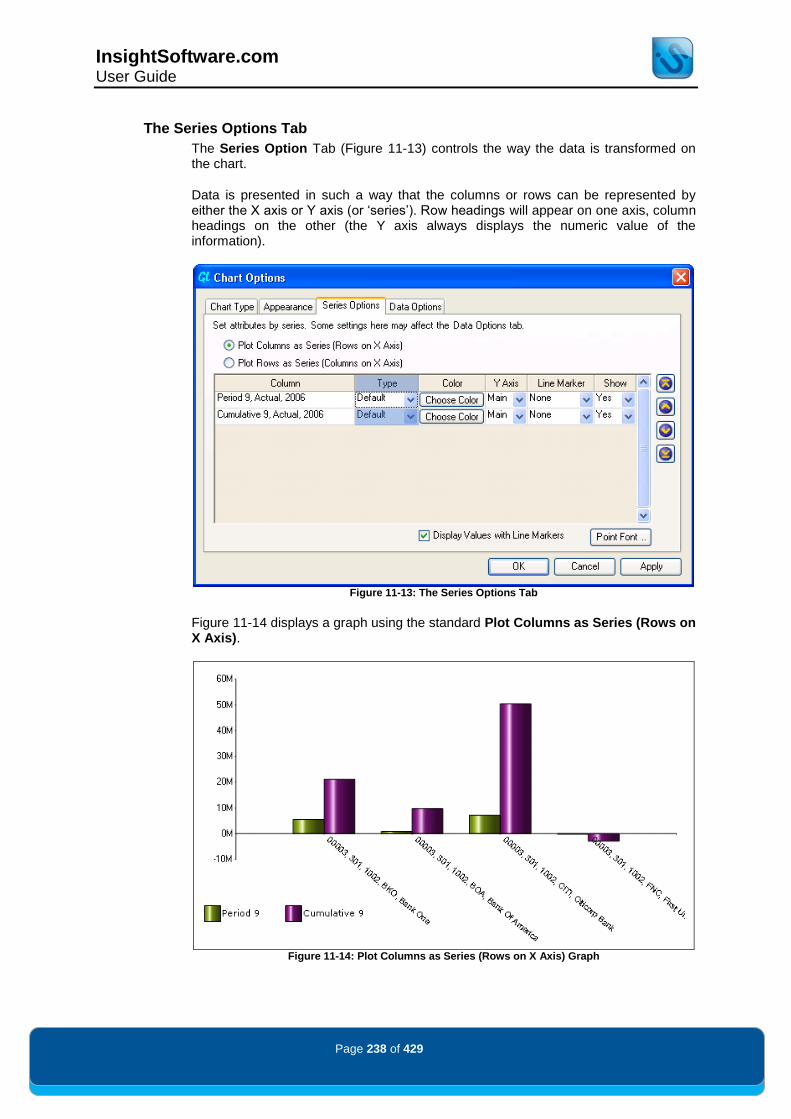
InsightSoftware.com User Guide
Page 238 of 429
The Series Options Tab
The Series Option Tab (Figure 11-13) controls the way the data is transformed on the chart.
Data is presented in such a way that the columns or rows can be represented by either the X axis or Y axis (or „series‟). Row headings will appear on one axis, column headings on the other (the Y axis always displays the numeric value of the information).
Figure 11-13: The Series Options Tab
Figure 11-14 displays a graph using the standard Plot Columns as Series (Rows on X Axis).
Figure 11-14: Plot Columns as Series (Rows on X Axis) Graph
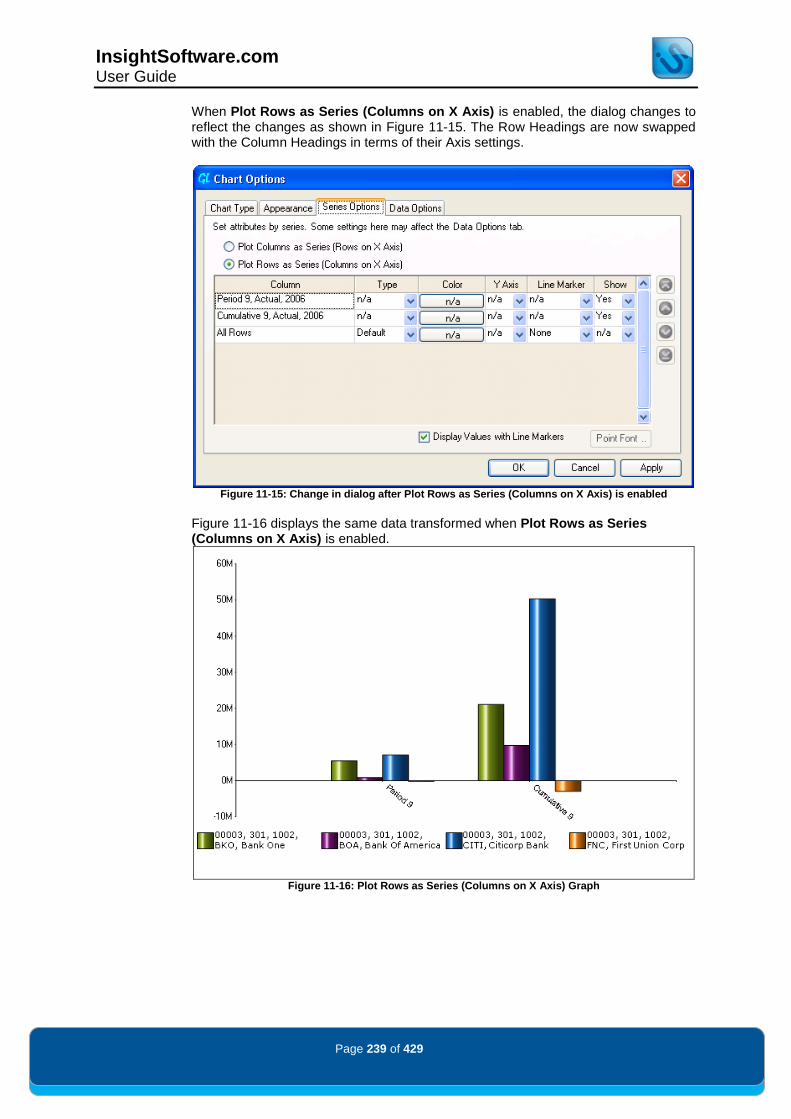
InsightSoftware.com User Guide
Page 239 of 429
When Plot Rows as Series (Columns on X Axis) is enabled, the dialog changes to reflect the changes as shown in Figure 11-15. The Row Headings are now swapped with the Column Headings in terms of their Axis settings.
Figure 11-15: Change in dialog after Plot Rows as Series (Columns on X Axis) is enabled
Figure 11-16 displays the same data transformed when Plot Rows as Series (Columns on X Axis) is enabled.
Figure 11-16: Plot Rows as Series (Columns on X Axis) Graph

InsightSoftware.com User Guide
Page 240 of 429
Within the sub dialog of the Series Option Tab, you have the ability to update columns and the way that they are displayed.
Figure 11-17: Column Options
The Type setting allows you to mix other chart types in with Bar Charts, e.g. Lines or Curves.
The Color icon opens the standard Color dialog, allowing you to change the display of this Column.
Additionally, a column can be assigned to the Main or 2nd Y axis through the Y Axis Drop down. Enabling 2nd will cause a secondary Y axis to be displayed (this axis may have different divisors reflecting the data‟s own ranges).
Line Markers allows the graph to display Rectangular, Circle, Triangle and Diamond markers that correlate to the X axis.
Show is used to define whether a column is displayed on the graph result set.
If Line Markers are specified, values can be specified on the graph by enabling Display Values with Line Markers. The associated font for these values can also be specified by „clicking‟ on the Point Font icon.
The Series can also be reordered by using the up and down arrows on the right hand side of the dialog.
NB SUBTOTALS AND GRAND TOTALS ARE AUTOMATICALLY REMOVED FROM THE DATA PLOTTED IN
CHARTS. IF YOU WISH TO CREATE A CHART USING THESE FIGURES, YOU WILL NEED TO DESIGN
A SEPARATE REPORT WHICH IS BASED ON AGGREGATED VALUES.
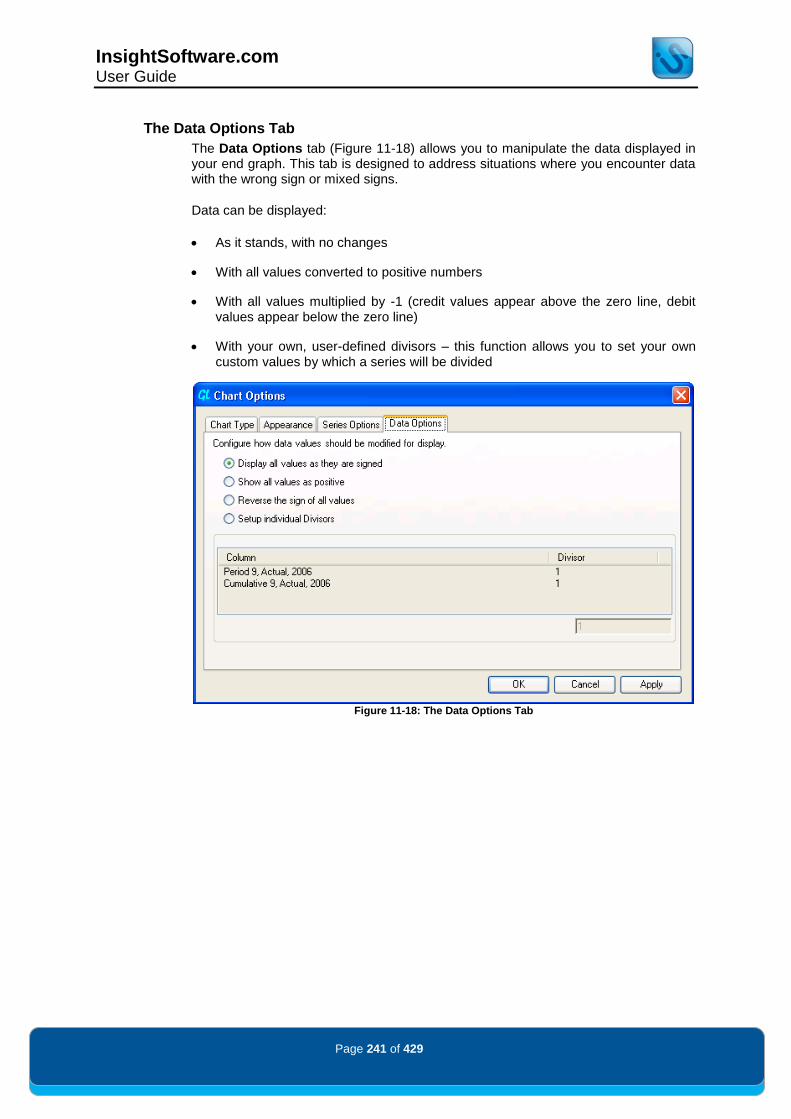
InsightSoftware.com User Guide
Page 241 of 429
The Data Options Tab
The Data Options tab (Figure 11-18) allows you to manipulate the data displayed in your end graph. This tab is designed to address situations where you encounter data with the wrong sign or mixed signs.
Data can be displayed:
As it stands, with no changes
With all values converted to positive numbers
With all values multiplied by -1 (credit values appear above the zero line, debit values appear below the zero line)
With your own, user-defined divisors – this function allows you to set your own custom values by which a series will be divided
Figure 11-18: The Data Options Tab

InsightSoftware.com User Guide
Page 242 of 429
One of the most powerful features of the product is the ability to include pre-defined or user-defined calculations. Calculated inquiry items are perfect for providing variances, aggregations or Key Performance Indicators that are not directly available in the original data.
Once defined, each calculated item can be manipulated just like any other inquiry item; you can move it, format it and even base other calculated items on it.
Selecting Calculations from the Inquiry Objects Ribbon Tab displays the Calculations dialog shown in Figure 12-1:
Figure 12-1: The Calculations Dialog
Using Pre-defined Calculations Insight
® is shipped with two tabs of pre-defined calculations; these are the General
and Standard calculation tabs.
Check the checkbox next to a calculation and, assuming its principle dimension has been selected in the inquiry columns, it is added to the report.
The third tab, the All tab, displays all calculations in one list, sorted by name.
Uniquely within the Job Cost module, a fourth tab called Job Cost will be displayed, which provides a series of pre-defined calculations specific to that module.
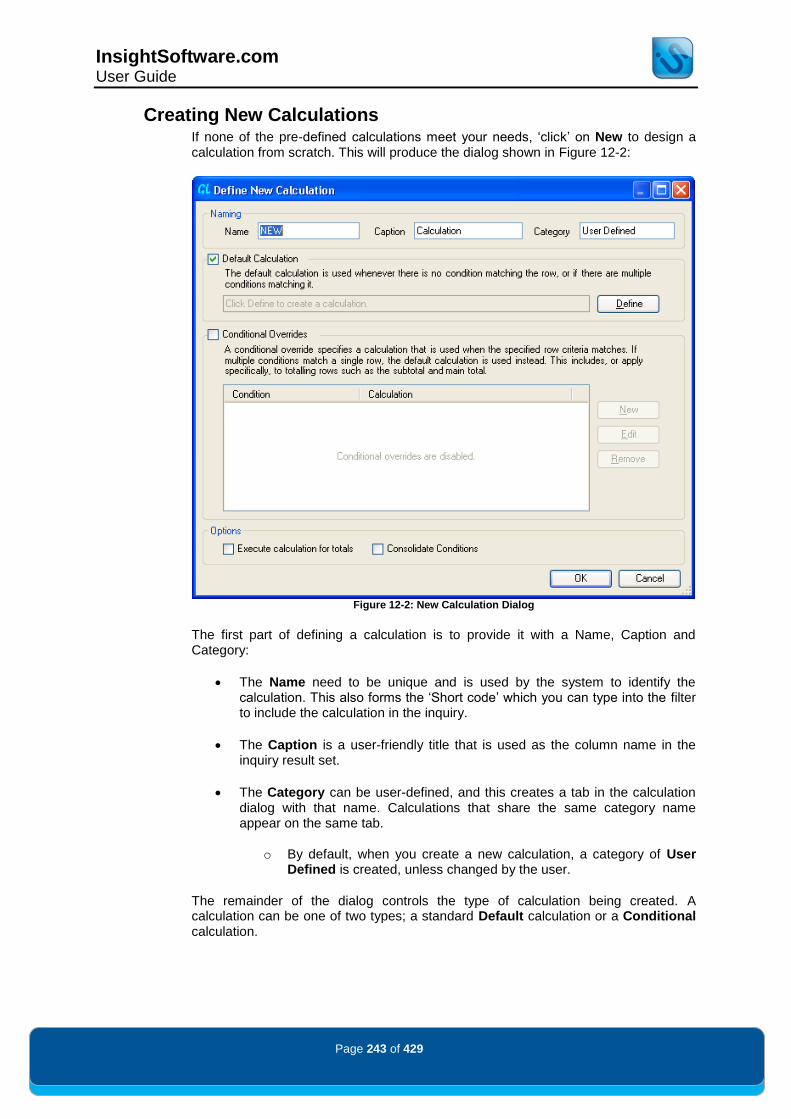
InsightSoftware.com User Guide
Page 243 of 429
Creating New Calculations If none of the pre-defined calculations meet your needs, „click‟ on New to design a calculation from scratch. This will produce the dialog shown in Figure 12-2:
Figure 12-2: New Calculation Dialog
The first part of defining a calculation is to provide it with a Name, Caption and Category:
The Name need to be unique and is used by the system to identify the calculation. This also forms the „Short code‟ which you can type into the filter to include the calculation in the inquiry.
The Caption is a user-friendly title that is used as the column name in the inquiry result set.
The Category can be user-defined, and this creates a tab in the calculation dialog with that name. Calculations that share the same category name appear on the same tab.
o By default, when you create a new calculation, a category of User Defined is created, unless changed by the user.
The remainder of the dialog controls the type of calculation being created. A calculation can be one of two types; a standard Default calculation or a Conditional calculation.
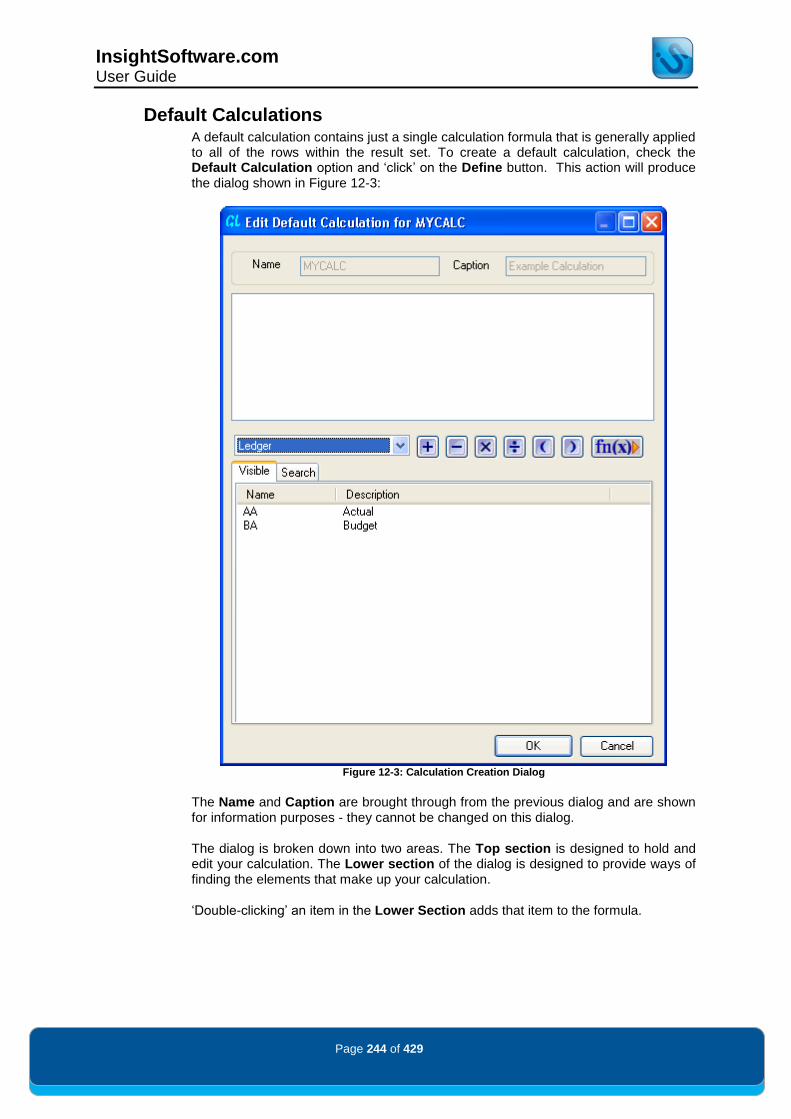
InsightSoftware.com User Guide
Page 244 of 429
Default Calculations A default calculation contains just a single calculation formula that is generally applied to all of the rows within the result set. To create a default calculation, check the Default Calculation option and „click‟ on the Define button. This action will produce the dialog shown in Figure 12-3:
Figure 12-3: Calculation Creation Dialog
The Name and Caption are brought through from the previous dialog and are shown for information purposes - they cannot be changed on this dialog.
The dialog is broken down into two areas. The Top section is designed to hold and edit your calculation. The Lower section of the dialog is designed to provide ways of finding the elements that make up your calculation.
„Double-clicking‟ an item in the Lower Section adds that item to the formula.

InsightSoftware.com User Guide
Page 245 of 429
„Clicking‟ buttons from the Quick Formula Creation bar adds operations to the formula as shown in Figure 12-4:
Figure 12-4: Quick Formula Creation Bar
Alternatively, a user can type directly into the Top section of the dialog.
The Filter Control (shown in Figure 12-5) contains just those dimensions that are eligible for inclusion in calculations. In addition, it has a selection to access other calculations, which of course may themselves be terms in a formula.
Figure 12-5: Filter Control
Default Calculation Example
A variance calculation example is shown in Figure 12-6.
Figure 12-6: Variation Calculation
This calculation explicitly mentions the terms to be included – in this case Actual and Budget. The individual selections are enclosed in curly brackets to aid legibility.
It is also possible to select items by their selection position in the inquiry using Calculation Functions, as shown in Figure 12-7:
Figure 12-7: Quick Buttons of Calculation Functions for Positional Items
NB THE MORE FUNCTIONS OPTION IS RELATED TO THE CUSTOM COLUMNS FUNCTIONALITY.

InsightSoftware.com User Guide
Page 246 of 429
In Figure 12-8, these calculation functions are used on Ledger Type to create a dynamic calculation where the first item in the Ledger Type filter is subtracted from the second item in the Ledger Type filter. For example, if the first item was AA and the second BA, the formula would be AA – BA. However, if the filter items were in reverse, then the formula would be BA – AA:
Figure 12-8: A Calculation using Positional Items
NB POSITIONAL CALCULATIONS USE TRADITIONAL PARENTHESES TO DEFINE THE POSITIONAL
ITEMS.
When the formula for the calculation has been defined, „click‟ on the OK button to validate and confirm that the calculation is to be created. If there are no conditions to be attached to this calculation, „click‟ on the OK button again to return to the main calculation dialog shown in Figure 12-9:
Figure 12-9: User Defined Calculations
To include the new calculation in the inquiry, check the tick box in the same manner as you would to include pre-defined calculations.
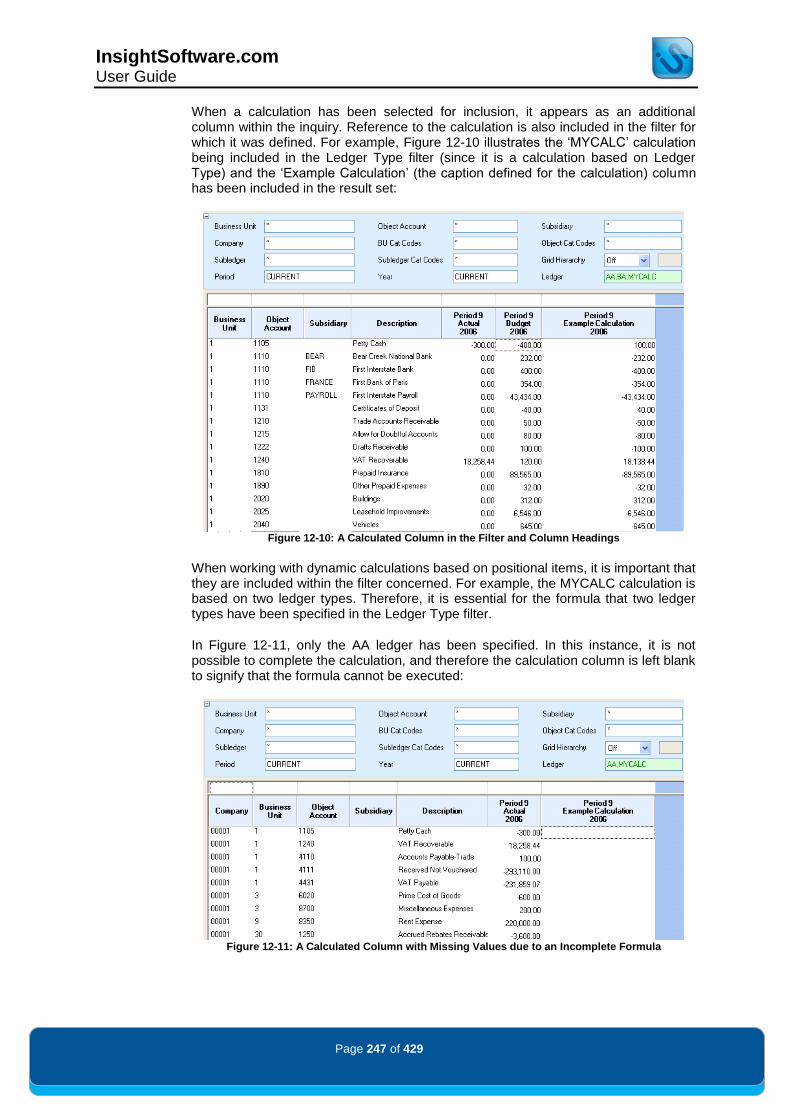
InsightSoftware.com User Guide
Page 247 of 429
When a calculation has been selected for inclusion, it appears as an additional column within the inquiry. Reference to the calculation is also included in the filter for which it was defined. For example, Figure 12-10 illustrates the „MYCALC‟ calculation being included in the Ledger Type filter (since it is a calculation based on Ledger Type) and the „Example Calculation‟ (the caption defined for the calculation) column has been included in the result set:
Figure 12-10: A Calculated Column in the Filter and Column Headings
When working with dynamic calculations based on positional items, it is important that they are included within the filter concerned. For example, the MYCALC calculation is based on two ledger types. Therefore, it is essential for the formula that two ledger types have been specified in the Ledger Type filter.
In Figure 12-11, only the AA ledger has been specified. In this instance, it is not possible to complete the calculation, and therefore the calculation column is left blank to signify that the formula cannot be executed:
Figure 12-11: A Calculated Column with Missing Values due to an Incomplete Formula

InsightSoftware.com User Guide
Page 248 of 429
Cross Dimensional Calculations The most commonly used calculated items are totals, ratios and averages, and involve references to items from the same filter, i.e. ledger types AA and BA. The resulting variance calculation „belongs‟ to the Ledger Type filter. Insight
® also supports cross-dimensional calculations where reference is made to
items from more than one column axis filter. To include a cross-dimensional reference in a calculation, append the item from the second filter when defining the calculation. For example, {Period.8} refers only to August in the Period filter while {Period.8}{Ledger.AA} refers to the specific combination of August in the Period filter and Actual in the Ledger Type filter. This would designate „Actual figures for August‟. The calculation is shown below in Figure 12-12 and the associated result set is shown in Figure 12-13.
Figure 12-12: Cross Dimension Calculation
Figure 12-13: Associated Result Set
The row for Product A Revenues shows that the two calculations are based on Period 8‟s fixed amount of -1,548,082.47, less the BA amounts. -1,548,082.47 – 1,070,539.00 (Period 8 Budget) = -2,618,621.47 -1,548,082.47 – 2,216,204.00 (Period 9 Budget) = -3,764,286.47

InsightSoftware.com User Guide
Page 249 of 429
Total/Subtotal Calculation Logic
In selecting the Execute calculation for Totals (see Figure 12-14) option when defining your calculations, Insight
® calculates the totals based on the columns
calculation. If this option is left unchecked, Insight®
will sum the columns values.
Figure 12-14: Execute Calculation for Totals Enabled
The effect of this option can be seen in the following two examples, which are using the standard Variance % calculation provided with the General Ledger‟s Balances template.
The Variance % calculation provides a percentage based on (Ledger(1) – Ledger (2))/Ledger(2) *100. In this example this is the General Ledger – Budget Amount Ledger / General Ledger * 100.

InsightSoftware.com User Guide
Page 250 of 429
In the first example, Figure 12-15, the Execute calculation for totals option is enabled for the calculated column „Variance %‟.
As a result, the Grand Total is correctly showing 2.94% for the Variance % Column. This is the calculated percentage of the other two Grand Total amounts.
Figure 12-15: Result Set when Execute Calculation for Totals is Enabled
In Figure 12-16, the Execute calculation for totals option is disabled.
As a result, the Grand Total for the Variance % column is incorrectly showing a percentage of 4.54. This is the sum of the columns‟ percentages and is incorrect for the purpose of this report.
Figure 12-16: Result Set when Execute Calculation for Totals is Disabled

InsightSoftware.com User Guide
Page 251 of 429
Conditional Calculations Conditional calculations, a feature for advanced users, allow you to define not only formulas as previously described, but to provide alternate calculations based on certain conditions. In the example shown in Figure 12-17, we will create a single column based on a combination of data items in the AA and AU ledger types. Rather than displaying two columns, we want to show a single column in the report.
Figure 12-17: Example Data Set for a Conditional Calculation

InsightSoftware.com User Guide
Page 252 of 429
By default, we want all the accounts up to 9900 to be based on the AA ledger type. This is done by setting a default calculation, as shown in Figure 12-18:
Figure 12-18: Default Calculation Based on the AA Ledger Type

InsightSoftware.com User Guide
Page 253 of 429
In the example, it is important to distinguish the accounts below 9900, which should use this calculation with no further definition required, and those accounts above 9900, which need to use a different calculation based on the AU ledger type.
To do this, check the Conditional Overrides option in the New Calculation dialog and then „click‟ the New button. This will bring up the dialog shown in Figure 12-19:
Figure 12-19: Defining a Calculation Condition
A calculation condition may be defined on any available filter or column, regardless of whether or not it is currently displayed in the result set.
Since we are working in the General Ledger module, the dialog displays the Account Currency by default since this is alphabetically the first in the list. For this example, we are working with object accounts, so Object Account is selected from the drop down list. Next, choose the Setting: a Simple Condition based on one account, Value List Condition based on multiple values, or a Range Condition with many object accounts within a single range.
In this example, we wish to select range. Next, specify the accounts within the range by typing into the two edit boxes.
NB A RANGE CONDITION ALLOWS YOU TO SELECT ALL THE VALUES WITHIN A RANGE, E.G. 1:5. THE VALUE LIST CONDITION ALLOWS YOU TO SPECIFY THE INDIVIDUAL VALUES LIKE 1,2,4,5. PREVIOUSLY THIS WOULD REQUIRE TWO INDEPENDENT RANGE CONDITIONS, ONE FOR 1:2 AND
ONE FOR 4:5.
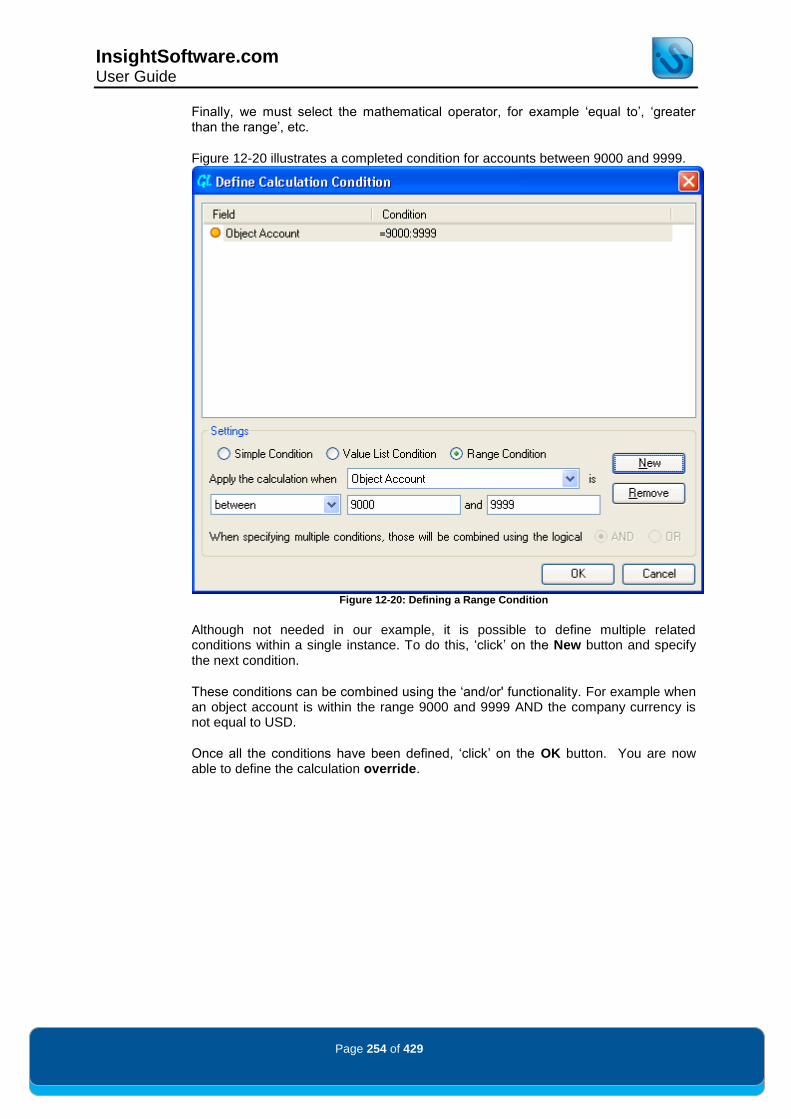
InsightSoftware.com User Guide
Page 254 of 429
Finally, we must select the mathematical operator, for example „equal to‟, „greater than the range‟, etc.
Figure 12-20 illustrates a completed condition for accounts between 9000 and 9999.
Figure 12-20: Defining a Range Condition
Although not needed in our example, it is possible to define multiple related conditions within a single instance. To do this, „click‟ on the New button and specify the next condition.
These conditions can be combined using the „and/or' functionality. For example when an object account is within the range 9000 and 9999 AND the company currency is not equal to USD.
Once all the conditions have been defined, „click‟ on the OK button. You are now able to define the calculation override.

InsightSoftware.com User Guide
Page 255 of 429
In our example, we are going to display the contents of the AU ledger since it will provide the actual headcount. (Since headcount is not a monetary value, the actual figure is stored in the AU ledger rather than the AA ledger.) See Figure 12-21 below.
Figure 12-21: Defining an Alternative Calculation
The condition is shown in the top edit box. This condition can be changed at any time by „clicking‟ on the Define button. Once the formula has been defined, „click‟ the OK button to return to the New Calculation dialog.

InsightSoftware.com User Guide
Page 256 of 429
The conditional calculation that has been defined will now be shown in the dialog, as illustrated in Figure 12-22:
Figure 12-22: The Completed Conditional Calculation
Once a condition is defined, you can define alternate conditions by „clicking‟ on the New button. Existing conditions can be edited by „clicking‟ on the Edit button, and unwanted conditions can be permanently deleted by „clicking‟ on the Remove button.
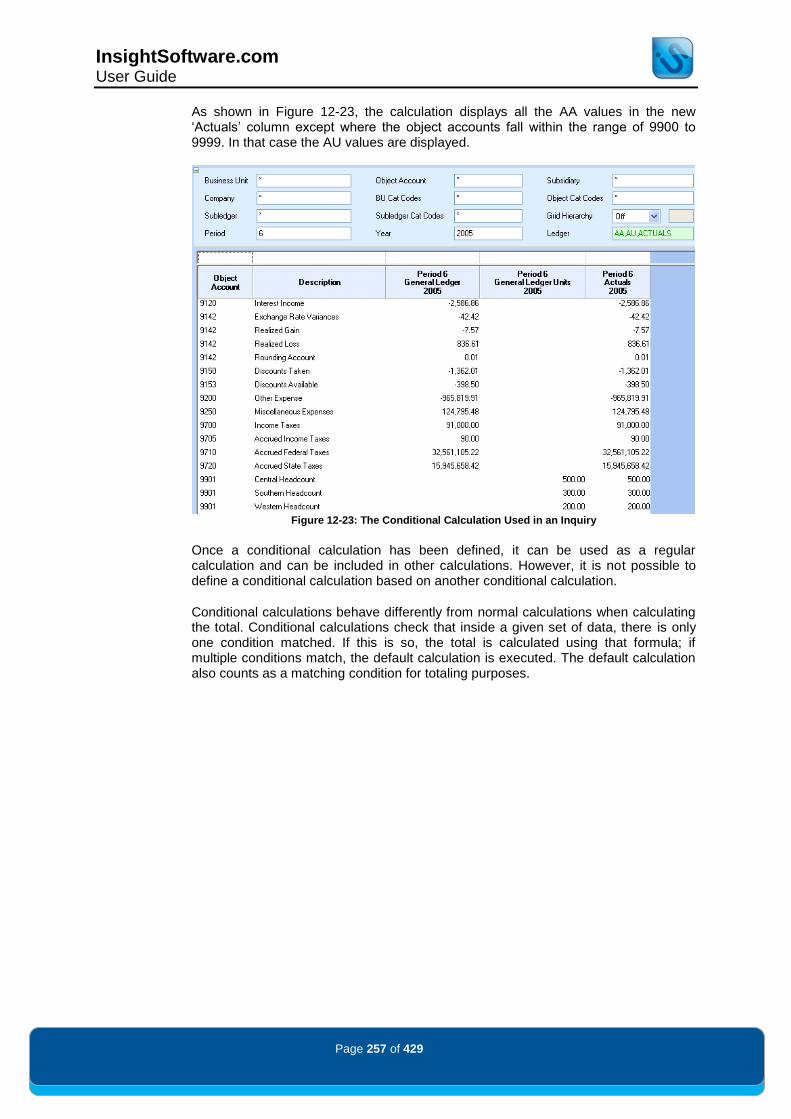
InsightSoftware.com User Guide
Page 257 of 429
As shown in Figure 12-23, the calculation displays all the AA values in the new „Actuals‟ column except where the object accounts fall within the range of 9900 to 9999. In that case the AU values are displayed.
Figure 12-23: The Conditional Calculation Used in an Inquiry
Once a conditional calculation has been defined, it can be used as a regular calculation and can be included in other calculations. However, it is not possible to define a conditional calculation based on another conditional calculation.
Conditional calculations behave differently from normal calculations when calculating the total. Conditional calculations check that inside a given set of data, there is only one condition matched. If this is so, the total is calculated using that formula; if multiple conditions match, the default calculation is executed. The default calculation also counts as a matching condition for totaling purposes.

InsightSoftware.com User Guide
Page 258 of 429
Dates in Conditional Calculations
Using dates in the conditional calculation can be set as a simple condition; you can set the date as one of the following:
Equal to
Not equal to
Greater than
Less than
Greater or equal than
Less or equal than
Or alternatively set as a range with the dates as one of the following:
Between
Not between
An example of a conditional calculation based on a date range can be seen below in Figure 12-24.
Figure 12-24: Using Dates in Calculations
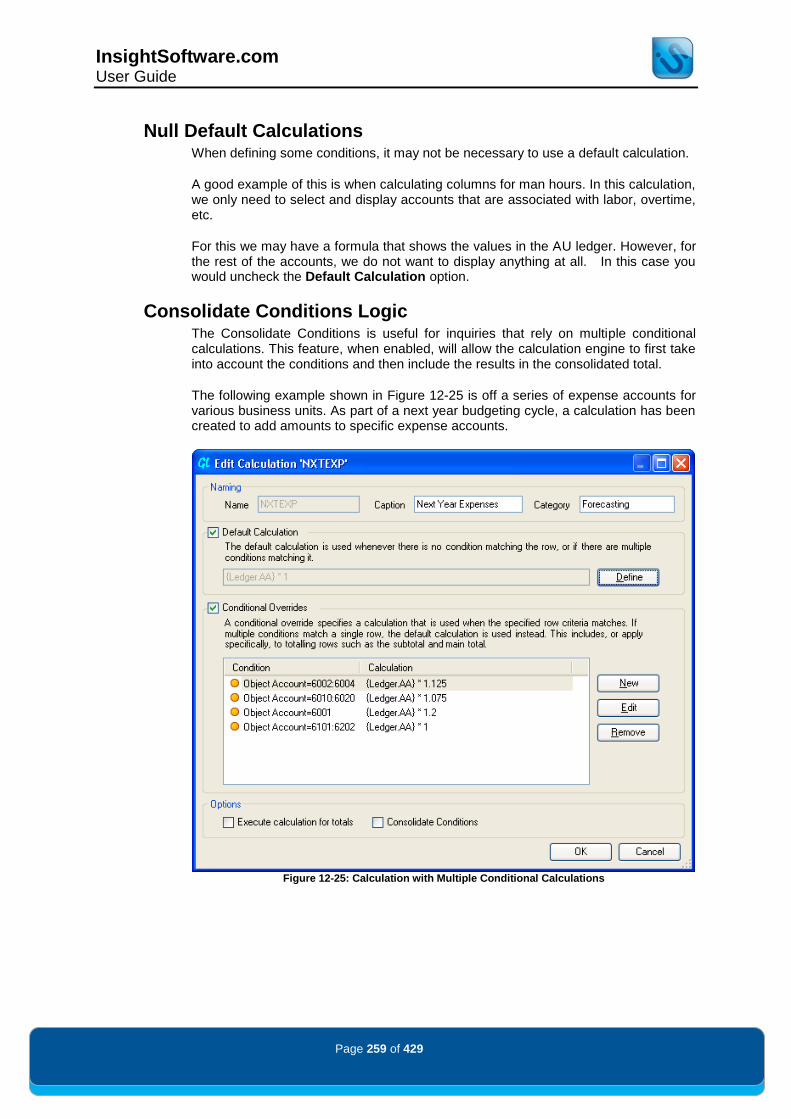
InsightSoftware.com User Guide
Page 259 of 429
Null Default Calculations When defining some conditions, it may not be necessary to use a default calculation.
A good example of this is when calculating columns for man hours. In this calculation, we only need to select and display accounts that are associated with labor, overtime, etc.
For this we may have a formula that shows the values in the AU ledger. However, for the rest of the accounts, we do not want to display anything at all. In this case you would uncheck the Default Calculation option.
Consolidate Conditions Logic The Consolidate Conditions is useful for inquiries that rely on multiple conditional calculations. This feature, when enabled, will allow the calculation engine to first take into account the conditions and then include the results in the consolidated total.
The following example shown in Figure 12-25 is off a series of expense accounts for various business units. As part of a next year budgeting cycle, a calculation has been created to add amounts to specific expense accounts.
Figure 12-25: Calculation with Multiple Conditional Calculations

InsightSoftware.com User Guide
Page 260 of 429
The result set is shown below in Figure 12-26.
Figure 12-26: Result Set of Calculation
At this point, you may wish to consolidate the results down to the specific business unit as shown in Figure 12-27, which is done by removing the object account and description columns.
Figure 12-27: Result Set When Other Columns are Removed
The underlying logic for consolidated calculations based on the same condition is to roll back to the Default Calculation. For this example, the default calculation was „{Ledger.AA} * 1‟ which will return the same value as the first column.

InsightSoftware.com User Guide
Page 261 of 429
This value, however, does not include the multipliers in the Conditional Calculation overrides. To take these into account, „click‟ on the Conditional Overrides tick box as shown in Figure 12-28.
Figure 12-28: Consolidate Conditions Enabled on the Calculation
When you „click‟ OK the following dialog shown in Figure 12-29 will be displayed if you also have a Default Calculation.
Figure 12-29: Consolidate Condition Message Dialog
The Consolidate Conditions functionality only takes into account the Conditional Overrides included within the calculation. When Consolidate Conditions is enabled, the effect of the Default Calculation will not be included in the result set.
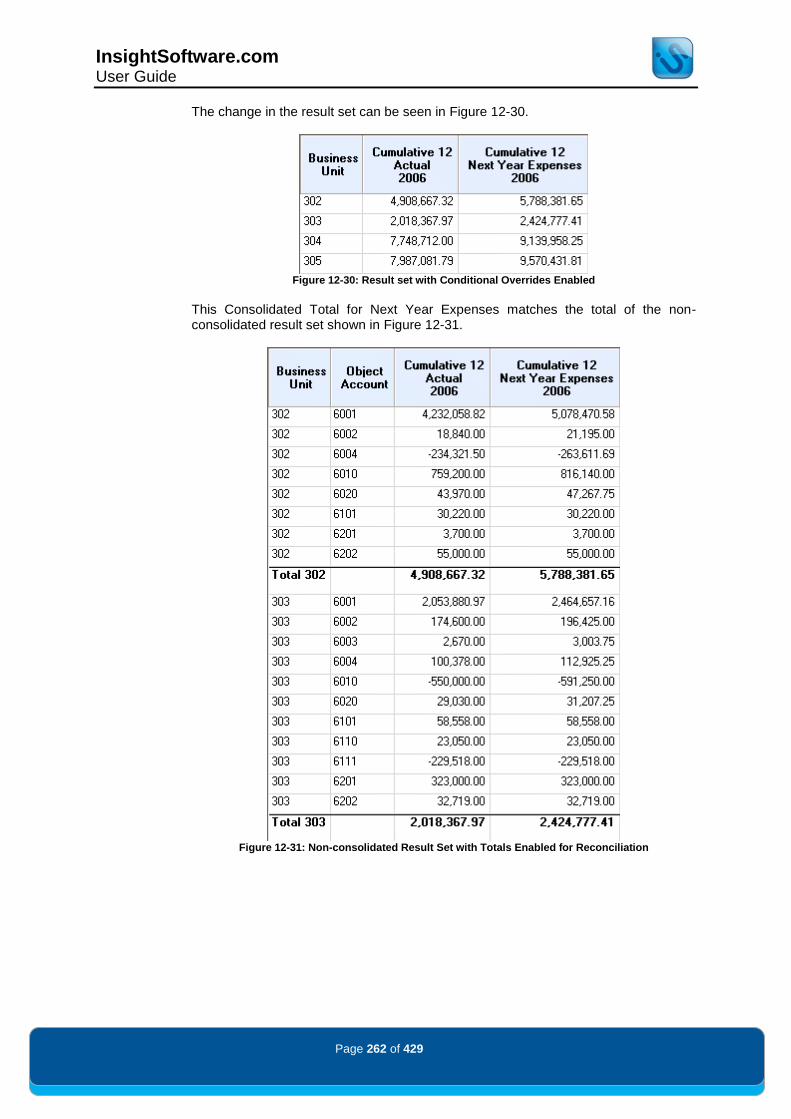
InsightSoftware.com User Guide
Page 262 of 429
The change in the result set can be seen in Figure 12-30.
Figure 12-30: Result set with Conditional Overrides Enabled
This Consolidated Total for Next Year Expenses matches the total of the non-consolidated result set shown in Figure 12-31.
Figure 12-31: Non-consolidated Result Set with Totals Enabled for Reconciliation

InsightSoftware.com User Guide
Page 263 of 429
Copying Calculations Insight
® allows you to copy an existing calculation to create a new one (Figure 12-32).
„Click‟ on the Copy button to copy an existing calculation – you can then use the Edit button to edit the calculation‟s properties:
Figure 12-32: Copy a Calculation
This facility is useful when setting up calculations with multiple conditions.
Calculations can be copied within inquiries – if you need to use the same calculation in more than one inquiry, you can share the calculation by storing it in Reusable Inquiry Objects.

InsightSoftware.com User Guide
Page 264 of 429
Calculations Based on Other Calculations One advanced feature is the ability to create calculations that include other calculations as part of their formula.
Figure 12-33 illustrates how the Budget Variance Amount (VARA) is calculated by subtracting the Actual Amount (ACTAMT) calculation from the Revised Budget Amount (RBA) calculation.
Figure 12-33: Creating Calculations Based on Other Calculations
Calculated items can be included in the formula of a new calculation by selecting the Calculations option from the drop down list when defining a new calculation and then selecting the appropriate calculation from the list of available selections. This is shown in Figure 12-34.
Figure 12-34: Selecting a Calculation to include Within the Formula
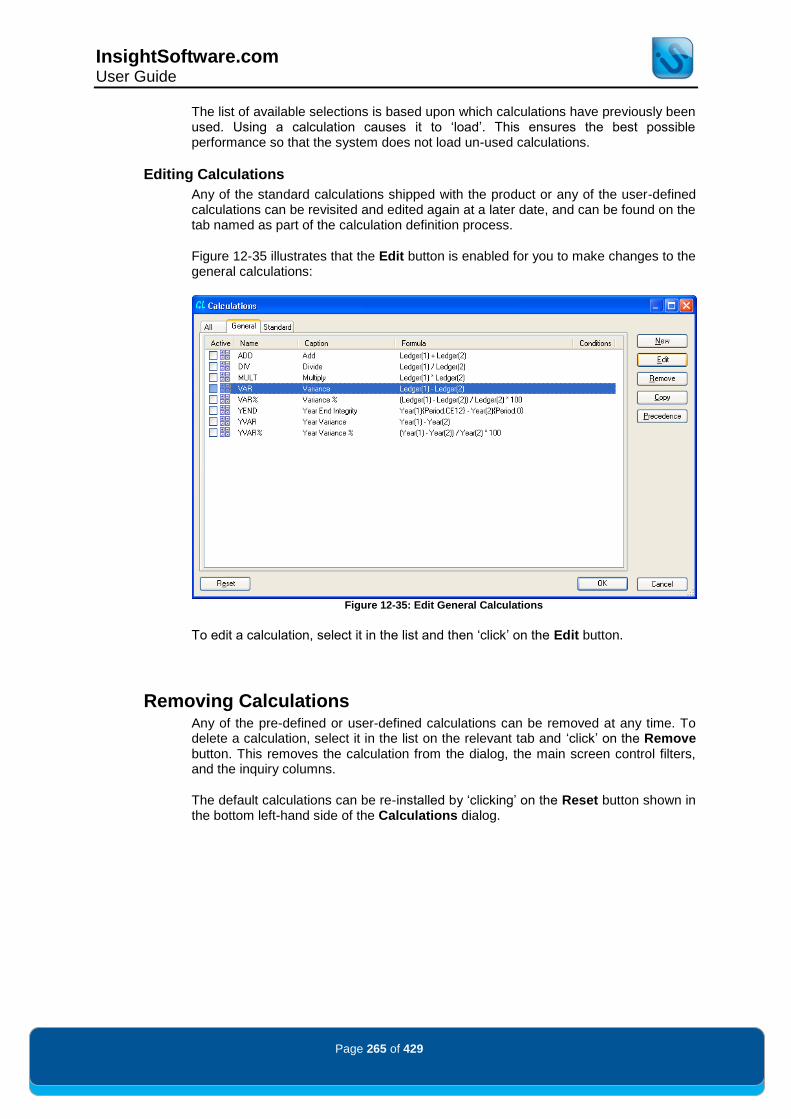
InsightSoftware.com User Guide
Page 265 of 429
The list of available selections is based upon which calculations have previously been used. Using a calculation causes it to „load‟. This ensures the best possible performance so that the system does not load un-used calculations.
Editing Calculations
Any of the standard calculations shipped with the product or any of the user-defined calculations can be revisited and edited again at a later date, and can be found on the tab named as part of the calculation definition process.
Figure 12-35 illustrates that the Edit button is enabled for you to make changes to the general calculations:
Figure 12-35: Edit General Calculations
To edit a calculation, select it in the list and then „click‟ on the Edit button.
Removing Calculations Any of the pre-defined or user-defined calculations can be removed at any time. To delete a calculation, select it in the list on the relevant tab and „click‟ on the Remove button. This removes the calculation from the dialog, the main screen control filters, and the inquiry columns.
The default calculations can be re-installed by „clicking‟ on the Reset button shown in the bottom left-hand side of the Calculations dialog.

InsightSoftware.com User Guide
Page 266 of 429
Custom Columns Custom columns allow you to perform many calculation functions using label columns, including numeric database columns that were previously not available (such as Lead Time) and also dates (such as Requested Date). They are so named because each one will produce a single new column in your report.
Custom Columns are accessed alongside your normal calculations using the More Functions menu choice as detailed in Figure 12-36 below.
Figure 12-36: Accessing the Custom Columns Dialog

InsightSoftware.com User Guide
Page 267 of 429
Selecting this option will enter the Custom Column functions dialog (Figure 12-37), which allows you to build a range of useful functions for your columns.
Figure 12-37: Using the Custom Column Dialog
The selections above would give you a column in your report that shows the time between the order being requested for delivery (Requested Date) and the time the goods were actually received (Received Date) for the Purchase Order Processing module.
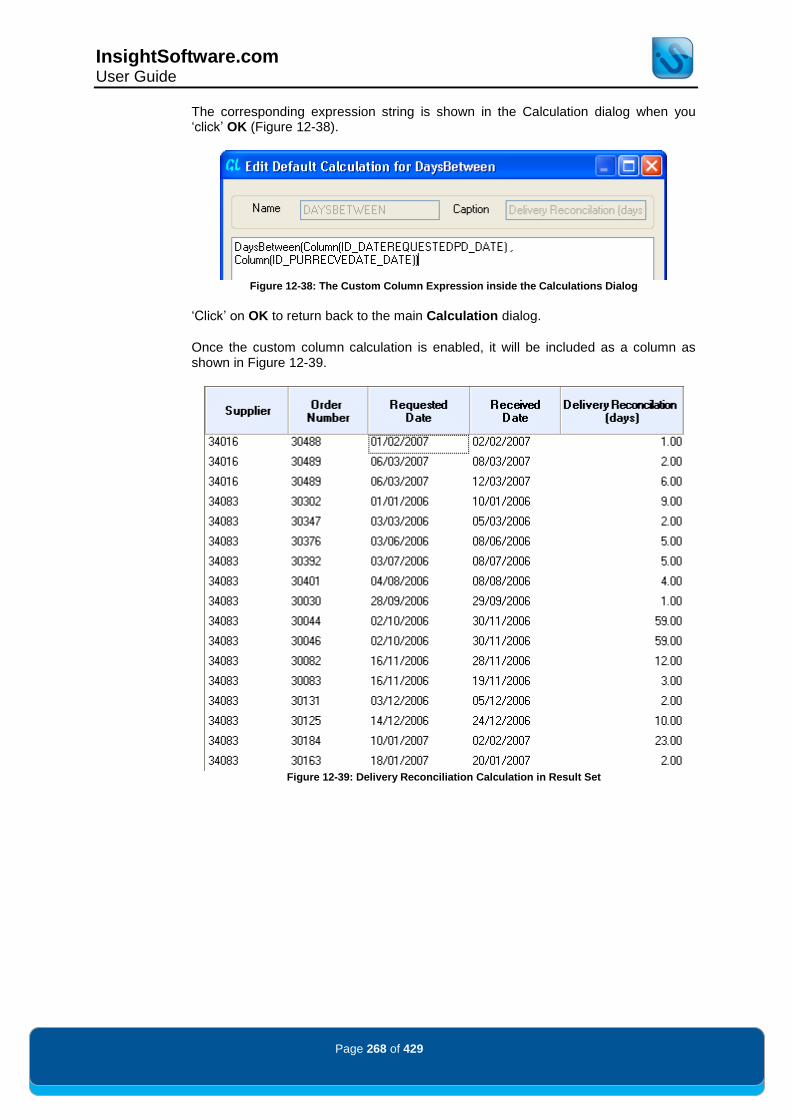
InsightSoftware.com User Guide
Page 268 of 429
The corresponding expression string is shown in the Calculation dialog when you „click‟ OK (Figure 12-38).
Figure 12-38: The Custom Column Expression inside the Calculations Dialog
„Click‟ on OK to return back to the main Calculation dialog.
Once the custom column calculation is enabled, it will be included as a column as shown in Figure 12-39.
Figure 12-39: Delivery Reconciliation Calculation in Result Set

InsightSoftware.com User Guide
Page 269 of 429
Basic Functions
There are many functions available via custom columns. All of these are created from the New Custom Column dialog (Figure 12-37).
Fixed Value Functions
Date (Fixed): Creates a column in the report that shows a specific date in all rows. Used as a base for other calculations (as custom columns can reference other custom columns).
Date (Today): Creates a today column that will always display the current local system date in all rows. This can be used as a basis for calculations that require today‟s date to be input (such as for late deliveries).
Numeric (Single): Inserts a column into the report that shows a specific number value in all rows.
String (Single): Inserts a column into the report with the same specific text in all rows. This can be used as a label.
Date Based Calculations
Days Back: Counts back from a given date by a specified number that is contained in another column. In a purchasing scenario, this would allow you to use the requested date and lead time in order to calculate the last possible order date for a product.
Days Between: Displays the difference between any two given date columns.
Days Forward: Counts forward from a given date by a specified number that is contained in another column. In a purchasing scenario, this would allow you to calculate the expected arrival date of an item based on the order date and the lead time.

InsightSoftware.com User Guide
Page 270 of 429
Aggregation Functions
These six functions are more suitable when the data has been aggregated through the Columns, Sorting and Grouping function.
This is due to the way that the average function executing across one row of data will return the same value as the row. Likewise the count will always return the count as a value from one row of data.
Average: This function will average the numeric values of the selected column. There are two options available:
Average - excludes null values, which is useful for analyzing dates where null values can distort an average
Average (Including Nulls)
Count: This function will count the number of values in the selected column. There are four options available:
Count - excludes null values
Count (Including Nulls)
Count (Unique) counts only unique values. For example if you had the values 1,1,2,3, you would have a count of 3. (Within SQL this would be known as a SELECT DISTINCT). This option will also exclude null values.
Count (Unique) (Including Nulls)
Date (Maximum): Useful for aggregated data where the Maximum Date will be displayed from a list of dates
Date (Minimum): Useful for aggregated data where the Minimum Date will be displayed from a list of dates
Maximum: This function will return the highest numeric value in the selected column
Minimum: This function will return the lowest numeric value in the selected column.
Total: This function will return the sum of the selected column.

InsightSoftware.com User Guide
Page 271 of 429
Advanced Features of Custom Columns
1. Custom columns are capable of nesting other custom columns within their calculation.
This means that on an aggregated inquiry, you could, for example, find the average number of days between two dates by using the following function: Avg(DaysBetween(Column(ID_4311DATEORDER_DATE) , Column(ID_DATEACTUALSHIPDATEPD_DATE)))
2. Custom columns also provide functionality for identifying values that are negative and positive. IsPositive: This function will return a 1 when a numeric value is greater than zero, or will return a 0 when a numeric value is less than or equal to zero IsNegative: This function will return a 1 when a numeric value is less than zero, or will return a 0 when a numeric value is greater than or equal to zero IsZero: This function will return a 1 when a numeric value is zero, or will return a 0 when a numeric value is not equal to zero These functions are useful when you are trying to identify data that fits a Yes/No condition. A good example is „days late‟, where orders can either be late or not late, depending on the number of days late. Using the above example, we can identify when the average days between result is positive by using the following function: IsPositive(Avg(DaysBetween(Column(ID_4311DATEORDER_DATE) , Column(ID_DATEACTUALSHIPDATEPD_DATE))))
3. Numeric column calculations are also possible. You can add, subtract, multiply and
divide custom columns in association with standard numeric columns. The following is a „days between‟ custom column being used in a calculation that involves a Lead Time column and a fixed numeric amount of three. Column(ID__COL__F4102_IBLTCM)- DaysBetween(Column(ID_4311DATEORDER_DATE) , Column(ID_DATEACTUALSHIPDATEPD_DATE)) + Numeric(3)
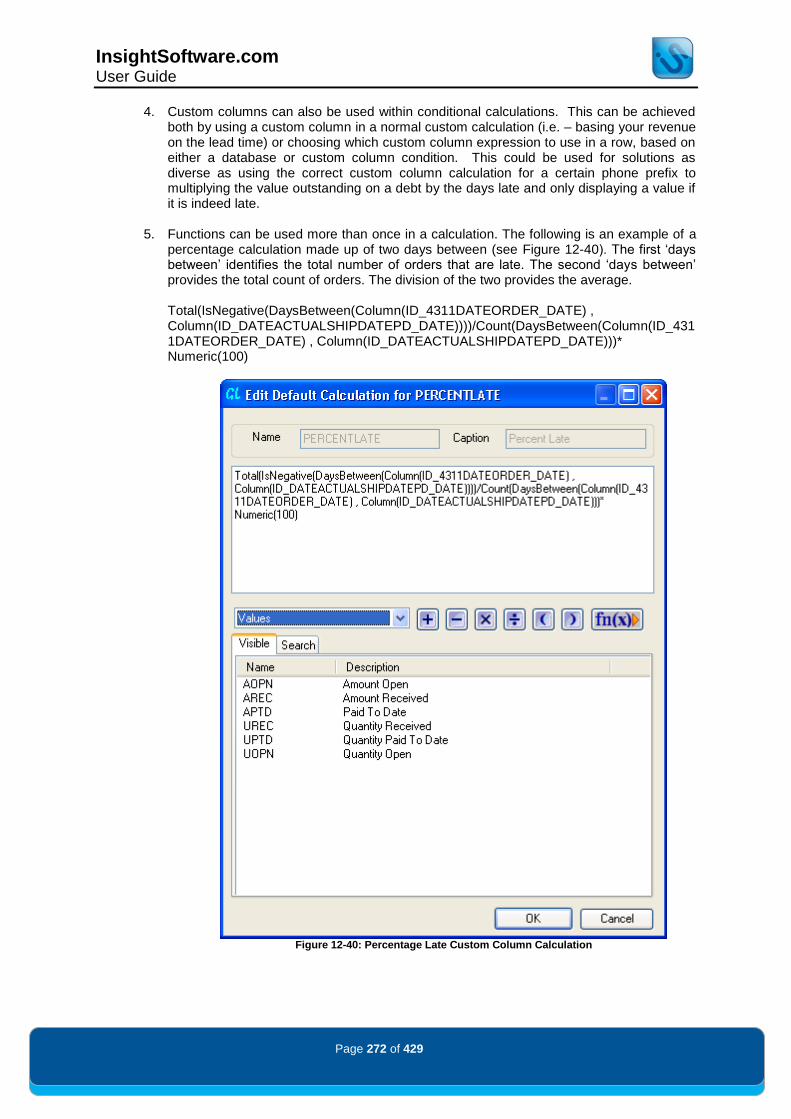
InsightSoftware.com User Guide
Page 272 of 429
4. Custom columns can also be used within conditional calculations. This can be achieved both by using a custom column in a normal custom calculation (i.e. – basing your revenue on the lead time) or choosing which custom column expression to use in a row, based on either a database or custom column condition. This could be used for solutions as diverse as using the correct custom column calculation for a certain phone prefix to multiplying the value outstanding on a debt by the days late and only displaying a value if it is indeed late.
5. Functions can be used more than once in a calculation. The following is an example of a
percentage calculation made up of two days between (see Figure 12-40). The first „days between‟ identifies the total number of orders that are late. The second „days between‟ provides the total count of orders. The division of the two provides the average. Total(IsNegative(DaysBetween(Column(ID_4311DATEORDER_DATE) , Column(ID_DATEACTUALSHIPDATEPD_DATE))))/Count(DaysBetween(Column(ID_4311DATEORDER_DATE) , Column(ID_DATEACTUALSHIPDATEPD_DATE)))* Numeric(100)
Figure 12-40: Percentage Late Custom Column Calculation

InsightSoftware.com User Guide
Page 273 of 429
6. Custom columns can also be used for the concatenation of fields. Catstr: This function will concatenate two columns present in the inquiry. The associated text is „Catstr(Column1,Column2)‟. The following is a Catstr custom column being used to concatenate the Second Item Number (LITM) and associated Description (DSC1) on a purchase order: Catstr(Column(ID_SECONDITEMNUMBER_2ND_ITEM_NUMBER),Column(ID__COL__F4311_PDDSC1)) The end result is „3000Cyclometer‟. This function can also be nested to provide greater combinations of data. The following is a Catstr custom column being used to concatenate Object Account and Subsidiary. Please note that a dot separator is included by using the String Command: Catstr(Catstr(Column(ID_OBJECT),String(.)),Column(ID_SUB)) The end result is „1343.1140‟.
7. Custom columns can also be used for the display of the As Of Date. AsOf: This function will display the Current As Of Date specified in the inquiry. The associated text is „AsOf()‟. This function can also be included within other custom columns. For example by combining the DaysBetween, Today and AsOf Date functions we can determine that the AsOf date selected was x number of days in the past. DaysBetween(Today() , AsOf())

InsightSoftware.com User Guide
Page 274 of 429
Aging Categories provides a way of grouping amounts into a number of columns, split by date. This feature is available in Insight
® for all date-based inquiries.
These date ranges can be defined using Days, Weeks, Months and Year series settings, allowing date-based inquiries to show historical trends over custom date ranges.
You can open the Aging Categories dialog within the Inquiry Objects Ribbon Tab. „Click‟ on the New button to open the Define Aging Category dialog (Figure 13-1).
Figure 13-1: Aging Category Setup in AR
In the example shown above, we wish to create four custom date ranges based on 30 day ranges, where the first date range reflects AR invoices that were due in the last 30 days, and the last date range will show those invoices that are due within a period of 61 to 90 days.
First, define the Aging Category by setting the Name, Short Code (used to provide a Unique Identifier for the Aging Category items) and Caption in the General section of the Define Aging Category dialog.

InsightSoftware.com User Guide
Page 275 of 429
The Define Aging Category dialog also allows you to set a Caption for the date ranges that are to be created. You can choose to retain existing User Defined Captions for the Aging Category by selecting the checkbox.
Next, identify the Series Settings by specifying the date and value field. In this example, we are choosing to show invoices that are overdue, based on the Open Amount and Due Date. The dates that are available will be the dates specified in Columns, Sorting and Grouping‟s Available Column list.
In the Series Settings section of this dialog, you can create date ranges and review them. In our example, we used the Day option to set up our ranges. You can choose Constant Ranges as well as Custom Ranges, and you can specify whether you would like the days to be „before‟ or „after‟ today.
Moreover, it is possible to set up ranges that cover weeks/months or years. To do this, select the appropriate radio button. The dialog format will change accordingly. Set the Start Date, End Date and the Number of times Per Range. Alternatively, you can set the Number of Ranges instead of the End Date.
When the ranges are set, you can „click‟ on the Preview button to review the categories or date ranges as shown in Figure 13-2.
Figure 13-2: Preview the Aging Categories
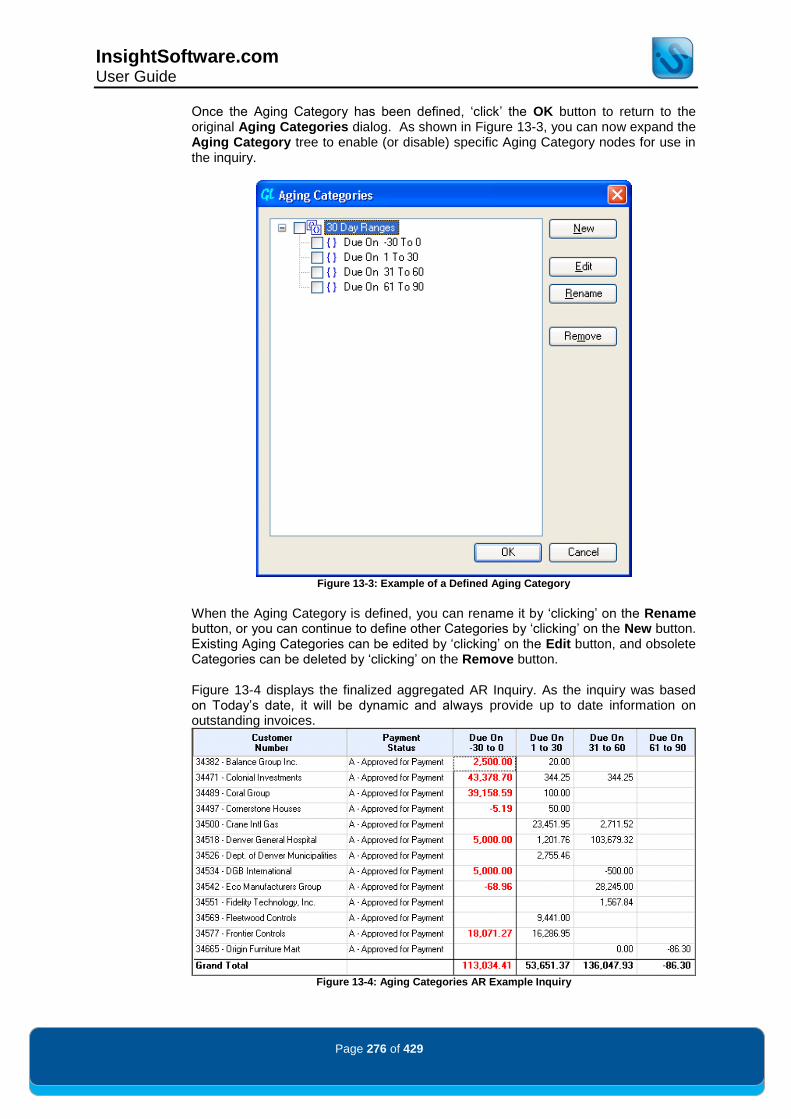
InsightSoftware.com User Guide
Page 276 of 429
Once the Aging Category has been defined, „click‟ the OK button to return to the original Aging Categories dialog. As shown in Figure 13-3, you can now expand the Aging Category tree to enable (or disable) specific Aging Category nodes for use in the inquiry.
Figure 13-3: Example of a Defined Aging Category
When the Aging Category is defined, you can rename it by „clicking‟ on the Rename button, or you can continue to define other Categories by „clicking‟ on the New button. Existing Aging Categories can be edited by „clicking‟ on the Edit button, and obsolete Categories can be deleted by „clicking‟ on the Remove button. Figure 13-4 displays the finalized aggregated AR Inquiry. As the inquiry was based on Today‟s date, it will be dynamic and always provide up to date information on outstanding invoices.
Figure 13-4: Aging Categories AR Example Inquiry
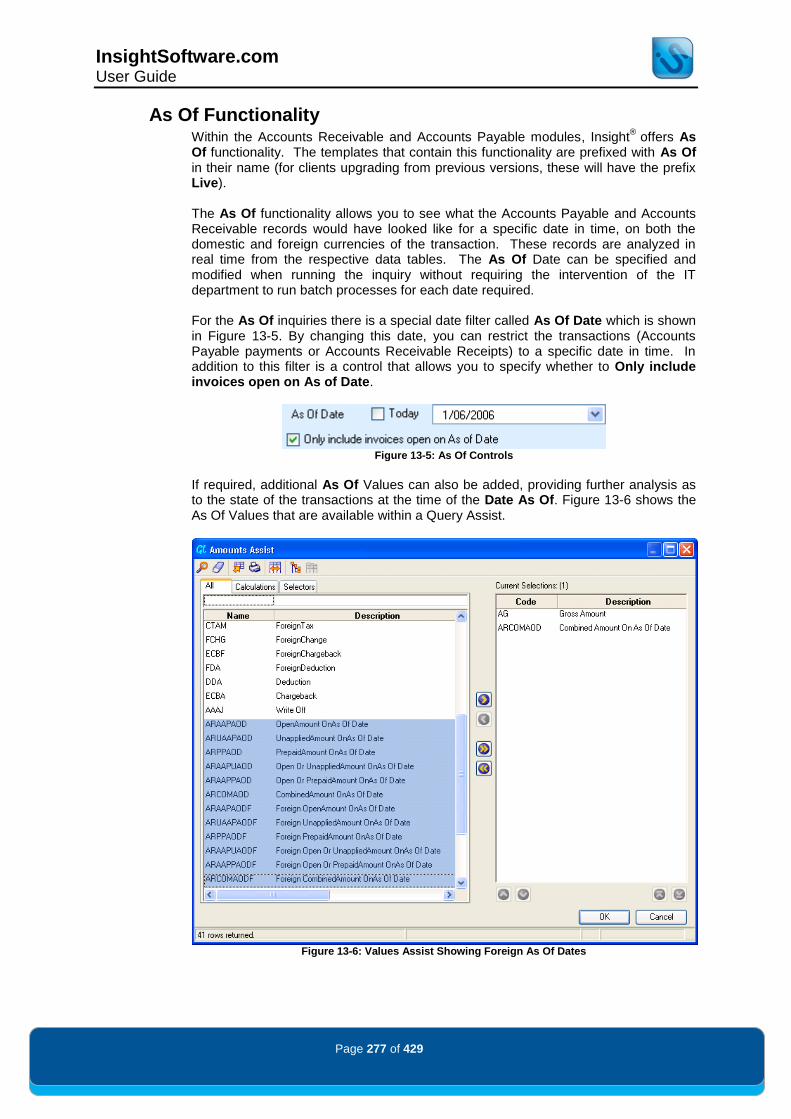
InsightSoftware.com User Guide
Page 277 of 429
As Of Functionality Within the Accounts Receivable and Accounts Payable modules, Insight
® offers As
Of functionality. The templates that contain this functionality are prefixed with As Of in their name (for clients upgrading from previous versions, these will have the prefix Live). The As Of functionality allows you to see what the Accounts Payable and Accounts Receivable records would have looked like for a specific date in time, on both the domestic and foreign currencies of the transaction. These records are analyzed in real time from the respective data tables. The As Of Date can be specified and modified when running the inquiry without requiring the intervention of the IT department to run batch processes for each date required. For the As Of inquiries there is a special date filter called As Of Date which is shown in Figure 13-5. By changing this date, you can restrict the transactions (Accounts Payable payments or Accounts Receivable Receipts) to a specific date in time. In addition to this filter is a control that allows you to specify whether to Only include invoices open on As of Date.
Figure 13-5: As Of Controls
If required, additional As Of Values can also be added, providing further analysis as to the state of the transactions at the time of the Date As Of. Figure 13-6 shows the As Of Values that are available within a Query Assist.
Figure 13-6: Values Assist Showing Foreign As Of Dates

InsightSoftware.com User Guide
Page 278 of 429
Using As Of with Aging Categories
Some of the As Of Inquiries come with predefined aging categories that are associated with the As Of date. Figure 13-7 displays a standard As Of Invoices (E1) template which has been aggregated by Customer Number. The combination of the two is quite powerful, as the standard As Of value presents the values associated with the As Of Date, but the aging category can also show what the associated past/future amounts would be for the allocated date ranges in conjunction with the As Of date.
Figure 13-7: Accounts Receivable As Of Inquiry
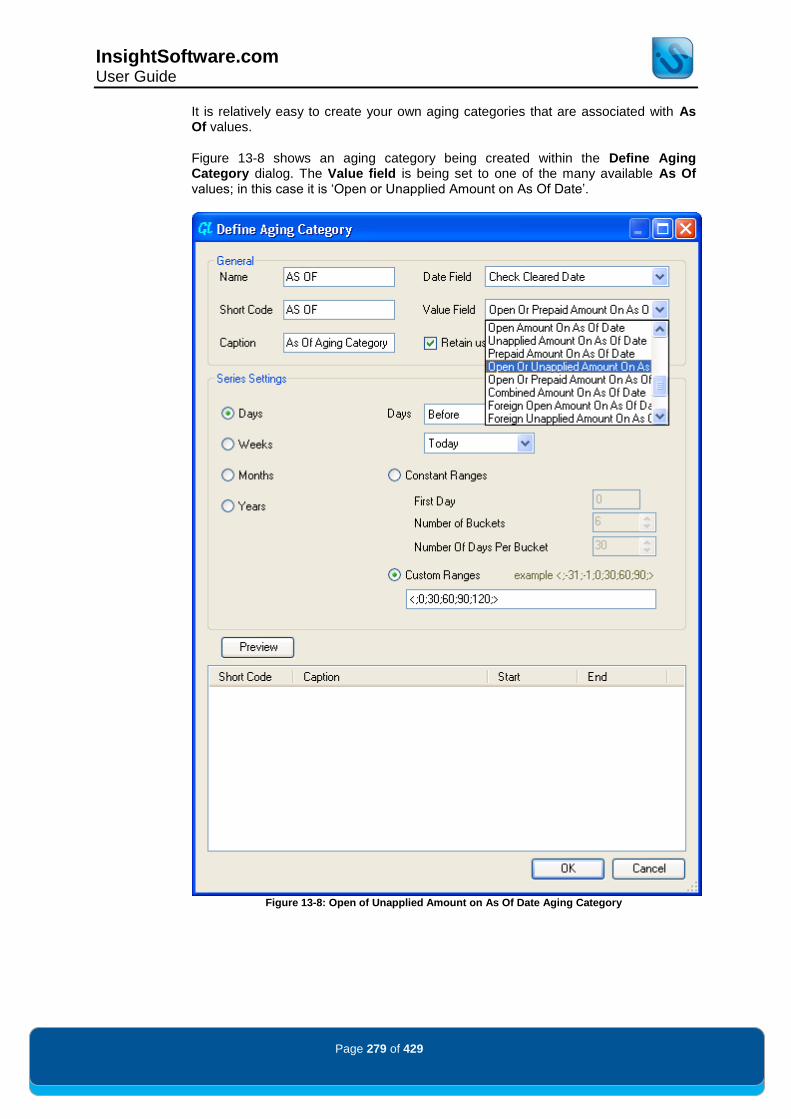
InsightSoftware.com User Guide
Page 279 of 429
It is relatively easy to create your own aging categories that are associated with As Of values.
Figure 13-8 shows an aging category being created within the Define Aging Category dialog. The Value field is being set to one of the many available As Of values; in this case it is „Open or Unapplied Amount on As Of Date‟.
Figure 13-8: Open of Unapplied Amount on As Of Date Aging Category

InsightSoftware.com User Guide
Page 280 of 429
As Of: Advanced
General Technique in Calculating Open Amount On As Of Date
The Open Amount On As Of Date measure shows the open amount of an invoice as it was at any date in the past. JD Edwards™ does not store this information, so it must be calculated by examining the invoice details and payment history.
NB THE TERM „PAYMENT‟ IS USED TO DESCRIBE ALL TRANSACTIONS THAT CAUSE THE CURRENT
OPEN AMOUNT TO BE ADJUSTED UP OR DOWN. THIS COULD INCLUDE CASH RECEIPTS, SPREAD
ADJUSTMENTS OR VOIDING ENTRIES. GENERALLY INSIGHT®
INCLUDES ALL ADJUSTMENT TYPES
UNLESS THEY ARE SPECIFICALLY EXCLUDED.
Invoice Details
Invoice details are stored in various tables depending on the version of JD Edwards™ and whether the module is Accounts Payable or Accounts Receivable. For World, the Accounts Receivable Ledger table is the F0311. In Enterprise One, this is the F03B11. For Accounts Payable in World and Enterprise One, the Accounts Payable Ledger table is the F0411. These tables contain a Gross Amount field (AG) and Open Amount field (AP). The Gross Amount field stores the full original amount of the invoice. This value does not change, except in special circumstances (see voided invoices below). The Open Amount field also initially stores the full invoice amount, however as payments come in, the value is updated. This way it always shows the amount that is currently outstanding. By default, Insight
® uses the GL Date (DGJ) for determining when the invoice is
considered to have been opened. If the GL Date is after the As of Date, and the Only include invoices open on As of Date tick box is enabled, the invoice will be considered open.
NB THE ONLY EXCEPTION TO THE GL DATE IS IN ACCOUNTS PAYABLE, WHERE THERE IS AN
INQUIRY OPTION THAT ALLOWS AS OF TO CALCULATE OPENING DATE BASED ON EITHER THE
GL DATE OR THE INVOICE DATE. THIS IS SET IN THE INQUIRY OPTIONS .

InsightSoftware.com User Guide
Page 281 of 429
Payment Details
Payment Details in AR World
World Accounts Receivable stores both the payment information and invoice information in the Customer Ledger (F0311). Invoice records can be differentiated from payment records by examining the Document Number Matching (RPDOCM) or Document Type Matching (RPDCTM) fields. These will be blank or 0 on invoice records and populated on payment records. Payment records are matched to the correct invoice record. The As of Code reads the Gross Amount (RPAG) and Discount Taken (RPADSA) in combination with the GL Date (RPDGJ) to determine when a payment was made. The Gross Amount is the value of any payments; payments and adjustments that decrease the open amount have a negative value and adjustments that increase the open amount (for example voided payments) have a positive value.
Payment Details in AR E1
Enterprise One Accounts Receivable uses a dedicated Receipt Detail table (F03B14) to store payment details. The As Of Code reads the Payment Amount (RZPAAP) and Discount Taken (RZADSA) from the Receipt Detail. These values are used in conjunction with the Date - Matching Check or Item (RZMDTJ) to determine when a payment was made. The As Of code also joins to the Customer Ledger table (F03B11).
Payment Details in AP
Accounts Payable uses the same table structure in both World and Enterprise One. The structure is very similar to Enterprise One Accounts Receivable in that it uses a dedicated Payment Detail table (F0414) to store payment details. Payment Detail has the same fields as its Accounts Receivable Enterprise One equivalent, Receipt Detail (F03B14), with some exceptions. The As of Code reads the Payment Amount (RNPAAP) and Discount Taken (RNADSA) from the Payment Detail in conjunction with the Item Date (RNDMTJ) from the Payment Summary (F0413) table to determine when a payment was made.
Calculating Open Amount On As Of Date
The Open Amount On As Of Date is calculated by taking the invoice Open Amount (AP) and reversing out any payments or adjustments that occurred after the As Of Date.

InsightSoftware.com User Guide
Page 282 of 429
Special Cases
The previous section describes the technique for calculating the Open Amount On As Of Date for most invoices. There are two special cases where the technique differs slightly.
Unapplied Cash
Unapplied Cash, which exists only in Accounts Receivable, is a payment assigned to a particular customer, not to an invoice. Therefore in Accounts Receivable there are two live aged measures, Open Amount On As Of Date and Unapplied Amount On As Of Date. All invoices with a Document Type (RPDCT) of „RU‟ are included in the unapplied total, and all other invoices are applied to the open total. When an unapplied payment is received, a payment record and a dummy invoice record are created in the Customer Ledger table (F0311 – World) or Receipt Detail (F03B14 - Enterprise One). Each new unapplied payment generates a new invoice record, and every unapplied invoice has one payment record. With an unapplied invoice, the open amount is initially set to the same value as the payment amount. In order to correctly calculate the Unapplied Amount On As Of Date, the initial payment which generates the invoice is disregarded. In Accounts Payable, payments are assigned to a specific vendor only.
Voided Invoices
Voided payments in the Payment table appear like a reverse payment record with a positive Payment Amount (PAAP). Occasionally, entire invoices get voided in Accounts Receivable/Payable on Enterprise One. When this happens, the As Of Code uses the Gross Amount from the voided invoice instead of the Open Amount. When an invoice is voided, all previous payments for that invoice are voided. Void records are created in the Payment Details table (F03B14 for Accounts Receivable in Enterprise One, F0414 for Accounts Payable), matching all previous payments. The invoice record (F03B11 for Accounts Receivable in Enterprise One and F0411 for Accounts Payable) now has an offsetting entry, which sets both the Open Amount and Gross Amount of the invoice back to $0.
Currency Gains and Losses
When payments are made in a foreign currency, exchange rate fluctuations can cause a change in the actual value of the payment. These are knows as Currency Gains and Losses. Additional entries are made in the Payment Detail table for this.
NB BY DEFAULT, THE CURRENCY GAINS AND LOSSES FUNCTIONALITY IS DISABLED TO REMAIN
CONSISTENT WITH THE JD EDWARDS™ AGED BALANCE REPORT. TO ENABLE THIS
FUNCTIONALITY, THERE IS AN INQUIRY OPTION CALLED INCLUDE CURRENCY GAINS AND
LOSSES IN AS OF VALUES.

InsightSoftware.com User Guide
Page 283 of 429
As Of Optimization
For both the As Of Accounts Receivable and Accounts Payable templates, there is an Inquiry Option that can be used under certain circumstances to assist performance of AS Of Inquiries. This Inquiry Option, as shown in Figure 13-9, allows the user to switch between three settings.
Figure 13-9: As Of Optimisation Level
Auto (Recommended): This setting attempts to select the best method from the next two options, based on the filters set in the report. It should give the best performance in the majority of cases.
Optimise for shortest SQL: The underlying SQL for the As Of Functionality is reduced where possible (this is useful for older databases that have limited SQL Length processing).
Optimise to allow best us of indexes: Switches to a longer SQL setting, joining the underlying fact table with multiple sub selects. Each sub select will take into account the underlying filters present in the inquiry. If these filters correspond with the indexes on the fact table, speed improvements should be seen.

InsightSoftware.com User Guide
Page 284 of 429
The Dynamic Time Series feature allows you to define a fixed span of time and view data within that time frame. You can then roll the fixed span forwards or backwards in time, seeing how the data changes. This means that you can move your report „window‟ through historical data without having to reformat your report, add columns etc.
This feature allows you to define sets of columns whose sequence is significant as a „series‟, and then add new columns to your inquiries that are based on that series, such as „Current Period‟ and „Year to Date‟. It enables you to add complex, time-based calculations - such as rolling 12 month average - to your reports.
Time Series Construction A time series is like a ruler, with the ticks on the ruler corresponding to time series elements.
The elements of a time series are determined by the cross product of the dimensions on which it is based. For example, if we have two dimensions, Year and Period, the time series is made up of ticks that correspond to pairs of Year and Period.
A time series also has a „marker‟ associated with it, which is the designated current item. This can be controlled using a drop down list.
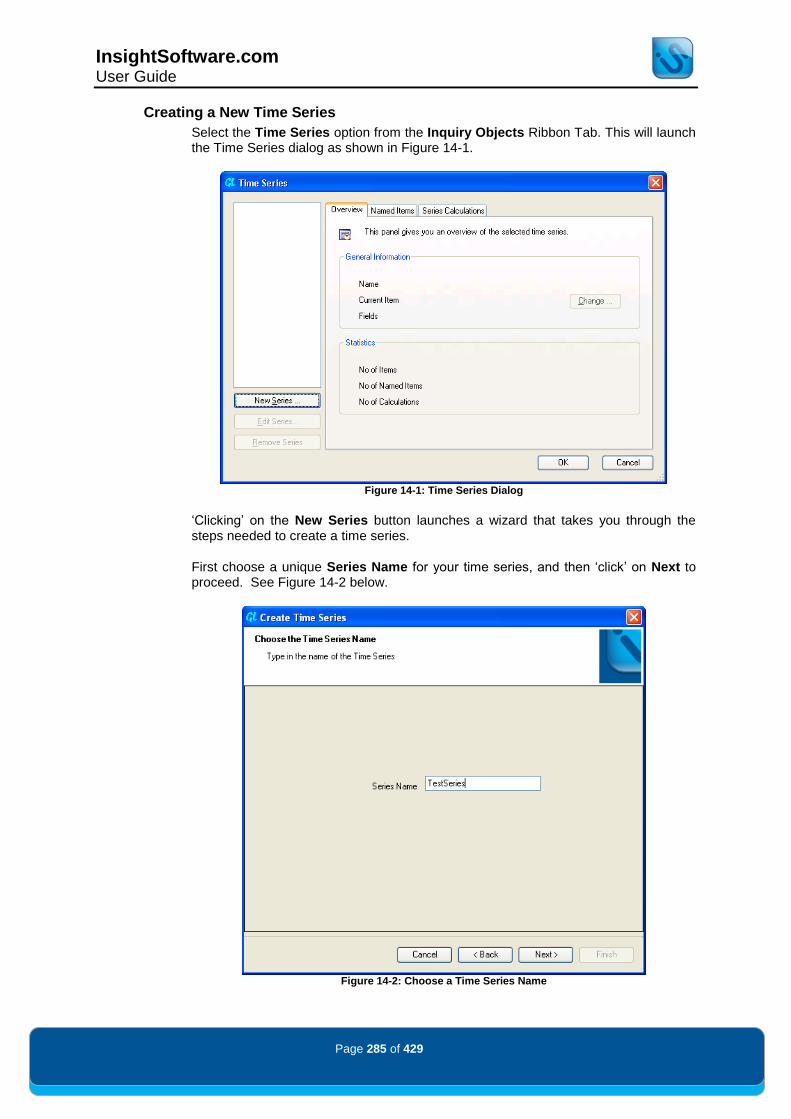
InsightSoftware.com User Guide
Page 285 of 429
Creating a New Time Series
Select the Time Series option from the Inquiry Objects Ribbon Tab. This will launch the Time Series dialog as shown in Figure 14-1.
Figure 14-1: Time Series Dialog
„Clicking‟ on the New Series button launches a wizard that takes you through the steps needed to create a time series.
First choose a unique Series Name for your time series, and then „click‟ on Next to proceed. See Figure 14-2 below.
Figure 14-2: Choose a Time Series Name

InsightSoftware.com User Guide
Page 286 of 429
This will open the Define Dimensions in the Time Series dialog, as shown in Figure 14-3.
Select the dimensions that you want to use to form the time series. The list of dimensions available includes all pivoted columns/dimensions in your inquiry. Use the blue up and down arrows to position the most significant dimension at the bottom of the list – the most significant dimension is the one which changes least when looking at the „ruler‟ made up of year and period combinations.
Figure 14-3: Defining Dimensions Screen
In the example above, „clicking‟ the blue down arrow sets Year as the most significant dimension. Each of the dimensions will include a number of time periods, some of which you may wish to exclude. The next step allows you to refine the time series so that only relevant time periods are included.
Once you have defined your dimensions, „click‟ Next to proceed.
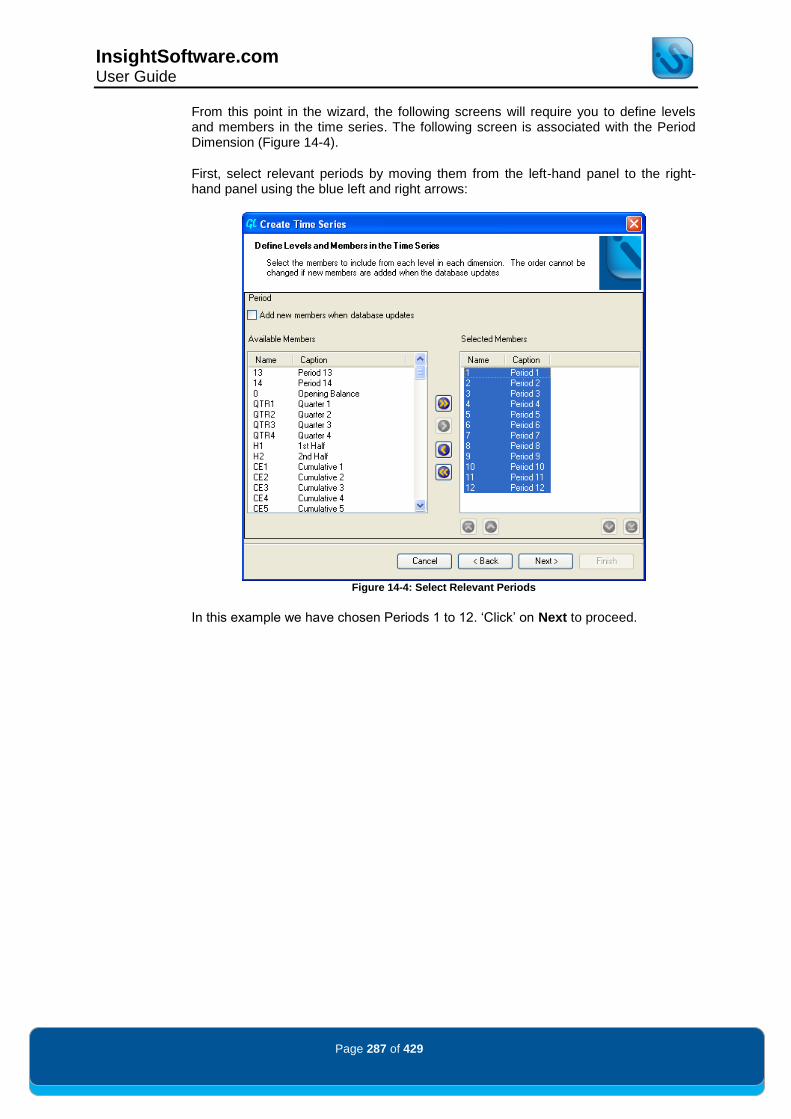
InsightSoftware.com User Guide
Page 287 of 429
From this point in the wizard, the following screens will require you to define levels and members in the time series. The following screen is associated with the Period Dimension (Figure 14-4).
First, select relevant periods by moving them from the left-hand panel to the right-hand panel using the blue left and right arrows:
Figure 14-4: Select Relevant Periods
In this example we have chosen Periods 1 to 12. „Click‟ on Next to proceed.

InsightSoftware.com User Guide
Page 288 of 429
The second dimension in this example is Years, as shown in Figure 14-5.
Figure 14-5: Select Relevant Years
When the associated members for the dimension are selected, „click‟ on Next to proceed.
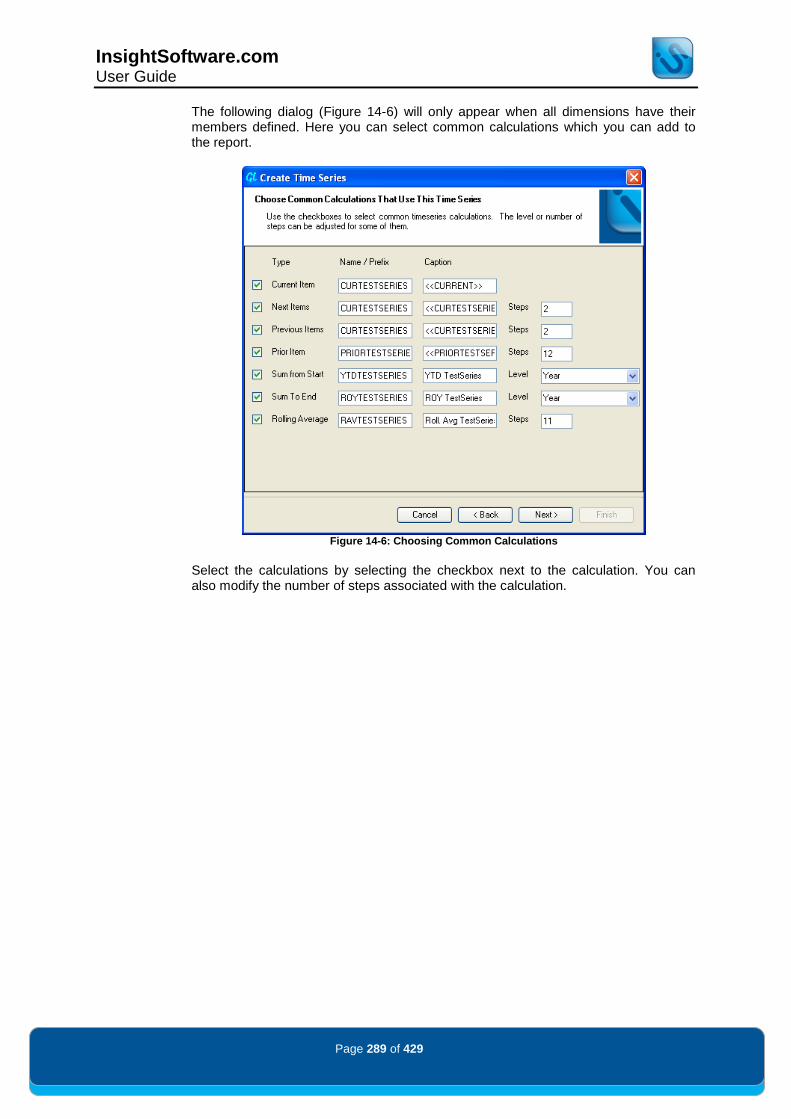
InsightSoftware.com User Guide
Page 289 of 429
The following dialog (Figure 14-6) will only appear when all dimensions have their members defined. Here you can select common calculations which you can add to the report.
Figure 14-6: Choosing Common Calculations
Select the calculations by selecting the checkbox next to the calculation. You can also modify the number of steps associated with the calculation.

InsightSoftware.com User Guide
Page 290 of 429
To help explain the series calculations, the below example uses Period 5 2006 to be the Current Item or „marker‟ within the time series.
Current Item – Creates a series calculation that will display the currently chosen point in the Time Series.
Next Item – Creates a series calculation that will display the next point on the time series from the Current Item (using the above example, this would derive Period 6 2006).
o If you increase the number of associated steps, you will increase the number of series calculations created. For example, if you set Next Item steps to be equal to three, you will have three columns that would derive Period 6 2006, Period 7 2006 and Period 8 2006.
Previous Item – Create a series calculation that will display the previous point on the time series from the Current Item (using the above example. this would derive Period 4 2006).
o Just like the Next Item, if you increase the number of associated steps, you will increase the number of series calculations created. For example, if you set Previous Item steps equal to three, you will have three columns that would derive Period 4 2006, Period 3 2006 and Period 2 2006.
Prior Item – This will create a series calculation that will display a point that is x number of steps from the Current Item. (Using the above example, this would derive Period 5 2005 if the Prior Item steps were set to 12. However, if they were set to 6, it would derive Period 11 2005.)
Sum From Start – This will create a series calculation that will sum all the values from the start of the year. (Using the above example, this would be Period 1 2006 to Period 5 2006.)
Sum To End – This will create a series calculation that will sum all the values from after the Current Item to the end of the year. (Using the above example, this would be Period 6 2006 to Period 12 2006.)
Rolling Average – This will create a series calculation that will take the average of the Current Item and the number of steps back that were specified. (Using the above example, this will average from Period 5 2006 back to Period 6 2005 if the Rolling Average steps were set to 11. However, if they were set to 4, it would take the average from period 5 2006 back to Period 1 2006.)
Within this screen, the caption for each series calculation can also be modified if required.
„Click‟ on Next to accept your changes and „click‟ Finish on the following screen of the wizard.
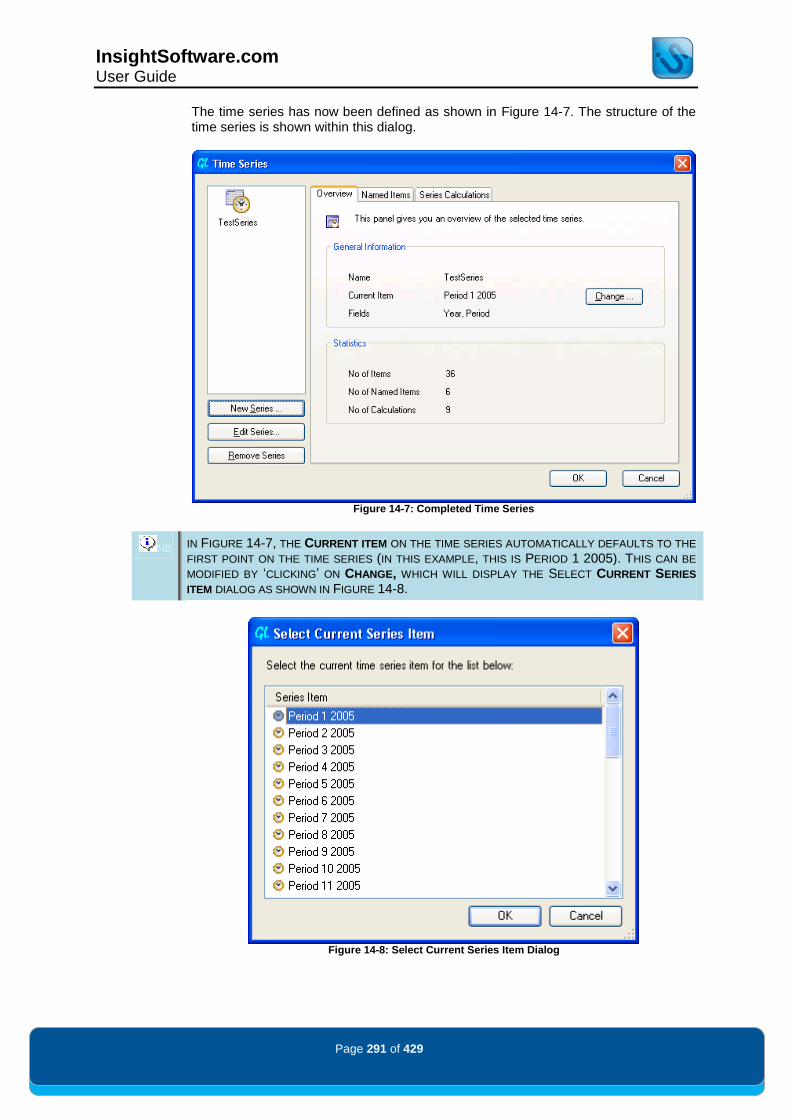
InsightSoftware.com User Guide
Page 291 of 429
The time series has now been defined as shown in Figure 14-7. The structure of the time series is shown within this dialog.
Figure 14-7: Completed Time Series
NB IN FIGURE 14-7, THE CURRENT ITEM ON THE TIME SERIES AUTOMATICALLY DEFAULTS TO THE
FIRST POINT ON THE TIME SERIES (IN THIS EXAMPLE, THIS IS PERIOD 1 2005). THIS CAN BE
MODIFIED BY „CLICKING‟ ON CHANGE, WHICH WILL DISPLAY THE SELECT CURRENT SERIES
ITEM DIALOG AS SHOWN IN FIGURE 14-8.
Figure 14-8: Select Current Series Item Dialog

InsightSoftware.com User Guide
Page 292 of 429
Editing Time Series Controls
To add or remove time series columns from the report, select the Series Calculations tab on the Time Series dialog, as shown in Figure 14-9. This will display all of the time series calculations that were added to the report:
Figure 14-9: Displaying Time Series Calculations
Use the checkboxes to select the time series calculations that should appear on the report. Commit the changes by „clicking‟ OK in the Main Time Series dialog. The report now has a time series associated with it and will display the time series calculation columns when the report is run.
When a time series calculation has been selected on the report, the behavior of the related filters will change to allow for the Time Series functionality. This change in the associated filter control allows the selection of the current value of the time series as well as typing in the period values.
With the example time series so far, the new Period filter will still have the first item in the series (Figure 14-10):
Figure 14-10: New Period Control

InsightSoftware.com User Guide
Page 293 of 429
The Current Item of the time series can be changed using the combo box as shown in Figure 14-11. Use the list to select a period that will be your current item (e.g. Period 5 2006). All default series calculations will be based on the selected value.
Figure 14-11: Choose Current Item
When you run the report, you will notice that extra columns have been added to the result set. These extra columns represent all the Series Calculations shown in Figure 14-9.
To see that the time series is returning correct data, you will need to add Periods 4, 5 and 6 to the period filter. That way you will have a comparison point between the series calculations and the actual periods.
On the Period Filter, „click‟ the small button to the left of the combo box. This will cycle between the time series and period filters. When the filter is displaying normal period functionality as shown in Figure 14-12, replace CURRENT and CUMULATIVE with Periods 4, 5 and 6 to the filter.
Figure 14-12: Selecting Periods
Additionally, set your Year filter to 2006 so that your periods match the year of your Series Calculations.
To assist with the explanation of time series, all Series Calculations will be disabled apart from CURTESTSERIES-1. CURTESTSERIES, CURTESTSERIES+2.

InsightSoftware.com User Guide
Page 294 of 429
If these steps have been followed correctly, you will have a report that will resemble Figure 14-13:
Figure 14-13: Finished Report
Note that the columns for time series and normal periods match. You can remove Periods 4, 5 and 6 from Period filter so only those created by the time series will display.

InsightSoftware.com User Guide
Page 295 of 429
Editing Time Series Captions
For illustrative purposes we left the captions as they were when we created the common calculations. To edit the captions, open the Time Series dialog again and select the Series Calculations tab as shown in Figure 14-14. Select the CURTESTSERIES calculation.
Figure 14-14: Series Calculation Tab
„Click‟ on the Edit button and the Edit Calculation dialog will appear. Set the caption to be „Current Time Series is <<CURRENT>>‟ as shown in Figure 14-15.
Figure 14-15: Edit Calculation Captions

InsightSoftware.com User Guide
Page 296 of 429
Any caption between << >> is a „placeholder‟. In the final inquiry column headings, this placeholder will be replaced by the underlying value. In this time series, the current time period has been designated as Period 5 2006. Accordingly, this caption will appear „Current Test Series is Period 5 2006‟ in the finished report.
Edit the CURTESTSERIES-1 and CURTESTSERIES+1 calculation so that the captions are: „Previous Test Series is <<CURTESTSERIES-1>>‟, and „Next Test Series is << CURTESTSERIES +1>>‟. The column headings for these three Time Series calculations will now look like Figure 14-16Figure 14-7:
Figure 14-16: Column Headings
Changing the contents of the drop down list will have the obvious result of changing the captions. Note that Insight
® will accept just „<<CURRENT>>‟ as a caption for
CURTESTSERIES, in which case the underlying year and period will be shown.
Advanced Functionality: Named Items
To add additional columns (such as CURRENT-5 … CURRENT -1, CURRENT to represent the previous six months) to a previously created time series requires a little extra work. To do this, select the Named Items tab in the Time Series dialog (Figure 14-17):
Figure 14-17: Named Items Tab
A named item acts as a label for a point on the time series. The label can either be absolute, in which case it refers to a specific year and period in time (e.g. Period 5 2006), or relative, where it is relative to an existing named item (such as the special item labeled CURRENT).
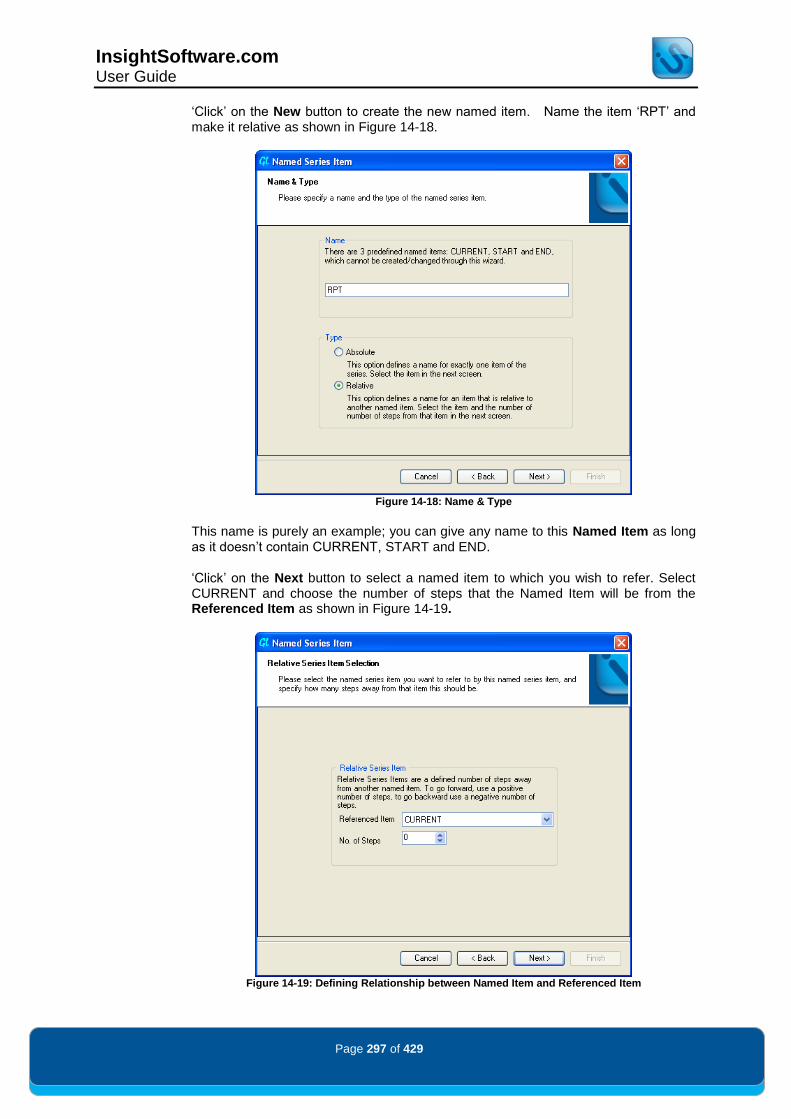
InsightSoftware.com User Guide
Page 297 of 429
„Click‟ on the New button to create the new named item. Name the item „RPT‟ and make it relative as shown in Figure 14-18.
Figure 14-18: Name & Type
This name is purely an example; you can give any name to this Named Item as long as it doesn‟t contain CURRENT, START and END.
„Click‟ on the Next button to select a named item to which you wish to refer. Select CURRENT and choose the number of steps that the Named Item will be from the Referenced Item as shown in Figure 14-19.
Figure 14-19: Defining Relationship between Named Item and Referenced Item

InsightSoftware.com User Guide
Page 298 of 429
„Click‟ on Next to create a corresponding calculation and caption. Name the calculation „RPT‟ and give it a caption of „<<RPT>>‟ as shown in Figure 14-20.
Figure 14-20: Creation of Calculation Associated with Named Item
On the final screen of the wizard, „click‟ on Finish to finalize the changes to your time series.
Repeat this process again for RPT-1, but change the Referenced Item to RPT instead of CURRENT. Set the No. of Steps to -1 and set the calculation to have a name and caption of „RPT-1‟ and „<<RPT-1>>‟.
Repeat for RPT-2 to RPT-6, making them relative to RPT with No. of Steps being from -2 to -6 with associated calculation names and captions. Afterwards, the Named Item tab of the Time Series dialog should look similar to Figure 14-21.
Figure 14-21: Additional Named Items
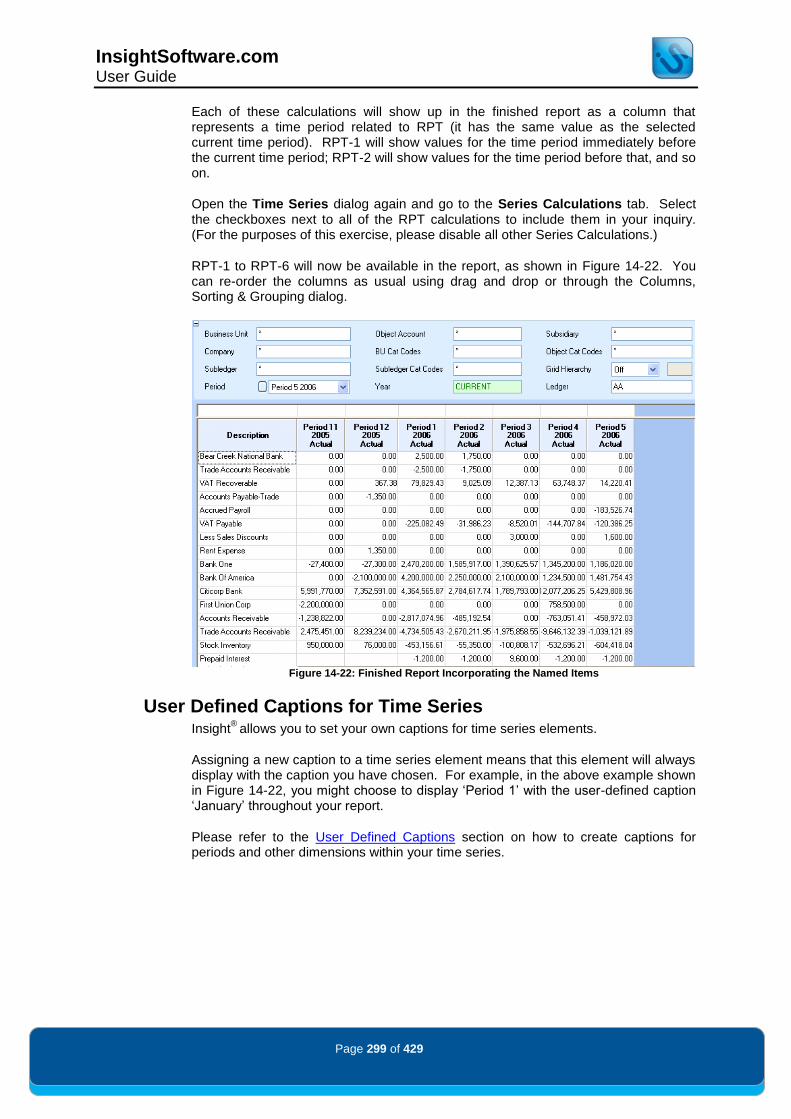
InsightSoftware.com User Guide
Page 299 of 429
Each of these calculations will show up in the finished report as a column that represents a time period related to RPT (it has the same value as the selected current time period). RPT-1 will show values for the time period immediately before the current time period; RPT-2 will show values for the time period before that, and so on.
Open the Time Series dialog again and go to the Series Calculations tab. Select the checkboxes next to all of the RPT calculations to include them in your inquiry. (For the purposes of this exercise, please disable all other Series Calculations.)
RPT-1 to RPT-6 will now be available in the report, as shown in Figure 14-22. You can re-order the columns as usual using drag and drop or through the Columns, Sorting & Grouping dialog.
Figure 14-22: Finished Report Incorporating the Named Items
User Defined Captions for Time Series Insight
® allows you to set your own captions for time series elements.
Assigning a new caption to a time series element means that this element will always display with the caption you have chosen. For example, in the above example shown in Figure 14-22, you might choose to display „Period 1‟ with the user-defined caption „January‟ throughout your report.
Please refer to the User Defined Captions section on how to create captions for periods and other dimensions within your time series.

InsightSoftware.com User Guide
Page 300 of 429
Creating a Combo Box for Time Series It is possible to add the Time Series filter as a separate combo box. This can be applied for security conditions or potentially for use in Console Preview Mode.
For more information on Console Preview Mode and its associated functionality, please refer to the Console Report Design section.
To add a separate filter for your time series, open the Console Filter Layout dialog included within the Console Ribbon Tab. Within the filters listed in Available Filters and Controls, ‘click’ on the plus next to Time Series and drag and drop your time series onto an empty part of the right pane of the screen called Workspace Area. See Figure 14-24 below.
Figure 14-23: Console Filter Layout Dialog
„Click‟ on OK to accept the changes and then click on „Console Preview‟ to view the filter. As shown in Figure 14-25, a new Time Series filter will appear on the report. Note that this is broken down for each time Series dimension.
Figure 14-24: Time Series Filter
Figure 14-25: Console Preview Mode with Time Series Filter

InsightSoftware.com User Guide
Page 301 of 429
One of the most advanced features of Insight
® is the Hierarchy Builder. This feature
allows you to utilize existing hierarchical structures already defined within the JD Edwards™ system or to create new structures based on existing summary balance data.
NB DUE TO THE COMPREHENSIVE OPTIONS AVAILABLE IN THE HIERARCHY ENGINE, THIS CHAPTER
IS BROKEN DOWN INTO AN INITIAL EXPLANATION OF A SINGLE DIMENSION HIERARCHY. LATER
IN THE CHAPTER THE CONCEPTS OF MULTIPLE DIMENSIONS ARE INCLUDED, BASED ON THE
CONCEPTS INTRODUCED BY THE SINGLE DIMENSION.
To use this feature, „click‟ on the Hierarchy icon in the Inquiry Objects Ribbon Tab and you will be presented with the dialog shown in Figure 15-1:
Figure 15-1: Hierarchies Dialog

InsightSoftware.com User Guide
Page 302 of 429
Within this dialog, it is possible to perform a number of actions:
Create New hierarchical structures based on a user-defined specification
Import existing hierarchical structures based on pre-defined JD Edwards™ data structures
Export the hierarchy structure by clicking on the Export Excel Button
Edit existing user-defined hierarchical structures
Rename an existing hierarchical structure
Remove an existing hierarchical structure
Set hierarchy indentation and Expand/Collapse functionality using the Grid Options button
Establish Calculation Precedence on any calculations based within an existing hierarchy
Creating a New Hierarchy Hierarchies can be built on any filter dimension. To build hierarchies on group filtered items such as Category Codes or Subledgers, first select the appropriate group in the filter before commencing the hierarchy building process.
As a working example, we will construct a hierarchy based on Object Category Codes using the Category Code Group 17 to build an Auditing reporting structure.
Prior to building a hierarchy, you must choose all or some of the selections to be displayed in the hierarchy by using the Object Category Code filter. This is shown in Figure 15-2:
Figure 15-2: Business Object Category Code Filter Selection

InsightSoftware.com User Guide
Page 303 of 429
To create a user-defined hierarchy, within the Hierarchies dialog „click‟ on the New button. You are presented with the following Create New Hierarchy dialog as shown in Figure 15-3:
Figure 15-3: Create New Hierarchy
First provide a unique name to identify the new hierarchy. This is done by typing in the chosen name in the first field in the dialog (in this example, „Account/Auditor Analysis). Secondly, select the dimension of the hierarchy by using the Query Assist controls– in this example, Object Category Code „ACCT AUDITED BY COMPANY (Figure 15-4):
Figure 15-4: Entering the Hierarchy Name and Dimension Field
Note that on some Dimension fields, there may need to be further selections due to the Dimension field‟s ability to have subtypes.
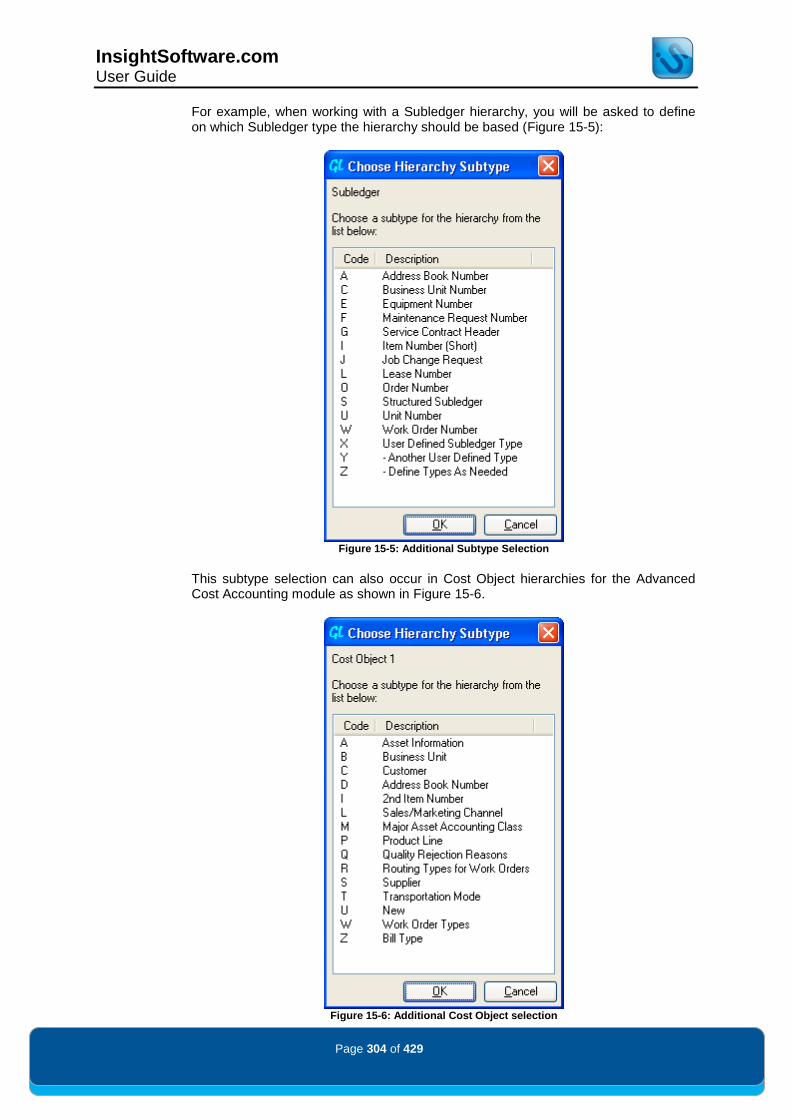
InsightSoftware.com User Guide
Page 304 of 429
For example, when working with a Subledger hierarchy, you will be asked to define on which Subledger type the hierarchy should be based (Figure 15-5):
Figure 15-5: Additional Subtype Selection
This subtype selection can also occur in Cost Object hierarchies for the Advanced Cost Accounting module as shown in Figure 15-6.
Figure 15-6: Additional Cost Object selection

InsightSoftware.com User Guide
Page 305 of 429
Continuing with the Account/Auditor Analysis hierarchy, when all of fields have been chosen, „click‟ on the OK button to proceed to the Edit Hierarchy Dialog shown in Figure 15-7:
Figure 15-7: Hierarchy Builder
The Edit Hierarchy Dialog is similar in appearance to the Query Assist dialog, with the list of possible selections on the left-hand panel and the creation of the hierarchical structure on the right-hand panel. The icons on the toolbar of the hierarchy builder screen also perform the same functions as the Query Assist dialog.
One addition to the Query Assist standard is the bottom left-hand panel which updates with your selected values from the top left-hand panel. This is designed to assist users who are building Multiple Dimensional Hierarchies.
„Click‟ on the Find button to return the available selections from which the hierarchy is constructed. If necessary, prior to „clicking‟ on the Find button, further filtering criteria can be applied by using Query By Example to restrict the list of possible selections.
The hierarchy is constructed as a „tree-like‟ structure, with the name of the hierarchy appearing at the pinnacle of the tree. This is known as the Root Node.
A hierarchy is formed by a combination of two elements: user-defined items called nodes and items from the list of selections on the left-hand panel. Within a typical hierarchy, items selected on the left are usually parented to the user-defined nodes. Therefore, as a first step, these nodes need to be added to the tree.

InsightSoftware.com User Guide
Page 306 of 429
Adding New Nodes
To add a new node, first highlight the item within the hierarchy that you wish to „parent‟ the item to. In the case where you are adding a node for the first time, the name of the hierarchy itself should be selected in the right-hand panel. Then „right-click‟ to display a pop-up menu from which the New Entry option should be selected.
This will present the New Hierarchy Entry Dialog as shown in Figure 15-8.
Figure 15-8: New Hierarchy Entry
Within this screen there are three types of node entries that can be created in the hierarchy:
Label Entry – Create a header node to provide a way of rolling up data from child to parent as shown in Figure 15-8.
Normal Entry – Specify actual values in the hierarchy dimension. As shown in Figure 15-9, literal values can be entered into the Field Value section of the dialog. See the Advanced Single Node Functionality (Ranges and Commas) section for further details on the Total/Expanded functionality.
Figure 15-9: Normal Entry
Calculated Entry – Create a Row Based Calculation.

InsightSoftware.com User Guide
Page 307 of 429
For this example, we are generating a hierarchy that presents how much exposure an auditor would have to a multinational company‟s key accounts.
As each auditing company has a parent company, we want to group companies by their parents. For this we will select Label Entry and enter the first node within the structure (as shown in Figure 15-10). the created node is displayed in Figure 15-11.
Figure 15-10: Label Entry Node
Figure 15-11: Manual Creation of a Label
Label nodes do not contain data themselves, but rather are used to group together selected items or other nodes that are aggregated, with the resulting calculation stored at this level.
Options in this dialog:
Name/Description Override – Each row must have a unique name. This is the name the system uses and the way in which it will be displayed. Optionally, you can override this display by entering a Description Override.
Display – Regardless of the type of entry, you have three display options. If, for example, this is a heading, you would select „Always‟ to display. Sometimes you may have calculations that you use to develop a secondary calculation, but choose not to display the calculation in your report. In that case, you would choose „Never‟. If your report has a row that refers to a specific account, you now have the option to display that row only when there is a balance by choosing the „When balance‟ option.
Reverse the signs - This function applies when the label entry is used as a rollup and you wish to reverse the sign of the row, turning a debit into a credit and vice versa. It changes the mathematical value and the display.
Roll values up into this one – This feature allows the values for any indented rows to be rolled up into a Label Entry.
At this point, you can add selections from the list of possible items in the left-hand panel, or you can continue to add new nodes to the structure. Adding new nodes is carried out using the same method mentioned previously.
Now a new node can be added as a Child or a Sibling of the Parent Company label node. „Right-clicking‟ on the Parent Company node and selecting the New Entry option will allow the creation of a child label node as shown in Figure 15-12:
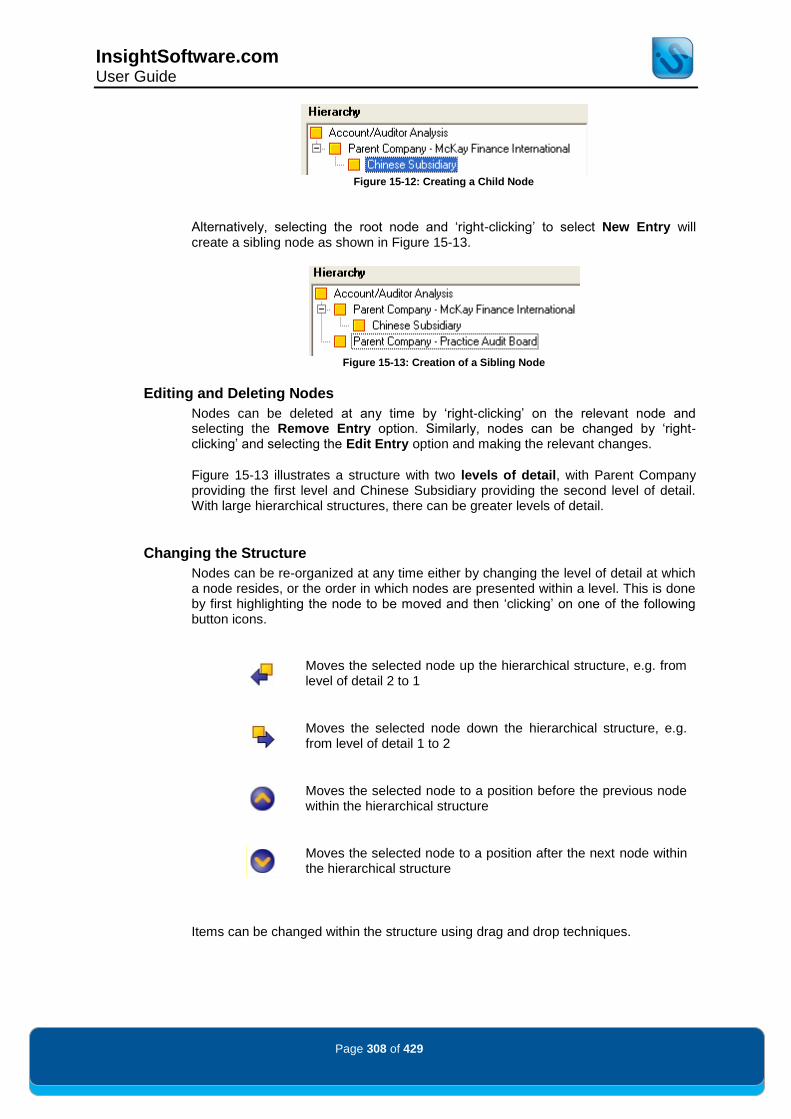
InsightSoftware.com User Guide
Page 308 of 429
Figure 15-12: Creating a Child Node
Alternatively, selecting the root node and „right-clicking‟ to select New Entry will create a sibling node as shown in Figure 15-13.
Figure 15-13: Creation of a Sibling Node
Editing and Deleting Nodes
Nodes can be deleted at any time by „right-clicking‟ on the relevant node and selecting the Remove Entry option. Similarly, nodes can be changed by „right-clicking‟ and selecting the Edit Entry option and making the relevant changes.
Figure 15-13 illustrates a structure with two levels of detail, with Parent Company providing the first level and Chinese Subsidiary providing the second level of detail. With large hierarchical structures, there can be greater levels of detail.
Changing the Structure
Nodes can be re-organized at any time either by changing the level of detail at which a node resides, or the order in which nodes are presented within a level. This is done by first highlighting the node to be moved and then „clicking‟ on one of the following button icons.
Moves the selected node up the hierarchical structure, e.g. from level of detail 2 to 1
Moves the selected node down the hierarchical structure, e.g. from level of detail 1 to 2
Moves the selected node to a position before the previous node within the hierarchical structure
Moves the selected node to a position after the next node within the hierarchical structure
Items can be changed within the structure using drag and drop techniques.

InsightSoftware.com User Guide
Page 309 of 429
Adding and Removing Items in the Structure
Once nodes have been included in the structure, items that are available for selection in the left-hand panel can be added at any time. First highlight the selections you wish to include within the structure. Having done so, the node within the hierarchy that will act as the „parent‟ for these selected items should be chosen by „clicking‟ with the mouse. Then „click‟ on the Add button to include the selected items within the structure.
To remove any data items already within the structure, highlight the relevant items with the mouse and „click‟ on the Remove button. The Add and Remove button icons are shown below:
Adds the selected items into the hierarchical structure
Removes the selected items from the hierarchical structure
Data Item Order
Within a particular node, data items are presented in the order in which they are selected. This is different than the list of available selections in the left-hand panel, as these are displayed in sequence.
Figure 15-4 illustrates a completed Audit Analysis Hierarchy structure based on Object Category Code 17:
Figure 15-14: Hierarchy Structure

InsightSoftware.com User Guide
Page 310 of 429
Hierarchy Options
When the hierarchy has been defined, „click‟ on OK to return to the main Hierarchy Dialog. The next step is to specify any options controlling the behavior of the hierarchy.
In the Hierarchies Dialog, there is a Settings section at the bottom of the dialog. The Parent First option, shown in Figure 15-15, dictates the sequence of the entire hierarchy when the result set is returned. Using the Account/Audit Analysis example, if the Parent First option is selected, the Parent Company, McKay Finance International, would be presented in the first line of the result set.
Conversely, if the option is de-selected, Parent Company – McKay Finance International appears as the last line of the result set.
Figure 15-15: Starting Level and Parent First Options
Using Grid Hierarchies Now that the hierarchy has been created, it needs to be selected in the inquiry‟s Grid Hierarchy control, shown below in Figure 15-16.
Figure 15-16: Selecting a Hierarchy
The following Conflicting Features dialog shown in Figure 15-17 may appear if you have a Grand Total or Total enabled within your inquiry. Having both a Hierarchy and totaling functionality enabled can result in duplicated rows. „Click‟ on yes to disable the Total functionality.
Figure 15-17: Conflicting Features Dialog
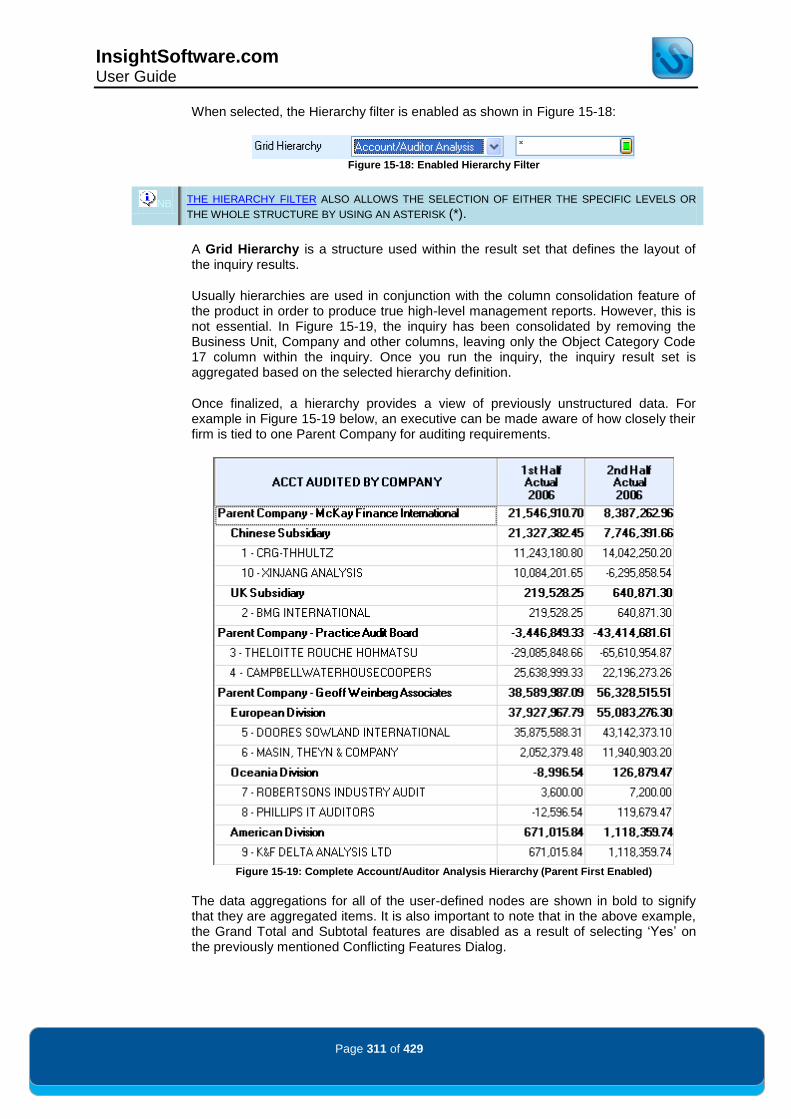
InsightSoftware.com User Guide
Page 311 of 429
When selected, the Hierarchy filter is enabled as shown in Figure 15-18:
Figure 15-18: Enabled Hierarchy Filter
NB THE HIERARCHY FILTER ALSO ALLOWS THE SELECTION OF EITHER THE SPECIFIC LEVELS OR
THE WHOLE STRUCTURE BY USING AN ASTERISK (*).
A Grid Hierarchy is a structure used within the result set that defines the layout of the inquiry results.
Usually hierarchies are used in conjunction with the column consolidation feature of the product in order to produce true high-level management reports. However, this is not essential. In Figure 15-19, the inquiry has been consolidated by removing the Business Unit, Company and other columns, leaving only the Object Category Code 17 column within the inquiry. Once you run the inquiry, the inquiry result set is aggregated based on the selected hierarchy definition.
Once finalized, a hierarchy provides a view of previously unstructured data. For example in Figure 15-19 below, an executive can be made aware of how closely their firm is tied to one Parent Company for auditing requirements.
Figure 15-19: Complete Account/Auditor Analysis Hierarchy (Parent First Enabled)
The data aggregations for all of the user-defined nodes are shown in bold to signify that they are aggregated items. It is also important to note that in the above example, the Grand Total and Subtotal features are disabled as a result of selecting „Yes‟ on the previously mentioned Conflicting Features Dialog.

InsightSoftware.com User Guide
Page 312 of 429
The Hierarchy Filter By default, the entire Grid hierarchy structure is displayed within the result set. However, this can be controlled using the Hierarchy Filter. Once a hierarchy is enabled, the result set generated by the hierarchy can be filtered through the Hierarchy Filter, which is to the right of the Grid Hierarchy Drop Down. „Click‟ into the filter shown in Figure 15-20 and the Query Assist icon will appear to the right.
Figure 15-20: Hierarchy Filter
„Click‟ on the icon and the following screen shown in Figure 15-21 will be displayed:
Figure 15-21: Hierarchy Filter Query Assist
There are three methods of filtering, controlled in each of the tabs:
Search
Level
Hierarchy
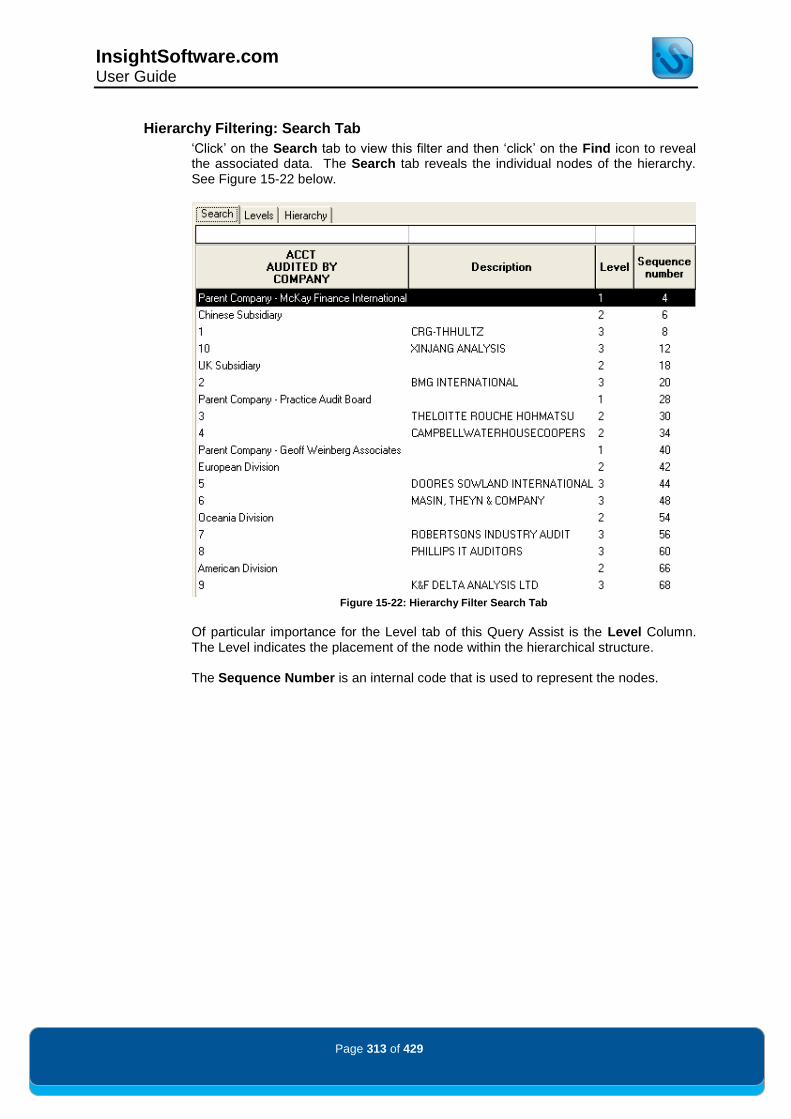
InsightSoftware.com User Guide
Page 313 of 429
Hierarchy Filtering: Search Tab
„Click‟ on the Search tab to view this filter and then „click‟ on the Find icon to reveal the associated data. The Search tab reveals the individual nodes of the hierarchy. See Figure 15-22 below.
Figure 15-22: Hierarchy Filter Search Tab
Of particular importance for the Level tab of this Query Assist is the Level Column. The Level indicates the placement of the node within the hierarchical structure. The Sequence Number is an internal code that is used to represent the nodes.
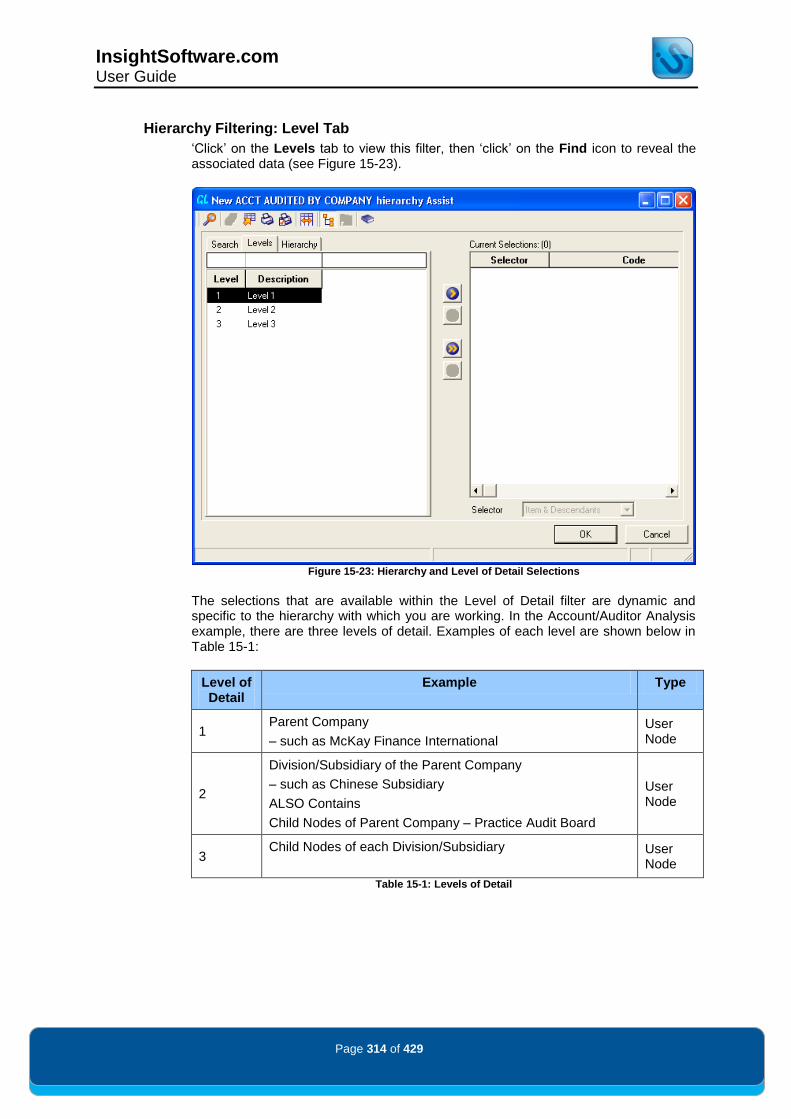
InsightSoftware.com User Guide
Page 314 of 429
Hierarchy Filtering: Level Tab
„Click‟ on the Levels tab to view this filter, then „click‟ on the Find icon to reveal the associated data (see Figure 15-23).
Figure 15-23: Hierarchy and Level of Detail Selections
The selections that are available within the Level of Detail filter are dynamic and specific to the hierarchy with which you are working. In the Account/Auditor Analysis example, there are three levels of detail. Examples of each level are shown below in Table 15-1:
Level of Detail
Example Type
1 Parent Company
– such as McKay Finance International
User Node
2
Division/Subsidiary of the Parent Company
– such as Chinese Subsidiary
ALSO Contains
Child Nodes of Parent Company – Practice Audit Board
User Node
3 Child Nodes of each Division/Subsidiary
User Node
Table 15-1: Levels of Detail

InsightSoftware.com User Guide
Page 315 of 429
In the example shown below in Figure 15-24, Level 1 and 2 have been selected.
Figure 15-24: Levels Selected in Hierarchy Filter
The result in the filter is shown in Figure 15-25:
Figure 15-25: Grid Hierarchy Filter Displaying the Level Selections
After re-running the inquiry, you are narrowing your displayed data to levels 1 and 2 within the hierarchy. In the Account/Auditor Analysis hierarchy, this excludes the data items for the Children of various nodes such as Chinese Subsidiary and UK Subsidiary. As Figure 15-26 shows, only the Level 1 and 2 nodes remain.
Figure 15-26: Account/Auditor Analysis Hierarchy Showing only Levels 1 & 2
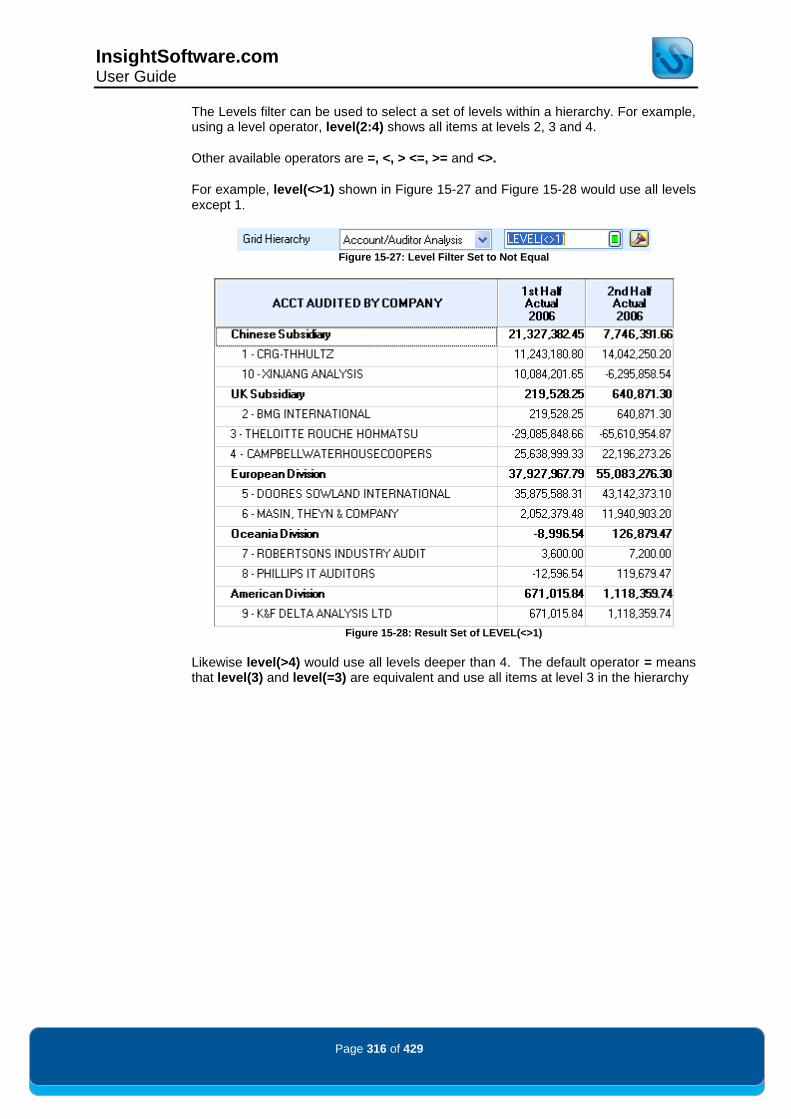
InsightSoftware.com User Guide
Page 316 of 429
The Levels filter can be used to select a set of levels within a hierarchy. For example, using a level operator, level(2:4) shows all items at levels 2, 3 and 4.
Other available operators are =, <, > <=, >= and <>.
For example, level(<>1) shown in Figure 15-27 and Figure 15-28 would use all levels except 1.
Figure 15-27: Level Filter Set to Not Equal
Figure 15-28: Result Set of LEVEL(<>1)
Likewise level(>4) would use all levels deeper than 4. The default operator = means that level(3) and level(=3) are equivalent and use all items at level 3 in the hierarchy
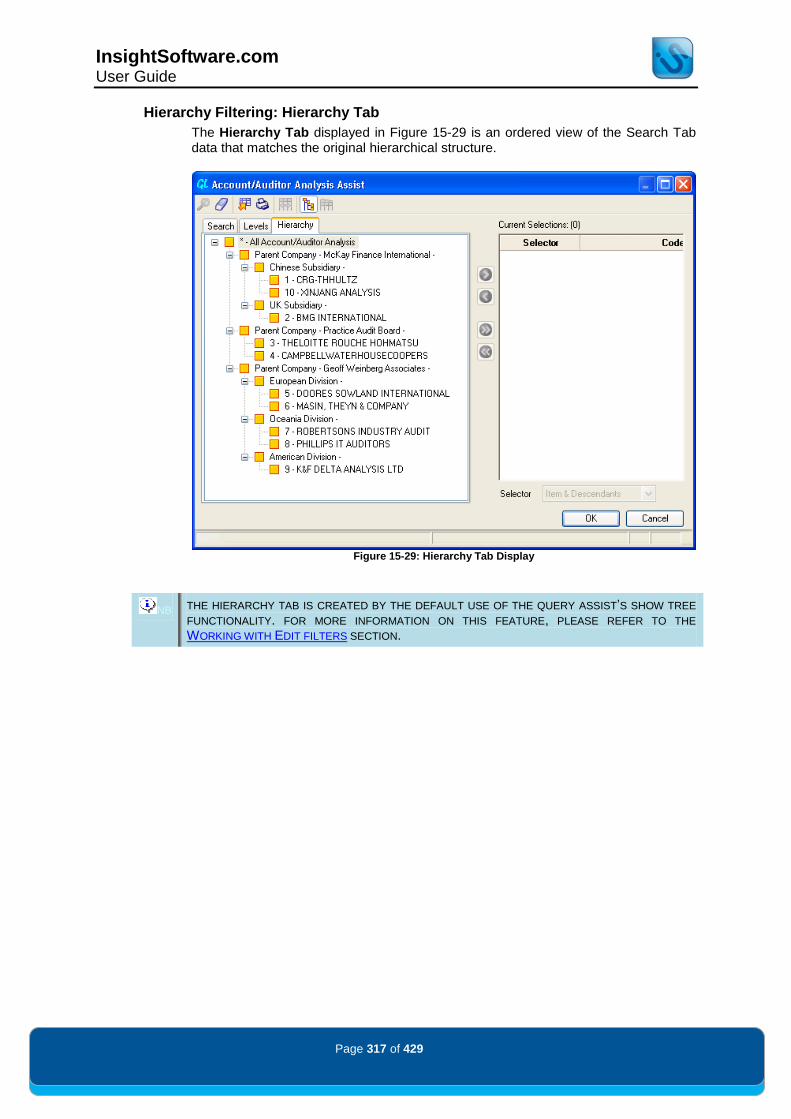
InsightSoftware.com User Guide
Page 317 of 429
Hierarchy Filtering: Hierarchy Tab
The Hierarchy Tab displayed in Figure 15-29 is an ordered view of the Search Tab data that matches the original hierarchical structure.
Figure 15-29: Hierarchy Tab Display
NB THE HIERARCHY TAB IS CREATED BY THE DEFAULT USE OF THE QUERY ASSIST‟S SHOW TREE
FUNCTIONALITY. FOR MORE INFORMATION ON THIS FEATURE, PLEASE REFER TO THE
WORKING WITH EDIT FILTERS SECTION.

InsightSoftware.com User Guide
Page 318 of 429
Advanced Hierarchy Filtering: Use of Hierarchy Selectors
The Search and Hierarchy Tabs found in the Hierarchy Filter have an activated control that allows for greater selection of hierarchy nodes. When a hierarchy node has been selected, the control shown in Figure 15-30 is enabled.
Figure 15-30: Filtering Options
It is possible to specify a subset of the hierarchy to use in the report with combinations of the keywords shown in Table 15-2.
Descendants Only Use all levels below the item
Children Only Use next level down from the item
Item Only Use a single element on the hierarchy
Item & Descendants Use item and all levels below
Item & Children Use item and the next level down
Level Use items from particular levels
Table 15-2: Subsets of a Hierarchy
For example, Descendants Only being applied to Parent Company McKay Finance International would use all items that are subordinate to this node. Within the filter this would be displayed as DESC(PARENT COMPANY - MCKAY FINANCE INTERNATIONAL), as shown in Figure 15-31.
Figure 15-31: Descendants Only Setting Applied to Node

InsightSoftware.com User Guide
Page 319 of 429
It is possible to use combinations of selectors, for example specifying Children Only for the Parent nodes as shown in Figure 15-32.
Figure 15-32: Selected Nodes with Children Only Setting
The results of this setting are shown in Figure 15-33.
Figure 15-33: Hierarchy Selector with Child Nodes Specified

InsightSoftware.com User Guide
Page 320 of 429
Editing and Removing Hierarchies To edit or remove a hierarchy from an inquiry, „click‟ on the Hierarchy icon on the Inquiry Objects Ribbon Tab. You will then be presented with a list of available hierarchies for the current inquiry. Figure 15-34 illustrates the previously defined Account/Auditor Analysis hierarchy:
Figure 15-34: Editing and Removing Hierarchies
To edit a hierarchy, highlight the required one using the mouse and „click‟ on the Edit button. This will present you with the same dialog used to construct a new hierarchy, which uses the same techniques.
To remove a hierarchy, highlight it and „click‟ on the Remove Button.

InsightSoftware.com User Guide
Page 321 of 429
Grid Hierarchy Options: Indentation
„Click‟ on Grid Options to edit the Grid Options associated with the selected hierarchy. This will produce the dialog shown in Figure 15-35:
Figure 15-35: Grid Hierarchy Options Dialog
The Indentation drop down shown in Figure 15-36 manipulates the display of the hierarchy.
Figure 15-36: Indentation Settings
In the result set, each level of the hierarchy will be indented to illustrate the different levels. By default, the setting is Indent Children, so the bottom level items get indented the most, however this can be changed.

InsightSoftware.com User Guide
Page 322 of 429
This can be reversed by selecting the Indent Totals option. The effect of enabling Indent Totals is shown below in Figure 15-37.
Figure 15-37: Indent Totals Applied to Hierarchy Result Set
If no indentation is required, the No Indentation option can be selected (Figure 15-38).
Figure 15-38: No Indentation Applied to Hierarchy Result Set

InsightSoftware.com User Guide
Page 323 of 429
Grid Hierarchy Options: Expand/Collapse
The Expand/ Collapse Hierarchy functionality shown in Figure 15-39 allows you to dynamically modify the way a hierarchy displays data.
Figure 15-39: Grid Hierarchy Option: Expand/Collapse Control
Using the previous Account/Auditor Analysis hierarchy, we have enabled the Expand/Collapse functionality as shown in Figure 15-40.
Figure 15-40: Initial Effects of Expand Collapse Hierarchy Functionality
The hierarchy is now displayed at its lowest level. However, by using the plus symbols we can now expand out the hierarchy for specific Children and Descendents nodes (see Figure 15-41).
Figure 15-41: Customized Expansion of a Hierarchy

InsightSoftware.com User Guide
Page 324 of 429
The Grid Hierarchy Options dialog text explains that the Expand/Collapse functionality will only work when:
Subtotals are disabled
o Grand Totals can be displayed
When the hierarchy dimension is the lowest in the label sort order.
o This means that within Column Sorting and Grouping, in the Sorting & Grouping tab, the hierarchy dimension is below any other label columns in sort order.
o The following example shown in Figure 15-42, where Object Account unit has been added, would be correct for enabling the functionality. However If Object Account was below the hierarchy dimension of ACCT AUDITED BY COMPANY, the Expand/Collapse functionality would be disabled.
Figure 15-42: Correct Label Sorting Order for Expand/Collapse Functionality
The Expand/Collapse Hierarchy functionality works with:
Fields that are part of the Hierarchy Columns within the inquiry

InsightSoftware.com User Guide
Page 325 of 429
The Expand/Collapse functionality is shown in Figure 15-43 below.
Figure 15-43: Account/Auditor Analysis Hierarchy with Added Inquiry Column
InsightSoftware.com User Guide
Page 326 of 429
Importing Hierarchies In addition to defining hierarchies from scratch, it is also possible to import pre-defined hierarchies based on standard JD Edwards™ data structures. While these structures are pre-defined, they are dynamic at the point of import as they are derived from the JD Edwards™ system. These can subsequently be edited as described above. The following three pre-defined hierarchies are available to import in the General Ledger, Fixed Assets and Job Cost modules.
Account Level of Detail: Previously known as LOD, this import hierarchy is based on a nominated chart of account structure from the F0901 file
BU Structure (F0050): A Business Unit hierarchy based on inter-relationships defined in the F0050 file
BU Style (F0006): A Business Unit hierarchy based on a parent-child structure contained within the F0006 table and primarily used for Job Costing to define the relationship of multiple jobs „belonging‟ to a project
The following pre-defined hierarchy is available for import in the Fixed Assets module:
Asset Parent Child: An Asset Number hierarchy based on a parent-child structure contained within the F1201 file for defining the relationship for categorizing assets together
The following pre-defined hierarchy is available for import in the Manufacturing Module:
Item Number Parent/Child (F3002): This import hierarchy is based on Manufacturing Data which orders the components and sub components of a product

InsightSoftware.com User Guide
Page 327 of 429
„Clicking‟ on the Import button starts the Import Hierarchy Wizard, as shown in Figure 15-44. (As there are no pre-defined hierarchies in the Accounts Payable, Accounts Receivable, Tax and Homebuilder modules, the Import button is disabled.)
Figure 15-44: Import Hierarchy Wizard
To begin the import process, „click‟ on the Next button to reveal the screen shown in Figure 15-45:
Figure 15-45: Selecting a Hierarchy to Import
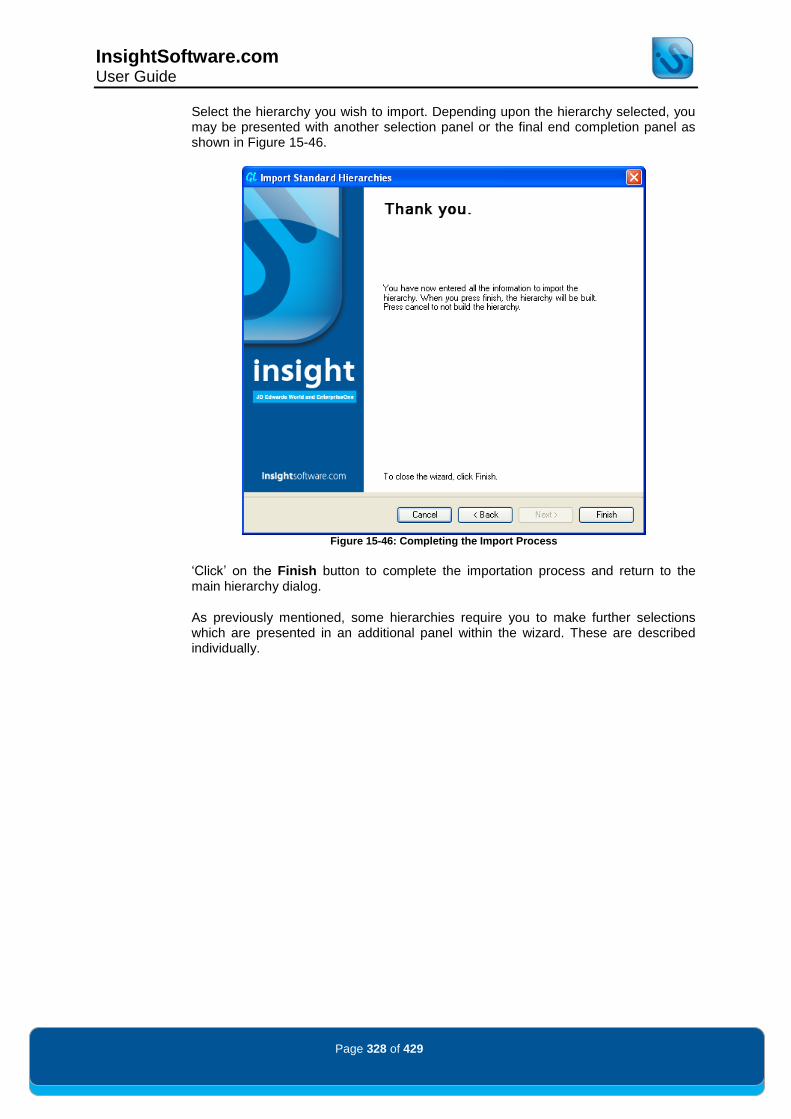
InsightSoftware.com User Guide
Page 328 of 429
Select the hierarchy you wish to import. Depending upon the hierarchy selected, you may be presented with another selection panel or the final end completion panel as shown in Figure 15-46.
Figure 15-46: Completing the Import Process
„Click‟ on the Finish button to complete the importation process and return to the main hierarchy dialog.
As previously mentioned, some hierarchies require you to make further selections which are presented in an additional panel within the wizard. These are described individually.
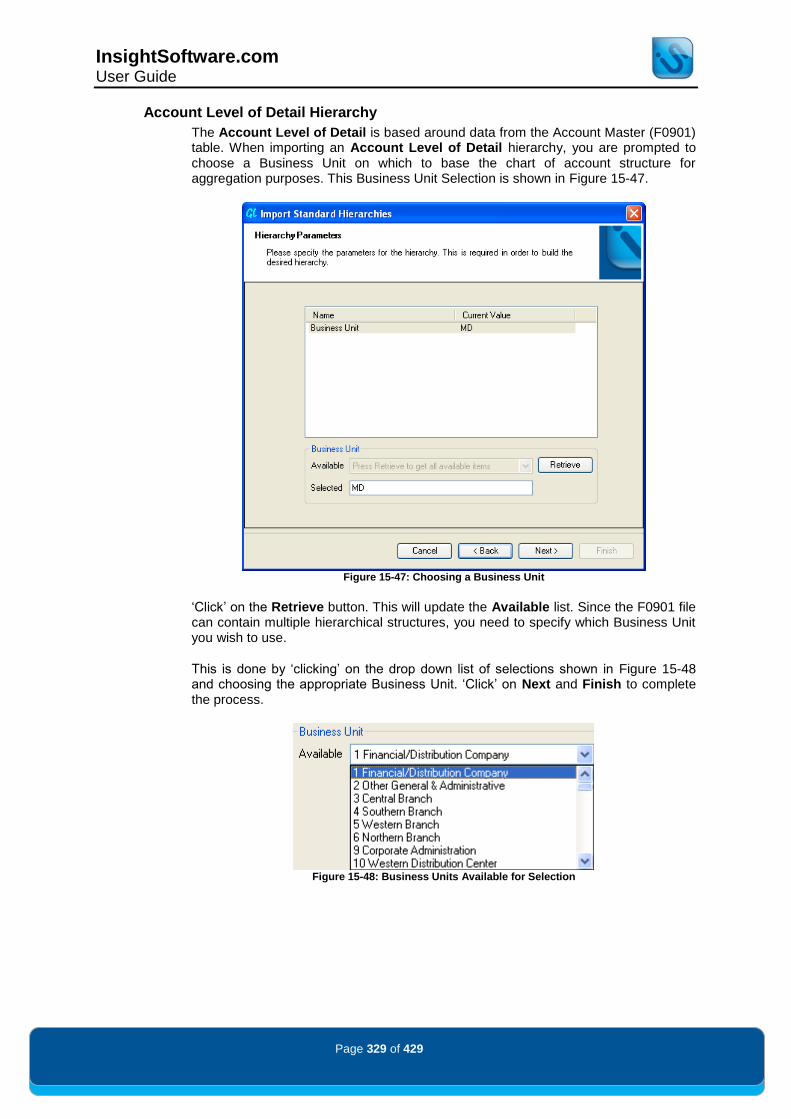
InsightSoftware.com User Guide
Page 329 of 429
Account Level of Detail Hierarchy
The Account Level of Detail is based around data from the Account Master (F0901) table. When importing an Account Level of Detail hierarchy, you are prompted to choose a Business Unit on which to base the chart of account structure for aggregation purposes. This Business Unit Selection is shown in Figure 15-47.
Figure 15-47: Choosing a Business Unit
„Click‟ on the Retrieve button. This will update the Available list. Since the F0901 file can contain multiple hierarchical structures, you need to specify which Business Unit you wish to use.
This is done by „clicking‟ on the drop down list of selections shown in Figure 15-48 and choosing the appropriate Business Unit. „Click‟ on Next and Finish to complete the process.
Figure 15-48: Business Units Available for Selection

InsightSoftware.com User Guide
Page 330 of 429
BU Structure (F0050) Hierarchy
Selecting the BU Structure (F0050) is based around data from the Organization Structure Master File (F0050). Upon selecting the BU Structure (F0050) hierarchy, the following additional panel shown in Figure 15-49 is displayed and you are prompted to specify the Organization Type:
Figure 15-49: Organization Type Panel
„Click‟ on the Retrieve button. This will update the Available list. Since the F0050 file can contain multiple hierarchical structures, you need to specify which structure you wish to use.
This is done by „clicking‟ on the drop down list of selections, as shown in Figure 15-50, and choosing the appropriate organization type. „Click‟ on Next and Finish to complete the process.
Figure 15-50: Organization Types Available for Selection
InsightSoftware.com User Guide
Page 331 of 429
BU Style (F0006) Hierarchy
The BU Style (F0006) is based around data from the Business Unit Master (F0006). The hierarchy does not have any customized settings and will default to the Dynamic Hierarchies dialog.
Item Number Parent/Child (F3002) Hierarchy
The Item Number Parent/Child (F3002) hierarchy is based on data from the Bill of Material Master File (F3002). The Hierarchy does not have any customized settings, and will default to the Dynamic Hierarchies dialog.
Asset Parent Child (F1201) Hierarchy
The Asset parent Child (F1201) Hierarchy is based around data from the Asset Master File (F1201). The hierarchy does not have any customized settings, and will default to the Dynamic Hierarchies dialog.

InsightSoftware.com User Guide
Page 332 of 429
Dynamic Hierarchies
Dynamic hierarchies are import hierarchies that are automatically rebuilt when the report is loaded or run. They are designed to they pick up changes to the structure in the JD Edwards™ system. The dynamic import process can only work for hierarchies that have been imported.
Figure 15-51 shows a panel from the Import Hierarchy wizard, which designates how an enabled dynamic hierarchy is configured:
Figure 15-51: Dynamic Hierarchy Setup
Update designates whether the Hierarchies update at the time of Update After Load or Update Before Run. See Figure 15-52 below.
Figure 15-52: Update Drop Down
The second control, Dynamic Parameters, designates what the hierarchy will be using for its update. The example shown in Figure 15-53 is from the Account Level of Detail hierarchy which is based on Business Unit. (Please note that this drop down may not be enabled based on the Import Hierarchy).
Figure 15-53: Dynamic Parameter Drop Down
Once the hierarchy is finalized, the main Hierarchy dialog allows the Dynamic Update setting to be modified post completion. This control is shown in Figure 15-54.
Figure 15-54: Dynamic Update Control

InsightSoftware.com User Guide
Page 333 of 429
In the example shown in Figure 15-55 below, we have set up an Available Grid Hierarchy, where the parent‟s totals are shown after the subordinates (the Parent First checkbox is unchecked), with a starting level equal to 1 and the dynamic update taking place after the inquiry is loaded.
You can also set the state to be either Active filter hierarchy or Inactive filter hierarchy by using the drop down list. Available filter hierarchies are used to refine the query result and inactive filter hierarchies are ignored.
Figure 15-55: Hierarchies Dialog
When the hierarchy is set up, you can rename it by „clicking‟ on the Rename button or you can continue to define others by „clicking‟ on the New or Import buttons.
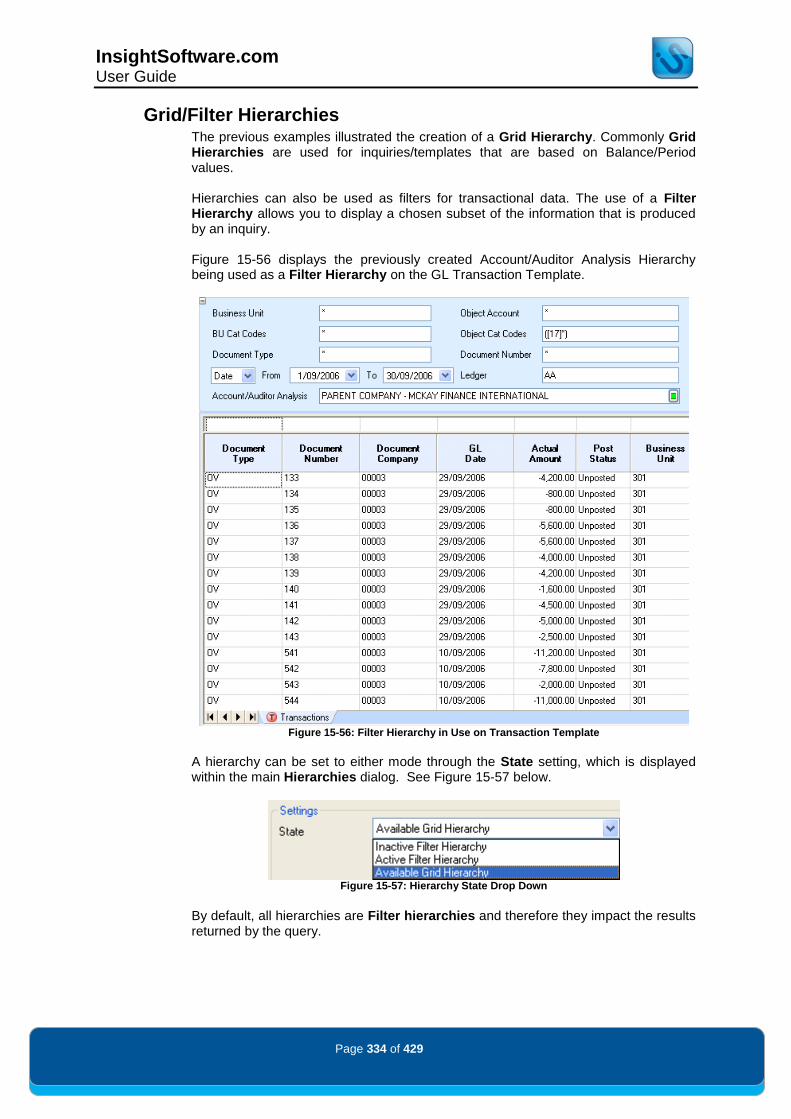
InsightSoftware.com User Guide
Page 334 of 429
Grid/Filter Hierarchies The previous examples illustrated the creation of a Grid Hierarchy. Commonly Grid Hierarchies are used for inquiries/templates that are based on Balance/Period values. Hierarchies can also be used as filters for transactional data. The use of a Filter Hierarchy allows you to display a chosen subset of the information that is produced by an inquiry. Figure 15-56 displays the previously created Account/Auditor Analysis Hierarchy being used as a Filter Hierarchy on the GL Transaction Template.
Figure 15-56: Filter Hierarchy in Use on Transaction Template
A hierarchy can be set to either mode through the State setting, which is displayed within the main Hierarchies dialog. See Figure 15-57 below.
Figure 15-57: Hierarchy State Drop Down
By default, all hierarchies are Filter hierarchies and therefore they impact the results returned by the query.

InsightSoftware.com User Guide
Page 335 of 429
A hierarchy may be selected as a Grid Hierarchy, but only one Grid Hierarchy can be active at one time. It is also possible to use a hierarchy as a filter on another hierarchy. Figure 15-58 shows an Account Level of Detail Grid Hierarchy whose results are being filtered by the previously created Account/Auditor Analysis Hierarchy.
Figure 15-58: Grid Hierarchy and Filter Hierarchy Affecting Result Set
The hierarchy control boxes have a quick status change feature, where a green button is displayed for enabled hierarchies. To change the status to a disabled hierarchy, „click‟ on the green button. This will disable the hierarchy and the color of the button changes to orange.
NB THE ABILITY TO ADD NEW FILTER HIERARCHIES USING FILTER LAYOUT FOR A POWER USER
REQUIRES A CONFIGURATOR/SUPER USER LICENSE. THE FILTER LAYOUT CONTROL IS
ACCESSED THROUGH THE CONFIGURATOR RIBBON TAB.
A power user can add new Filter Hierarchies for a Console User through the use of Console Filter Layout. The Console Filter Layout Control is accessed through the Console Ribbon Tab. For further details on Filter Layout and Console Filter Layout. (Figure 15-52), refer to the Console Report Design section.

InsightSoftware.com User Guide
Page 336 of 429
Adding a Drop Down Filter for your Grid Filter Hierarchy
A Grid Hierarchy or Filter Hierarchy can be customized to use a Drop Down Filter for selecting nodes.
Figure 15-59 displays both a Level Of Detail Grid Hierarchy and the previous Account/Auditor Analysis Filter Hierarchy being applied to a Drop Down Filter.
Figure 15-59: Drop Down Filter Functionality Applied to Both Grid and Filter Hierarchies
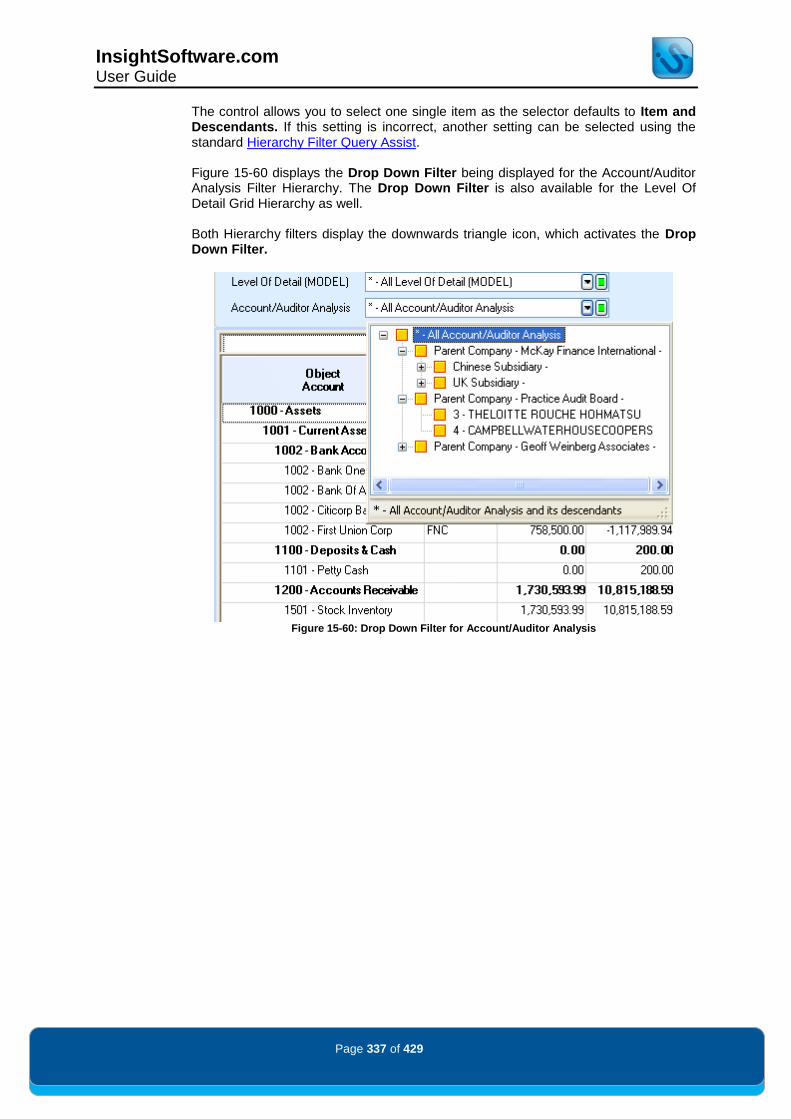
InsightSoftware.com User Guide
Page 337 of 429
The control allows you to select one single item as the selector defaults to Item and Descendants. If this setting is incorrect, another setting can be selected using the standard Hierarchy Filter Query Assist. Figure 15-60 displays the Drop Down Filter being displayed for the Account/Auditor Analysis Filter Hierarchy. The Drop Down Filter is also available for the Level Of Detail Grid Hierarchy as well. Both Hierarchy filters display the downwards triangle icon, which activates the Drop Down Filter.
Figure 15-60: Drop Down Filter for Account/Auditor Analysis
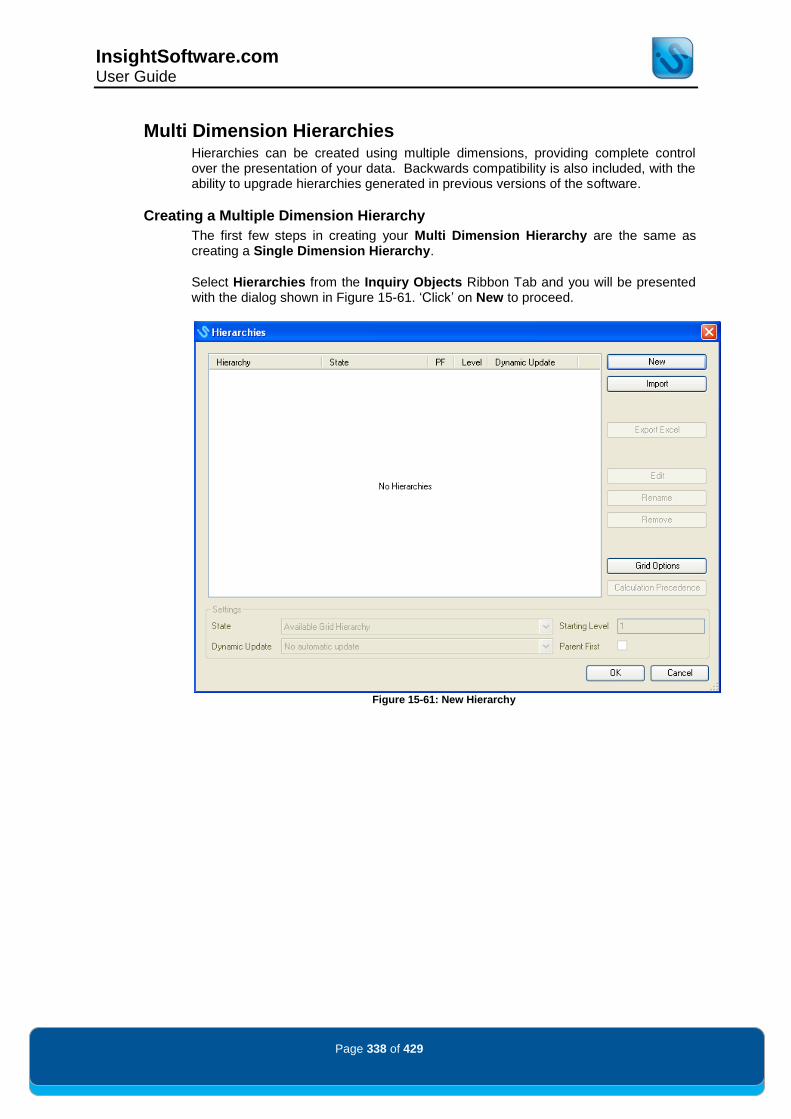
InsightSoftware.com User Guide
Page 338 of 429
Multi Dimension Hierarchies Hierarchies can be created using multiple dimensions, providing complete control over the presentation of your data. Backwards compatibility is also included, with the ability to upgrade hierarchies generated in previous versions of the software.
Creating a Multiple Dimension Hierarchy
The first few steps in creating your Multi Dimension Hierarchy are the same as creating a Single Dimension Hierarchy.
Select Hierarchies from the Inquiry Objects Ribbon Tab and you will be presented with the dialog shown in Figure 15-61. „Click‟ on New to proceed.
Figure 15-61: New Hierarchy

InsightSoftware.com User Guide
Page 339 of 429
After „clicking‟ New, you will be presented with the Create New Hierarchy dialog. By default, the available dimensions or fields are taken from the columns specified in your original inquiry.
Figure 15-62: Create a New Hierarchy
This dialog is the same as described previously for creating Single Dimension Hierarchies. To make a Multi Dimension Hierarchy, select more than one dimension or field.
Remember Multi Dimension Hierarchies can be based on many combinations of fields. In the example shown above, we have chosen to make a hierarchy based on Business Unit and Object Account; however there is the potential for hierarchies based on three, four, five, etc. dimensions.

InsightSoftware.com User Guide
Page 340 of 429
After you are happy with the dimensions or fields you have chosen to base your hierarchy upon, „click‟ OK. This will open the Edit Hierarchy screen shown in Figure 15-63. Here you will see that a tab has been created at the top of the Query Assist dialog to allow you to cycle through each of the previously specified dimensions in your hierarchy.
Figure 15-63: Initial Edit Hierarchy Dialog
As with single dimension hierarchies, it is now useful to limit your choices of selections using the Query By Example (QBE) field at the top of the Query Assist dialog. In the example shown in Figure 15-64, we have limited our Business Unit selections by entering „00003‟ in the QBE field.
Figure 15-64: Query By Example Using Company
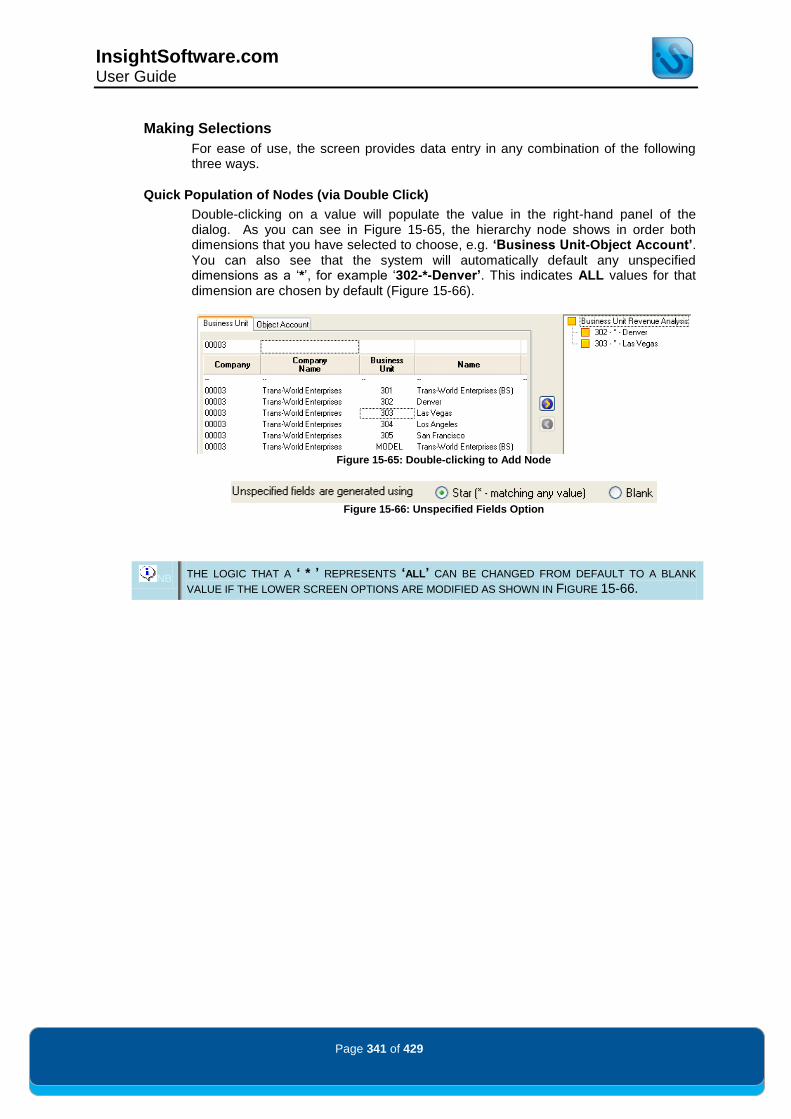
InsightSoftware.com User Guide
Page 341 of 429
Making Selections
For ease of use, the screen provides data entry in any combination of the following three ways.
Quick Population of Nodes (via Double Click)
Double-clicking on a value will populate the value in the right-hand panel of the dialog. As you can see in Figure 15-65, the hierarchy node shows in order both dimensions that you have selected to choose, e.g. ‘Business Unit-Object Account’. You can also see that the system will automatically default any unspecified dimensions as a „*‟, for example „302-*-Denver’. This indicates ALL values for that dimension are chosen by default (Figure 15-66).
Figure 15-65: Double-clicking to Add Node
Figure 15-66: Unspecified Fields Option
NB THE LOGIC THAT A ‘ * ’ REPRESENTS ‘ALL’ CAN BE CHANGED FROM DEFAULT TO A BLANK
VALUE IF THE LOWER SCREEN OPTIONS ARE MODIFIED AS SHOWN IN FIGURE 15-66.

InsightSoftware.com User Guide
Page 342 of 429
Multiple Selections (Recommended)
It is recommended that the following process is used for the creation of a complex hierarchy. This is due to the way that it provides a quick way of generating large numbers of hierarchy nodes in association with a safety feature.
You can select multiple values in one of two ways, either through the use of „Ctrl + left-click‟ or „Shift + arrow‟ keys.
As you select the values, you will see that they populate the panel at the bottom left-hand side of the dialog as shown in Figure 15-67.
Figure 15-67: Multiple Selections

InsightSoftware.com User Guide
Page 343 of 429
The benefit of this is that when you „click‟ on another dimension, you can still see what you have previously selected under the other tab. In Figure 15-68 you see that after clicking on the Object Account dimension, the Business Units are still visible, easing the hierarchy creation.
Figure 15-68: Selections Visible in Different Dimension
You will also notice in Figure 15-68 that the value under Object Account in the selections field is still „*‟. This is because we have yet to define which objects we need.
When choosing the second dimension, you can also select multiple values using the same method as before. Figure 15-69 shows the selections screen after choosing several objects. The Currently Selected Combinations equals 9 (3 Business Units x 3 Object Accounts).
Figure 15-69: Multiple Values Selected
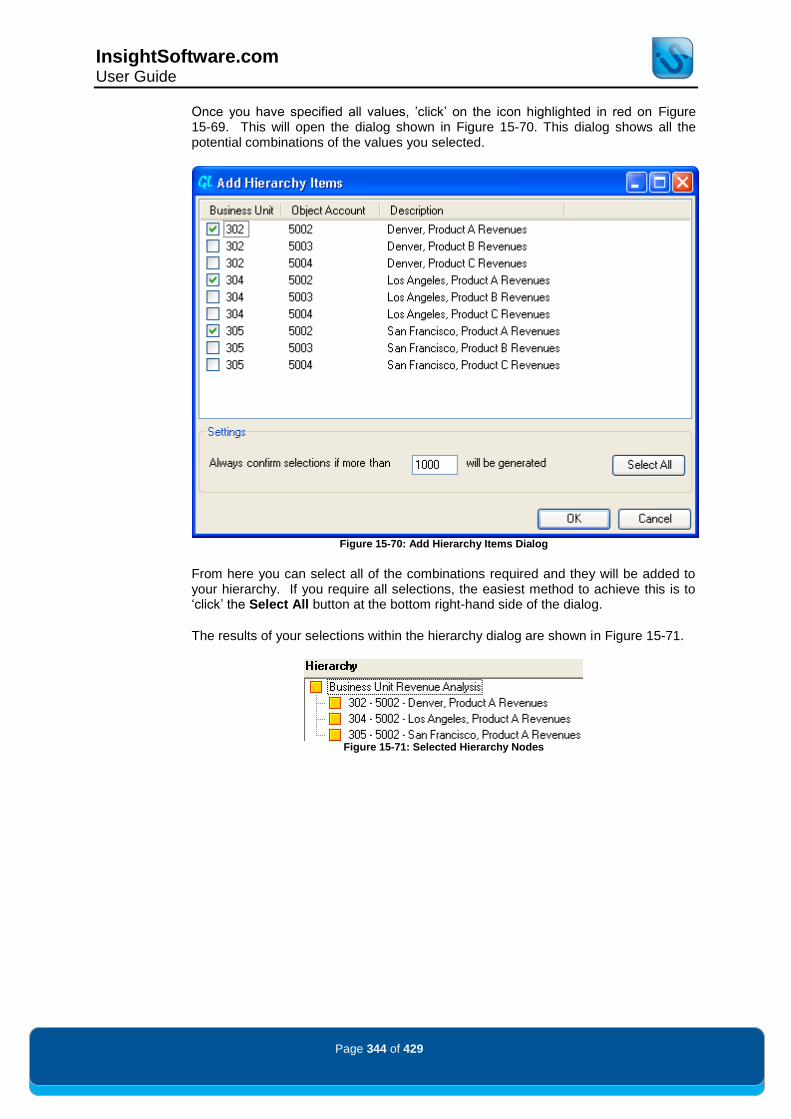
InsightSoftware.com User Guide
Page 344 of 429
Once you have specified all values, ‟click‟ on the icon highlighted in red on Figure 15-69. This will open the dialog shown in Figure 15-70. This dialog shows all the potential combinations of the values you selected.
Figure 15-70: Add Hierarchy Items Dialog
From here you can select all of the combinations required and they will be added to your hierarchy. If you require all selections, the easiest method to achieve this is to „click‟ the Select All button at the bottom right-hand side of the dialog.
The results of your selections within the hierarchy dialog are shown in Figure 15-71.
Figure 15-71: Selected Hierarchy Nodes

InsightSoftware.com User Guide
Page 345 of 429
Multiple Selections: Hierarchy Node Safety Feature
The previous example showed the generation of a small number of hierarchy nodes. The Hierarchy editor however also provides a safety feature to prevent too many rows from being automatically generated by accidental dimension combinations. Figure 15-72 displays an extreme example where numerous Business Unit and Object Account nodes have been selected.
Figure 15-72: High Number of Nodes Created
If you try to add the following set of node combinations to the hierarchy, the following warning shown in Figure 15-73 will be displayed.
Figure 15-73: Warning Dialog for High Number of Nodes Being Created
This warning message is controlled by the Settings section of the Add Hierarchy Items dialog, as shown in Figure 15-74.
Figure 15-74: Safety Settings for Hierarchy Node Generation
The default for this is 1000, but this can be adjusted depending on the hierarchy size requirements.

InsightSoftware.com User Guide
Page 346 of 429
Addition of Single Nodes (via Right Click)
Alternatively, if you prefer, you can also add nodes manually, by „right-clicking‟ in the right panel of the dialog and selecting New Entry to open the New Hierarchy Entry dialog. See Figure 15-75 below.
Figure 15-75: New Entry
Select Normal Entry and the dialog shown in Figure 15-76 will be displayed. This screen will expand to match the number of dimensions specified, allowing you to enter in the values required for each Hierarchy Dimension.
Figure 15-76: New Hierarchy Entry

InsightSoftware.com User Guide
Page 347 of 429
Upgrade Single Dimension Hierarchies
It is possible to Edit Single Dimension Hierarchies that have either been previously created or imported from a previous version of Insight
® and upgrade them to be a
Multi Dimension Hierarchy.
To do this, highlight the hierarchy you want to change from the main Hierarchy Dialog shown in Figure 15-77 and select Edit.
Figure 15-77: Edit Hierarchy
Once inside the hierarchy, select the Edit Hierarchy Fields button from the
toolbar . This will then present the Edit Hierarchy Fields dialog as shown in Figure 15-78.
Figure 15-78: Edit Hierarchy Fields
Add a different dimension to your hierarchy by selecting one or more of the available
fields. Additionally, you can alter the sequence of your dimensions by using the
or buttons, which can be found at the bottom of the screen.
For this example, we have added Business Unit as the second dimension (Figure 15-79).
Figure 15-79: Selected Hierarchy Dimension Fields

InsightSoftware.com User Guide
Page 348 of 429
„Click‟ on OK and the Edit Hierarchy dialog updates to reflect the changes in the hierarchy structure. As shown in Figure 15-80, an additional tab is now shown for the second hierarchy dimension.
Figure 15-80: Business Unit Tab Added to Dialog
Figure 15-81 illustrates the way that the second dimension has been added to the original hierarchy using the „ * ‟ default.
Figure 15-81: Results of Adding the Second Dimension
You can Edit the nodes to enter more specific selections by „right-clicking‟ on the desired node and selecting Edit Entry, which brings up the following dialog shown in Figure 15-82.
Figure 15-82: Manual Editing of a Two Dimension Hierarchy Node
Once you are happy with the new set of nodes, „click‟ OK and then OK again. This will then apply the changes made to your original hierarchy.

InsightSoftware.com User Guide
Page 349 of 429
Advanced Single Node Functionality (Ranges and Commas) The logic surrounding the manual entry of a hierarchy node has been upgraded to allow multiple values. This is done through the use of Ranges and Commas, which can now be used within the New Hierarchy Entry dialog. We will be using the previous „Revenue Analysis‟ example. The inquiry results of this hierarchy are shown below in Figure 15-83.
This hierarchy has been recently edited to add in the business unit dimension, but no business unit values have been specified. Hence all the business units are set to „*„ to indicate all of the values are included.
Figure 15-83: Two Dimension Hierarchy example with One Hierarchy Dimension Unspecified
Through the use of ranges and commas you can modify the individual nodes for display and maintenance purposes. Figure 15-84 shows the unedited hierarchy entry for „5002 – Product A Revenues *‟.
Figure 15-84: Standard Edit Hierarchy Dialog

InsightSoftware.com User Guide
Page 350 of 429
Within the business unit field, you can enter a single value or enter multiple values using ranges or commas.
For example, the current list of business units in this example is 302, 303, 304 and 305. However you can specify 302:310 so it would include additional business units added within this range in the future, as in Figure 15-85.
Figure 15-85: Use of Business Unit Range
The hierarchy node will now be capable of reflecting any additions or deletions of business units within the range. This information will also be displayed in the inquiry results as shown in Figure 15-86.
Figure 15-86: Edited Hierarchy Node with Range Functionality

InsightSoftware.com User Guide
Page 351 of 429
If the consolidation of eight business units into one row is not acceptable for reporting purposes, you can also break down the node into its components by choosing Expanded.
Figure 15-87 displays the Hierarchy Node with Expanded selected:
Figure 15-87: Show Details Enabled
Figure 15-88 displays the associated result set:
Figure 15-88: Row Expanded for Object Account 5002 Node

InsightSoftware.com User Guide
Page 352 of 429
Taking this functionality further, you may wish to exclude business unit 304 from this range. A way of doing this would be to use a range and comma combination as shown in Figure 15-89.
Figure 15-89: Hierarchy Node with Range, Comma and Show Details Functionality Enabled
The results of this are shown in Figure 15-90. As you can see, the individual hierarchy node is now configured for both display (through the use of Show Details) and maintenance (through the use of range and comma functionality).
Figure 15-90: Results of Hierarchy Node Configured to Exclude Business Unit 304
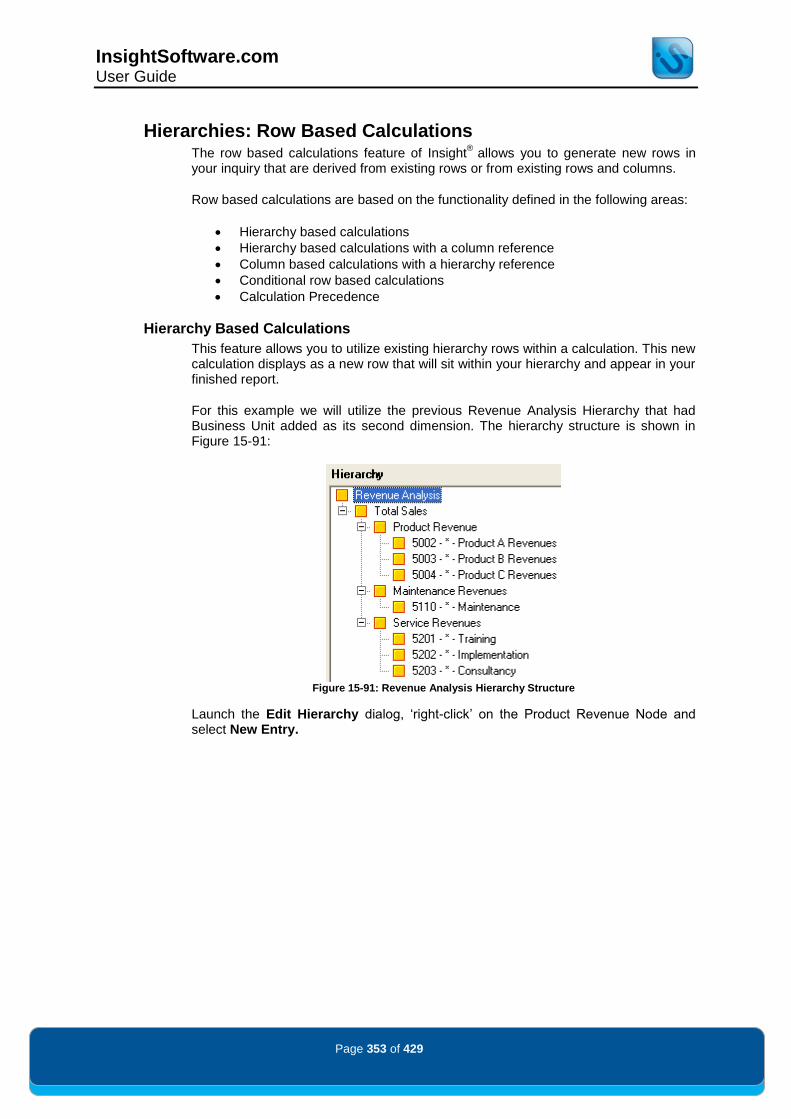
InsightSoftware.com User Guide
Page 353 of 429
Hierarchies: Row Based Calculations The row based calculations feature of Insight
® allows you to generate new rows in
your inquiry that are derived from existing rows or from existing rows and columns.
Row based calculations are based on the functionality defined in the following areas:
Hierarchy based calculations
Hierarchy based calculations with a column reference
Column based calculations with a hierarchy reference
Conditional row based calculations
Calculation Precedence
Hierarchy Based Calculations
This feature allows you to utilize existing hierarchy rows within a calculation. This new calculation displays as a new row that will sit within your hierarchy and appear in your finished report.
For this example we will utilize the previous Revenue Analysis Hierarchy that had Business Unit added as its second dimension. The hierarchy structure is shown in Figure 15-91:
Figure 15-91: Revenue Analysis Hierarchy Structure
Launch the Edit Hierarchy dialog, „right-click‟ on the Product Revenue Node and select New Entry.

InsightSoftware.com User Guide
Page 354 of 429
Within this dialog change the type to be Calculated Entry. Enter into the Description field „Product A %‟ as shown in Figure 15-92:
Figure 15-92: Calculated Entry Dialog
Now „click‟ on the Define button. This will launch the Edit Calculation dialog as shown in Figure 15-93:
Figure 15-93: Adding Elements to the Calculation
The functionality in this screen mirrors the normal functionality included in the Using Calculations section. The only functionality not present is Execute Calculations for totals (this is due to the way that totals often duplicate the parent records in a hierarchical structure).
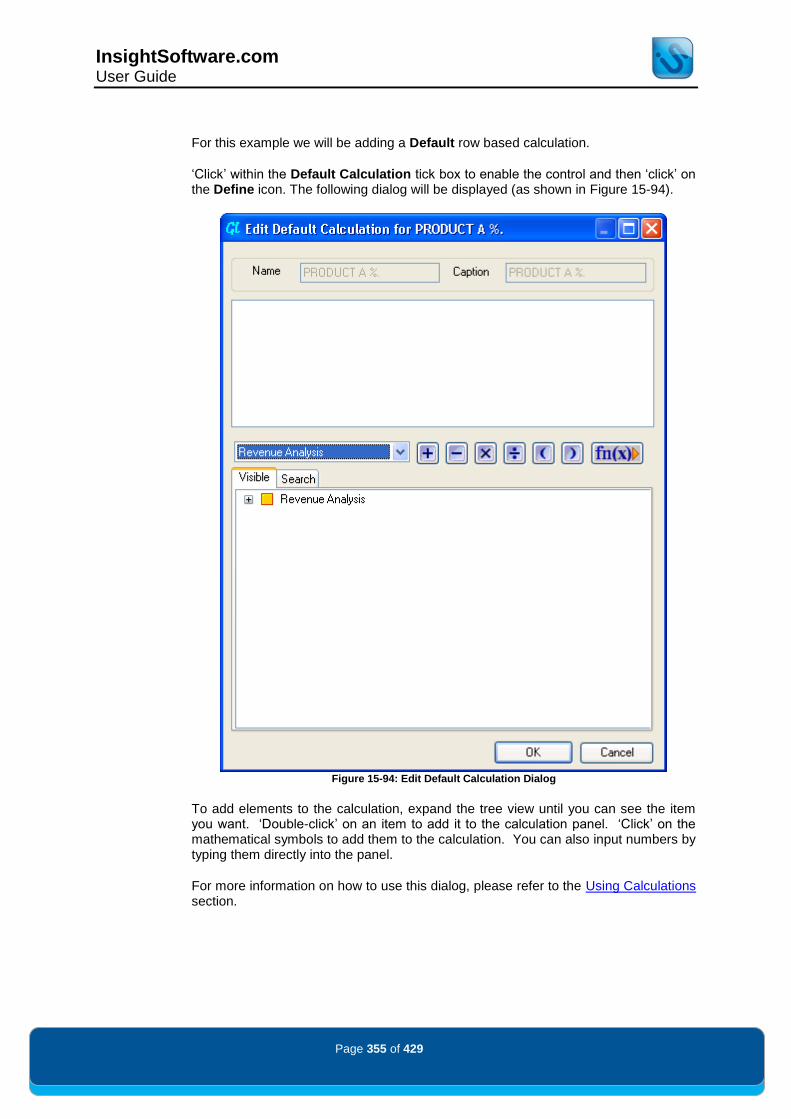
InsightSoftware.com User Guide
Page 355 of 429
For this example we will be adding a Default row based calculation.
„Click‟ within the Default Calculation tick box to enable the control and then „click‟ on the Define icon. The following dialog will be displayed (as shown in Figure 15-94).
Figure 15-94: Edit Default Calculation Dialog
To add elements to the calculation, expand the tree view until you can see the item you want. „Double-click‟ on an item to add it to the calculation panel. „Click‟ on the mathematical symbols to add them to the calculation. You can also input numbers by typing them directly into the panel.
For more information on how to use this dialog, please refer to the Using Calculations section.

InsightSoftware.com User Guide
Page 356 of 429
For this example we will add the following calculation, as shown in Figure 15-95: ({Revenue Analysis.5002.*} / {Revenue Analysis.Product Revenue.}) *100
Figure 15-95: Percentage Calculation
„Click‟ on OK when you are finished creating your calculation and then „click‟ OK on the following dialog.

InsightSoftware.com User Guide
Page 357 of 429
The new calculation will now appear in the tree view in the Hierarchy panel of the Edit Hierarchy dialog as shown below in Figure 15-96:
Figure 15-96: New Hierarchy Calculation being added
Add three more calculations:
1. Description: Product B % Calculation: ({Revenue Analysis.5003.*} / {Revenue Analysis.Product Revenue.}) *100
2. Description: Product C % Calculation: ( {Revenue Analysis.5004.*} / {Revenue Analysis.Product Revenue.} ) * 100
3. Description: Percentage Reconciliation
Calculation: {Revenue Analysis.Product A %.} + {Revenue Analysis.Product B %.} + {Revenue Analysis.Product C %.}
If necessary, use the blue up and down arrow buttons and the hierarchy buttons in the bottom right-hand corner of the Edit Hierarchy dialog to position the calculations.
Figure 15-97: Finalized Hierarchy Structure
„Click‟ on OK in the Hierarchies dialog.

InsightSoftware.com User Guide
Page 358 of 429
Figure 15-98 shows the results after running the inquiry. The new calculations are included in the result set.
Figure 15-98: Calculated Nodes Displayed Within Result Set
NB THE PERCENTAGE RECONCILIATION NODE WAS ADDED TO VERIFY THE CALCULATIONS ADD UP
TO A TOTAL OF 100%.
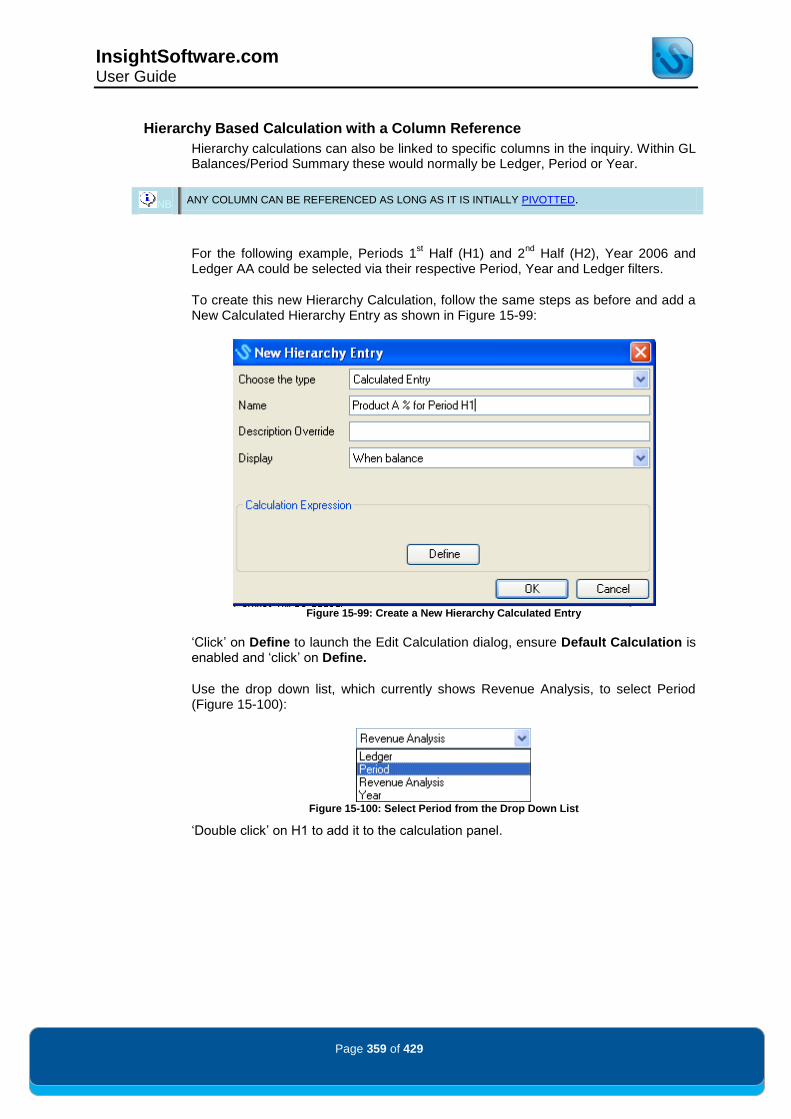
InsightSoftware.com User Guide
Page 359 of 429
Hierarchy Based Calculation with a Column Reference
Hierarchy calculations can also be linked to specific columns in the inquiry. Within GL Balances/Period Summary these would normally be Ledger, Period or Year.
NB ANY COLUMN CAN BE REFERENCED AS LONG AS IT IS INTIALLY PIVOTTED.
For the following example, Periods 1st Half (H1) and 2
nd Half (H2), Year 2006 and
Ledger AA could be selected via their respective Period, Year and Ledger filters.
To create this new Hierarchy Calculation, follow the same steps as before and add a New Calculated Hierarchy Entry as shown in Figure 15-99:
Figure 15-99: Create a New Hierarchy Calculated Entry
„Click‟ on Define to launch the Edit Calculation dialog, ensure Default Calculation is enabled and „click‟ on Define.
Use the drop down list, which currently shows Revenue Analysis, to select Period (Figure 15-100):
Figure 15-100: Select Period from the Drop Down List
„Double click‟ on H1 to add it to the calculation panel.
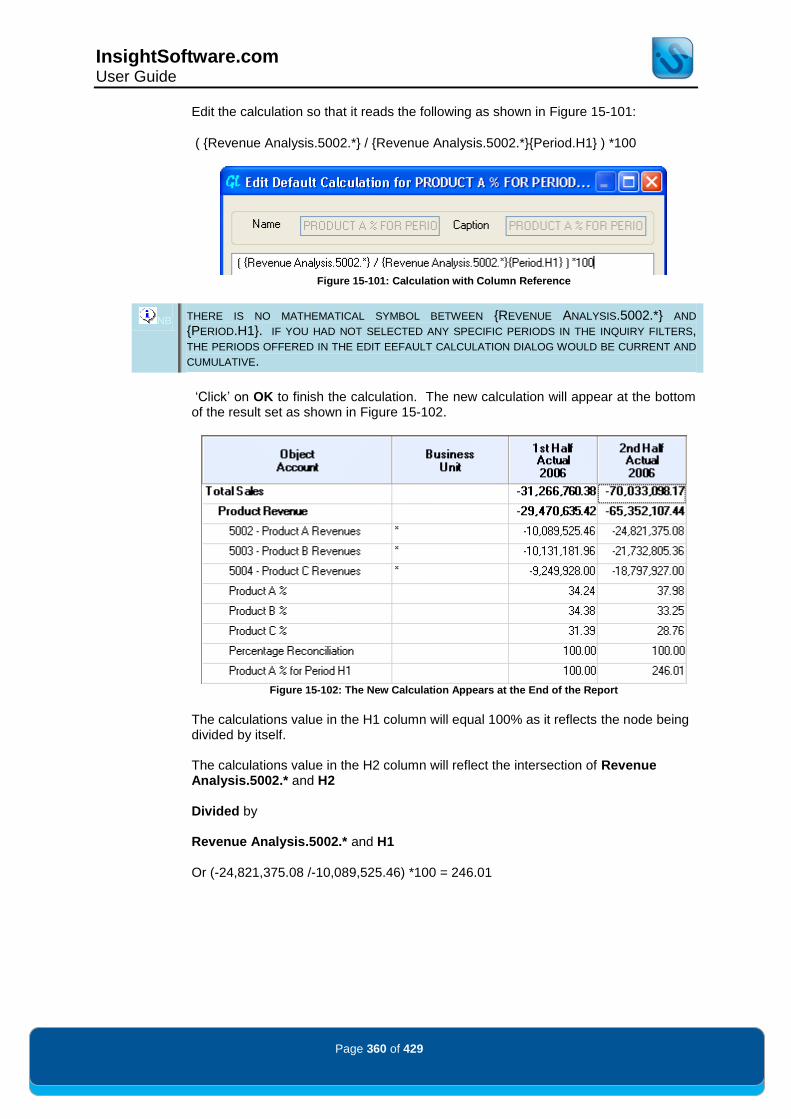
InsightSoftware.com User Guide
Page 360 of 429
Edit the calculation so that it reads the following as shown in Figure 15-101:
( {Revenue Analysis.5002.*} / {Revenue Analysis.5002.*}{Period.H1} ) *100
Figure 15-101: Calculation with Column Reference
NB THERE IS NO MATHEMATICAL SYMBOL BETWEEN {REVENUE ANALYSIS.5002.*} AND
{PERIOD.H1}. IF YOU HAD NOT SELECTED ANY SPECIFIC PERIODS IN THE INQUIRY FILTERS, THE PERIODS OFFERED IN THE EDIT EEFAULT CALCULATION DIALOG WOULD BE CURRENT AND
CUMULATIVE.
„Click‟ on OK to finish the calculation. The new calculation will appear at the bottom of the result set as shown in Figure 15-102.
Figure 15-102: The New Calculation Appears at the End of the Report
The calculations value in the H1 column will equal 100% as it reflects the node being divided by itself. The calculations value in the H2 column will reflect the intersection of Revenue Analysis.5002.* and H2 Divided by Revenue Analysis.5002.* and H1 Or (-24,821,375.08 /-10,089,525.46) *100 = 246.01

InsightSoftware.com User Guide
Page 361 of 429
Column Based Calculation with a Hierarchy Reference
You can now also create a column calculation that refers to rows within a hierarchy. This is useful for business examples such as „% of Sales‟.
Make sure that the applicable hierarchy is selected in the Grid Hierarchy drop down list. Select Calculations from the Inquiry Objects Ribbon Tab, and this will launch the Calculations dialog as shown in Figure 15-103.
Figure 15-103: The Calculations Dialog
„Click‟ on New. The Define New Calculation dialog will open. Enter a Name, a Caption and optionally, a Category (Figure 15-104).
Figure 15-104: Enter a Name, Caption and Category
„Click‟ on Define to open the Edit Default Calculation dialog. „Click‟ on the drop down control and select the Hierarchy as shown in Figure 15-105.
Figure 15-105: Grid Hierarchy included in Drop Down

InsightSoftware.com User Guide
Page 362 of 429
Edit the calculation as shown in Figure 15-106:
Figure 15-106: Column Based Calculation with Hierarchy Reference
({Period.H1} / {Period.H1}{Revenue Analysis.Total Sales.})*100
„Click‟ on OK to return back to the Define New Calculation dialog. „Click‟ on OK again to return back to the Calculations dialog.
In the Calculations dialog, tick the checkbox next to your new calculation, 1HALFYEAR, and then „click‟ on OK.
Run the inquiry, and you will see an additional column with the calculation caption of „% of Total H1‟.
Figure 15-107: Percentage Calculation Added as a New Column
The new column will display every H1 Period value divided by the Total Sales for the 1
st Half of 2006.

InsightSoftware.com User Guide
Page 363 of 429
Conditional Row Based Calculations
Conditional row based calculations provide another layer of functionality to your hierarchies by applying conditions to your calculations. For this example we will be using a modified version of the previously created Revenue Analysis Hierarchy, as shown in Figure 15-108. The inquiry has been converted to use a Cumulative 12 Period. Also a Budgeting Ledger has been added to the result set. We will be adding units to the result set, which will be taken from the AU or BU Ledger depending on the associated ledger in the inquiry.
Figure 15-108: Revenue Analysis Hierarchy with Budget Ledger
To add a conditional row based calculation, open up the Hierarchy dialog and edit the Hierarchy. „Right-click‟ in the right panel of the Edit Hierarchy dialog and select New Entry. Modify the Choose the type drop down so that Calculated Entry is displayed as shown in Figure 15-109.
Figure 15-109: Adding a Calculated Entry

InsightSoftware.com User Guide
Page 364 of 429
The Edit Calculation dialog shown in Figure 15-110 will be displayed. Conditional row based calculations can include the Default Calculation, however for this example we will be using Conditional Overrides.
Figure 15-110: Standard Edit Calculation Dialog
Disable the Default calculation and enable the Conditional Overrides tick box. „Click‟ on New to open the Define Calculation Condition dialog shown in Figure 15-111.
Figure 15-111: Define Calculation Condition

InsightSoftware.com User Guide
Page 365 of 429
For the condition, we will specify that the Ledger will equal AA (Figure 15-112):
Figure 15-112: Calculation Condition Defined
NB FOR MORE INFORMATION ON CREATING A CONDITION FOR YOUR CALCULATION, PLEASE REFER
TO THE CONDITIONAL CALCULATIONS SECTION.
„Click‟ OK to proceed to the Calculation Dialog. Select Ledger from the drop down control. The specific ledger we require is not included within the previously defined filters, so „click‟ on the Search tab and find the AU Ledger as shown in Figure 15-113.
Figure 15-113: Calculation Search Functionality

InsightSoftware.com User Guide
Page 366 of 429
„Double-click‟ on the AU Ledger and add the Product Revenue node to the calculation as shown in Figure 15-114. The combination of the two will mean that the calculation will display the total for all units associated with Product Revenue.
Figure 15-114: Product Revenue Units Calculation
„Click‟ OK to return to the main Calculation dialog.
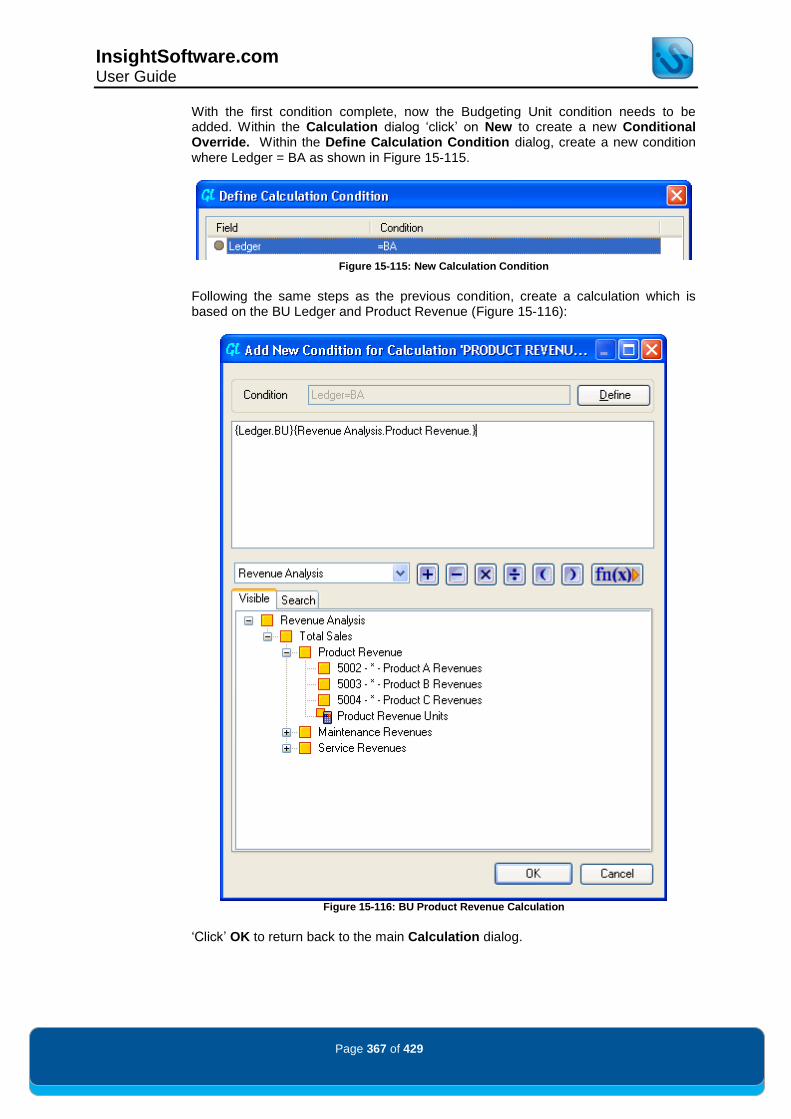
InsightSoftware.com User Guide
Page 367 of 429
With the first condition complete, now the Budgeting Unit condition needs to be added. Within the Calculation dialog „click‟ on New to create a new Conditional Override. Within the Define Calculation Condition dialog, create a new condition where Ledger = BA as shown in Figure 15-115.
Figure 15-115: New Calculation Condition
Following the same steps as the previous condition, create a calculation which is based on the BU Ledger and Product Revenue (Figure 15-116):
Figure 15-116: BU Product Revenue Calculation
„Click‟ OK to return back to the main Calculation dialog.
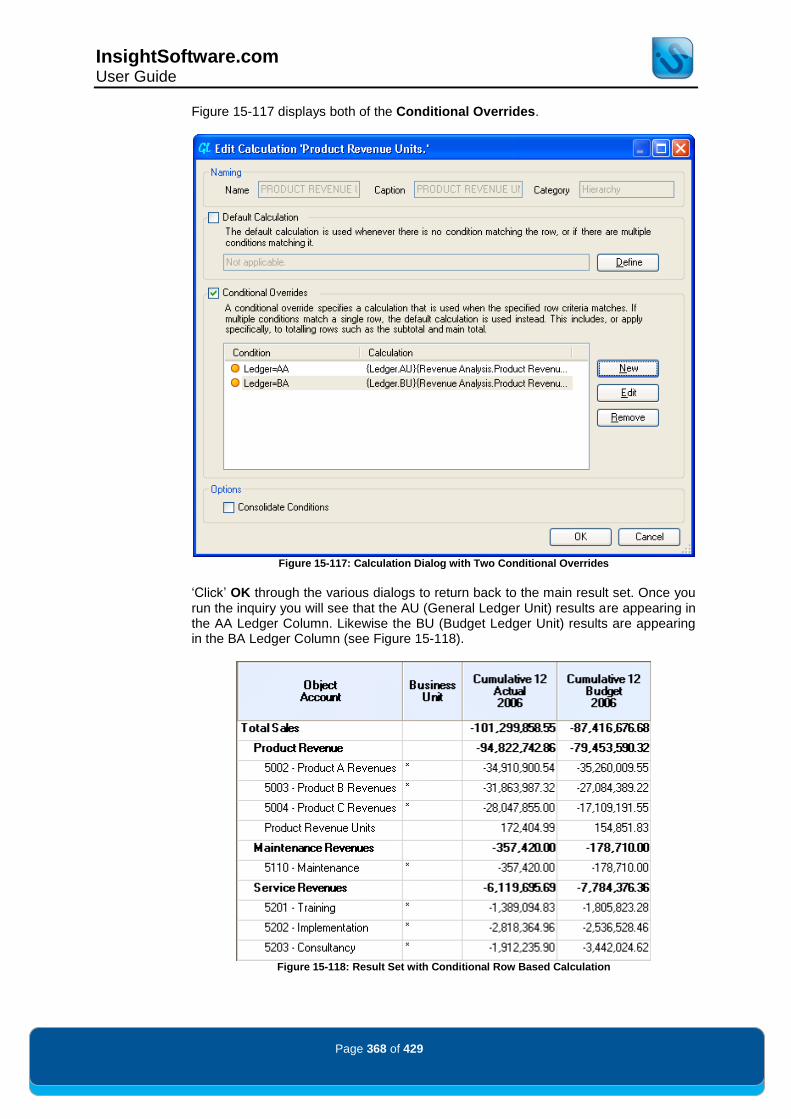
InsightSoftware.com User Guide
Page 368 of 429
Figure 15-117 displays both of the Conditional Overrides.
Figure 15-117: Calculation Dialog with Two Conditional Overrides
„Click‟ OK through the various dialogs to return back to the main result set. Once you run the inquiry you will see that the AU (General Ledger Unit) results are appearing in the AA Ledger Column. Likewise the BU (Budget Ledger Unit) results are appearing in the BA Ledger Column (see Figure 15-118).
Figure 15-118: Result Set with Conditional Row Based Calculation

InsightSoftware.com User Guide
Page 369 of 429
Calculation Precedence As Insight
® gives you the option to define calculation intersections, it is important to
specify in which order calculations should be executed. The Calculation Precedence feature allows you to control the sequence of calculations.
Select the Calculations icon from the Inquiry Objects Ribbon menu. In the Calculations dialog, „click‟ on Calculation Precedence and this will open the dialog shown in Figure 15-119.
Figure 15-119: The Calculation Precedence Dialog
The default settings for calculation precedence ensure that calculated hierarchy items are run before column calculations. If you want to override this setting, uncheck the Automatic checkbox and use the blue up and down arrows to rearrange your sequence. Then „click‟ on OK to execute the sequence.

InsightSoftware.com User Guide
Page 370 of 429
Every Insight
® inquiry is based on selections in various filters. These selections relate
directly to items from the database. Upon selecting them, the inquiry changes to reflect these new selections.
You can use Selectors to keep report settings from changing when you make changes to filters when running a report. This means that column order, sizing, hiding and formatting can stay the same. Selectors can also be used within calculations.
Selectors also enable you to specify the current period and year to suit your inquiry rather than relying on the JD Edwards™ system settings.
A selector is an item which, similar to calculations, can be created on any report. They contain a list of available values which map directly to another item. One of these available values is the „current‟ value.
Selector functionality is assigned to users through the Administration Capabilities tool. Check with your Insight
® Administrator if you do not have access to Selectors.
Configuration There are two processes related to the Selector functionality:
Allow users to Set up new selectors and modify existing ones
Allow users to Choose which current value will be presented for an existing selector
The first process allows you to create, edit, remove and set the current value of any selector on the report, whereas the second one is for selecting the current value only. By default, both capabilities are enabled for all users.

InsightSoftware.com User Guide
Page 371 of 429
Defining a New Selector The Selectors dialog is found within the Inquiry Objects Ribbon Tab.
The functionality has two dialogs, Choose Selectors and Setup Selectors, both of which are accessible by clicking on the downwards triangle to the right of the icon. If you do not click on this downwards triangle, the default is to open the Choose Selectors dialog.
The Setup Selectors dialog is shown in Figure 16-1:
Figure 16-1: Setup Selectors Dialog
This screen displays all existing selectors for the inquiry.
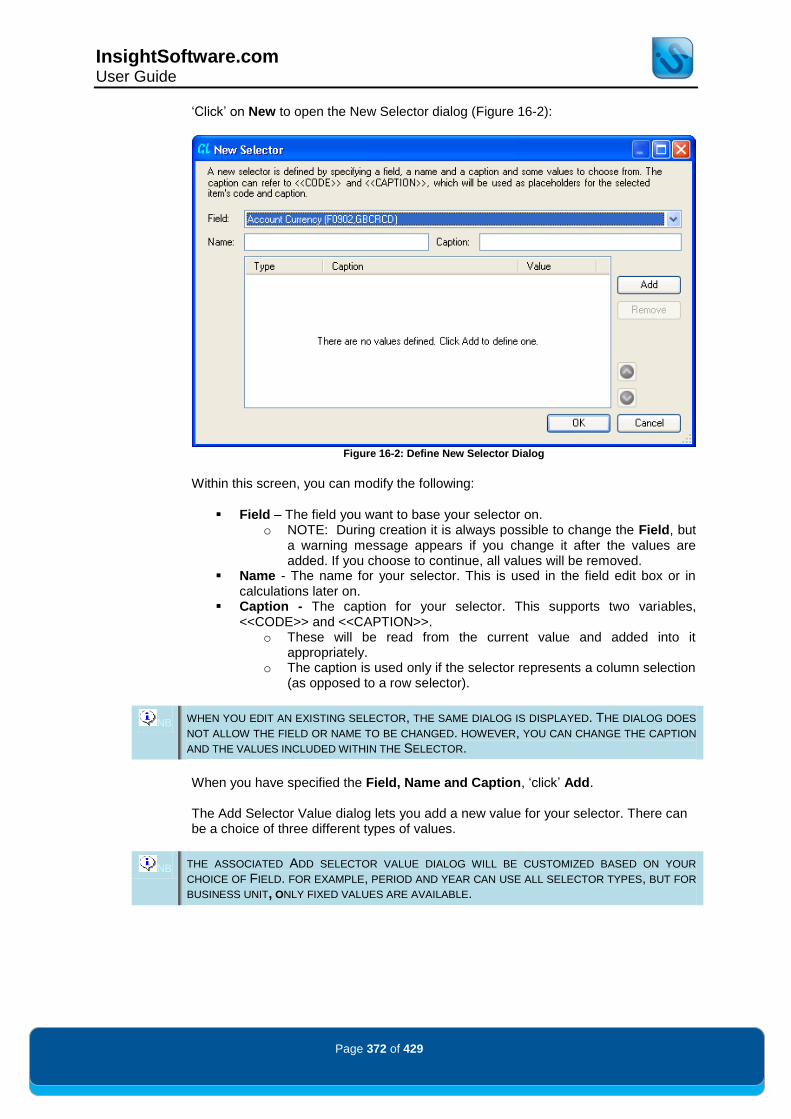
InsightSoftware.com User Guide
Page 372 of 429
„Click‟ on New to open the New Selector dialog (Figure 16-2):
Figure 16-2: Define New Selector Dialog
Within this screen, you can modify the following:
Field – The field you want to base your selector on. o NOTE: During creation it is always possible to change the Field, but
a warning message appears if you change it after the values are added. If you choose to continue, all values will be removed.
Name - The name for your selector. This is used in the field edit box or in calculations later on.
Caption - The caption for your selector. This supports two variables, <<CODE>> and <<CAPTION>>.
o These will be read from the current value and added into it appropriately.
o The caption is used only if the selector represents a column selection (as opposed to a row selector).
NB WHEN YOU EDIT AN EXISTING SELECTOR, THE SAME DIALOG IS DISPLAYED. THE DIALOG DOES
NOT ALLOW THE FIELD OR NAME TO BE CHANGED. HOWEVER, YOU CAN CHANGE THE CAPTION
AND THE VALUES INCLUDED WITHIN THE SELECTOR.
When you have specified the Field, Name and Caption, „click‟ Add. The Add Selector Value dialog lets you add a new value for your selector. There can be a choice of three different types of values.
NB THE ASSOCIATED ADD SELECTOR VALUE DIALOG WILL BE CUSTOMIZED BASED ON YOUR
CHOICE OF FIELD. FOR EXAMPLE, PERIOD AND YEAR CAN USE ALL SELECTOR TYPES, BUT FOR
BUSINESS UNIT, ONLY FIXED VALUES ARE AVAILABLE.

InsightSoftware.com User Guide
Page 373 of 429
Fixed Value
A Fixed Value, as shown in Figure 16-3, provides a replacement for selecting the value directly. The dialog allows values to be entered manually or through an associated Query Assist. Both methods allow multiple values to be selected.
The Item(s) field does not support calculated items, ranges, wildcards and single item with attributes such as < (less than), <= (less than or equal), > (greater than), >= (greater than or equal) or <> (not equal).
Figure 16-3: Fixed Value Selector
In the example for Fixed Values, we will use Business Unit. Figure 16-4 shows the applicable business units being selected.
Figure 16-4: Business Units Selections
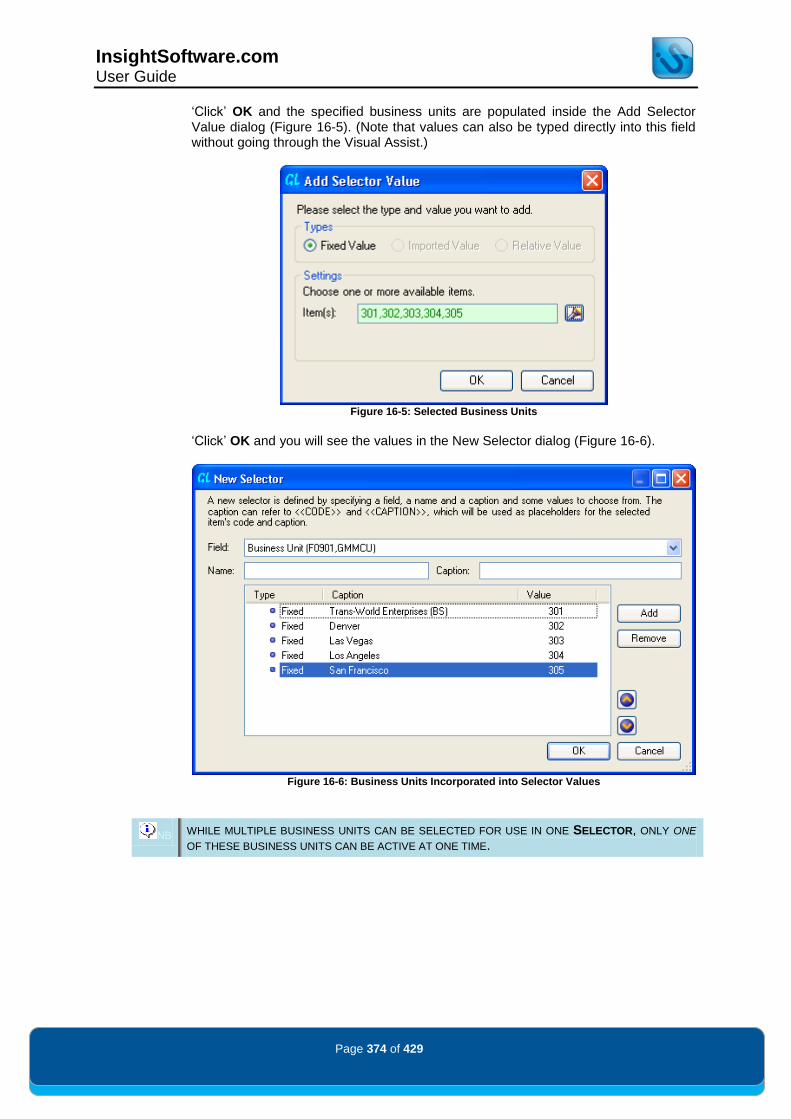
InsightSoftware.com User Guide
Page 374 of 429
„Click‟ OK and the specified business units are populated inside the Add Selector Value dialog (Figure 16-5). (Note that values can also be typed directly into this field without going through the Visual Assist.)
Figure 16-5: Selected Business Units
„Click‟ OK and you will see the values in the New Selector dialog (Figure 16-6).
Figure 16-6: Business Units Incorporated into Selector Values
NB WHILE MULTIPLE BUSINESS UNITS CAN BE SELECTED FOR USE IN ONE SELECTOR, ONLY ONE
OF THESE BUSINESS UNITS CAN BE ACTIVE AT ONE TIME.

InsightSoftware.com User Guide
Page 375 of 429
Imported Value
Imported Value is a type of selector that draws data directly from the JD Edwards™ ERP system. The Imported Value functionality can be used with the period and year fields. In the example below shown in Figure 16-7, we will import Period.
Figure 16-7: Imported Value Selector
NB WHENEVER YOU LOAD A REPORT CONTAINING AN IMPORTED VALUE TYPE SELECTOR, THE
VALUES ARE REFRESHED FROM THE JD EDWARDS™ SYSTEM.
For more information as to how these periods and years are derived, please refer to Advanced Selector Logic: Imported Values.

InsightSoftware.com User Guide
Page 376 of 429
Relative Value
Relative Value is a type of selector that allows for linking.
A Relative Value, available for use with periods and years, requires a type and another selector in which to relate. When the related selector‟s current value is changed, so does the associated selector.
Relative Values are only available if there are other selectors already applied to the value. If you have just created the target selector, remember to use the Apply button on the main Selector dialog before creating a relative value.
Relative Value selectors already exist in Insight®
and are commonly used in most reports.
For example, the period filter value CUMULATIVE is a Relative Value type selector. When the CURRENT Value (which is an Imported Value) is updated in the JD Edwards™ system, the CUMULATIVE value will update automatically as well.
If you were to „edit‟ the CUMULATIVE selector you would see if comprises of a Relation of Cumulative Period and a Selector of Current as shown in Figure 16-8.
Figure 16-8: Relative Value Selector
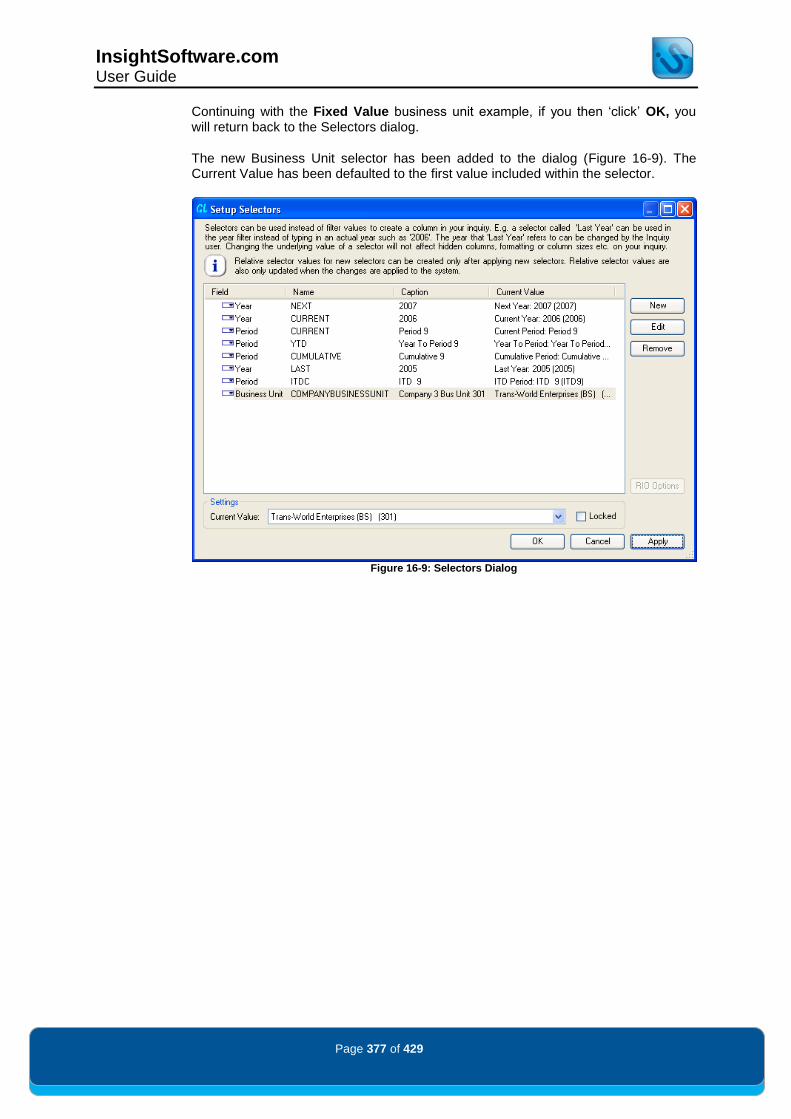
InsightSoftware.com User Guide
Page 377 of 429
Continuing with the Fixed Value business unit example, if you then „click‟ OK, you will return back to the Selectors dialog.
The new Business Unit selector has been added to the dialog (Figure 16-9). The Current Value has been defaulted to the first value included within the selector.
Figure 16-9: Selectors Dialog

InsightSoftware.com User Guide
Page 378 of 429
Changing the Selector’s Current Value
A selector‟s current value can be modified in two ways. If you have access to the Selectors Setup dialog, you can edit the Current Value directly. This function is shown at the bottom of the Selector screen (see Figure 16-10).
Figure 16-10: Current Value Drop Down In Setup Selectors Dialog
Alternatively, the current value can be changed by opening the Choose Selectors dialog, accessed via the Selectors icon in the Inquiry Objects Ribbon Tab. The Choose Selector Value dialog (Figure 16-11) only displays selectors that have multiple values.
Figure 16-11: Choose Selector Value Dialog
Change the current value by selecting a new one from the drop down list and then „click‟ OK.

InsightSoftware.com User Guide
Page 379 of 429
Using Selectors in Filters To use selectors within a filter, you have two options; you can either type the name of the selector straight into the filter or use the filter‟s Query Assist. Within the Query Assist, you will notice that selectors are now contained under their own Selectors tab.
The following example (Figure 16-12) shows the standard period selectors that are provided with GL Balances (or Period Summary).
Figure 16-12: Query Assist with New Selector Tab
Once a selector is added, normal filtering behavior on the selector‟s current value will take place.

InsightSoftware.com User Guide
Page 380 of 429
Using Selectors in Pivoted Columns The system is not restricted to just selectors for filters. When their associated field is pivoted, selectors can provide a way of changing columns without affecting formatting and other display settings.
The following example uses the previously defined Fixed Type selector for Business Unit. The Business Unit has been pivoted to be a column through Pivot Inquiry, COMPANYBUSINESSUNIT has been added to the business unit filter and basic formatting has been applied to each column.
At this point the current value is business unit 301. This is being shown in the column headings as one of the four dimensions, as shown in Figure 16-13.
Figure 16-13: Pivoted Business Unit with Active Selector

InsightSoftware.com User Guide
Page 381 of 429
However, if the selector is then changed to be Business Unit 302 (Figure 16-14), the associated column dimensions also are modified to reflect the change in the selector‟s current value and now show Business Unit 302 (Figure 16-15).
Figure 16-14: Changing Current Value of Selector to Business Unit 302
But more importantly, the formatting has not been removed. The formatting is associated with the selector and not the actual business unit.
This is important as it allows display settings like formatting to be retained when key values of the report are modified.
Figure 16-15: Change of Selector and Retained Formatting

InsightSoftware.com User Guide
Page 382 of 429
Using Selectors for Security Selectors provide a means of limiting inquiry settings and providing security.
This can be done through the use of previously introduced Fixed Value type selectors. With a Fixed Value type selector, you are limited to choosing from a set series of business units. Combining the selector and the Console Preview Mode functionality provides control over what data is displayed.
For this example, „click‟ on the Console Ribbon Tab and select the Console Preview icon. Within the list of available Filters, „click‟ on the plus next to Selectors and drag and drop your selector onto the Workspace Area, the right pane of the screen. The end result is shown in Figure 16-16.
Figure 16-16: Console Filter Layout Dialog
„Click‟ on OK to finalize your changes to the inquiry.

InsightSoftware.com User Guide
Page 383 of 429
Figure 16-17 displays the way that Console users will only have the ability to change the business unit by the provided Selector control box. Additionally they will be limited to the Business Units chosen within the Fixed Value type selector.
Figure 16-17: Console User Viewing Selector Inquiry
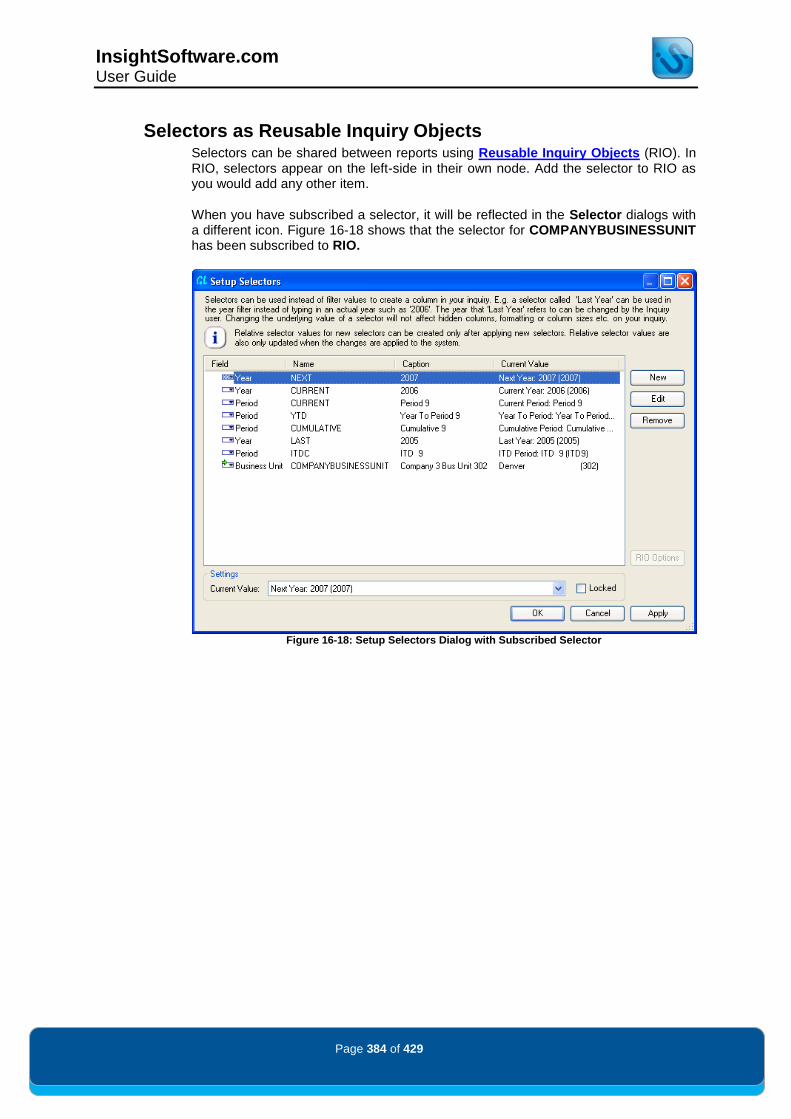
InsightSoftware.com User Guide
Page 384 of 429
Selectors as Reusable Inquiry Objects Selectors can be shared between reports using Reusable Inquiry Objects (RIO). In RIO, selectors appear on the left-side in their own node. Add the selector to RIO as you would add any other item.
When you have subscribed a selector, it will be reflected in the Selector dialogs with a different icon. Figure 16-18 shows that the selector for COMPANYBUSINESSUNIT has been subscribed to RIO.
Figure 16-18: Setup Selectors Dialog with Subscribed Selector

InsightSoftware.com User Guide
Page 385 of 429
Selector RIO Subscription Options Within the main Setup Selectors dialog), there is an option called RIO Options. The Selector RIO Options dialog is shown in Figure 16-19.
Figure 16-19: Selector RIO Options
Each individual selector can be given one of the following settings when subscribed to RIO:
Available Values and Current Value (default value for all selectors)
Available Values Only
These settings affect what will be stored within Reusable Inquiry Objects. If Available Values and Current Value is set, when one inquiry has additional values added to the selector and the current value changes, all other inquiries that are subscribed to the selector will have these properties modified. If Available Values Only is specified, only the additional values will be populated to the other inquiries. The current value will not be updated across all inquiries (useful when you want to see a different value but not affect other users).
These settings affect the behavior of the associated Selector dialogs and selector usage.

InsightSoftware.com User Guide
Page 386 of 429
Choose Selector Changes
The Choose Selector Value dialog is affected by these changes. When the default setting of Available Values and Current Value is applied, the dialog does not allow changes to any selector that is subscribed from the library.
This is due to the way it could be being used by other inquiries. An icon shows that it is subscribed and there is no drop down for the values. Instead it only displays the current value for the selector (Figure 16-20). Note the icon for the selector is displayed with a green arrow to indicate the setting.
Figure 16-20: Available Values and Current Value Setting Applied
If, however, the Available Values Only setting is applied, the dialog will change to display a drop down box (see Figure 16-21), allowing the modification of the current value. Note the icon for the selector is displayed with a yellow arrow to indicate the setting.
Figure 16-21: Available Values Only Setting Applied

InsightSoftware.com User Guide
Page 387 of 429
Effect on Linked Inquiries
These settings also have an affect on drilling to a linked inquiry. The following example uses the previous COMPANYBUSINESSUNIT selector. Source and target inquiries have been created, and both are subscribed to this selector. In this scenario, the user wishes to change the Business Unit in the selector from 302 to 303. When the setting Available Values and Current Value is set, if you wish to change the current value, you will receive the following prompt shown in Figure 16-22:
Figure 16-22: Unsubscribe Dialog Prompted by Changing of the Current Value
The options include:
Cancel the changes: By selecting this option, any changes that affect a subscribed selector will be completely reversed
Unsubscribe the object from the Reusable Inquiry Objects and update this inquiry’s version only: Unsubscribe the selector and continue to work with the local copy
Keep the Subscription and update the object in the Reusable Inquiry Objects with your changes: Keep the subscription and submit your changes directly to the RIO
If the change to the current value is only temporary, you may not wish to affect the other inquiries by using the third option of Keep the Subscription and update the object in the Reusable Inquiry Objects with your changes. Instead, the second option of Unsubscribe the object from the Reusable Inquiry Objects and update this inquiry’s version only is more applicable.
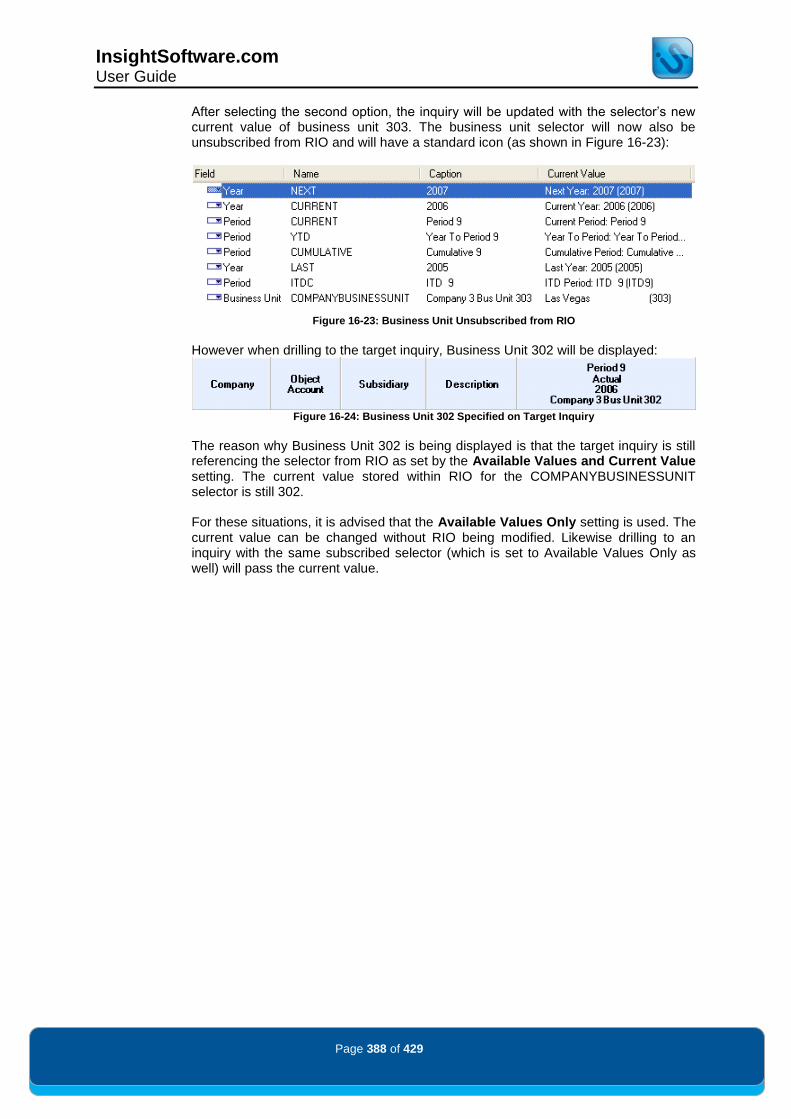
InsightSoftware.com User Guide
Page 388 of 429
After selecting the second option, the inquiry will be updated with the selector‟s new current value of business unit 303. The business unit selector will now also be unsubscribed from RIO and will have a standard icon (as shown in Figure 16-23):
Figure 16-23: Business Unit Unsubscribed from RIO
However when drilling to the target inquiry, Business Unit 302 will be displayed:
Figure 16-24: Business Unit 302 Specified on Target Inquiry
The reason why Business Unit 302 is being displayed is that the target inquiry is still referencing the selector from RIO as set by the Available Values and Current Value setting. The current value stored within RIO for the COMPANYBUSINESSUNIT selector is still 302. For these situations, it is advised that the Available Values Only setting is used. The current value can be changed without RIO being modified. Likewise drilling to an inquiry with the same subscribed selector (which is set to Available Values Only as well) will pass the current value.
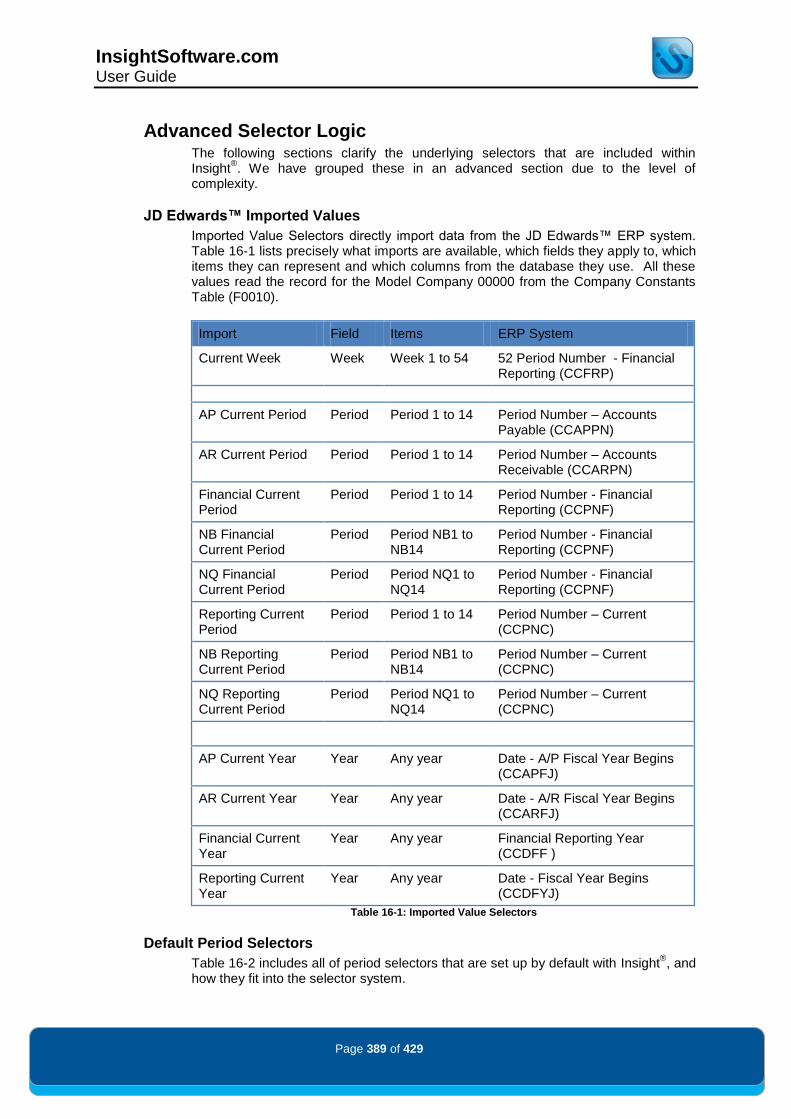
InsightSoftware.com User Guide
Page 389 of 429
Advanced Selector Logic The following sections clarify the underlying selectors that are included within Insight
®. We have grouped these in an advanced section due to the level of
complexity.
JD Edwards™ Imported Values
Imported Value Selectors directly import data from the JD Edwards™ ERP system. Table 16-1 lists precisely what imports are available, which fields they apply to, which items they can represent and which columns from the database they use. All these values read the record for the Model Company 00000 from the Company Constants Table (F0010).
Import Field Items ERP System
Current Week Week Week 1 to 54 52 Period Number - Financial Reporting (CCFRP)
AP Current Period Period Period 1 to 14 Period Number – Accounts Payable (CCAPPN)
AR Current Period Period Period 1 to 14 Period Number – Accounts Receivable (CCARPN)
Financial Current Period
Period Period 1 to 14 Period Number - Financial Reporting (CCPNF)
NB Financial Current Period
Period Period NB1 to NB14
Period Number - Financial Reporting (CCPNF)
NQ Financial Current Period
Period Period NQ1 to NQ14
Period Number - Financial Reporting (CCPNF)
Reporting Current Period
Period Period 1 to 14 Period Number – Current (CCPNC)
NB Reporting Current Period
Period Period NB1 to NB14
Period Number – Current (CCPNC)
NQ Reporting Current Period
Period Period NQ1 to NQ14
Period Number – Current (CCPNC)
AP Current Year Year Any year Date - A/P Fiscal Year Begins (CCAPFJ)
AR Current Year Year Any year Date - A/R Fiscal Year Begins (CCARFJ)
Financial Current Year
Year Any year Financial Reporting Year (CCDFF )
Reporting Current Year
Year Any year Date - Fiscal Year Begins (CCDFYJ)
Table 16-1: Imported Value Selectors
Default Period Selectors
Table 16-2 includes all of period selectors that are set up by default with Insight®, and
how they fit into the selector system.
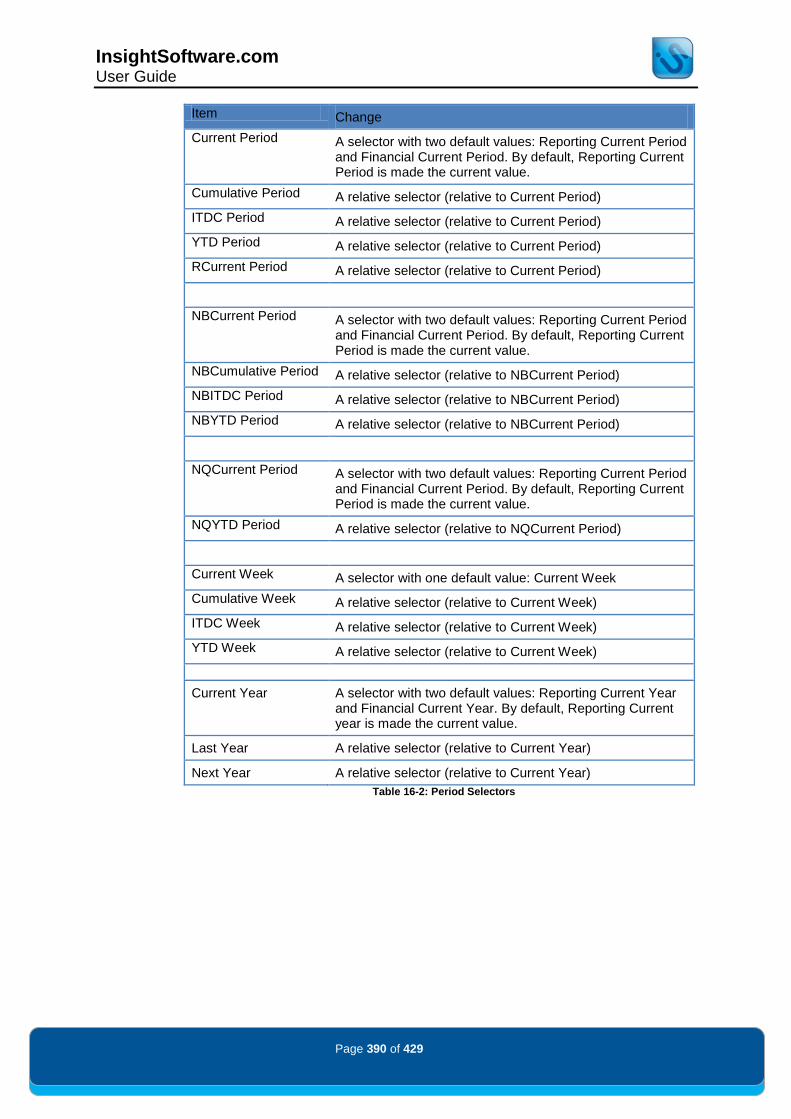
InsightSoftware.com User Guide
Page 390 of 429
Item Change
Current Period A selector with two default values: Reporting Current Period and Financial Current Period. By default, Reporting Current Period is made the current value.
Cumulative Period A relative selector (relative to Current Period)
ITDC Period A relative selector (relative to Current Period)
YTD Period A relative selector (relative to Current Period)
RCurrent Period A relative selector (relative to Current Period)
NBCurrent Period A selector with two default values: Reporting Current Period and Financial Current Period. By default, Reporting Current Period is made the current value.
NBCumulative Period A relative selector (relative to NBCurrent Period)
NBITDC Period A relative selector (relative to NBCurrent Period)
NBYTD Period A relative selector (relative to NBCurrent Period)
NQCurrent Period A selector with two default values: Reporting Current Period and Financial Current Period. By default, Reporting Current Period is made the current value.
NQYTD Period A relative selector (relative to NQCurrent Period)
Current Week A selector with one default value: Current Week
Cumulative Week A relative selector (relative to Current Week)
ITDC Week A relative selector (relative to Current Week)
YTD Week A relative selector (relative to Current Week)
Current Year A selector with two default values: Reporting Current Year and Financial Current Year. By default, Reporting Current year is made the current value.
Last Year A relative selector (relative to Current Year)
Next Year A relative selector (relative to Current Year)
Table 16-2: Period Selectors
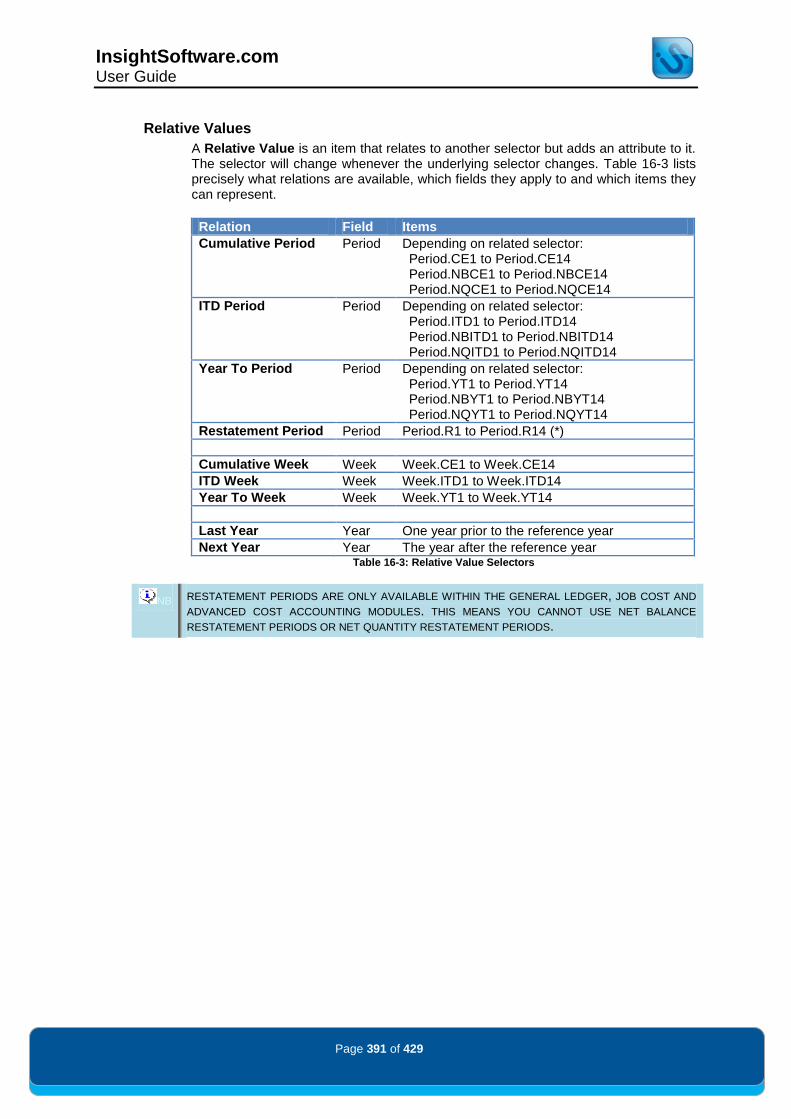
InsightSoftware.com User Guide
Page 391 of 429
Relative Values
A Relative Value is an item that relates to another selector but adds an attribute to it. The selector will change whenever the underlying selector changes. Table 16-3 lists precisely what relations are available, which fields they apply to and which items they can represent.
Relation Field Items
Cumulative Period Period Depending on related selector: Period.CE1 to Period.CE14 Period.NBCE1 to Period.NBCE14 Period.NQCE1 to Period.NQCE14
ITD Period Period Depending on related selector: Period.ITD1 to Period.ITD14 Period.NBITD1 to Period.NBITD14 Period.NQITD1 to Period.NQITD14
Year To Period Period Depending on related selector: Period.YT1 to Period.YT14 Period.NBYT1 to Period.NBYT14 Period.NQYT1 to Period.NQYT14
Restatement Period Period Period.R1 to Period.R14 (*)
Cumulative Week Week Week.CE1 to Week.CE14
ITD Week Week Week.ITD1 to Week.ITD14
Year To Week Week Week.YT1 to Week.YT14
Last Year Year One year prior to the reference year
Next Year Year The year after the reference year Table 16-3: Relative Value Selectors
NB RESTATEMENT PERIODS ARE ONLY AVAILABLE WITHIN THE GENERAL LEDGER, JOB COST AND
ADVANCED COST ACCOUNTING MODULES. THIS MEANS YOU CANNOT USE NET BALANCE
RESTATEMENT PERIODS OR NET QUANTITY RESTATEMENT PERIODS.
InsightSoftware.com User Guide
Page 392 of 429
Reusable Inquiry Objects (RIO) is a Repository within Insight
® that allows you to
share a range of common components between inquiries:
Hierarchies
Calculations
Custom Columns
Formats
Time Series
Selectors
User Defined Captions
Inquiries can be „subscribed to‟ (or linked to) stored objects within Reusable Inquiry Objects. These objects can then be modified and all changes will be reflected the next time the inquiry is run.
This feature is designed to save you valuable time and make it easier for you to enhance your reports. For example, you might want to add a particular calculation to all of your inquiries. Rather than creating this calculation separately in each individual report, you can create it once, add it to RIO and it will be available to add to any other inquiry.
RIO objects can also be grouped into folders. The benefit of this is that if the folder is enabled, all of the contents of the folder are subscribed to in one easy step.
There are two levels of RIO – Global RIOs and Connection RIOs. Global RIOs objects are available for all connections, Connection RIOs are limited to that one connection.
NB THE ADVANCED RIO FUNCTIONALITY IS ONLY MADE AVAILABLE TO CONFIGURATORS/SUPER
USERS. SEE THE CONFIGURATOR/SUPER USER GUIDE FOR MORE DETAILS ON MODIFYING AND
ADDING OBJECTS TO RIO.
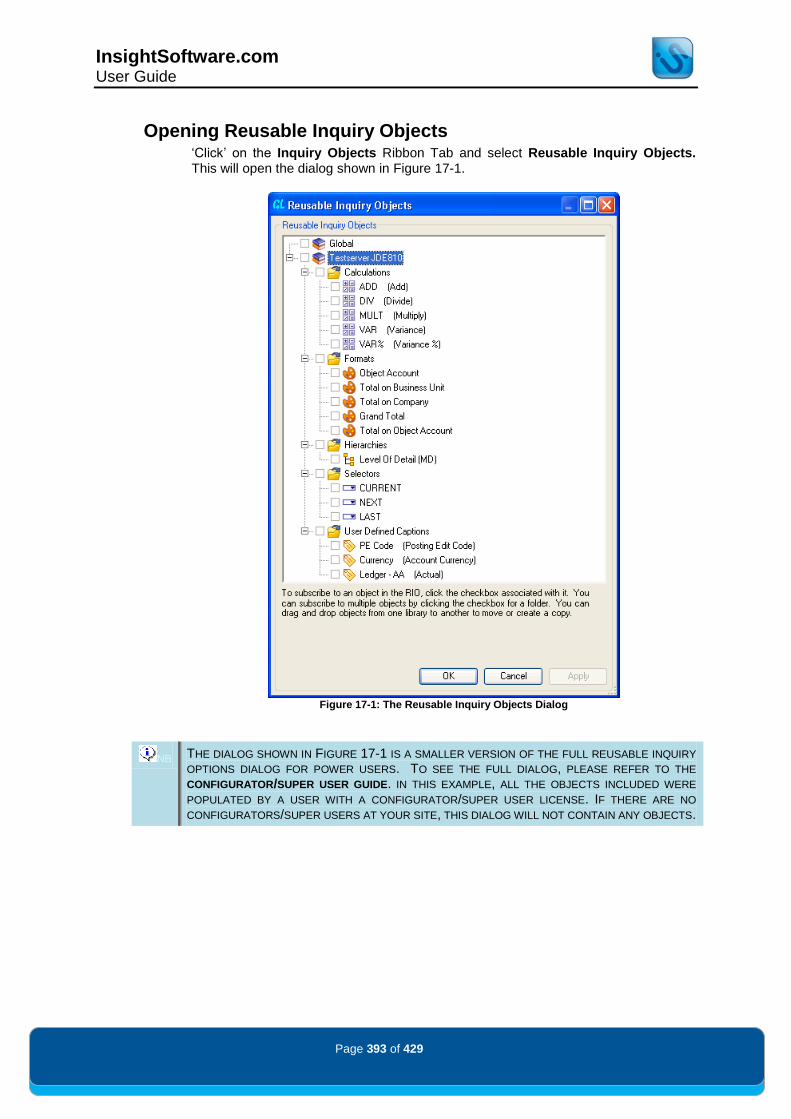
InsightSoftware.com User Guide
Page 393 of 429
Opening Reusable Inquiry Objects „Click‟ on the Inquiry Objects Ribbon Tab and select Reusable Inquiry Objects. This will open the dialog shown in Figure 17-1.
Figure 17-1: The Reusable Inquiry Objects Dialog
NB THE DIALOG SHOWN IN FIGURE 17-1 IS A SMALLER VERSION OF THE FULL REUSABLE INQUIRY
OPTIONS DIALOG FOR POWER USERS. TO SEE THE FULL DIALOG, PLEASE REFER TO THE
CONFIGURATOR/SUPER USER GUIDE. IN THIS EXAMPLE, ALL THE OBJECTS INCLUDED WERE
POPULATED BY A USER WITH A CONFIGURATOR/SUPER USER LICENSE. IF THERE ARE NO
CONFIGURATORS/SUPER USERS AT YOUR SITE, THIS DIALOG WILL NOT CONTAIN ANY OBJECTS.

InsightSoftware.com User Guide
Page 394 of 429
Subscribing For Power Users to be able to subscribe to objects in RIO, it is necessary for a Configurator/Super User to add in the necessary items.
To subscribe an inquiry to a Reusable Inquiry Objects object:
1. Open the inquiry. 2. Open Reusable Inquiry Objects. 3. Subscribe to the object by ticking its checkbox. 4. „Click‟ on OK.
5. Changes will be reflected the next time the inquiry is run.
Objects stored in Global RIOs will be available to all database connections. Objects stored in Connection RIOs will only be available for that particular connection.
RIO Precedence If an inquiry subscribes to both objects, the object in Connection RIOs will take precedence over the object in Global RIOs. This allows you to subscribe to a company standard at the global level but then override it with a connection level setting.

InsightSoftware.com User Guide
Page 395 of 429
The Currency Restatement module provides real time currency conversion of period amounts. This functionality allows multiple companies with different base currencies to be reconciled into one Restatement Exchange Rate.
This functionality is available for the following templates:
GL – Balances/Period Summary
JC – Balances/Period Summary
ACA – Balances/Advanced Cost Accounting
Working with Restatement Period Values When using the Period filter, you have the option to select not only the JD Edwards™ defined period values, but also Insight
® calculated values for Currency Restatement
purposes.
These appear on the Restatement tab within the Period Assist dialog as shown in Figure 18-1. Alternatively the period can be typed directly into the Period filter in the inquiry.
Figure 18-1: Period Assist Showing Currency Restatement Periods

InsightSoftware.com User Guide
Page 396 of 429
Figure 18-2: Restatement Period 1 Added to Result Set
Figure 18-2 shows Restatement Period 1 being added to the inquiry. The Restatement Period values are calculated every time the report is run.
The Restatement functionality takes into account the Currency Restatement Rates and associated periods in order to derive the correct exchange rate.
The Currency Restatement Rates are imported from the Currency Restatement Rates File (F1113). They take the currency of the company and convert the associated amounts into the Restatement Currency (which initially is defaulted to the Domestic Currency of Company 00000).
In the above example, Company 75 has a Domestic Currency of CAD (Canadian Dollars). Company 00000 has a domestic currency of USD (United States Dollars).
Within the Currency Restatement Rates File (F1113), there are several exchange rate conversions for CAD to USD. The Currency Restatement functionality analyzes the individual object accounts in order to select the correct exchange rate that has an applicable Rate Type for the associated period. These rate types can be similar to a Month End rate, which is applied to Balance Sheet accounts, or a Monthly Average, which is applied to Profit and Loss Accounts.
These exchange rates are then applied to the Restatement Period column.
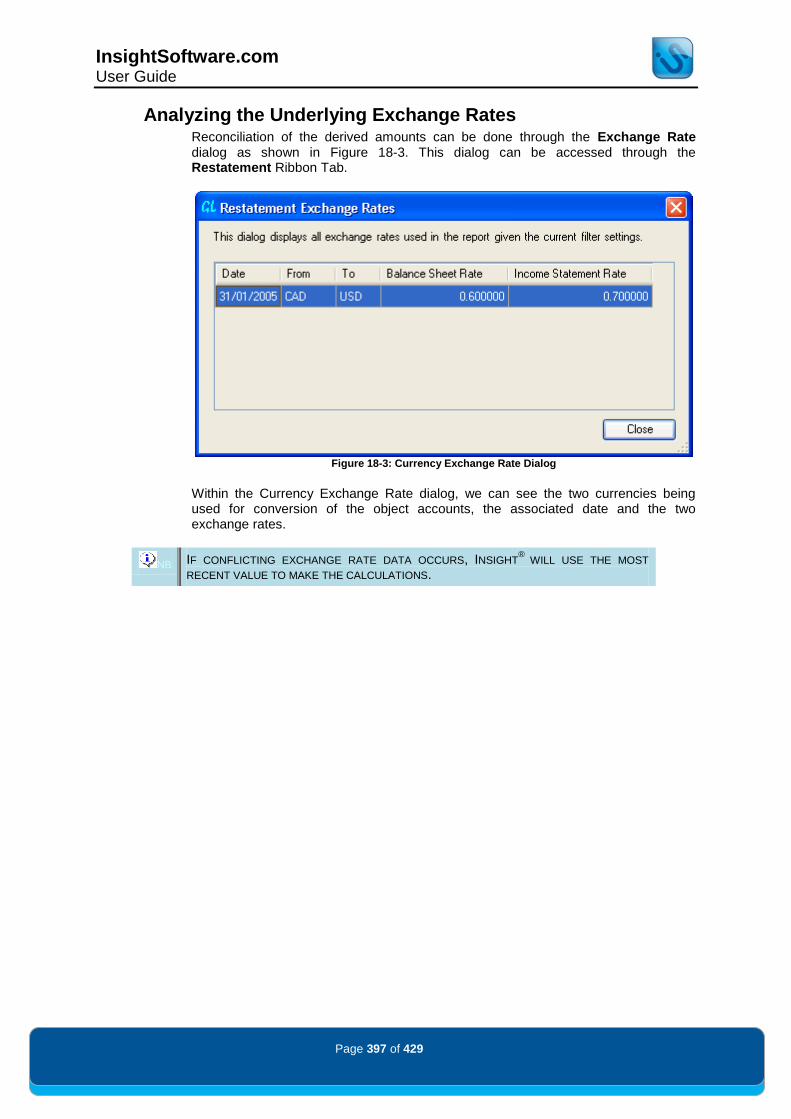
InsightSoftware.com User Guide
Page 397 of 429
Analyzing the Underlying Exchange Rates Reconciliation of the derived amounts can be done through the Exchange Rate dialog as shown in Figure 18-3. This dialog can be accessed through the Restatement Ribbon Tab.
Figure 18-3: Currency Exchange Rate Dialog
Within the Currency Exchange Rate dialog, we can see the two currencies being used for conversion of the object accounts, the associated date and the two exchange rates.
NB IF CONFLICTING EXCHANGE RATE DATA OCCURS, INSIGHT®
WILL USE THE MOST
RECENT VALUE TO MAKE THE CALCULATIONS.

InsightSoftware.com User Guide
Page 398 of 429
Changing the Restatement Currency Previously, it was mentioned that the Restatement Currency would default from Company 00000. It is possible however to convert your object account period balances into any currency, as long as there is associated Currency Restatement Rates File (F1113) data.
Within the Restatement Ribbon Tab there is an option called Settings. Within the Settings dialog, you can change the Restatement Currency to any of the available currency exchange rates. See Figure 18-4 below.
Figure 18-4: Restatement Settings Dialog

InsightSoftware.com User Guide
Page 399 of 429
Restatement Resulting From Two Exchange Rates It is possible with the Currency Restatement functionality to convert account balances across two sets of exchange rates. The following example is for Company 80, which has a domestic currency of Columbian Peso (COP). The requirement is to display Company 80‟s balances in Canadian Dollars (CAD). Within the Currency Restatement Rates File (F1113), the following information for period 5 will be used. (Note that there is no direct conversion between Columbian Pesos and Canadian Dollars.)
Multiplier Divisor Effective Date
To Currency
From Currency
Rate Type
.0009468 1056.2 01/05/05 USD COP Month End – Balance Sheet
.6456757 1.5487650 01/05/05 USD CAD Month End – Balance Sheet
By changing our Restatement Currency to CAD through the Restatement Currency option in Set Inquiry Options (Figure 18-5), the Currency Restatement functionality will automatically begin to assess methods of conversion.
Figure 18-5: Change of Restatement Currency to Canadian Dollar
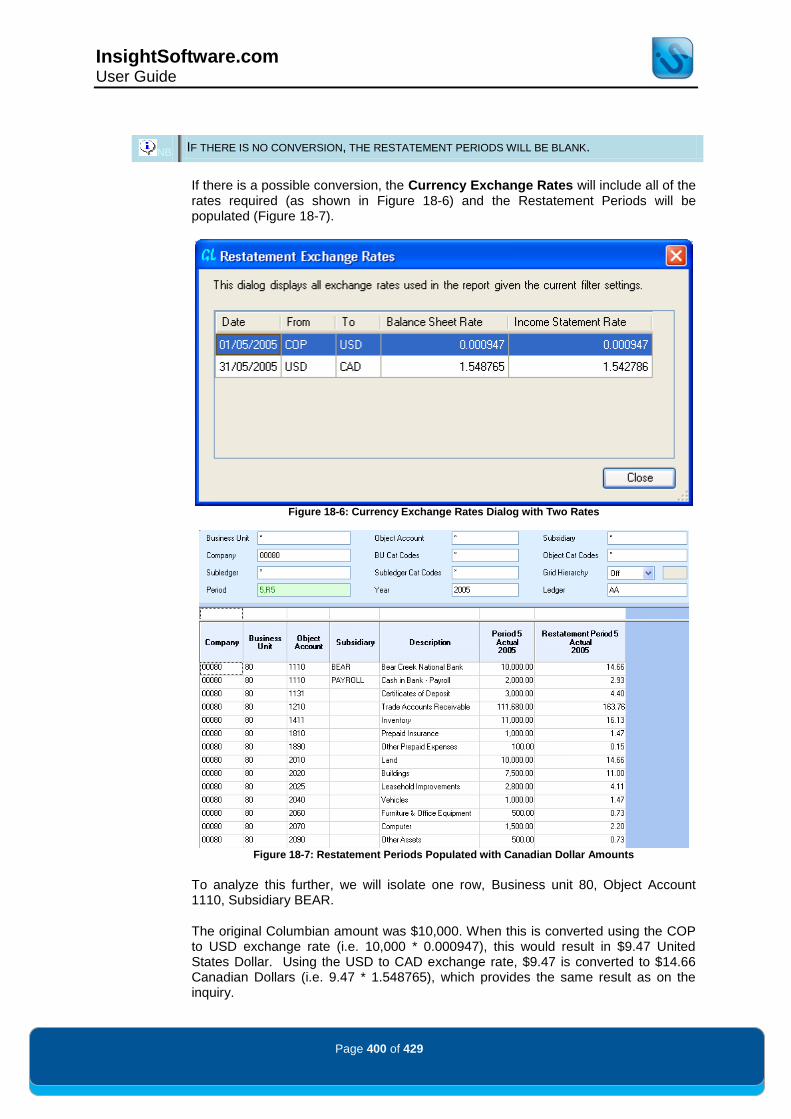
InsightSoftware.com User Guide
Page 400 of 429
NB IF THERE IS NO CONVERSION, THE RESTATEMENT PERIODS WILL BE BLANK.
If there is a possible conversion, the Currency Exchange Rates will include all of the rates required (as shown in Figure 18-6) and the Restatement Periods will be populated (Figure 18-7).
Figure 18-6: Currency Exchange Rates Dialog with Two Rates
Figure 18-7: Restatement Periods Populated with Canadian Dollar Amounts
To analyze this further, we will isolate one row, Business unit 80, Object Account 1110, Subsidiary BEAR.
The original Columbian amount was $10,000. When this is converted using the COP to USD exchange rate (i.e. 10,000 * 0.000947), this would result in $9.47 United States Dollar. Using the USD to CAD exchange rate, $9.47 is converted to $14.66 Canadian Dollars (i.e. 9.47 * 1.548765), which provides the same result as on the inquiry.
InsightSoftware.com User Guide
Page 401 of 429
JD Edwards™ EnterpriseOne provides functionality called “Date-Effective Organizational Structures” or “Snapshots”. Users can run a batch process to populate the Date Effective Business Master (F0006S) table. This stores a „snapshot‟ of the current Business Unit with a user chosen effective date and unique version name. This functionality supports organizations that change Business Unit structures over time. All associated attributes/category codes are stored and become active based on the effective date. The Insight
® Business Unit Snapshot functionality allows users to create Inquiries
that derive the correct Business Unit attribute/category codes via the Snapshot effective dates. The Business Unit Snapshot functionality can be used for summary reports (such as GL Balances/Period Summary) or transactional reports (such as GL Transactions), accurately grouping amounts and journal entries according structures recorded in the F0006S. Users will have full drill down capability to the original GL transactions based on time-phased organizational changes. For the Business Unit Snapshot functionality to work, the associated Profile must have the Date Effective Business Master (F0006S) table enabled.
NB FOR MORE INFORMATION ON ENABLING TABLES, PLEASE REFER TO THE ADMINISTRATION AND
CONFIGURATION GUIDE FOR VERSION WINTER 2011.

InsightSoftware.com User Guide
Page 402 of 429
Inquiry Options - Business Unit Snapshot Settings To enable the Business Unit Snapshot functionality, „click‟ on the Home Ribbon tab and select Inquiry Options. „Click‟ on the Advanced Tab to view the Use Business Unit Snapshots drop down control.
Figure 19-1: Use Business Unit Snapshots Control
There are four options for the control shown in Figure 19-1:
No, don’t use snapshots: Derives all business unit information from the Business Unit Master (F0006) Table. This is the default option and indicates no change to existing Insight
® behavior.
Include period if snapshot date falls inside it: A Snapshot effective date that falls within the period causes amounts to be displayed for the period
Exclude period if snapshot date falls inside it: A Snapshot effective date that falls within the period causes amounts to be excluded for the period, but displays the amounts in the next period
Include when snapshot falls in the first half, otherwise exclude: A Snapshot effective date from of the 1st to the 15th causes amounts to be displayed for the period. Effective dates greater than the 15th will display amounts in the next period
Each of these options will have different effects on the data. Figure 19-2 shows a record that has one Business Unit (302) with a selected Category Code called Division.
Figure 19-2: Business Unit Record without Snapshot Enabled
Figure 19-3 shows the same record with Business Unit Snapshot enabled (with a setting of Include period if snapshot date falls inside it). The results have been split into the appropriate Category Codes as governed by the values in the Date Effective Business Master (F0006S) table.
Figure 19-3: Business Unit Records Split by Category Code

InsightSoftware.com User Guide
Page 403 of 429
User Defined Filters (UDFs) allow users to define and save pre-set filter criteria that is specific to their department and/or job for running inquiries. Users can create and save multiple User Defined Filters and then choose a desired User Defined Filter to use prior to running an inquiry. Users can even designate a default User Defined Filter to be used when opening any inquiry that has the same filters available. This functionality will save users‟ time when preparing to run an inquiry since they do not have to populate the filters with their desired values. They can select a defined User Defined Filter that will pre-populate the filters with the necessary values saved for that User Defined Filter.
Activate User Defined Filter Functionality In order for a user to have the ability to create User Defined Filters, the capability must first be set in the Administration Tool.
Within Advanced Capabilities, go to Feature Control and then to User Defined Filters. At the appropriate level (for example Everyone, a specific group or specific user), set Write Enable = Yes and select Use User Defined Filters. (For more information on Capabilities, please refer to the Administration and Configuration Guide for Version Winter 2011.)
Once this Capability is enabled, the associated users will be able to see the User Defined Filters icon that is shown in Figure 20-1.
Figure 20-1: User Defined Filters Ribbon Icon

InsightSoftware.com User Guide
Page 404 of 429
Set up User Defined Filters To set up a User Defined Filter, „click‟ on the User Defined Filters icon. For Console users this is located within the Home Ribbon tab, and for Insight
® users this
is located within the Console Ribbon tab.
The User Defined Filters dialog is shown in Figure 20-2.
Figure 20-2: User Defined Filters Dialog
The following functions can be performed within the User Defined Filter:
New: Opens a dialog by which you can create a User Defined Filter Set
Edit: Opens a dialog by which you edit a User Defined Filter Set
Remove: Removes the selected User Defined Filter set
Copy: Copies the selected User Defined Filter set
Default: Applies the selected User Defined Filter set to any inquiry being loaded
Apply UDFs: Applies the selected User Defined Filter set to the current inquiry/template
o The Apply to all open inquiries checkbox works in conjunction with the Apply UDFs in that it will apply a UDF set to all open inquiries, including report packs.
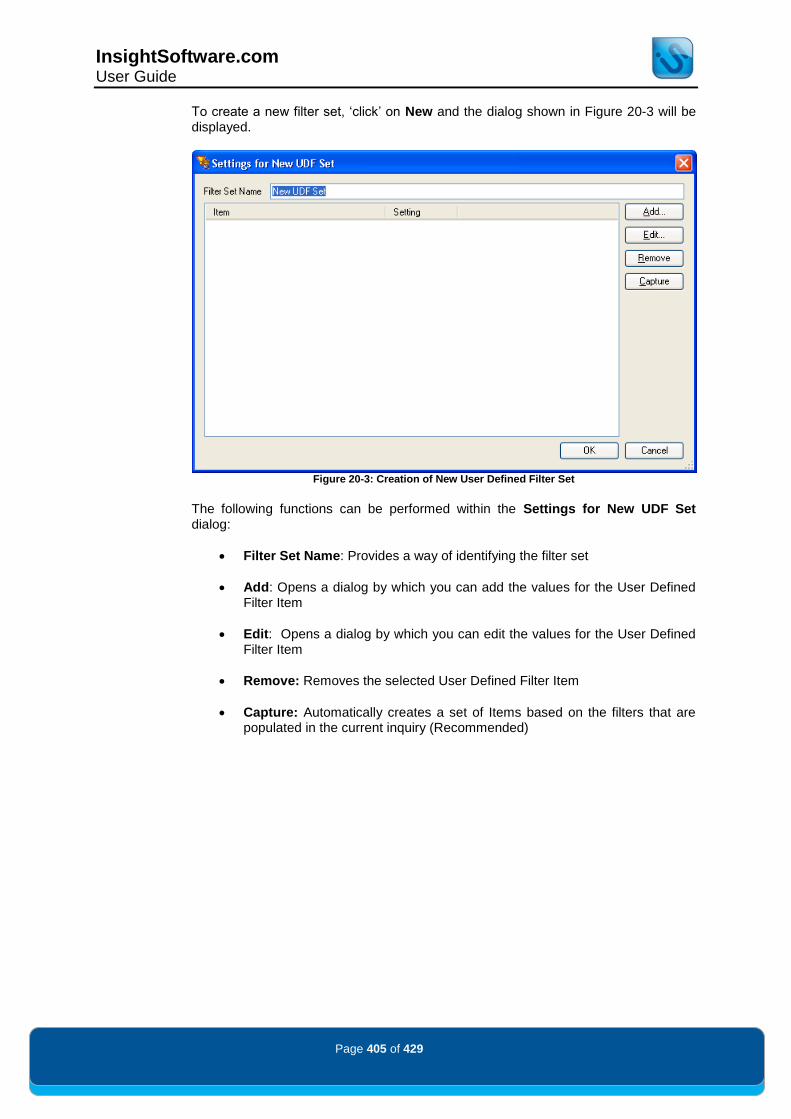
InsightSoftware.com User Guide
Page 405 of 429
To create a new filter set, „click‟ on New and the dialog shown in Figure 20-3 will be displayed.
Figure 20-3: Creation of New User Defined Filter Set
The following functions can be performed within the Settings for New UDF Set dialog:
Filter Set Name: Provides a way of identifying the filter set
Add: Opens a dialog by which you can add the values for the User Defined Filter Item
Edit: Opens a dialog by which you can edit the values for the User Defined Filter Item
Remove: Removes the selected User Defined Filter Item
Capture: Automatically creates a set of Items based on the filters that are populated in the current inquiry (Recommended)
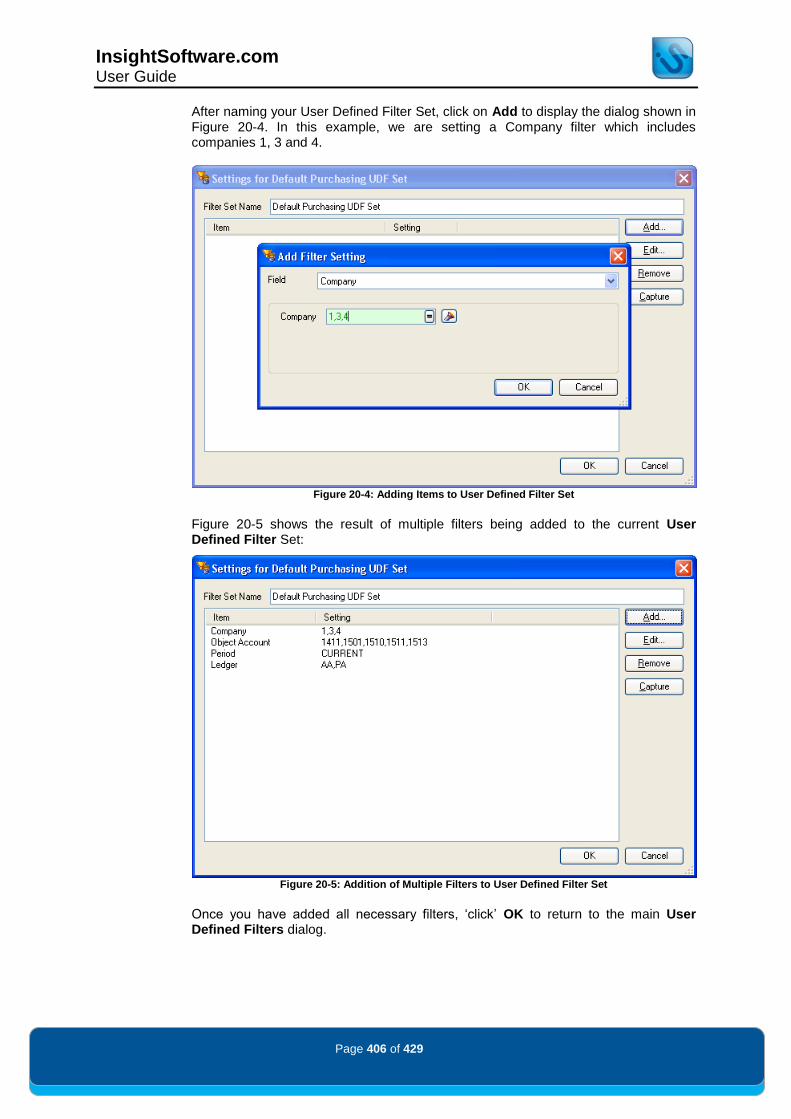
InsightSoftware.com User Guide
Page 406 of 429
After naming your User Defined Filter Set, click on Add to display the dialog shown in Figure 20-4. In this example, we are setting a Company filter which includes companies 1, 3 and 4.
Figure 20-4: Adding Items to User Defined Filter Set
Figure 20-5 shows the result of multiple filters being added to the current User Defined Filter Set:
Figure 20-5: Addition of Multiple Filters to User Defined Filter Set
Once you have added all necessary filters, „click‟ OK to return to the main User Defined Filters dialog.

InsightSoftware.com User Guide
Page 407 of 429
To apply the User Defined Filter to your inquiry, select the appropriate filter set, „click‟ on Apply UDFs and „click‟ OK to return to the main inquiry dialog.
Alternatively User Defined Filters can be set through the use of the dropdown next to the User Defined Filters icon within the ribbon. If you have set up a User Defined Filter set, you can select the one you would like to apply to the inquiry. Multiple UDF sets are shown below in Figure 20-6:
Figure 20-6: User Defined Filter Sets Available for Use
Figure 20-7 displays an inquiry that has User Defined Filters applied:
Figure 20-7: User Defined Filter Set Applied to Inquiry Filters
NB USER DEFINED FILTERS WILL ONLY OVERRIDE THE FILTERS THAT ARE SPECIFIED IN THE SET. ANY POPULATED FILTERS NOT INCLUDED IN THE SET WILL STILL BE POPULATED AFTER THE
USER DEFINED FILTER IS APPLIED.
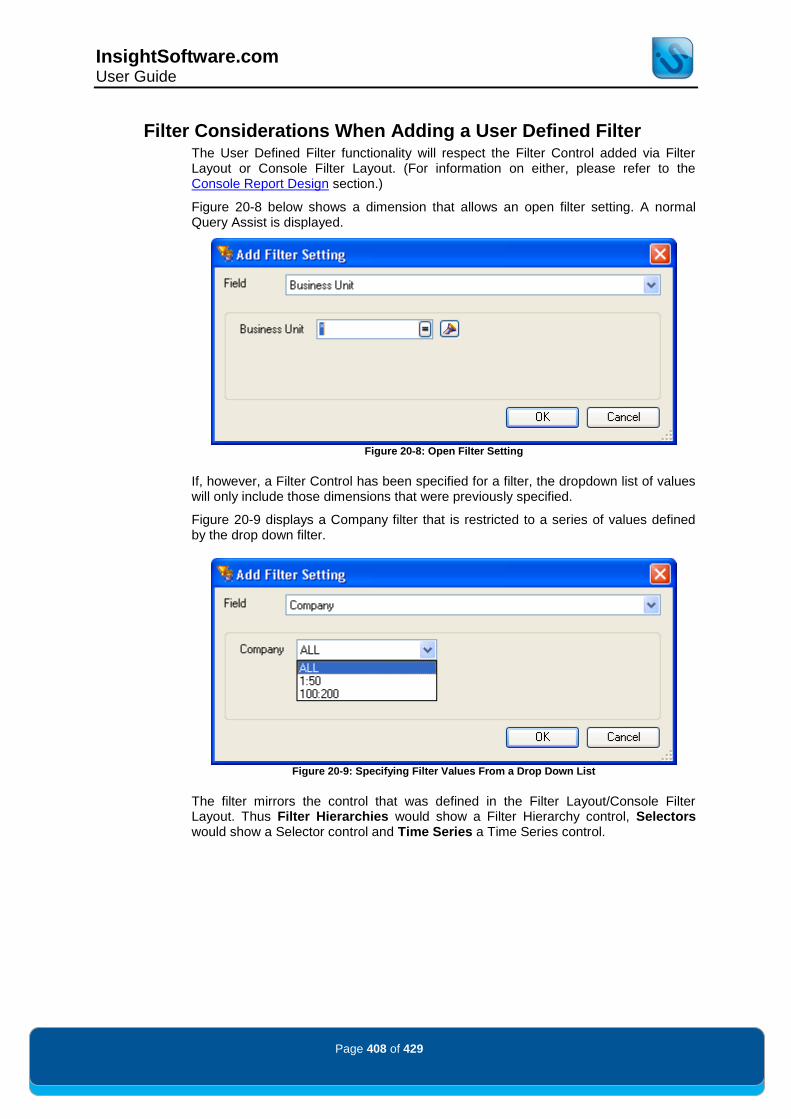
InsightSoftware.com User Guide
Page 408 of 429
Filter Considerations When Adding a User Defined Filter The User Defined Filter functionality will respect the Filter Control added via Filter Layout or Console Filter Layout. (For information on either, please refer to the Console Report Design section.)
Figure 20-8 below shows a dimension that allows an open filter setting. A normal Query Assist is displayed.
Figure 20-8: Open Filter Setting
If, however, a Filter Control has been specified for a filter, the dropdown list of values will only include those dimensions that were previously specified.
Figure 20-9 displays a Company filter that is restricted to a series of values defined by the drop down filter.
Figure 20-9: Specifying Filter Values From a Drop Down List
The filter mirrors the control that was defined in the Filter Layout/Console Filter Layout. Thus Filter Hierarchies would show a Filter Hierarchy control, Selectors would show a Selector control and Time Series a Time Series control.
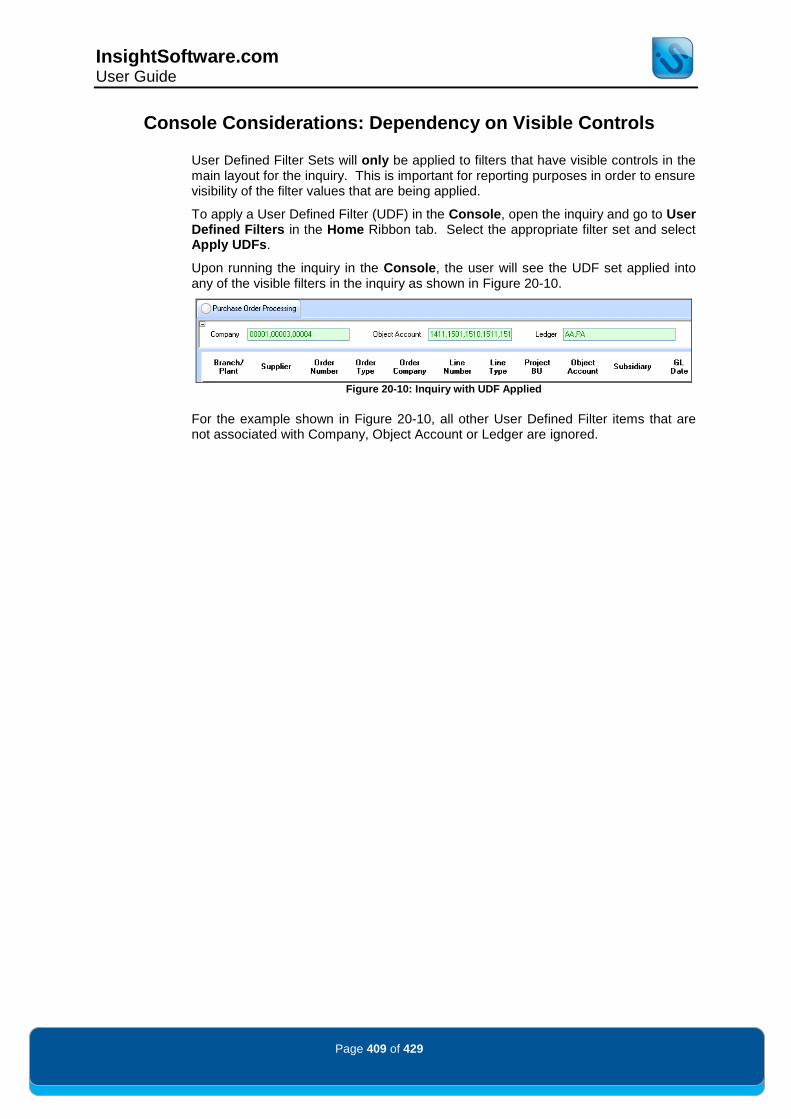
InsightSoftware.com User Guide
Page 409 of 429
Console Considerations: Dependency on Visible Controls User Defined Filter Sets will only be applied to filters that have visible controls in the main layout for the inquiry. This is important for reporting purposes in order to ensure visibility of the filter values that are being applied.
To apply a User Defined Filter (UDF) in the Console, open the inquiry and go to User Defined Filters in the Home Ribbon tab. Select the appropriate filter set and select Apply UDFs.
Upon running the inquiry in the Console, the user will see the UDF set applied into any of the visible filters in the inquiry as shown in Figure 20-10.
Figure 20-10: Inquiry with UDF Applied
For the example shown in Figure 20-10, all other User Defined Filter items that are not associated with Company, Object Account or Ledger are ignored.

InsightSoftware.com User Guide
Page 410 of 429
There are several inquiry option settings that can be set to personalize the product, making it more relevant to your inquiry and reporting needs.
These inquiry options can be accessed by selecting Inquiry Options from the Home Ribbon Tab. The Inquiry Options dialog is shown below in Figure 21-1:
Figure 21-1: Inquiry Options Dialog

InsightSoftware.com User Guide
Page 411 of 429
General Tab: Presentation Options There are two Presentation Options available as shown in Figure 21-2:
Figure 21-2: Presentation Options
Missing text: This field defines the text string displayed in cells of missing data (Null Fields).
This functionality can be demonstrated in an inquiry that has missing balances enabled. By entering Missing Text in the Missing Text field, you would see the following result set as shown in Figure 21-3:
Figure 21-3: Missing Text
Blank text: This defines the text string used for specifying blank selections. The default is BLK.
This functionality can be demonstrated in an inquiry that has category codes. If you wish to select a blank object category, you can do so by typing BLK (the default text) into the Object Category filter as shown in Figure 21-4.
Figure 21-4: Use of Blank Text in a Filter
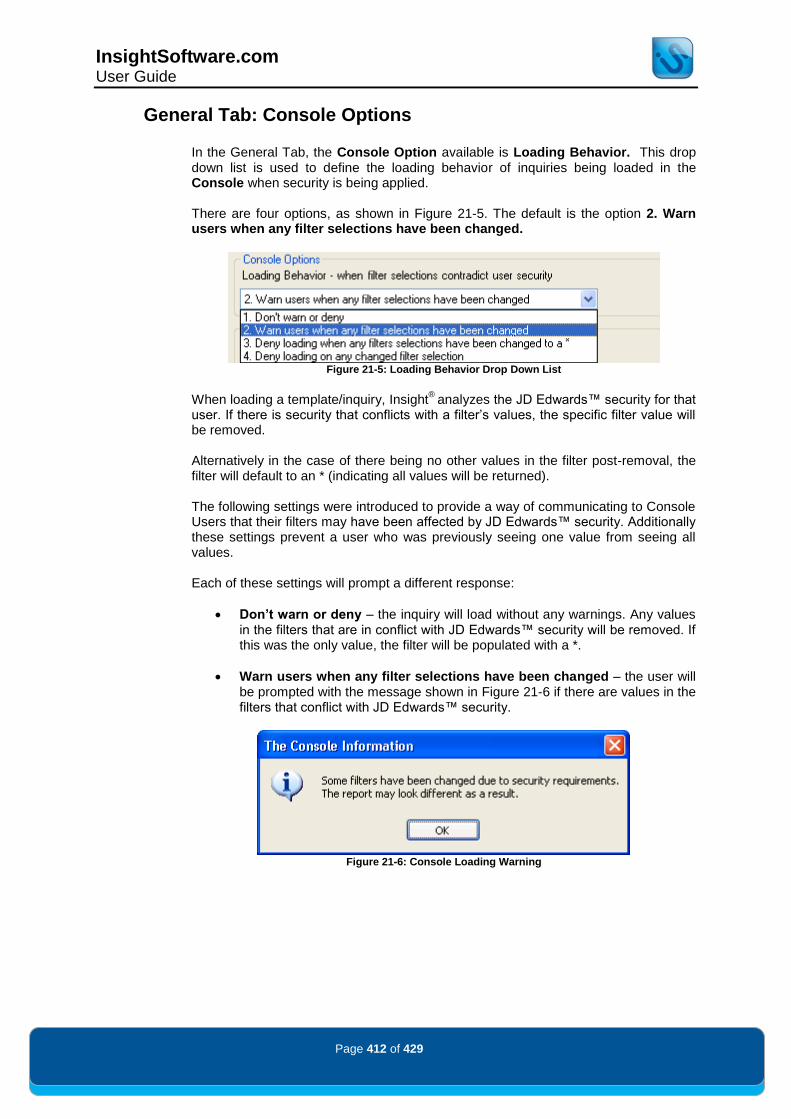
InsightSoftware.com User Guide
Page 412 of 429
General Tab: Console Options In the General Tab, the Console Option available is Loading Behavior. This drop down list is used to define the loading behavior of inquiries being loaded in the Console when security is being applied. There are four options, as shown in Figure 21-5. The default is the option 2. Warn users when any filter selections have been changed.
Figure 21-5: Loading Behavior Drop Down List
When loading a template/inquiry, Insight®
analyzes the JD Edwards™ security for that user. If there is security that conflicts with a filter‟s values, the specific filter value will be removed. Alternatively in the case of there being no other values in the filter post-removal, the filter will default to an * (indicating all values will be returned). The following settings were introduced to provide a way of communicating to Console Users that their filters may have been affected by JD Edwards™ security. Additionally these settings prevent a user who was previously seeing one value from seeing all values. Each of these settings will prompt a different response:
Don’t warn or deny – the inquiry will load without any warnings. Any values in the filters that are in conflict with JD Edwards™ security will be removed. If this was the only value, the filter will be populated with a *.
Warn users when any filter selections have been changed – the user will be prompted with the message shown in Figure 21-6 if there are values in the filters that conflict with JD Edwards™ security.
Figure 21-6: Console Loading Warning

InsightSoftware.com User Guide
Page 413 of 429
Deny loading when any filter selections have been changed to a * - The user will not be able to load the inquiry if the removal of a value results in a * in the filter. If this occurs, the user will be prompted with the dialog shown in Figure 21-7:
Figure 21-7: Console Loading Warning
Deny Loading on any changed filter selection – The user will not be able to load the inquiry if any filter values conflict with JD Edwards™ security. If this occurs, the user will be prompted with the dialog shown in Figure 21-8:
Figure 21-8: Console Loading Warning
General Tab: Localization Options The Localization functionality is covered in greater depth in its own Localization section.

InsightSoftware.com User Guide
Page 414 of 429
Advanced Tab The Advanced tab contains settings for various template/inquiry specific settings. Figure 21-9 displays the settings for a standard GL Balances Template.
Figure 21-9: Advanced Tab of Inquiry Options
Who’s Who Phone Number Type
The Who’s Who Phone Number Type provides a method to choose which Phone Number will be displayed from the JD Edwards™‟ Who‟s Who system. This Inquiry Option will be displayed in any inquiry/template that includes the Address Number.
Use the drop down box to select the Phone Number Type that you want to display (Figure 21-10). This will take the phone numbers from the Address Book – Contact Phone Numbers (F0115), also known as Who’s Who Phone Number.
Figure 21-10: Who’s Who Phone Number Type Drop Down List
NB IF THERE ARE TWO PHONE NUMBERS WITH THE SAME WHO’S WHO PHONE NUMBER TYPE, INSIGHT
® WILL AUTOMATICALLY SELECT THE NUMBER THAT WAS MOST RECENTLY ADDED.

InsightSoftware.com User Guide
Page 415 of 429
Use Business Unit Snapshot
The Use Business Unit Snapshot provides a means of enabling the Business Unit Snap Shot functionality. This Inquiry Option will be displayed in any inquiry/template that includes functionality for a Business Unit Category Code.
Restatement Currency
The Restatement Currency provides a means of designating the Currency used for Restatement. This Inquiry Option will be displayed in any inquiry/template that is capable of using the Restatement functionality.
Object Account/Subsidiary Description
The Object Account Description and Subsidiary Description controls provide a way of configuring the description settings for an individual inquiry. These Inquiry Options will be displayed in any inquiry/template that includes object accounts and subsidiaries. Use the drop down box to select the particular description setting as shown in Figure 21-11 and Figure 21-12. The default for this setting is Configured Option. When set, this will take the setting which is stored in the active profile for the current Insight
®
session.
Figure 21-11: Object Account Description Drop Down List
Figure 21-12: Subsidiary Description Drop Down List
NB FOR MORE INFORMATION ON THE OBJECT ACCOUNT DESCRIPTION AND SUBSIDIARY
DESCRIPTION SETTINGS, PLEASE REFER TO THE ADMINISTRATION AND CONFIGURATION GUIDE
FOR VERSION WINTER 2011.
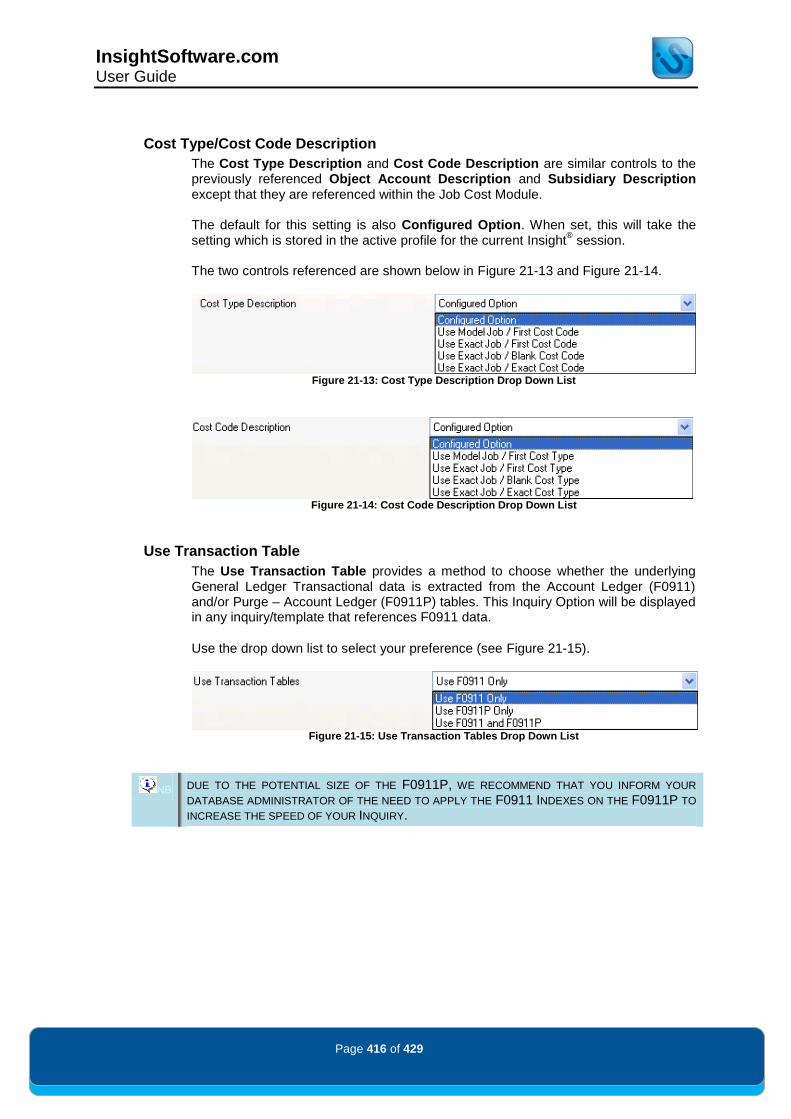
InsightSoftware.com User Guide
Page 416 of 429
Cost Type/Cost Code Description
The Cost Type Description and Cost Code Description are similar controls to the previously referenced Object Account Description and Subsidiary Description except that they are referenced within the Job Cost Module. The default for this setting is also Configured Option. When set, this will take the setting which is stored in the active profile for the current Insight
® session.
The two controls referenced are shown below in Figure 21-13 and Figure 21-14.
Figure 21-13: Cost Type Description Drop Down List
Figure 21-14: Cost Code Description Drop Down List
Use Transaction Table
The Use Transaction Table provides a method to choose whether the underlying General Ledger Transactional data is extracted from the Account Ledger (F0911) and/or Purge – Account Ledger (F0911P) tables. This Inquiry Option will be displayed in any inquiry/template that references F0911 data.
Use the drop down list to select your preference (see Figure 21-15).
Figure 21-15: Use Transaction Tables Drop Down List
NB DUE TO THE POTENTIAL SIZE OF THE F0911P, WE RECOMMEND THAT YOU INFORM YOUR
DATABASE ADMINISTRATOR OF THE NEED TO APPLY THE F0911 INDEXES ON THE F0911P TO
INCREASE THE SPEED OF YOUR INQUIRY.

InsightSoftware.com User Guide
Page 417 of 429
Use Sales Order Details/Use Sales Header
The Use Sales Order Details and Use Sales Headers controls provide a method to define the underlying data from your Sales Order information.
The Use Sales Order Details defines whether the underlying sales transactional data is extracted from the Sales Order Detail File (F4211) and/or Sales Order History File – Flexible Version (F42119) tables.
The Use Sales Header defines whether the underlying sales header data is extracted from the Sales Order Header File (F4201) and/or Sales Order Header History File – Flexible Version (F42019) tables.
Use the drop down list to select your preference as shown in Figure 21-16 and Figure 21-17.
Figure 21-16: Use Sales Order Details Drop Down List
Figure 21-17: Use Sales Header Drop Down List
NB DUE TO THE POTENTIAL SIZE OF THE F42119, WE RECOMMEND THAT YOU INFORM YOUR
DATABASE ADMINISTRATOR OF THE NEED TO APPLY THE F4211 INDEXES TO THE F42119 TO
INCREASE THE SPEED OF YOUR INQUIRY.

InsightSoftware.com User Guide
Page 418 of 429
The User Preferences dialog allows each user to tailor the product to suit individual needs and roles within the business. „Click‟ on the IS Button and select the User Preferences icon shown in Figure 22-1.
Figure 22-1: User Preferences Option in IS Button

InsightSoftware.com User Guide
Page 419 of 429
The User Preferences dialog is shown below in Figure 22-2:
Figure 22-2: User Preferences Dialog
The dialog comprises of four items to customize the following areas, as shown in Figure 22-3 below:
General
Warnings
Warning Overrides
Change Password
Figure 22-3: User Preferences

InsightSoftware.com User Guide
Page 420 of 429
User Preferences: General Section
The General Section of the User Preferences dialog includes commonly used options. See Figure 22-4 below:
Figure 22-4: General Section within User Preferences
Within the General dialog the following options can be set:
Drill / Link / Open Inquiries: Enabling the Run Inquiries Automatically tick box sets inquiries to be run automatically at the point of drilling, linking and opening them.
NB THE RUN INQUIRIES AUTOMATICALLY SETTING IS NOT RECCOMENDED FOR USERS WHO RUN
INQUIRIES WITH LARGE RESULT SETS OR FOR USERS IN THE INITIAL STAGES OF INQUIRY
DESIGN. THIS IS DUE TO THE POTENTIAL OF TOO MUCH DATA BEING REQUESTED, WHICH CAN
CAUSE PROBLEMS FOR THE UNDERLYING DATABASE.
Printing: choose the default Page Size and Orientation for all subsequent printouts. (This can be changed on a report by report basis in the Print Options dialog.)
Output: set whether to Create Unique File Name for each Excel/PDF export file generated by the system
For more information on Printing and Output options please refer to the Export Functionality section.
Localization: set whether to use a user specific language by disabling the Use JDE Default Language and then selecting a language from the Your Language drop down.
For more information on Localization please refer to the Localization section.

InsightSoftware.com User Guide
Page 421 of 429
User Preferences: Warnings
If any of the filters values have not been set prior to running an inquiry, a pop up dialog will appear, warning you about which filter(s) have not been applied. An example of the Insight
® Warning dialog is shown in Figure 22-5. This warning system is designed to reduce the occurrences when an inquiry has been incorrectly specified and returns too much information. This warning will also be shown when searching in a Query Assist:
Figure 22-5: Warnings on Filters which Have Not Been Applied
Within the Warnings dialog shown in Figure 22-6, you can select which filters should generate a warning if they have not been set before an inquiry is run.
Figure 22-6: Warnings Section within User Preferences
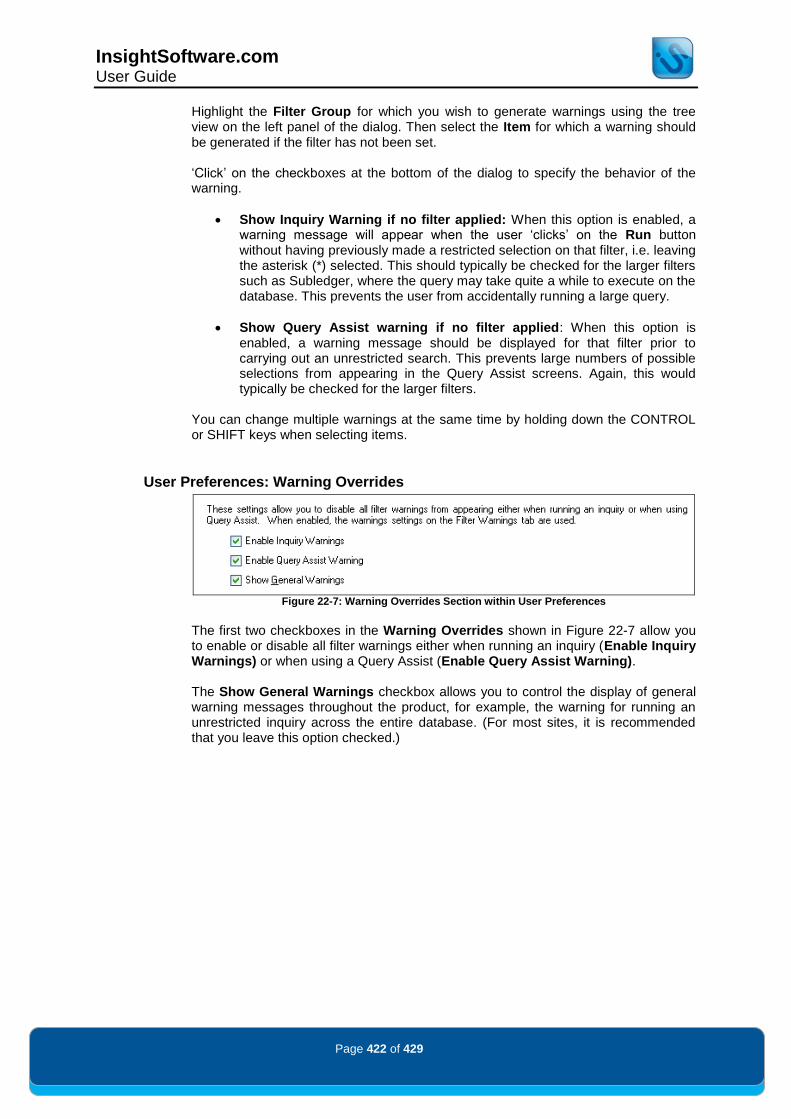
InsightSoftware.com User Guide
Page 422 of 429
Highlight the Filter Group for which you wish to generate warnings using the tree view on the left panel of the dialog. Then select the Item for which a warning should be generated if the filter has not been set. „Click‟ on the checkboxes at the bottom of the dialog to specify the behavior of the warning.
Show Inquiry Warning if no filter applied: When this option is enabled, a warning message will appear when the user „clicks‟ on the Run button without having previously made a restricted selection on that filter, i.e. leaving the asterisk (*) selected. This should typically be checked for the larger filters such as Subledger, where the query may take quite a while to execute on the database. This prevents the user from accidentally running a large query.
Show Query Assist warning if no filter applied: When this option is enabled, a warning message should be displayed for that filter prior to carrying out an unrestricted search. This prevents large numbers of possible selections from appearing in the Query Assist screens. Again, this would typically be checked for the larger filters.
You can change multiple warnings at the same time by holding down the CONTROL or SHIFT keys when selecting items.
User Preferences: Warning Overrides
Figure 22-7: Warning Overrides Section within User Preferences
The first two checkboxes in the Warning Overrides shown in Figure 22-7 allow you to enable or disable all filter warnings either when running an inquiry (Enable Inquiry Warnings) or when using a Query Assist (Enable Query Assist Warning). The Show General Warnings checkbox allows you to control the display of general warning messages throughout the product, for example, the warning for running an unrestricted inquiry across the entire database. (For most sites, it is recommended that you leave this option checked.)
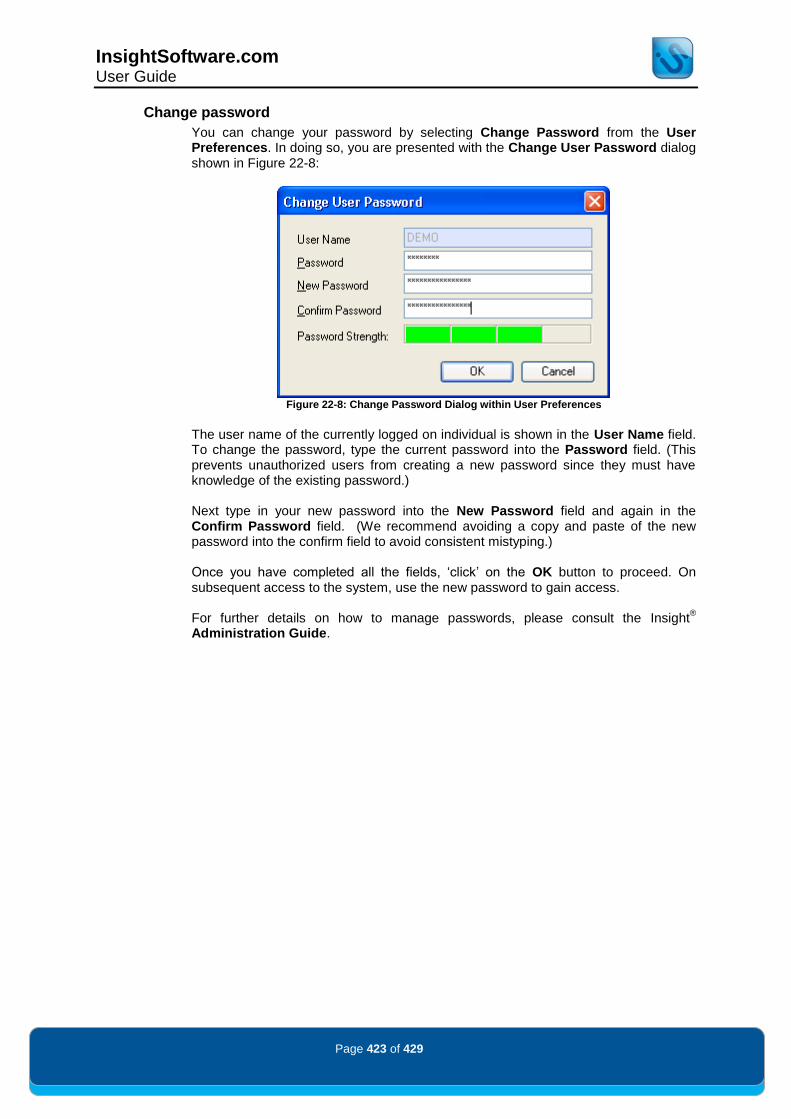
InsightSoftware.com User Guide
Page 423 of 429
Change password
You can change your password by selecting Change Password from the User Preferences. In doing so, you are presented with the Change User Password dialog shown in Figure 22-8:
Figure 22-8: Change Password Dialog within User Preferences
The user name of the currently logged on individual is shown in the User Name field. To change the password, type the current password into the Password field. (This prevents unauthorized users from creating a new password since they must have knowledge of the existing password.) Next type in your new password into the New Password field and again in the Confirm Password field. (We recommend avoiding a copy and paste of the new password into the confirm field to avoid consistent mistyping.) Once you have completed all the fields, „click‟ on the OK button to proceed. On subsequent access to the system, use the new password to gain access. For further details on how to manage passwords, please consult the Insight
®
Administration Guide.

InsightSoftware.com User Guide
Page 424 of 429
The Insight
® Localization functionality allows a user to utilize any of the alternate
language captions stored within JD Edwards™. The functionality allows a user to tailor the display of the product for their given language. Figure 23-1displays a standard GL Balances Template with Spanish Localization enabled. All captions that are present within the associated JD Edwards™ system are displayed within Insight
®.
Figure 23-1: Spanish Localization Enabled
Localization Rules The current language chosen is the result of 3 independent settings which act in a priority system:
Inquiry Language: This is an inquiry specific setting, and overrides all other languages. (This is controlled via Inquiry Options.)
User Preferred Language: This is a user specific setting and overrides the JD Edwards™ Default Language. (This is controlled via User Preferences.)
JDE Default Language: This setting is read from User Display Preferences (F00921) Table and determines the default language for the user in JD Edwards™.

InsightSoftware.com User Guide
Page 425 of 429
Localization: Inquiry Options „Click‟ on Inquiry Options within the Home Ribbon Tab and then „click‟ on Enable Localization to activate the dialog shown in Figure 23-2.
Figure 23-2: Localization Dialog
The JDE Module setting controls which JD Edwards™ module captions should be applied within Insight
®. Normally this can be retained as the default, but there may be
some times that you will wish to change this for different captions. Each inquiry in Insight
® belongs to a certain module in JD Edwards™. The JD
Edwards™ system is highly configurable, with different captions in different languages that can also be set by module type. This information is stored within the Data Item Alpha Descriptions (F9203) Table. An example of this configuration is the way that there is a Business Unit in the General Ledger Module, but the same field (MCU) is called Job in the Job Cost Module.
The language used in this inquiry can also be specified by using the Inquiry Language setting. By default, all inquiries use the User’s Preferred language. The User’s Preferred Language can be overridden, however, to ensure that an inquiry is always shown in the English language. „Click‟ on the User’s Preferred Language to disable the use of the User‟s Preferred Language. You will then be able to override the Inquiry Language. There are two other dialogs available as shown in Figure 23-3:
Figure 23-3: Additional Dialogs within Localization
If you wish to change your User’s Preferred Language, „click‟ on the Change button which will open the dialog shown in Figure 23-4.
Figure 23-4: Choose Your Language Dialog

InsightSoftware.com User Guide
Page 426 of 429
Within the Choose your language dialog, you can specify whether you wish to override the JD Edwards™ Default language. To override this, „click‟ on the Use JDE Default Language tick box and the Your Language drop down box will become available. „Click‟ OK to return back to the main dialog. If you want to change the underlying tables used for Localization, „click‟ on the Advanced icon to open the dialog shown in Figure 23-5.
Figure 23-5: Advanced Localization Options
The Advanced Localization Options dialog allows you to use different Localization tables within JD Edwards™.
The default preference is to use the F0004D/F0004 for UDC fields, which derives captions from the User Defined Codes – Alternate Language Descriptions (F0004D) and User Defined Codes (F0004) tables. Alternatively the preference can be set to Use F9203 for all fields which will only derive captions from the Data Item Alpha Descriptions (F9203) table. „Click‟ OK to return back to the main dialog.

InsightSoftware.com User Guide
Page 427 of 429
Localization: User Preferences „Click‟ on the IS Button and select the User Preferences icon. The User Preferences shown in Figure 23-6 will be displayed.
Figure 23-6: User Preferences
The section of this dialog associated with Localization is shown in Figure 23-7.
Figure 23-7: Localization Section of User Preferences
This interface duplicates the functionality previously shown in the Choose your Language dialog. It allows a user to change their User Preferred Language (which will take dominance over their JD Edwards™ Default Language) by disabling the User JDE Default Language tick box and specifying a language via the Your Language drop down.
NB ANY CHANGES MADE WITHIN THE USER PREFERENCES WILL ONLY AFFECT INQUIRIES THAT DO
NOT HAVE AN OVERRIDE SET WITHIN THE INQUIRY OPTIONS.

InsightSoftware.com User Guide
Page 428 of 429
Localization: Advanced
Data Extraction
Localization is based on the extraction of data from three mandatory tables:
User Display Preferences (F00921): This table provides the default language for the logged on user.
Data Item Alpha Descriptions (F9203): This table provides captions in your language for each data item. It also specifies overrides for modules.
User Defined Codes – Alternate Language Definitions (F0004D): This table provides captions in your language for data items defined in the user defined codes table.
If populated, captions in different languages can also be derived from the following specific tables:
User Defined Codes – Alternate Language Definition (F0005D)
Business Unit - Alternate Description Master (F0006D)
Account Master – Alternate Description (F0901D)
Asset Master – Alternate Description (F1201D)
Unit Master – Alternate Description (F1507D)
Item Master –Alternate Description (F4101D)
Localization & User Defined Captions
User Defined Captions take precedence over localized captions for all fields. For any columns that are pivoted through Pivot Inquiry, any User Defined Caption value will also take precedence. User Defined Captions do not apply to results returned from inquiries in Insight
®.
However, localized captions can if their associated table is configured and has data. For example if the Business Unit - Alternate Description Master (F0006D) has a corresponding entry for a Business Unit in the result set, the caption can be displayed as a description for this item within the result set.
Localization Exceptions
Localized captions are applied throughout Insight®; however the following is a list of
exceptions:
All data fields are not translated and display in the English Language, for example: Period on the GL Balances/Period Summary inquiry in the GL module.
The Year field displays in the English Language
Grouped Fields such as Category Codes will also show their name in English. (This is due to the way that they were entered in this language, but can be renamed accordingly for the language required.)
For more information on Grouped Fields please refer to the Groups and Grouped Fields section.

InsightSoftware.com User Guide
Page 429 of 429
Contacts For more information regarding our products, please contact us at:
Web www.InsightSoftware.com
Technical Support For Technical Support, Please complete the web form at:
Web Link
http://supportform.InsightSoftware.com
Notices and Disclaimer Insight, Console and GL Reporting are trademarks of InsightSoftware.com Limited. InsightSoftware.com is a registered trademark of InsightSoftware.com Limited. Oracle, JD Edwards, JD Edwards EnterpriseOne, JD Edwards World and Oracle E-Business are registered trademarks of Oracle Corporation. Other product and company names mentioned herein may be the trademarks of their respective owners. The information contained in this document represents the current view of InsightSoftware.com on the issues discussed as of the date of publication. InsightSoftware.com cannot guarantee the accuracy of any information presented after the date of publication. This document is for informational purposes only. InsightSoftware.com makes no warranties, expressed or implied, in this document. © 2000-2011 InsightSoftware.com Limited. All rights reserved.