中国物理学研究分析 及 IOPscience 新平台介绍
28
中中中中中中中中中 中 IOPscience 中中中中中 中中中: Tony O’Rourke , Assistant Director 中中中中中 () 中中中 中中中中中 IOP Publishing Ltd CALIS 2008 中中中中中中中 中中中中中中 2008 中 5 中 13 中
-
Upload
leigh-graham -
Category
Documents
-
view
269 -
download
0
description
中国物理学研究分析 及 IOPscience 新平台介绍. 演讲人: Tony O ’ Rourke , Assistant Director (营销总监) 刘向立 中国区经理 IOP Publishing Ltd CALIS 2008 年数据库培训周 华中科技大学 2008 年 5 月 13 日. 中国物理学研究分析 IOPscience 新平台介绍. 全球出版市场分析. 全球大概有 5,000,000 多名科学研究者 (Source: UNESCO) - PowerPoint PPT Presentation
Transcript of 中国物理学研究分析 及 IOPscience 新平台介绍
中国物理学研究分析
及 IOPscience新平台介绍
演讲人:Tony O’Rourke, Assistant Director(营销总监)刘向立 中国区经理 IOP Publishing Ltd
CALIS 2008年数据库培训周华中科技大学 2008年 5 月 13日
中国物理学研究分析
IOPscience新平台介绍
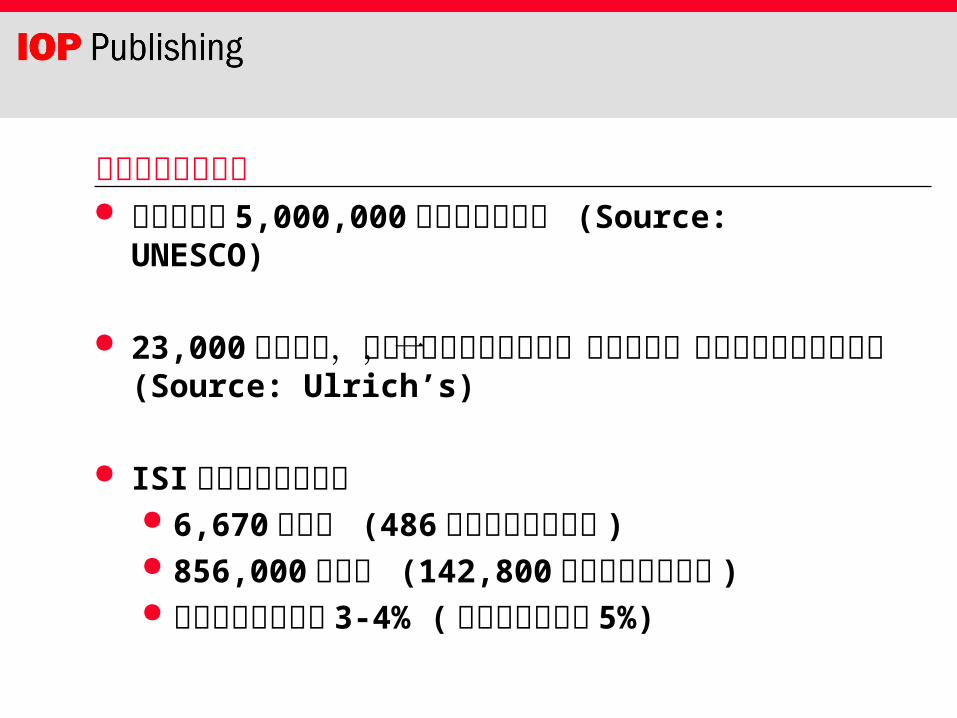
全球出版市场分析 全球大概有 5,000,000多名科学研究者 (Source: UNESCO)
23,000种活跃的,较有影响力的学术期刊,每年出版一百四十多万篇学术文章 (Source: Ulrich’s)
ISI所收录的科技期刊 6,670种期刊 (486种物理学相关期刊 ) 856,000篇文章 (142,800篇物理学相关文章 ) 文章每年大概增长 3-4% (物理学相关文章 5%)
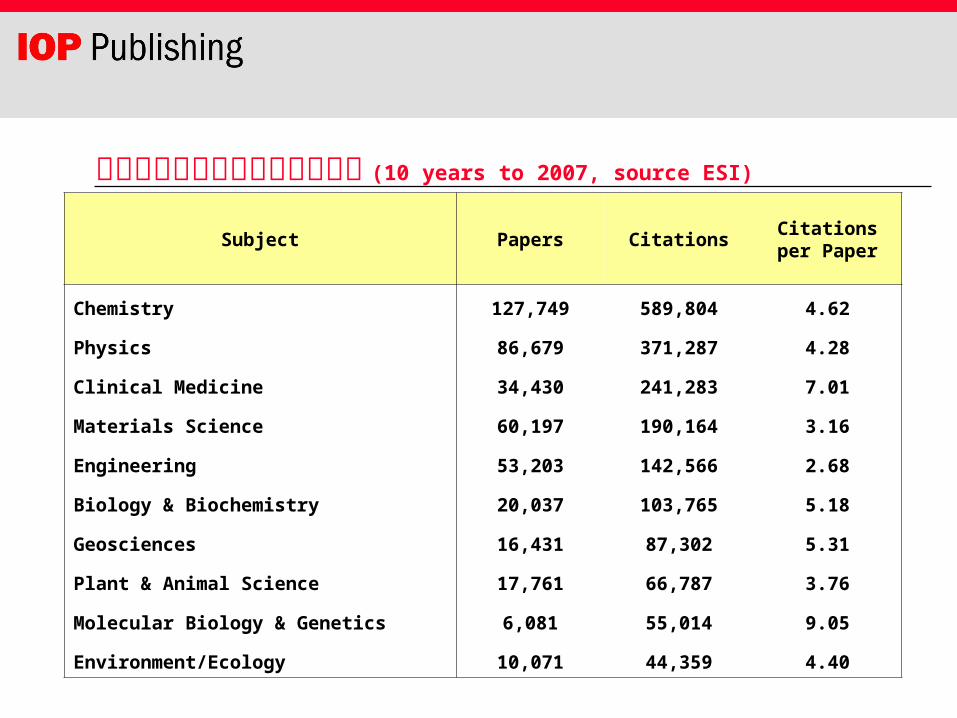
中国作者发表科技文章学科排名 (10 years to 2007, source ESI)
Subject Papers CitationsCitations per
Paper
Chemistry 127,749 589,804 4.62
Physics 86,679 371,287 4.28
Clinical Medicine 34,430 241,283 7.01
Materials Science 60,197 190,164 3.16
Engineering 53,203 142,566 2.68
Biology & Biochemistry 20,037 103,765 5.18
Geosciences 16,431 87,302 5.31
Plant & Animal Science 17,761 66,787 3.76
Molecular Biology & Genetics 6,081 55,014 9.05
Environment/Ecology 10,071 44,359 4.40
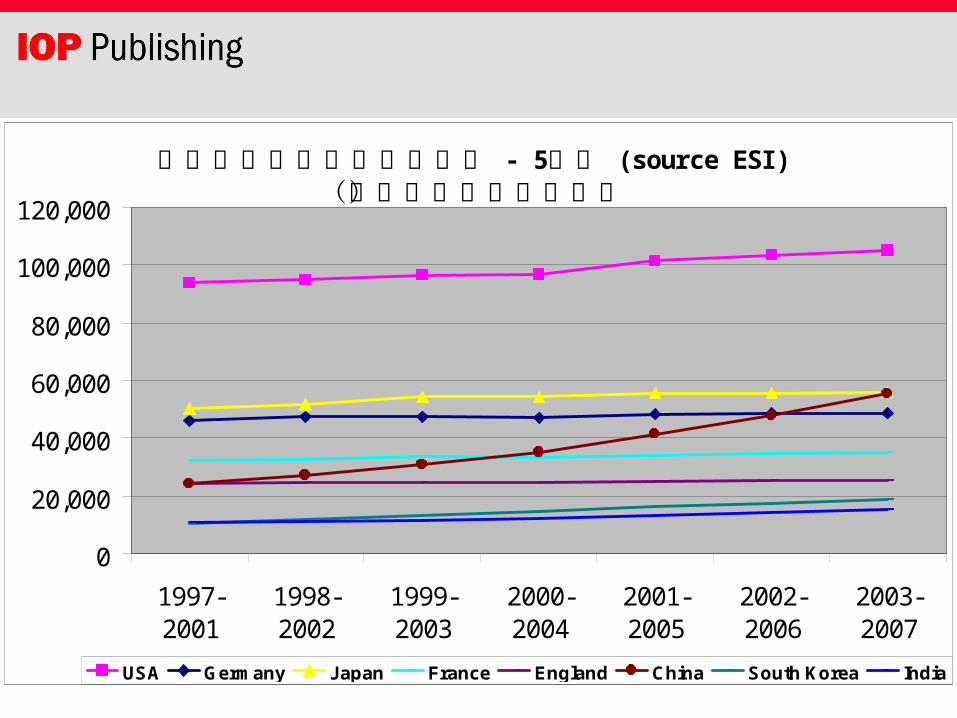
- 5 (source ESI )物理学文章产出量各国比较 年间(中国物理学比较权威)
0
20,000
40,000
60,000
80,000
100,000
120,000
1997-2001
1998-2002
1999-2003
2000-2004
2001-2005
2002-2006
2003-2007
USA Germany Japan France England China South Korea India
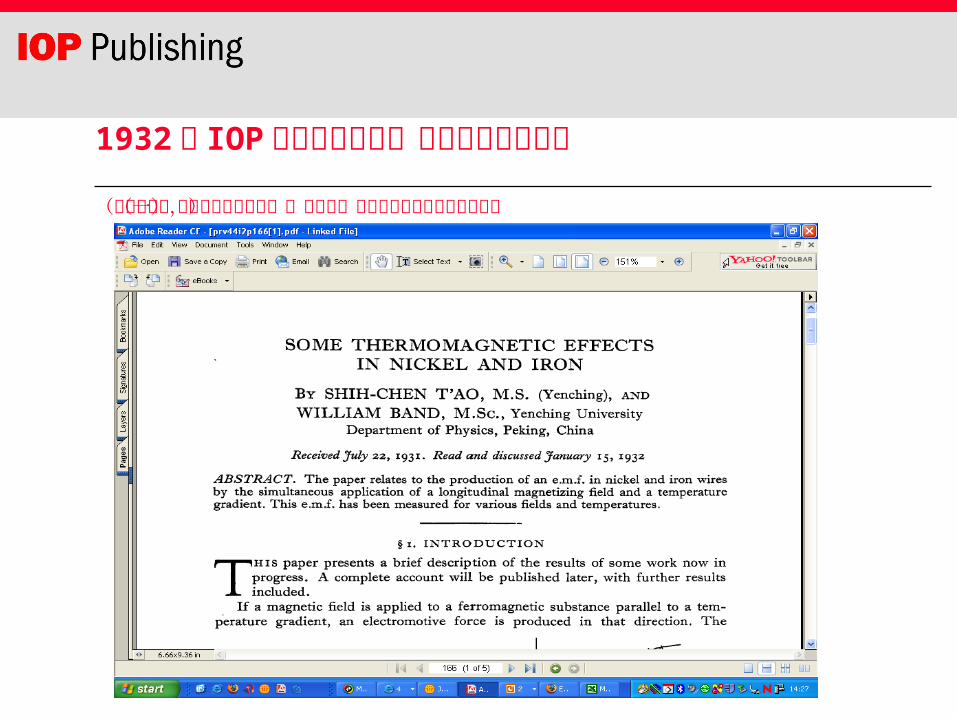
1932年 IOP期刊发表的第一篇来自中国的文章
(燕京大学(现北京大学前身之一)物理系,关于在镍与铁中的热磁影响)
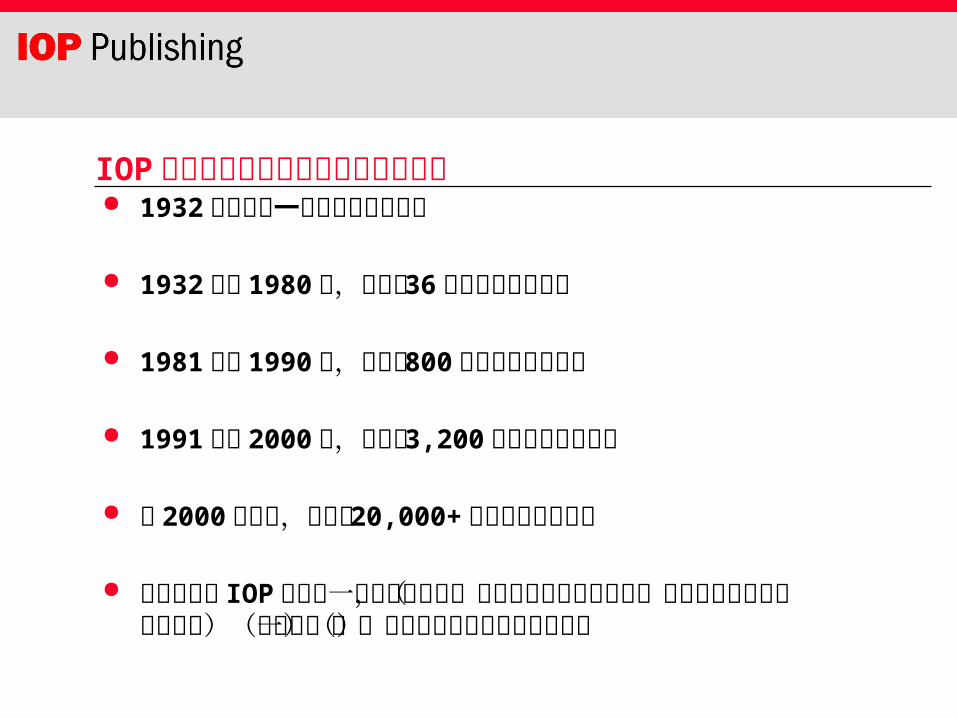
IOP发表来自中国作者文章的历史概述 1932年发表第一篇来自中国的文章
1932年到 1980年,收到了 36篇来自中国的文章
1981年到 1990年,收到了 800篇来自中国的文章
1991年到 2000年,收到了 3,200篇来自中国的文章
从 2000年以来,收到了 20,000+篇来自中国的文章
中国现在是 IOP期刊第一大投稿来源国,第二大发表文章来源国(不包括中国物理学会的期刊)(美国第一)(中国作者对我们期刊的依赖)
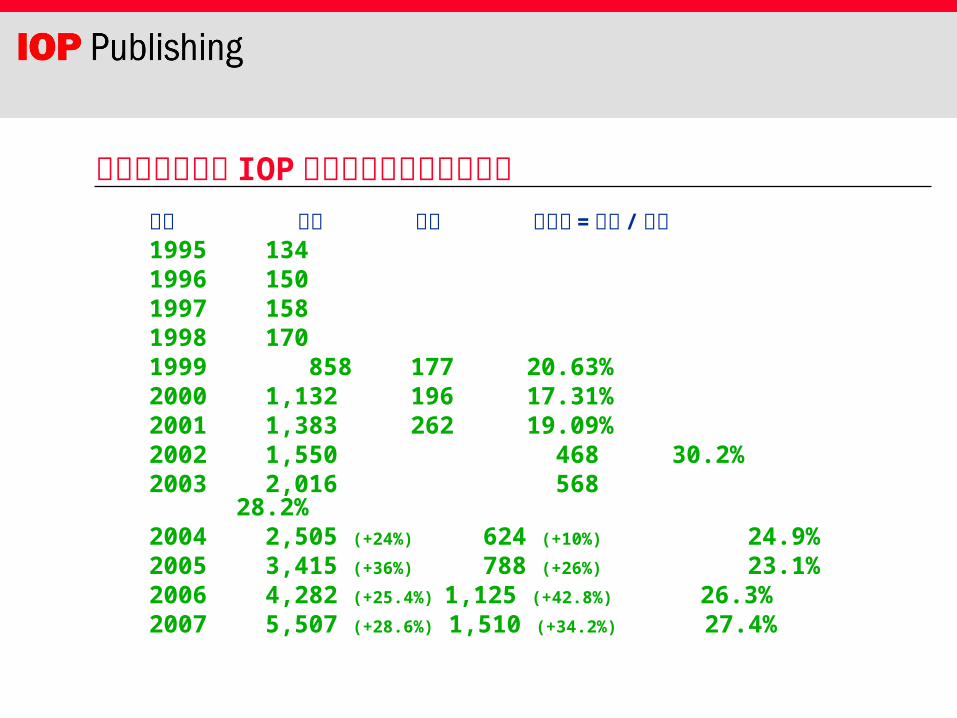
中国大陆作者向 IOP期刊投稿和发表论文情况年份 投稿 接受 接受率 = 接受 /
投稿1995 1341996 1501997 1581998 1701999 858 177 20.63%2000 1,132 196 17.31%2001 1,383 262 19.09%2002 1,550 468 30.2%2003 2,016 568 28.2% 2004 2,505 (+24%) 624 (+10%) 24.9%2005 3,415 (+36%) 788 (+26%) 23.1%2006 4,282 (+25.4%) 1,125 (+42.8%) 26.3% 2007 5,507 (+28.6%) 1,510 (+34.2%) 27.4%

IOP Journal 2007 作者分布统计
Canada3%
China12%
France4%
Germany7%
Italy4%
Japan6%
ROW34%
Russia3%
Spain3%
UK8%
USA16%

2007年中国高校向 IOP期刊发表文章排名(前 8 所高校)
大学院校 投稿 / 接受 / 接受率 (%)
1 Zhejiang University 180 / 73 / 40.56% 2 Shanghai Jiao Tong University 186 / 72 / 38.71% 3 Tsinghua University 231 / 68 / 29.44% 4 Jilin University 172 / 61 / 35.47% 5 Nanjing University 181 / 61 / 33.70% 6 Peking University 150 / 48 / 32.00% 7 Dalian University of Technology 147 / 42 / 28.57% 8 Huazhong University of Science and Technology 142 /42 / 29.6%
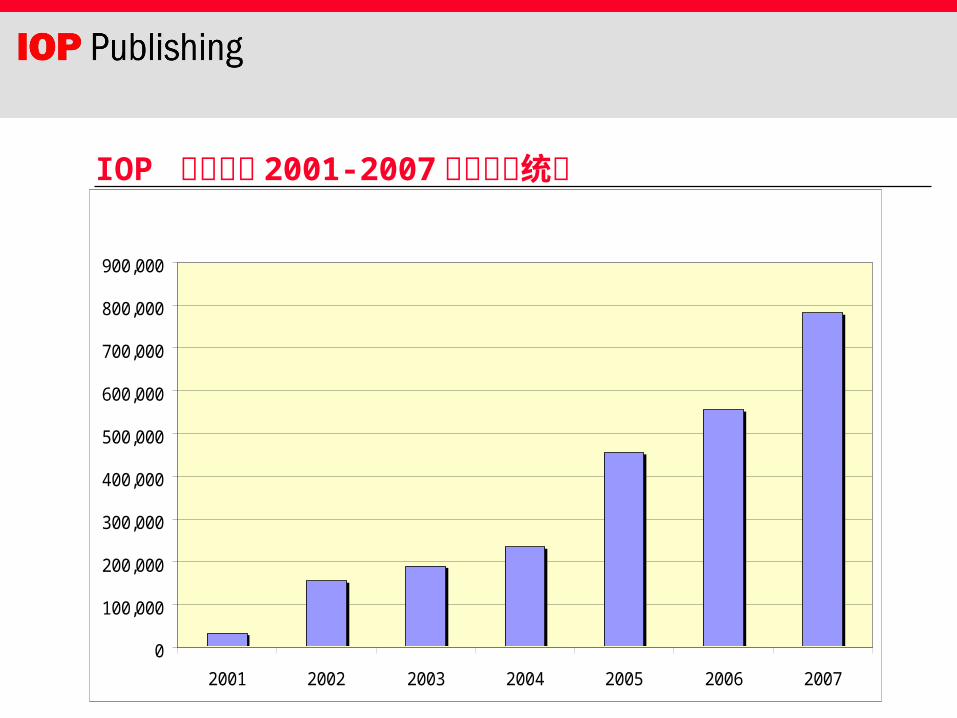
IOP 电子期刊 2001-2007中国使用统计
0
100,000
200,000
300,000
400,000
500,000
600,000
700,000
800,000
900,000
2001 2002 2003 2004 2005 2006 2007
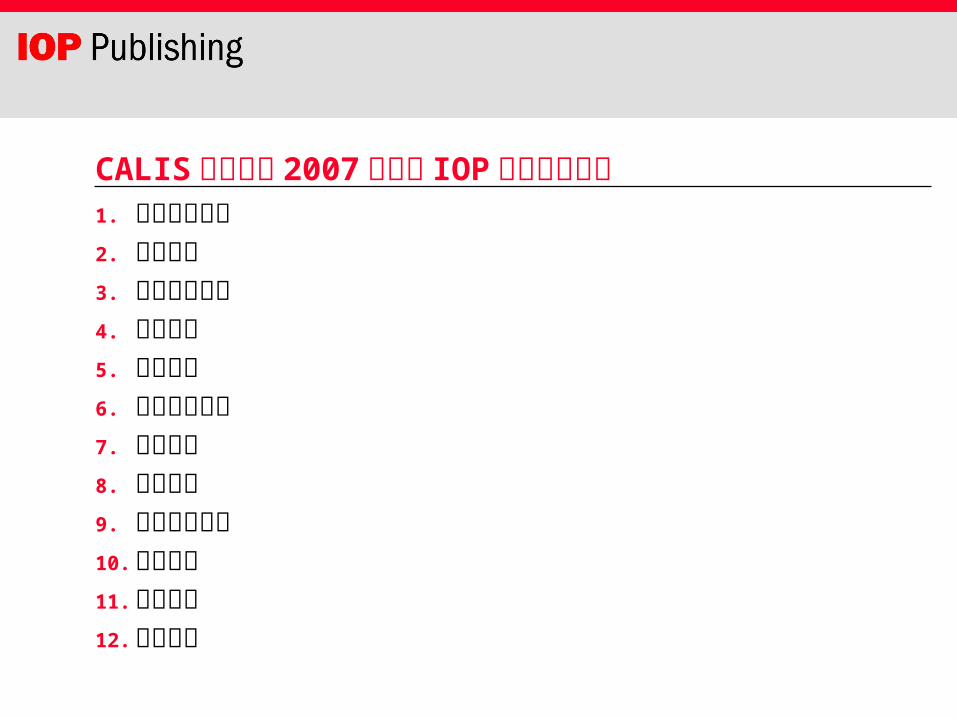
CALIS集团成员 2007年下载 IOP期刊全文排名1. 中国科技大学 2. 清华大学 3. 华中科技大学4. 北京大学5. 吉林大学6. 上海交通大学7. 南京大学8. 浙江大学9. 大连理工大学10. 天津大学11. 复旦大学 12. 武汉大学
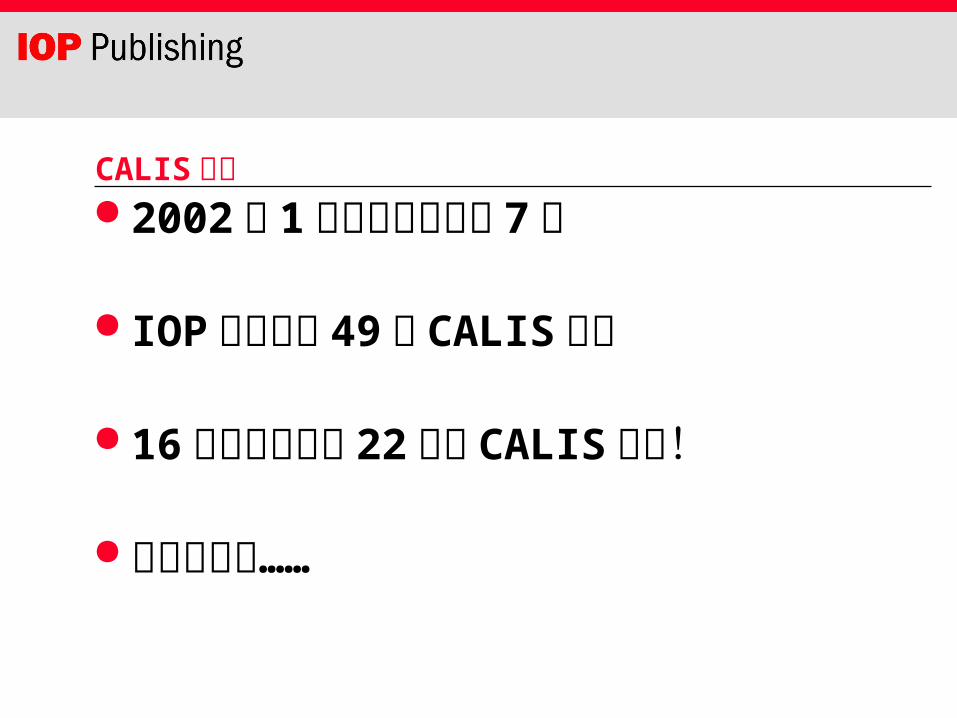
CALIS集团 2002 年 1 月组团至今已经 7 年
IOP集团现有 49 家 CALIS成员
16个月中增加了 22个新 CALIS用户!
用户增加中……
IOPscience平台介绍 什么是 IOPscience?
对于 CALIS成员增加了那些内容?
IOPscience的功能特点
IOPscience的访问方式
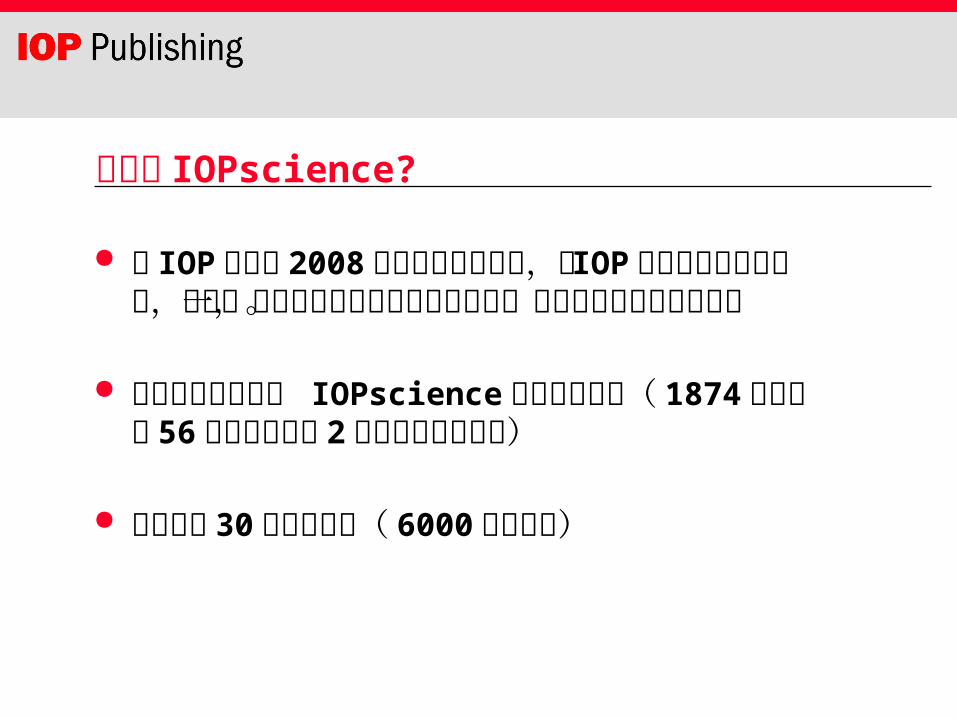
什么是 IOPscience?
是 IOP出版社 2008年推出的新的平台,将 IOP所有的期刊内容整合,提供一个宽阔的电子化渠道取得科学,技术及医学的文献内容。
授权用户可以访问 IOPscience上的所有内容( 1874年至今的 56种全文现刊和 2 种回溯文档数据库)
平台上有 30多万篇文章( 6000多种分类)
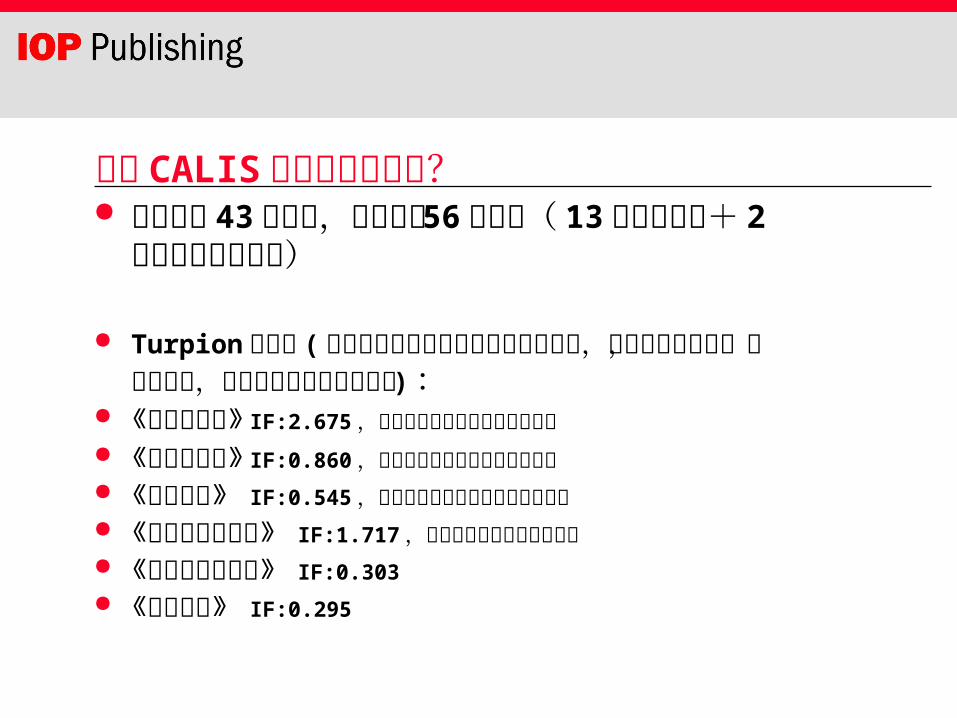
对于 CALIS增加了那些内容? 从现有的 43种期刊,增加到了 56种期刊
( 13种新增期刊+ 2 种回溯文档数据库)
Turpion出版社 ( 俄罗斯科学院俄文期刊的英文翻译版,由英国物理学会,伦敦数学会,英国皇家化学会合作出版 ):
《物理学进展》 IF:2.675,所有俄罗斯物理类期刊之中最高 《量子电子学》 IF:0.860,所有俄罗斯应用物理学期刊最高 《数学通报 》 IF:0.545,所有俄罗斯数学类期刊之中最高的 《俄罗斯化学评论 》 IF:1.717,所有俄罗斯化学类期刊最
高 《俄罗斯数学评论 》 IF:0.303
《数学汇编 》 IF:0.295
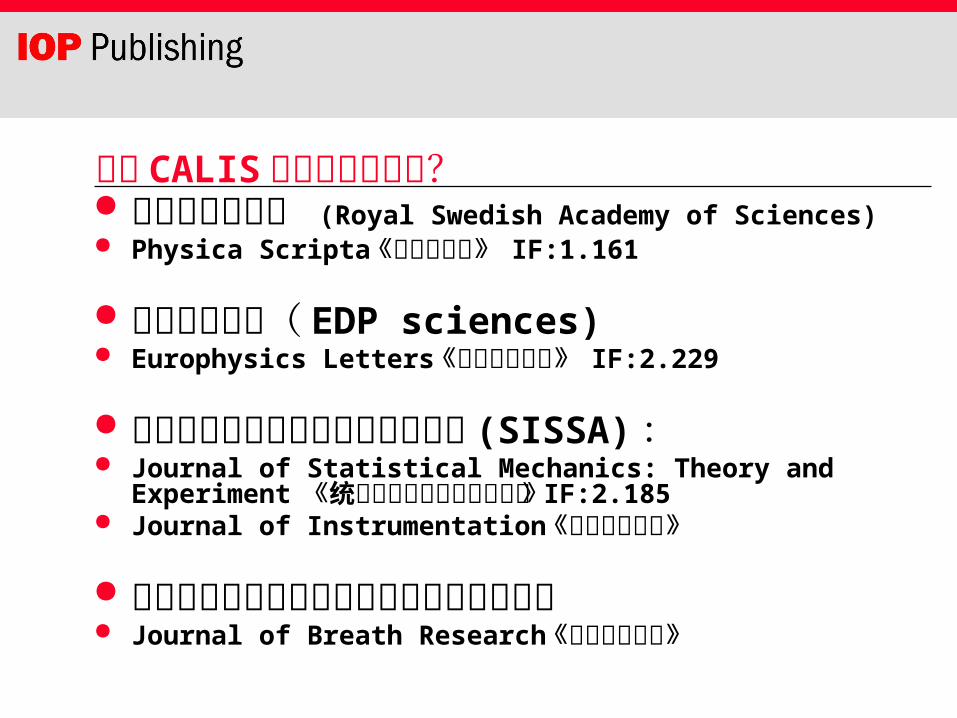
对于 CALIS增加了那些内容? 瑞典皇家科学院 (Royal Swedish Academy of
Sciences) Physica Scripta《物理学评论 》 IF:1.161
法国物理学会( EDP sciences) Europhysics Letters《欧洲物理快报 》 IF:2.229
意大利里雅斯特国际高级研究生院 (SISSA): Journal of Statistical Mechanics: Theory and
Experiment 《统计力学学刊:理论和实验》 IF:2.185 Journal of Instrumentation《仪表制造期刊》
国际呼吸研究协会和国际呼吸气味研究学会 Journal of Breath Research《呼吸研究杂志》
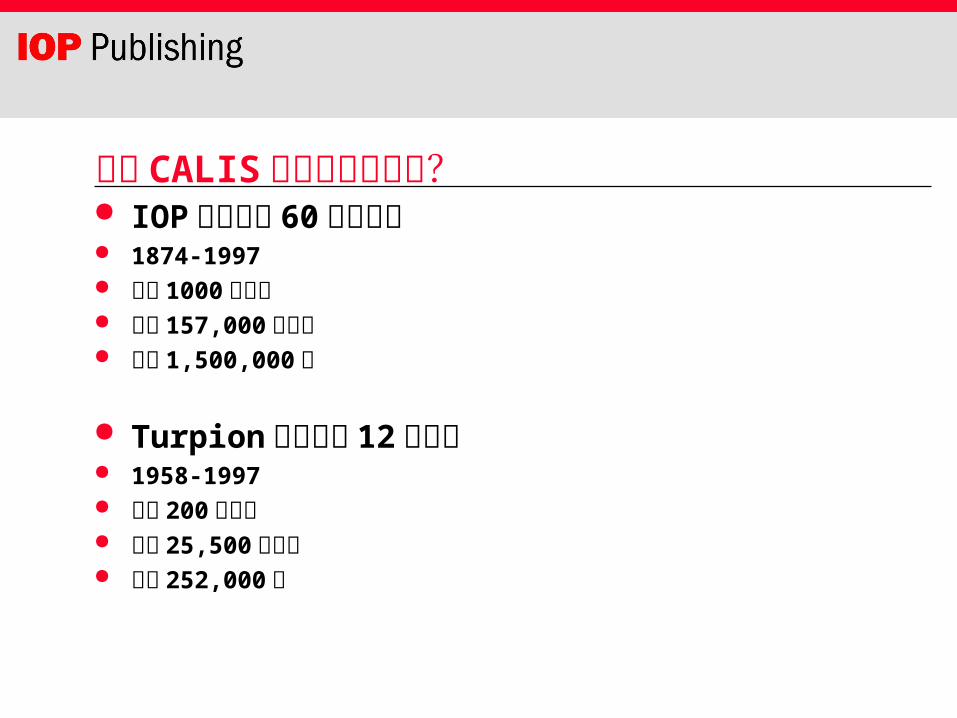
对于 CALIS增加了那些内容? IOP回溯文档 60多种过刊 1874-1997 超过 1000个卷次 超过 157,000篇文章 超过 1,500,000页
Turpion回溯文档 12种过刊 1958-1997 超过 200个卷次 超过 25,500篇文章 超过 252,000页
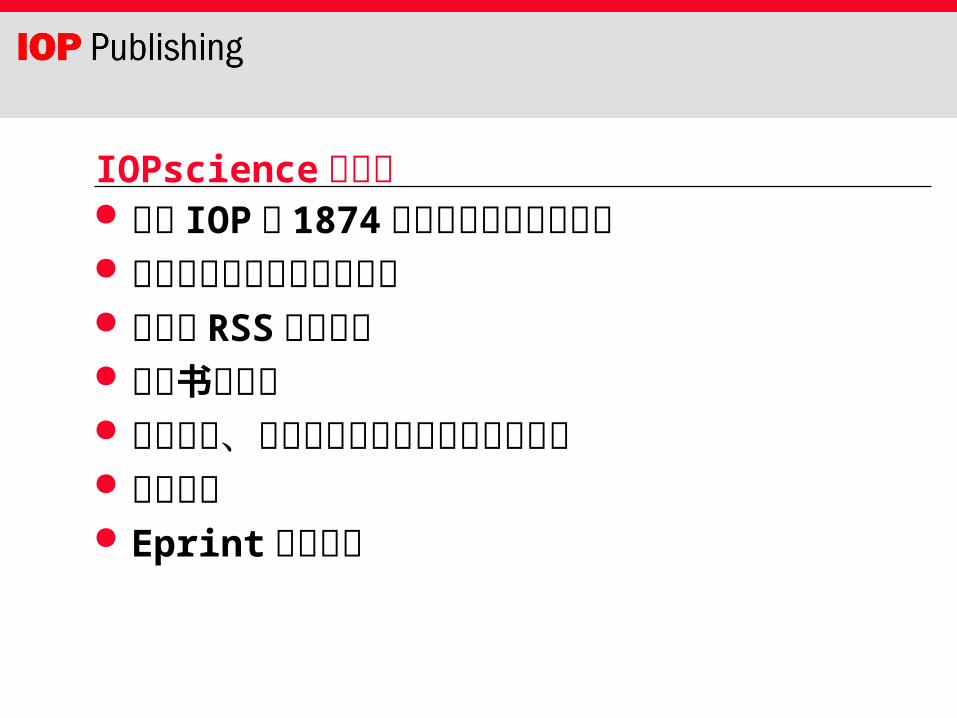
IOPscience的特点 提供 IOP从 1874年至今的所有期刊内容 有精确的检索结果筛选功能 动态的 RSS推送服务 共享书签功能 相关文献、参考文献及引用文献的链接功能 设置标签 Eprint检索结果

IOPscience的特点(续) 标签云图 利用 PACS及 MSC编码分类将所有文献组织成6000多种主题分类 (The Physics and Astronomy Classification Scheme(PACS)《物理天文学分类表》( 1000多个编码)和 Mathematics Subject Classification (MSC)《数学主题分类表》( 5000多个编码))
个性化设置 被标签的文章 保存的检索 下载过的文章保存 最新的文章提醒
IOPscience的访问方式
http://iopscience.iop.org
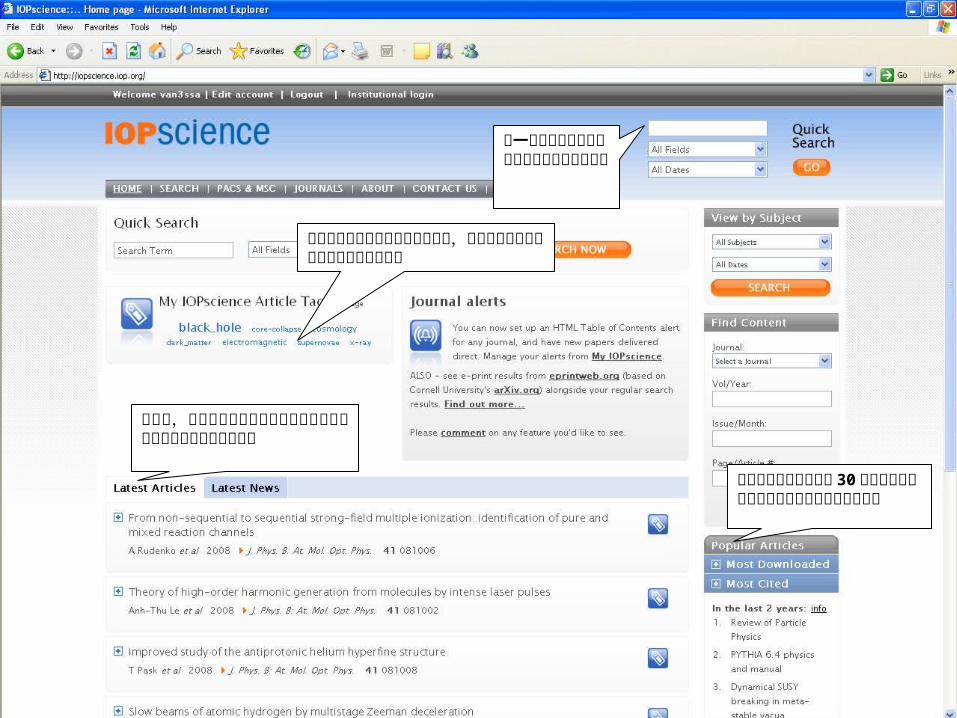
登陆时,这个区域会显示出个人在注册时所选择的学科类别的最新的文章
使用自己设置的个人帐号来登陆时,主页上会显示你之前设置的文章标签云图
这个区域显示的是最近 30天下载最多的文章和最近两年被引用最多的文章
每一页的右上角都可以看到我们的快速检索选项
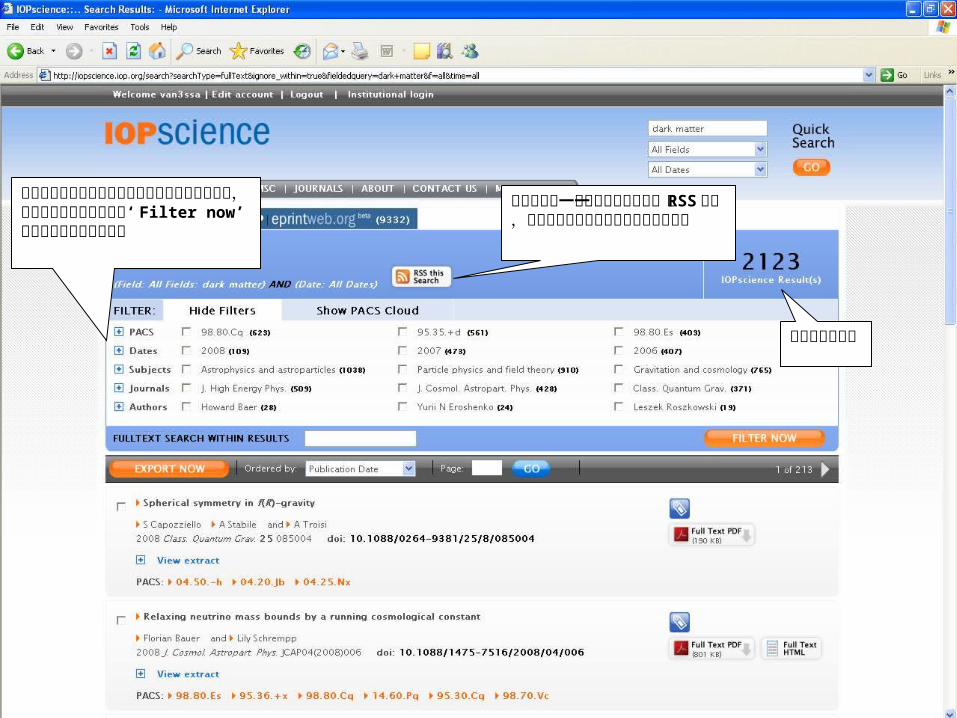
这个选项允许你使用这些分类来筛选你的检索结果,选择各个标准选项并点击‘ Filter now’就可以得到你的检索结果
可以在任何一个检索标准中创建一个 RSS推送,让最新的结果直接链接到你的电脑桌面
检索结果计数器
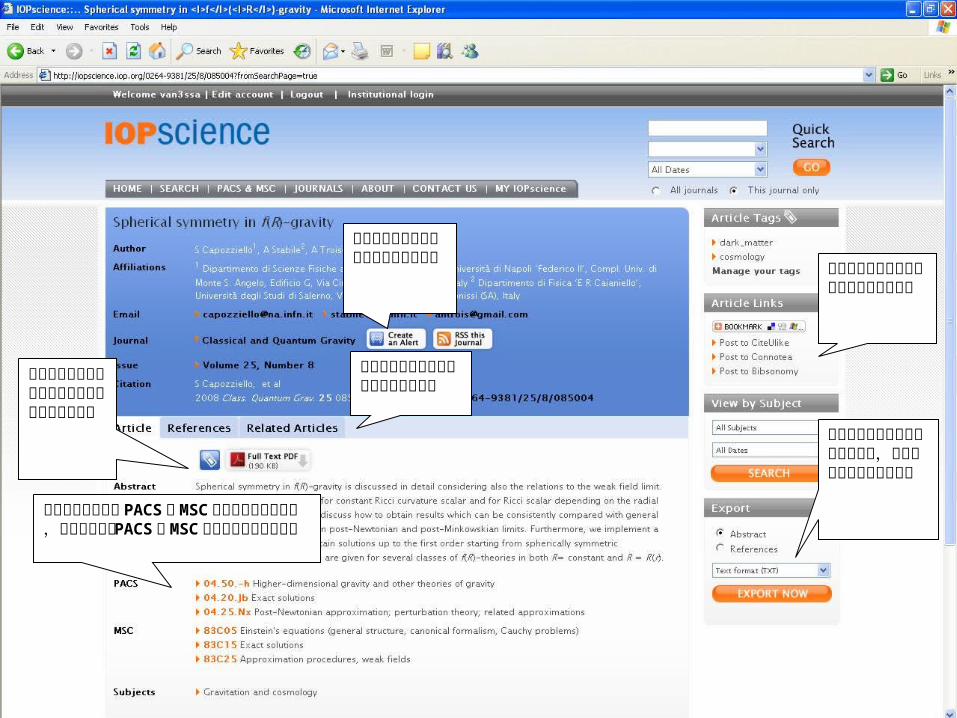
运用这个图标来增加你希望对此文章设置的任何标签
运用这个按钮来设置这个期刊的目录提醒
运用这些共享书签链接去分享感兴趣的文章
运用导出按钮来导出这篇文章文摘,引用的文章和被引用等信息
点击选项来查看引用文章和相关文章信息
绝大多数的内容被 PACS和 MSC分类编号进行了分类,允许用户运用 PACS或 MSC来进行文章查找和探究
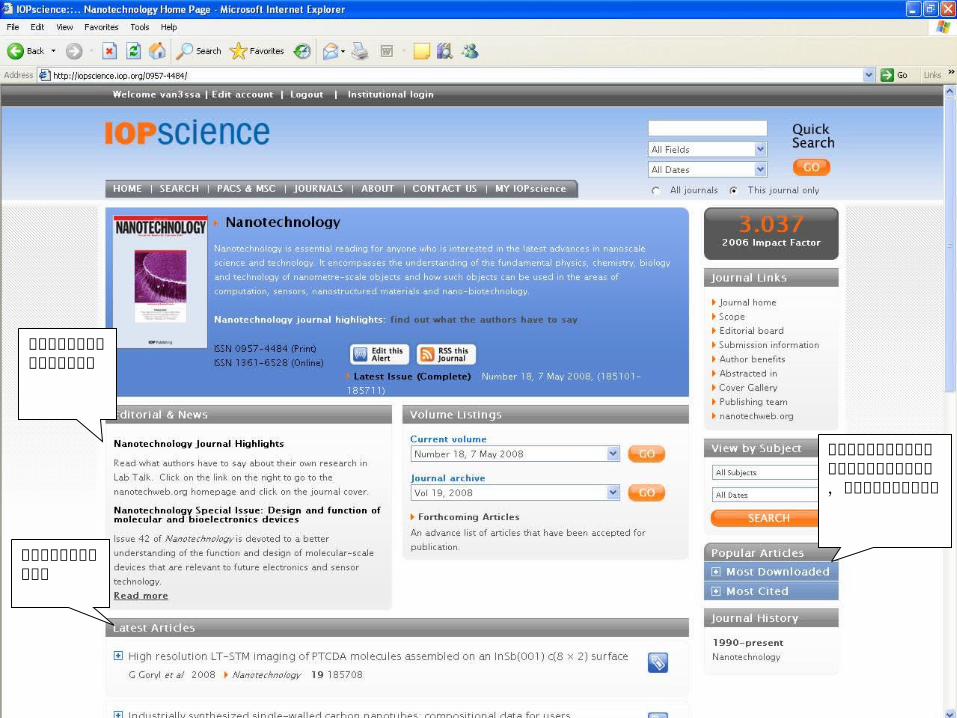
在这里你可以查看某个特定的期刊中下载次数最多,和被引次数最多的文章
最新的关于这个期刊的新闻和信息
这个期刊最新出版的文章
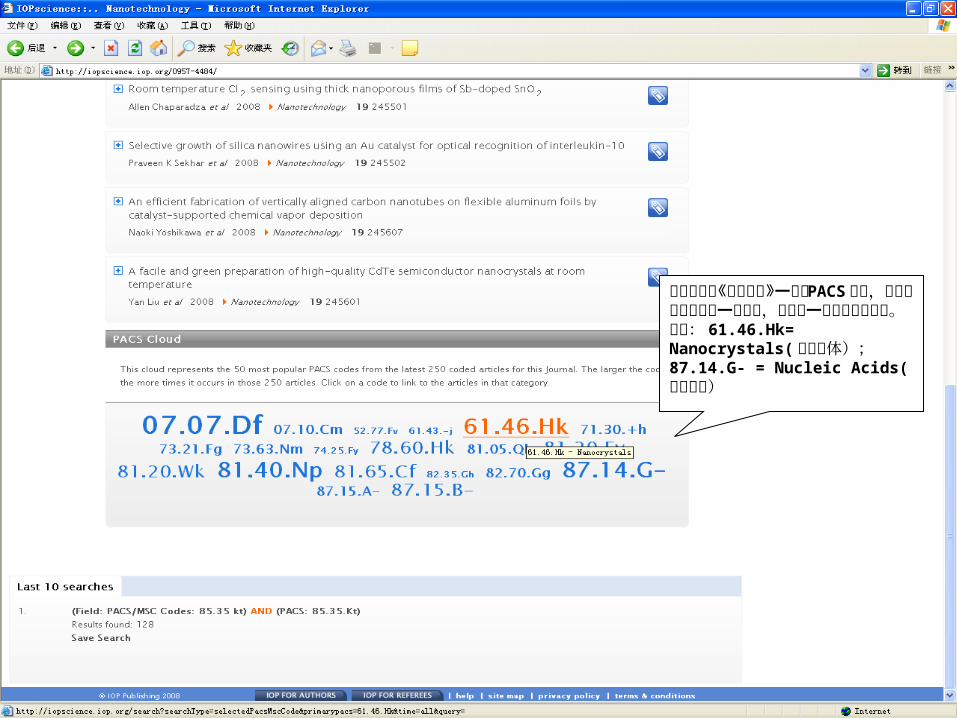
这里显示了《纳米技术》一刊的PACS云图,用户可以点击任何一个编号,得到这一编号对应的文章。比如: 61.46.Hk= Nanocrystals(纳米晶体);87.14.G- = Nucleic Acids(核酸探针)

好消息
CALIS-IOP集团 49家成员享受 8 个月的IOPscience免费试用: 2008年 5 月 1 日到 12月31日 ( 开通半个月,下载全文 24,000多篇)
其他成员可以从 2008年 9 月开始得到 3 个月的IOPscience免费试用
http://iopscience.iop.org
上机培训及座谈咨询会: 5 月 15日周四下午 16点到 17点 30分 第二培训教室:图书馆逸夫馆 204室
谢谢大家!
刘向立 中国区经理英国物理学会出版社北京市中关村南三街 8 号 中科院物理所 A 楼 512室 邮编: 100190电话: 010 87196798电子信箱: [email protected] www.iop.org