“ Handling Sugar and Sweeteners Intakes – Indian Experience” Rekha Sharma R.D Director,...
31
“Handling Sugar and Sweeteners Intakes – Indian Experience” Rekha Sharma R.D Director, Clinical Nutrition and Dietetics Diabetes Foundation ( INDIA) Former Chief Dietician All India Institute of Medical Sciences ,New Delhi, INDIA
-
Upload
matilda-singleton -
Category
Documents
-
view
215 -
download
1
Transcript of “ Handling Sugar and Sweeteners Intakes – Indian Experience” Rekha Sharma R.D Director,...
“Handling Sugar and Sweeteners
Intakes – Indian Experience” Rekha Sharma R.D
Director, Clinical Nutrition and Dietetics Diabetes Foundation ( INDIA)
Former Chief Dietician All India Institute of Medical Sciences ,New Delhi, INDIA
Science for Health , Diet and Life style
Four healthy lifestyle factors • No smoking• Maintaining a healthy weight• Exercising regularly • Healthy diet Together appear to be associated with
as much as an 80 percent reduction in the risk of developing the most common and deadly chronic diseases
Early awareness
• The roots of these factors often originate during the formative stages of life, it is especially important to start early in teaching the important lessons concerning healthy living.
• Schools should be a priority
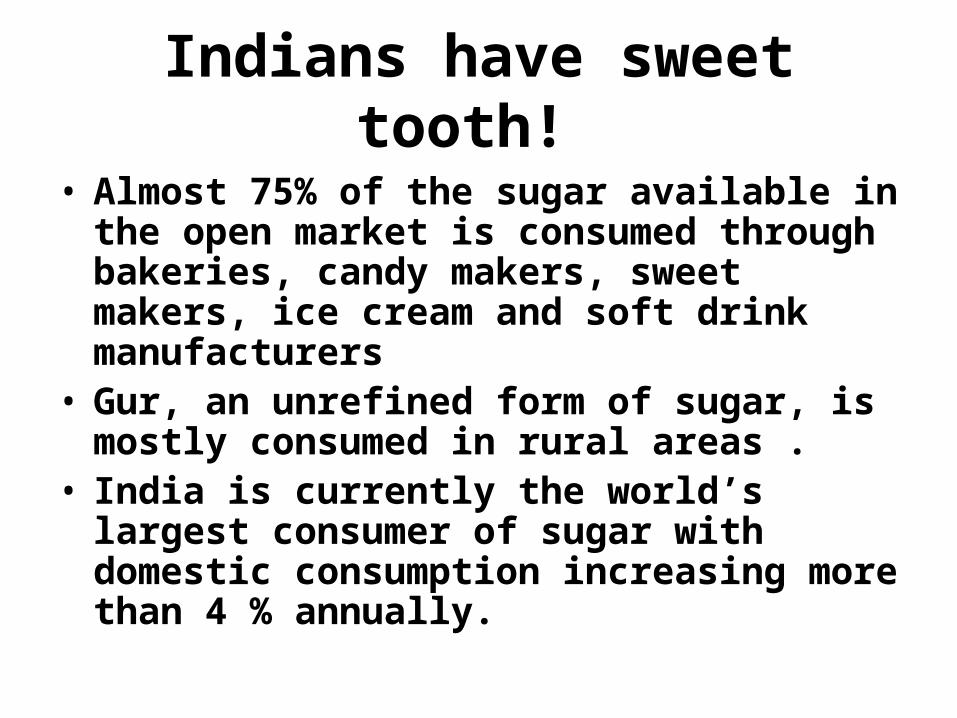
Indians have sweet tooth!
• Almost 75% of the sugar available in the open market is consumed through bakeries, candy makers, sweet makers, ice cream and soft drink manufacturers
• Gur, an unrefined form of sugar, is mostly consumed in rural areas .
• India is currently the world’s largest consumer of sugar with domestic consumption increasing more than 4 % annually.
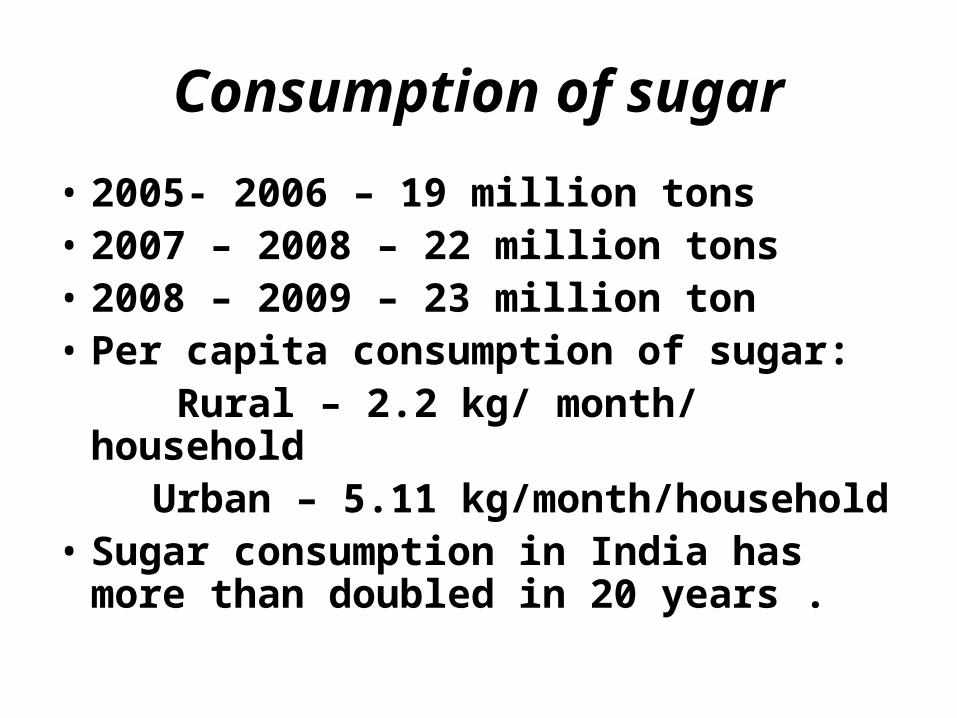
Consumption of sugar
• 2005- 2006 – 19 million tons• 2007 – 2008 – 22 million tons• 2008 – 2009 – 23 million ton• Per capita consumption of sugar: Rural – 2.2 kg/ month/ household Urban – 5.11 kg/month/household• Sugar consumption in India has more
than doubled in 20 years .
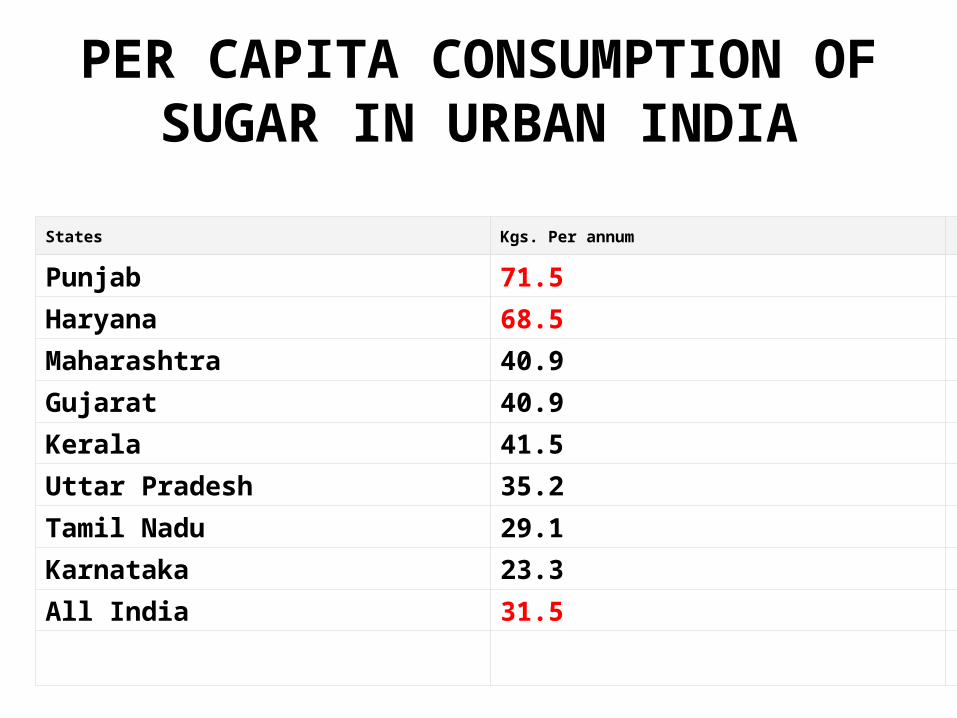
States Kgs. Per annum
Punjab 71.5
Haryana 68.5
Maharashtra 40.9
Gujarat 40.9
Kerala 41.5
Uttar Pradesh 35.2
Tamil Nadu 29.1
Karnataka 23.3
All India 31.5
PER CAPITA CONSUMPTION OF SUGAR IN URBAN INDIA
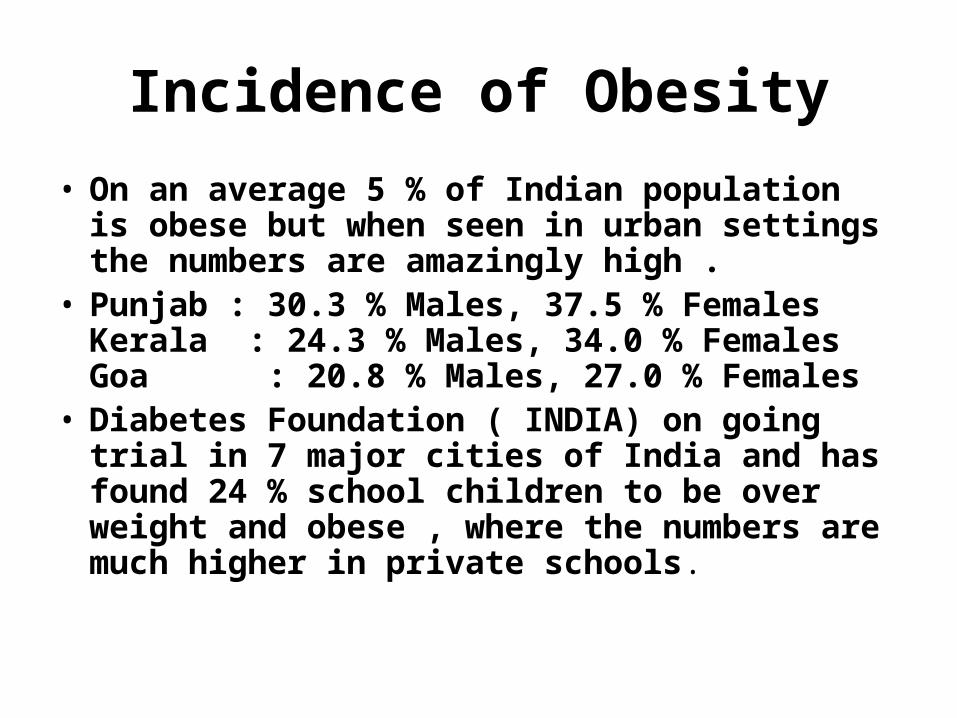
Incidence of Obesity
• On an average 5 % of Indian population is obese but when seen in urban settings the numbers are amazingly high .
• Punjab : 30.3 % Males, 37.5 % FemalesKerala : 24.3 % Males, 34.0 % FemalesGoa : 20.8 % Males, 27.0 % Females
• Diabetes Foundation ( INDIA) on going trial in 7 major cities of India and has found 24 % school children to be over weight and obese , where the numbers are much higher in private schools.
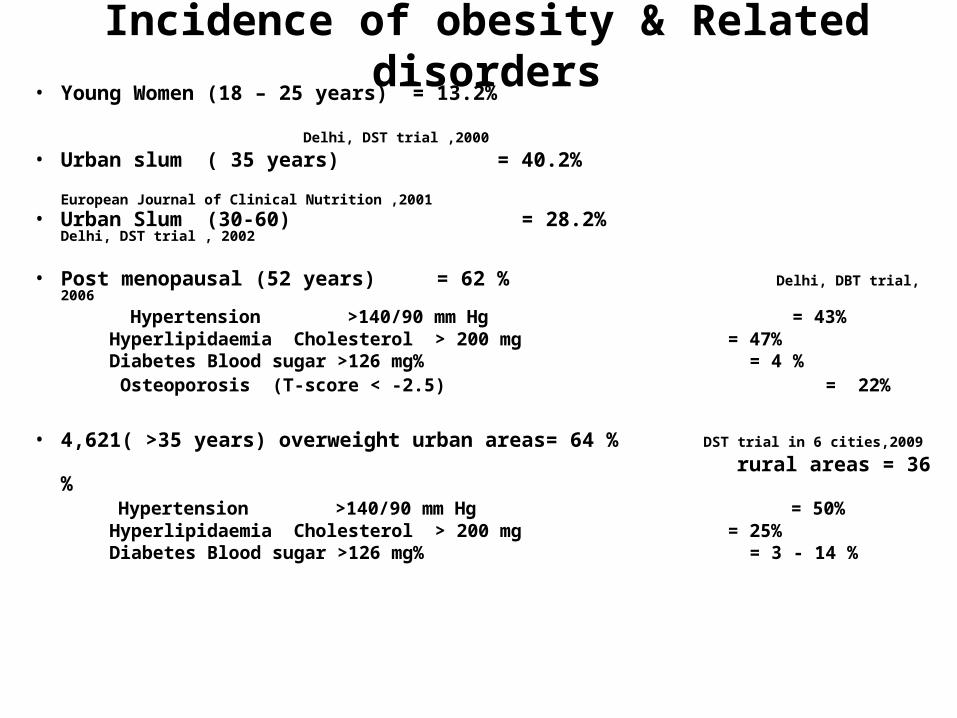
Incidence of obesity & Related disorders• Young Women (18 – 25 years) = 13.2% Delhi, DST trial ,2000
• Urban slum ( 35 years) = 40.2% European Journal of Clinical Nutrition ,2001
• Urban Slum (30-60) = 28.2% Delhi, DST trial , 2002
• Post menopausal (52 years) = 62 % Delhi, DBT trial, 2006
Hypertension >140/90 mm Hg = 43% Hyperlipidaemia Cholesterol > 200 mg = 47% Diabetes Blood sugar >126 mg% = 4 % Osteoporosis (T-score < -2.5) = 22%
• 4,621( >35 years) overweight urban areas= 64 % DST trial in 6 cities,2009
rural areas = 36 % Hypertension >140/90 mm Hg = 50% Hyperlipidaemia Cholesterol > 200 mg = 25% Diabetes Blood sugar >126 mg% = 3 - 14 %
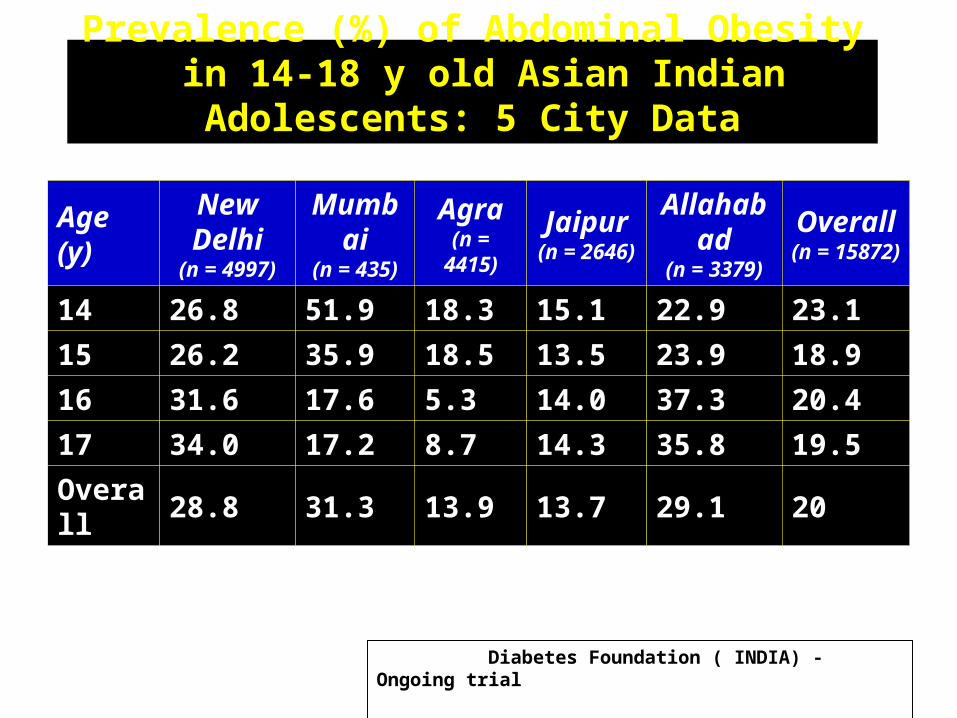
Age (y)New Delhi
(n = 4997)
Mumbai
(n = 435)
Agra(n = 4415)
Jaipur(n = 2646)
Allahabad
(n = 3379)
Overall(n = 15872)
14 26.8 51.9 18.3 15.1 22.9 23.1
15 26.2 35.9 18.5 13.5 23.9 18.9
16 31.6 17.6 5.3 14.0 37.3 20.4
17 34.0 17.2 8.7 14.3 35.8 19.5
Overall
28.8 31.3 13.9 13.7 29.1 20
Diabetes Foundation ( INDIA) - Ongoing trial
Prevalence (%) of Abdominal Obesity in 14-18 y old Asian Indian Adolescents: 5 City Data
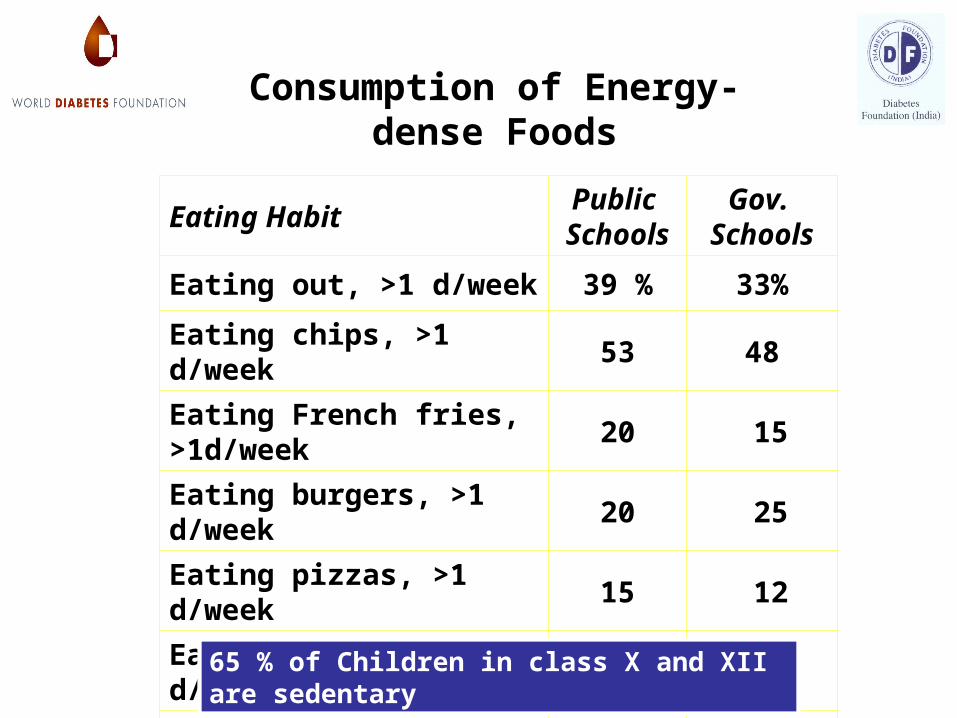
Eating HabitPublic Schools
Gov. Schools
Eating out, >1 d/week 39 % 33%
Eating chips, >1 d/week 53 48
Eating French fries, >1d/week
20 15
Eating burgers, >1 d/week 20 25
Eating pizzas, >1 d/week 15 12
Eating noodles, >1 d/week 44 50
Drinking colas, >1 d/week 36 35
Consumption of Energy-dense Foods
65 % of Children in class X and XII are sedentary
Un healthy Eating Habits
• Erratic eating habits• Frequent fast and fried food consumption• Excess intake of colas • Excess consumption of refined
foods• Not consuming enough fruits and vegetables
Sedentary Life style
• Low physical activity• No participation in active sports
activities• Long hours devoted to TV, computer, video games• Sitting in canteens/coffee shops • Taking automated vehicles for nearby destinations
Sedentary causes
• Hectic pace of life- long hours – desk jobs
• A major culprit is time spent in front of the television and computers.
• Increase in vehicles
• Reduced play areas and walking space
• Sedentary behaviour – school onwards
• House wives- more help
Causes of Obesity - WHO
• Energy imbalance between calories consumed on one hand, and calories expended on the other hand.
• A global shift in diet towards increased intake of energy-dense foods that are high in fat and sugars but low in vitamins, minerals and other micronutrients
• A trend towards decreased physical activity due to the increasingly sedentary nature of many forms of work, changing modes of transportation, and increasing urbanization.
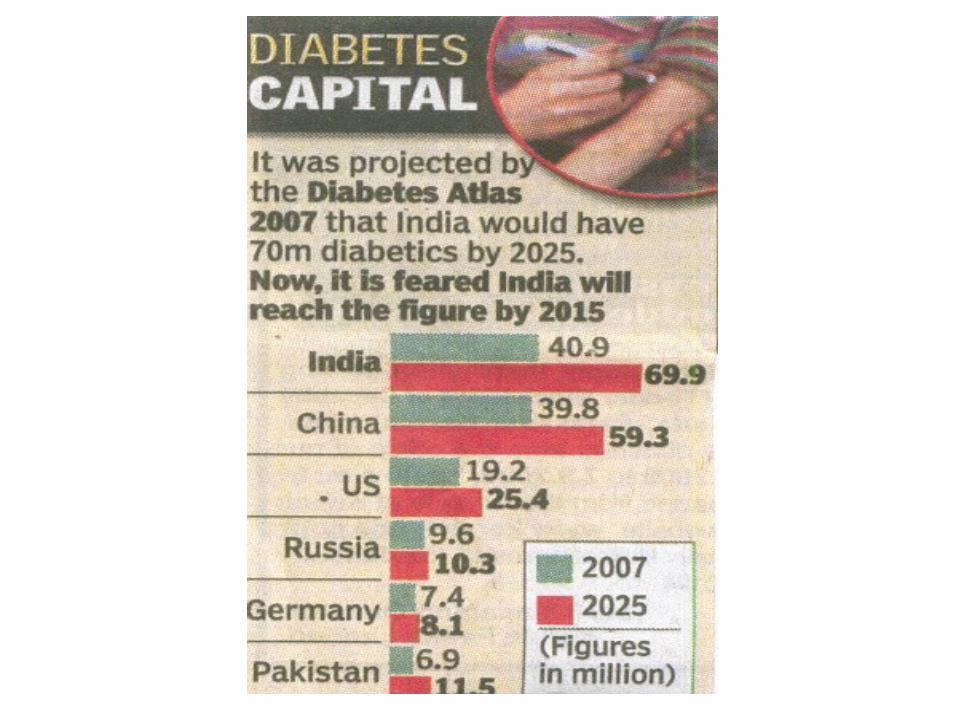
• Urbanization , sedentary life styles and excessive consumption of sugary foods along with increased fat consumption specially saturated fats is leading India to obesity . Obesity being the primary factor of type II Diabetes is leading India to become the diabetic capital of the world by 2030.

Incidence of Life style Diseases
• Heart disease : Rural: 5 – 6%
Urban: 9-10%. • Hypertension : Rural :5-8 %.
Urban : 15% • Diabetes : 6 – 12 %
Satisfying Sweet tooth
• Craving for sugar often translates into a tug-of-war; the urge to satisfy a sweet tooth versus the urge to resist empty calories.
• Artificial sweeteners are avoiding this .Indias artificial sweetener industry (estimated at Rs 60 crore) is also growing at a healthy 20 per cent annually.
• The Government of India has allowed the use of artificial sweeteners in around 25 food items. The items include carbonated water, soft drink concentrate, sugar/sugar free confectionery, chewing gums, biscuits, breads, cakes and pastries and some traditional sweets. ...
Artificial Sweeteners
• Table sugar to artificial sweeteners (like aspartame and saccharine) may be one way of achieving
• Stevia the worlds sweetest natural sweetener that has zero calories - lingering after-taste to this sweet herb. Stevia and its extracts are said to be completely diabetic-safe.
Low calorie sweeteners
• Sweetos is a low calorie, high intensity sweetener made from Fructo-Oligo-Saccharide and Sucralose.
• It is approved as a soluble fibre and helps to reduce serum LDL Cholesterol Levels.
• Fructo-Oligo-Saccharide is a very good Prebiotic, which helps to improve immunity and is a healthy sweetener for Diabetics - sweets, coffee and Tea, Baked Goods, Jams, Jellies, Sauces, Breakfast Cereals, Syrups, Soft Drinks and Ice Creams
Intense sweeteners
• When added to food, these low Calorie sweeteners provide a taste that is similar to that of table sugar (sucrose), and are generally several hundred to several thousand times sweeter than sugar.
• Because of their intense sweetening power, these sweeteners are used in very small amounts and thus add only a negligible amount of calories to foods and beverages.
Sweeteners and weight Management
• Non-nutritive sweeteners play a crucial role in weight management strategies. It is a difficult task to cut down 500 calories in a weight reduction diet. A reduction in direct sugar i.e. about 100 calories from the diet - by replacing it with an artificial sweetener is one-fourth the target achieved.
• Done daily for about 2 months, one has lost approximately 1 kg in weight.
• Improves the adherence to the diet program. Hence, the artificial sweeteners play a very important role in obesity as well as diabetes management.
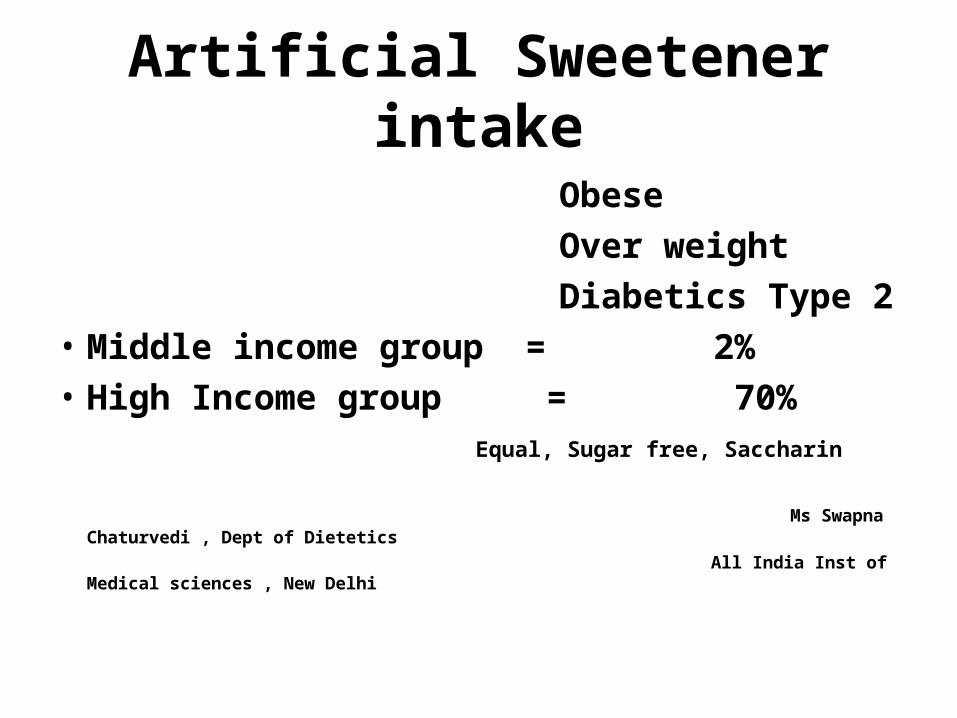
Artificial Sweetener intake
Obese
Over weight
Diabetics Type 2
• Middle income group = 2%
• High Income group = 70% Equal, Sugar free, Saccharin
Ms Swapna Chaturvedi , Dept of Dietetics
All India Inst of Medical sciences , New Delhi
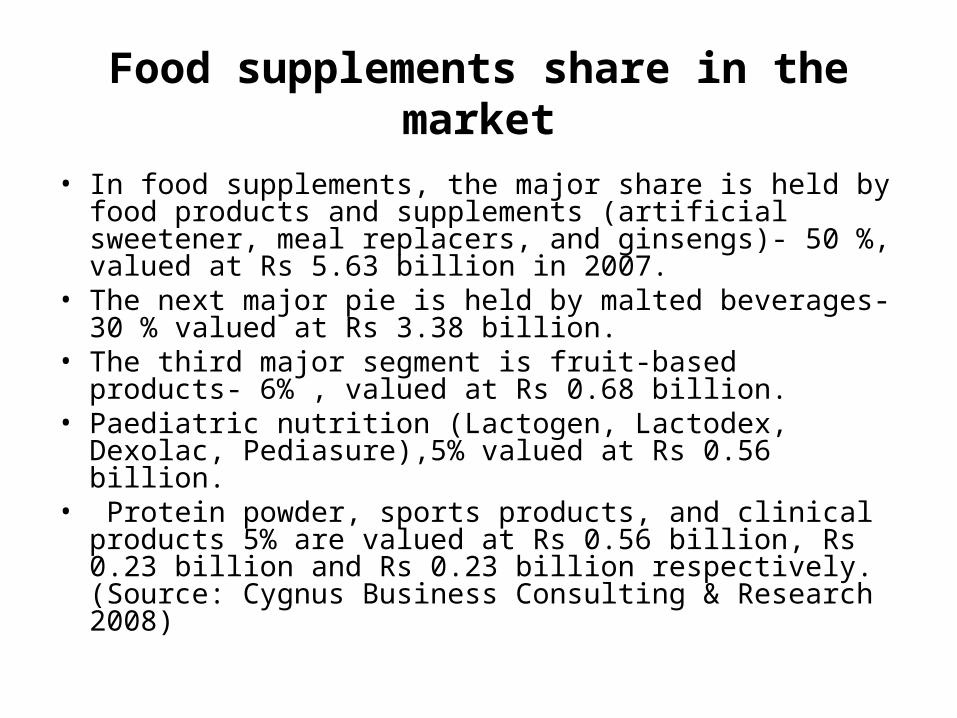
Food supplements share in the market
• In food supplements, the major share is held by food products and supplements (artificial sweetener, meal replacers, and ginsengs)- 50 %, valued at Rs 5.63 billion in 2007.
• The next major pie is held by malted beverages- 30 % valued at Rs 3.38 billion.
• The third major segment is fruit-based products- 6% , valued at Rs 0.68 billion.
• Paediatric nutrition (Lactogen, Lactodex, Dexolac, Pediasure),5% valued at Rs 0.56 billion.
• Protein powder, sports products, and clinical products 5% are valued at Rs 0.56 billion, Rs 0.23 billion and Rs 0.23 billion respectively. (Source: Cygnus Business Consulting & Research 2008)
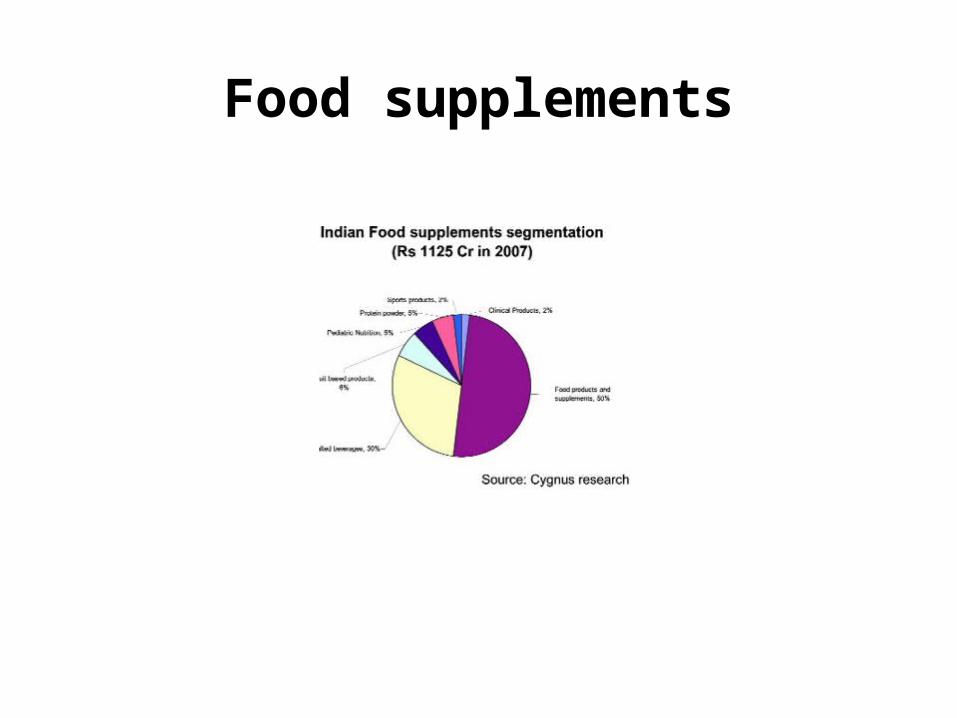
Food supplements
World Health Organization (WHO) • Nutrient and energy requirements vary between
individuals and are related to a person's age, sex, level of physical activity
• In India 70- 80 % of person's dietary energy is coming from carbohydrates including sugars .
• The calories from sugar are termed hollow calories as they lack proteins , vitamins and minerals .
• Healthy eating concept should reduce refined carbohydrates especially sugars and select healthy foods with whole grains and fiber .
• Fibre is important for gut function, and helps to reduce the risk of heart disease and some cancers and acts as a filler for weight reduction.
• Many studies have also shown that fruit and vegetables have beneficial effects on health. WHO recommends consuming around 400 g (five or six portions) a day.
Dietary guidelines for lifestyle modification-NIN
• Calories should be sufficient to maintain appropriate body weight for a given height.
• Carbohydrate should constitute 55-65% of calories with emphasis on complex carbohydrates.
• Proteins should provide around 10-15% of the total calories.
• Total fat intake should be between 15-30% of total calories.
• Cholesterol should not exceed 300mg/day in the diet.
• Saturated fat should be less than 10% of the total calories.
Dietary guidelines for lifestyle modification-NIN
• Polyunsaturated fat should not exceed 8% of the total calories.
• P/S ratio should be between 0.8-1.0.• Linoleic acid (N6) should range between 3-7% of the
calories.• Alpha-Linoleic acid (N3) should not be less than 1%
of calories.• LA/ALNA ratio should be between 5-10.• Sugars should be less than 10% of total calories and
should be kept minimum.• Salt intake should be between 5-7 g/day.• Dietary fibre should be around 40g/day.
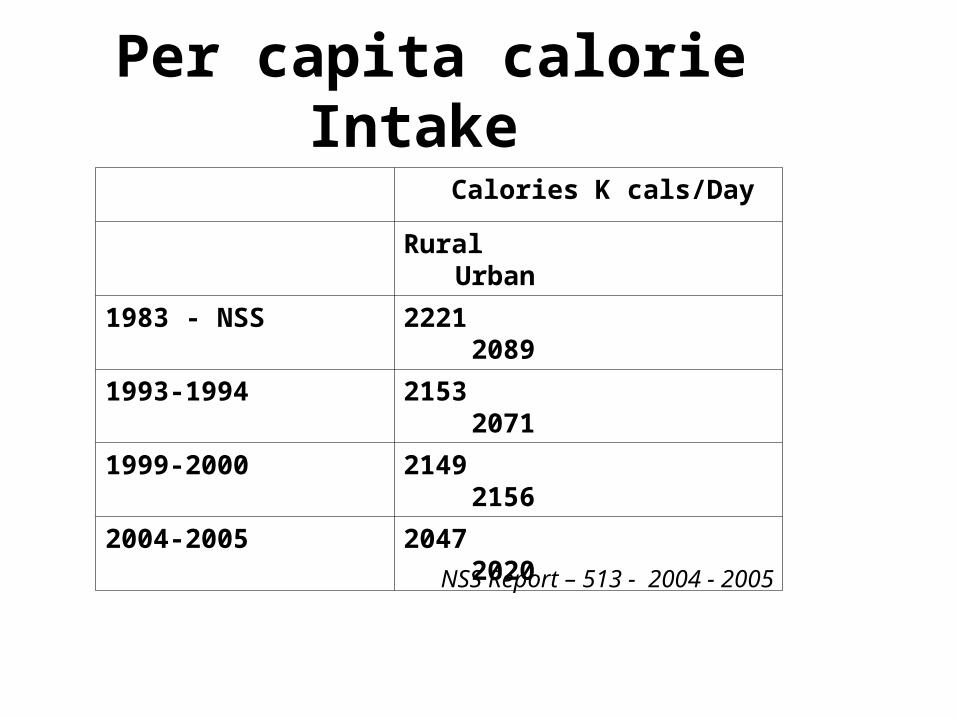
Per capita calorie Intake
Calories K cals/Day
Rural Urban
1983 - NSS 2221 2089
1993-1994 2153 2071
1999-2000 2149 2156
2004-2005 2047 2020
NSS Report – 513 - 2004 - 2005
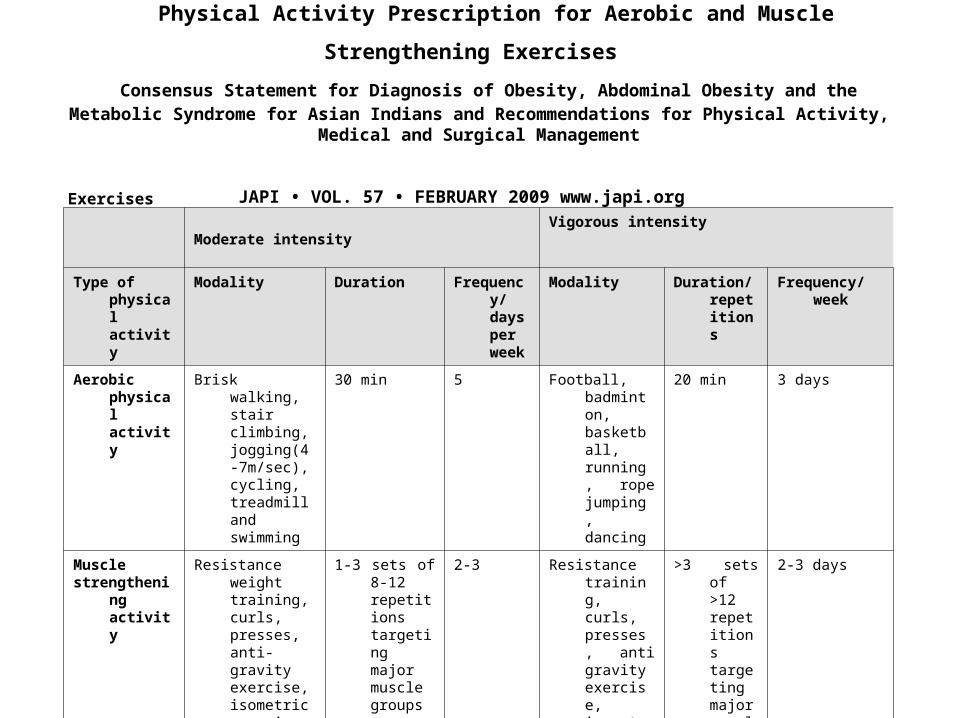
Exercises
Moderate intensityVigorous intensity
Type of physical activity
Modality Duration Frequency/ days per week
Modality Duration/ repetitions
Frequency/week
Aerobic physical activity
Brisk walking, stair climbing, jogging(4-7m/sec), cycling, treadmill and swimming
30 min 5 Football, badminton, basketball, running, rope jumping, dancing
20 min 3 days
Musclestrengthening
activity
Resistance weight training, curls, presses, anti-gravity exercise, isometric exercise
Children-Body weight activity (Pull ups)
1-3 sets of 8-12 repetitions targeting major muscle groups
2-3 Resistance training, curls, presses, anti gravity exercise, isometric exercise
Children- Body weight activity (Pull ups)
>3 sets of >12 repetitions targeting major muscle groups
2-3 days
Physical Activity Prescription for Aerobic and Muscle Strengthening Exercises
Consensus Statement for Diagnosis of Obesity, Abdominal Obesity and the Metabolic Syndrome for Asian Indians and Recommendations for Physical Activity, Medical and Surgical Management
JAPI • VOL. 57 • FEBRUARY 2009 www.japi.org