, F. BRUN , R.C.G. CHAVES , C. DEIL , H. GAST THE H.E.S.S ... · correlation radius, e.g. 0.1...
8
CHARTING THE TEV MILKY WAY: H.E.S.S. GALACTIC PLANE SURVEY MAPS, CATALOG AND SOURCE POPULATIONS S. CARRIGAN 1 , F. BRUN 1 , R.C.G. CHAVES 2,1 , C. DEIL 1 , H. GAST 3,1 AND V. MARANDON 1 FOR THE H.E.S.S. COLLABORATION 1 Max-Planck-Institut f¨ ur Kernphysik, P.O. Box 103980, D 69029 Heidelberg, Germany 2 DSM/Irfu, CEA Saclay, F-91191 Gif-Sur-Yvette Cedex, France 3 I. Physikalisches Institut B, RWTH Aachen University Very-high-energy (VHE, E>100 GeV) γ-rays provide a unique view of the non-thermal uni- verse, tracing the most violent and energetic phenomena at work inside our Galaxy and beyond. The latest results of the H.E.S.S. Galactic Plane Survey (HGPS) undertaken by the High Energy Stereoscopic System (H.E.S.S.), an array of four imaging atmospheric Cherenkov telescopes located in Namibia, are described here. The HGPS aims at the detection of cosmic accelerators with environments suitable for the production of photons at the highest ener- gies and has led to the discovery of an unexpectedly large and diverse population of over 60 sources of TeV gamma rays within its current range of l = 250 to 65 degrees in longitude and |b| < 3.5 degrees in latitude. The data set of the HGPS comprises 2800 hours of high-quality data, taken in the years 2004 to 2013. The sensitivity for the detection of point-like sources, assuming a power-law spectrum with a spectral index of 2.3 at a statistical significance of 5 σ, is now at the level of 2% Crab or better in the core HGPS region. The latest maps of the inner Galaxy at TeV energies are shown alongside an introduction to the first H.E.S.S. Galactic Plane Survey catalog. Finally, in addition to an overview of the H.E.S.S. Galactic source population a few remarkable, recently discovered sources will be highlighted. 1 Introduction The superior sensitivity of the latest generation of imaging atmospheric Cherenkov telescopes such as H.E.S.S. 1 , MAGIC 2 , and VERITAS 3 , has resulted in the discovery of numerous VHE γ -ray sources, and currently more than 140 sources are listed in the online TeV γ -ray catalogue TeVCat a . The High Energy Stereoscopic System (H.E.S.S.) in particular is ideally suited for undertaking a deep survey of our Galaxy, due to its high sensitivity, comparatively large field-of- view of 5 ◦ , and its angular resolution of ∼0.1 ◦ . Its location in the Khomas highlands of Namibia allows it a prime view of the inner Galaxy. Here we report on the status and latest results of the H.E.S.S. Galactic Plane Survey (HGPS), the deepest and most comprehensive survey of the inner Galaxy undertaken in VHE γ -rays so far. The latest maps are shown, alongside advanced methods for the suppression of cosmic-ray induced background. The construction of a software framework to detect and model sources of VHE γ -rays in the survey data set is introduced. The VHE γ -ray source population in our Galaxy is dominated by objects that are linked to the final stages in stellar evolution, namely pulsar wind nebulae (PWNe) and supernova remnants (SNRs). For nearly a third of the sources, however, no plausible counterpart at other energies has been found yet, or the physical origin of the detected emission remains unclear. A snap shot of our current understanding of the H.E.S.S. source population on the Galactic plane is shown, a http://tevcat.uchicago.edu/ arXiv:1307.4868v2 [astro-ph.HE] 19 Jul 2013
-
Upload
truongcong -
Category
Documents
-
view
213 -
download
0
Transcript of , F. BRUN , R.C.G. CHAVES , C. DEIL , H. GAST THE H.E.S.S ... · correlation radius, e.g. 0.1...
CHARTING THE TEV MILKY WAY: H.E.S.S. GALACTIC PLANE SURVEYMAPS, CATALOG AND SOURCE POPULATIONS
S. CARRIGAN1, F. BRUN1, R.C.G. CHAVES2,1, C. DEIL1, H. GAST3,1 AND V. MARANDON1 FORTHE H.E.S.S. COLLABORATION
1Max-Planck-Institut fur Kernphysik, P.O. Box 103980, D 69029 Heidelberg, Germany2DSM/Irfu, CEA Saclay, F-91191 Gif-Sur-Yvette Cedex, France
3I. Physikalisches Institut B, RWTH Aachen University
Very-high-energy (VHE, E>100 GeV) γ-rays provide a unique view of the non-thermal uni-verse, tracing the most violent and energetic phenomena at work inside our Galaxy andbeyond. The latest results of the H.E.S.S. Galactic Plane Survey (HGPS) undertaken by theHigh Energy Stereoscopic System (H.E.S.S.), an array of four imaging atmospheric Cherenkovtelescopes located in Namibia, are described here. The HGPS aims at the detection of cosmicaccelerators with environments suitable for the production of photons at the highest ener-gies and has led to the discovery of an unexpectedly large and diverse population of over 60sources of TeV gamma rays within its current range of l = 250 to 65 degrees in longitude and|b| < 3.5 degrees in latitude. The data set of the HGPS comprises 2800 hours of high-qualitydata, taken in the years 2004 to 2013. The sensitivity for the detection of point-like sources,assuming a power-law spectrum with a spectral index of 2.3 at a statistical significance of 5σ, is now at the level of 2% Crab or better in the core HGPS region. The latest maps ofthe inner Galaxy at TeV energies are shown alongside an introduction to the first H.E.S.S.Galactic Plane Survey catalog. Finally, in addition to an overview of the H.E.S.S. Galacticsource population a few remarkable, recently discovered sources will be highlighted.
1 Introduction
The superior sensitivity of the latest generation of imaging atmospheric Cherenkov telescopessuch as H.E.S.S. 1, MAGIC 2, and VERITAS 3, has resulted in the discovery of numerous VHEγ-ray sources, and currently more than 140 sources are listed in the online TeV γ-ray catalogueTeVCat a. The High Energy Stereoscopic System (H.E.S.S.) in particular is ideally suited forundertaking a deep survey of our Galaxy, due to its high sensitivity, comparatively large field-of-view of 5◦, and its angular resolution of ∼0.1◦. Its location in the Khomas highlands of Namibiaallows it a prime view of the inner Galaxy. Here we report on the status and latest results ofthe H.E.S.S. Galactic Plane Survey (HGPS), the deepest and most comprehensive survey of theinner Galaxy undertaken in VHE γ-rays so far. The latest maps are shown, alongside advancedmethods for the suppression of cosmic-ray induced background. The construction of a softwareframework to detect and model sources of VHE γ-rays in the survey data set is introduced.The VHE γ-ray source population in our Galaxy is dominated by objects that are linked to thefinal stages in stellar evolution, namely pulsar wind nebulae (PWNe) and supernova remnants(SNRs). For nearly a third of the sources, however, no plausible counterpart at other energieshas been found yet, or the physical origin of the detected emission remains unclear. A snap shotof our current understanding of the H.E.S.S. source population on the Galactic plane is shown,
ahttp://tevcat.uchicago.edu/
arX
iv:1
307.
4868
v2 [
astr
o-ph
.HE
] 1
9 Ju
l 201
3

3590123Galactic Longitude (deg)
-1
+0
+1
+2
Gala
ctic
Lati
tude (
deg)
3590123Galactic Longitude (deg)
-1
+0
+1
+2
Gala
ctic
Lati
tude (
deg)
Figure 1: Illustration of the different background estimation methods for image and spectral analysis, as well asthe challenges the high density of extended sources in the inner Galaxy poses. Exclusion regions (see Section 2for details) are shown as grey areas. The field-of-view of 2◦ radius is illustrated as green solid circles. Left panel:
The adaptive ring background technique. Right panel: The reflected region background technique.
as well as a few interesting examples of recent sources.
2 Maps
In the HGPS, the inner Galaxy has been systematically raster scanned using observation posi-tions with overlapping fields-of-view, with the main goal of discovering new VHE γ-ray sourcesand enabling population studies of Galactic source classes as a consequence. Advanced analysistechniques for background suppression 4,5,6,7 play a very important role in the data analysis.After calibration and quality selection, a multi-variate analysis technique 4 based on extensiveair shower and image shape parameters is used to discriminate γ-ray-like events from cosmic-ray-induced showers. A minimum image amplitude of 160 photoelectrons is required.
To generate maps, the remaining background is estimated locally by the ring backgroundtechnique 8, where for each trial source position (red filled circles) in the field-of-view (of 2◦
radius, green circle) the background is estimated from a ring centered on this position (blueshaded circles), as shown in the left panel of Figure 1. Regions on the sky containing knownVHE γ-ray sources (grey areas) are excluded from background estimation. These exclusionregions are automatically generated from significance maps which are smoothed with a top-hatfunction with radii of 0.1◦, 0.2◦ and 0.4◦, by thresholding them at the level of 5σ and dilatingeach excluded pixel by a further 0.1◦ (small exclusion regions, dark grey) or 0.3◦ (large exclusionregions, light grey). For the small exclusion regions, the resulting maps for 0.1◦ and 0.2◦ radiusare added, excluding all significant emission from the background but cutting quite close tothe edges of sources. For the large exclusion regions, the resulting maps for 0.1◦, 0.2◦ and 0.4◦
radius are added, cutting away more of any emission that is possibly extending into the areafor background estimation. The resulting large exclusion regions, used for the production ofmaps, turn out to cover areas of the sky that are comparatively large on the scale of the sizeof the field-of-view. Therefore, as illustrated in the left panel of Figure 1, the ring radius isadaptively enlarged when a large fraction of the ring area overlaps with an excluded region,until an appropriate ring of the same thickness is reached. The statistically significant value foreach position is then calculated9, by summing the candidate events within a fixed and predefined
correlation radius, e.g. 0.1◦ (suitable for point-like sources), and comparing to the estimatedbackground level at that position. Figure 5 shows the latest significance map obtained for thesurvey region.
Figure 6 depicts the current sensitivity to VHE γ-ray sources, as an example for point-likesources emitting a power-law spectrum with index 2.3 and located at a Galactic latitude of b= −0.3◦, the approximate average among known Galactic sources. The sensitivity is below 2%Crab for practically all of the longitude range l = 283◦ to 59◦ at this latitude. This can also beseen in a slice of this map, shown in Figure 4.
3 Source catalog
Using the H.E.S.S. survey maps as input, we have implemented a pipeline to generate a sourcecatalog, which will be published alongside with the maps. The aim is to have detection criteriaas well as morphological and spectral analysis as uniform as possible, to make this source cataloguseful for the astronomical community to compare to data from other wavelengths, e.g. Fermi b
or HAWK c, for radio or X-ray data, as well as Galactic source population studies and diffuseemission measurements.
To construct the catalog, we use a likelihood fit of the H.E.S.S. counts map taking theexposure and point spread function as well as the estimated background into account. Toacknowledge the fact that most sources in the H.E.S.S. Galactic plane survey region have beenfound to be extended, we are producing an extended source catalog by modelling the excess as thesuperposition of symmetric Gauss-shaped sources. The Gauss shape is not physically motivated,it was chosen as one commonly used empirical shape in the absence of an expected sourcemorphology model. Figure 2 displays the fitting process. In the left panel a significance map ofthe Kookaburra region and HESS J1427−608 is shown, while the middle and right panel showa 2 sources model and 3 sources fit model, respectively, alongside with their resulting residualmaps. The 3 sources solution, i.e. the Kookaburra region splitting up into the two sourcesHESS J1420−607 and HESS J1418−609, is significantly better. Indeed it is believed that theemission from HESS J1420−607 and HESS J1418−609 is produced by two different, large-offsetPWNe, K3 powered by the high-spin down pulsar PSR J1420−6048 in case of HESS J1420−607,and the Rabbit or R2, in case of HESS J1418−609 14. The third source, HESS J1427−607, isslightly extended and so far could not be identified with a counterpart such as an SNR orPWN 15.
For H.E.S.S. the background is dominated by the small fraction of hadronic air showersthat cannot be distinguished from gamma-ray-induced air showers. After source detection andsubsequent estimation of source position and extension, for each catalog source a circular sourceregion containing most of the emission according to the best-fit source model excess map ischosen, and the spectral analysis is run independently of the maps. The measurement of spectrais done by using the reflected background method 8 (see right panel of Figure 1). In this method,multiple background regions (OFF regions, blue filled circles) arranged in a circle are used foreach trial source position (ON region, red filled circle), where each OFF region has the samesize and shape as the ON region and an equal offset to the observation, or pointing, position.Due to the equal offset of ON and OFF regions from the pointing direction of the system, noradial acceptance correction is required with this method, making it ideal for spectral analysis.Figure 1 also illustrates the motivation behind using two different sets of exclusion regions, asthe large exclusion regions can be too large to allow for spectral extraction in many cases, andthe small exclusion regions are used instead.
The difficult part about the catalog construction is the high source density in the innerGalaxy. There are several regions of multi-degree-scale excess along the Galactic plane where
bhttp://fermi.gsfc.nasa.govchttp://www.hawc-observatory.org

313.0313.5314.0314.5Galactic Longitude (deg)
-00.5
+00.0
+00.5
+01.0G
ala
ctic
Lati
tude (
deg)
Significance
HESS J1418-609
HESS J1420-607
HESS J1427-608
2-source model 2-source residual
3-source model 3-source residual
Figure 2: Iterative process of the source fitting in the Kookaburra region. Significance map (left) and model andresidual images (small pictures on the right). It can be seen that the 3-source solution leaves a flat residual map
and is therefore preferred.
it is not obvious how to best represent them in an extended source catalog. Therefore we areinvestigating e.g. adding a criterion to the catalog construction method that prevents large andbright sources from decomposing into multiple, strongly overlapping components.
4 Galactic source population and recent discoveries
To date, 67 sources are listed in the catalog of published H.E.S.S. sourcesd. Figure 3 shows a piechart of the H.E.S.S. Galactic source population, status February 2013, where the source classi-fication is taken from TeVCat e. While the largest source class are pulsar wind nebulae (PWN,orange), followed by supernova remnants, either interacting with a molecular cloud (SNR MC,yellow) or exhibiting emission from their shell (SNR Shell, light green), there are to date onlya few massive stellar clusters (dark red) and binary systems (light blue) identified as H.E.S.S.sources. A large part of the H.E.S.S. source population remains ambiguous, therefore Uniden-tified (dark blue). It should be noted that with further multi-wavelength data the distributionof this chart will likely change, not only will sources migrate from being unidentified to anothersource class, but in some cases possibly even between the defined source classes. Therefore thischart represents our knowledge at this point in time.
An example of a previously unidentified source that has now been identified as a PWN isHESS J1303−631, which was the first source classed as unidentified for H.E.S.S. Significantenergy-dependent morphology of this source, as well as the identification of an associated X-rayPWN from XMM-Newton observations enable identification of the VHE source as an evolvedPWN associated with the pulsar PSR J1301−6305 10.
W49B is an SNR interacting with a molecular cloud, located in the W49 region. W49Bhas one of the highest surface brightnesses in radio of all the SNRs of this class in our Galaxyand is one of the brightest ejecta-dominated SNRs in X-rays. Infrared observations evidencedthat W49B is interacting with molecular clouds and Fermi reported the detection of a coinci-dent bright, high-energy γ-ray source 11. H.E.S.S. detected significant emission from the W49region, compatible with VHE emission from the SNR W49B 12. The position of the emission iscompatible with the brightest part of the radio emission from the SNR as well as with the GeVemission. Energy spectra in the GeV and TeV bands are in very good agreement. Given the
dhttp://www.mpi-hd.mpg.de/hfm/HESS/pages/home/sources/ehttp://tevcat.uchicago.edu/

Figure 3: Galactic H.E.S.S. sources, status February 2013, classifications taken from TeVCat. Pulsar wind nebulae(PWN, orange) are the largest source class with ∼35%, followed by supernova remnants, either interacting with amolecular cloud (SNR MC, yellow, ∼13%) or exhibiting emission from their shell (SNR Shell, light green, ∼8%).Besides a few massive stellar clusters (dark red, ∼6%) and some binary systems (light blue, ∼4%) a large partof the H.E.S.S. source population remains unidentified (dark blue, ∼31%). ’Other’ (dark green) comprises the
globular cluster Terzan 5 and the high-frequency peaked BL Lac object HESS J1943+213.
very high GeV luminosity, the GeV-TeV connection, and the fact that the SNR is interactingwith a dense molecular cloud, a hadronic emission scenario is favored in the case of W49B.
Finally, HESS J1641−463 is an example for a source that remains unidentified, despiteof the existence of multi-wavelength data 13. It is found within the bounds of a radio SNR,however, the existing X-ray observations do not provide additional support to this scenario dueto the lack of detection of an extended X-ray feature at the position of HESS J1641−463. Inaddition, the larger extension of the SNR G338.5+0.1 as compared to the H.E.S.S. source, andthe relatively old age of the SNR inferred from its physical size suggests that the emission mightnot be necessarily connected with the SNR but rather with a PWN at its center, driven by anyet undetected pulsar. Due to its small size, compatible with a point-like source for H.E.S.S.,the possibility that HESS J1641−463 is a binary system cannot be excluded.
5 Outlook
After nearly a decade of observing the Southern sky, H.E.S.S. is ending its surveying programof the Galactic Plane. With the additional, much larger fifth Cherenkov telesope in the centreof the H.E.S.S. array, H.E.S.S. is entering phase II and will concentrate on deeper observationswith improved sensitivity and angular resolution. Here we have shown the latest results of theHGPS and an overview over the H.E.S.S. Galactic source population. We aim to present theentire data set of the HGPS, in the form of maps and a catalog, and to make it accessible toastronomers. With this large data set, population studies in the VHE range become possiblefor the first time.

60 40 20 0 340 320 300 280 260Galactic Longitude (deg)
0.5
1.0
1.5
2.0
2.5
Poin
t Sourc
e S
ensi
tivit
y (
% C
rab)
Figure 4: Profile of the sensitivity map (refer to Figure 6) for b=−0.3◦.
Acknowledgments
The support of the Namibian authorities and of the University of Namibia in facilitating theconstruction and operation of H.E.S.S. is gratefully acknowledged, as is the support by theGerman Ministry for Education and Research (BMBF), the Max Planck Society, the FrenchMinistry for Research, the CNRS- IN2P3 and the Astroparticle Interdisciplinary Programme ofthe CNRS, the U.K. Science and Technology Facilities Council (STFC), the IPNP of the CharlesUniversity, the Polish Ministry of Science and Higher Education, the South African Departmentof Science and Technology and National Research Foundation, and by the University of Namibia.We appreciate the excellent work of the technical support staff in Berlin, Durham, Hamburg,Heidelberg, Palaiseau, Paris, Saclay, and in Namibia in the construction and operation of theequipment.
References
1. J.A. Hinton, New Astron. Rev. 48, 331 (2004).2. J. Aleksic et al., Astropart. Phys. 35, 435 (2012).3. T. Weekes et al., Astropart. Phys. 17, 221 (2002).4. S. Ohm et al., Astropart. Phys. 31, 383 (2009).5. M. de Naurois and L. Rolland, Astropart. Phys. 32, 231 (2009).6. A. Fiasson et al., Astropart. Phys. 34, 25 (2010).7. Y. Becherini et al., Astropart. Phys. 34, 858 (2011).8. D. Berge, S. Funk and J. Hinton, Astron. & Astrophys. 466, 1219 (2007)9. T. Li and Y. Ma, Astrophys. Journal 272, 317 (1983).
10. A. Abramowski et al., arXiv:1210.651311. A. A. Abdo et al., Astrophys. Journal 722, 1303A (2010)12. F. Brun et al., arXiv:1104.500313. I. Oya et al., arXiv:1303.097914. F. Aharonian et al., Astron. & Astrophys 456, 245 (2006)15. F. Aharonian et al., Astron. & Astrophys 477, 353 (2008)
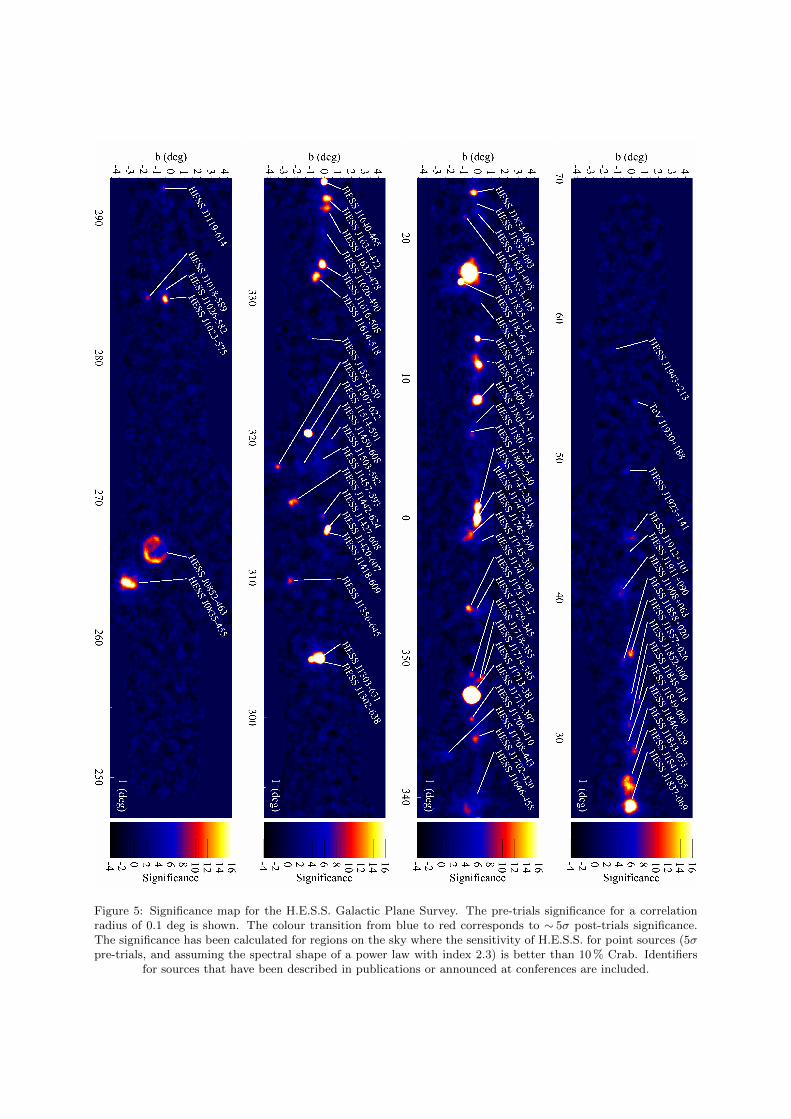
Figure 5: Significance map for the H.E.S.S. Galactic Plane Survey. The pre-trials significance for a correlationradius of 0.1 deg is shown. The colour transition from blue to red corresponds to ∼ 5σ post-trials significance.The significance has been calculated for regions on the sky where the sensitivity of H.E.S.S. for point sources (5σpre-trials, and assuming the spectral shape of a power law with index 2.3) is better than 10 % Crab. Identifiers
for sources that have been described in publications or announced at conferences are included.
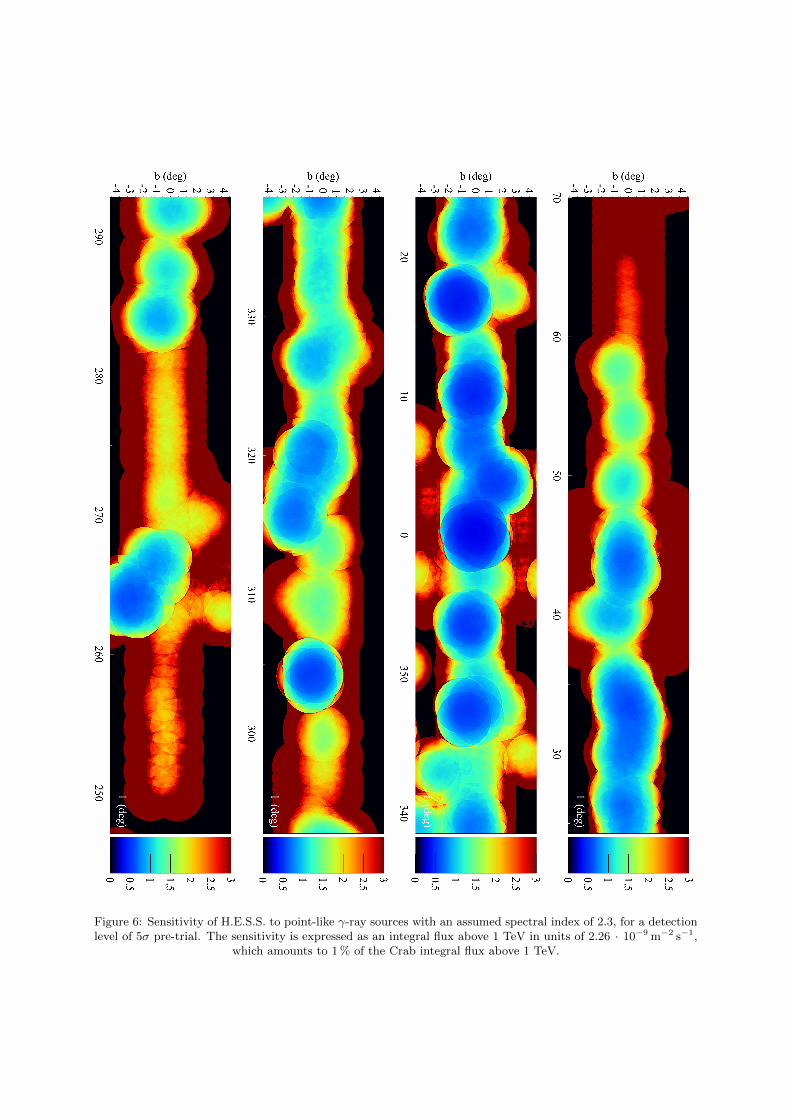
Figure 6: Sensitivity of H.E.S.S. to point-like γ-ray sources with an assumed spectral index of 2.3, for a detectionlevel of 5σ pre-trial. The sensitivity is expressed as an integral flux above 1 TeV in units of 2.26 · 10−9 m−2 s−1,
which amounts to 1 % of the Crab integral flux above 1 TeV.