“ Delaying or accelerating the degenerative diseases of aging ” MCB 135K Lecture 4, Chapters 5 & 6
date post
21-Dec-2015Category
view
215download
2
“Delaying or accelerating the degenerative diseases of aging”
MCB 135KLecture 4, Chapters 5 & 6Dr. Bruce N. Ames1/30/08
Dr. Ames is a member of the National Academy of Sciences. He was a member of the National Cancer Advisory Board and Cancer Institute for many years . He received several medals, such as the Gold Medal Award of the American Institute of Chemists, the Medal of the City of Paris, and many others.
To read more about Dr. Ames’ accomplishments and contributions to the study of aging and longevity, please see:
http://www.bruceames.org/http://www.chori.org/Principal_Investigators/Ames_Bruce/ames_overview.html
“Research found that a central factor in aging is the decay of the mitochondria in cells”

Bruce N. AmesChildren’s Hospital Oakland Research InstituteProfessor, University of California, Berkeley
Delaying (or Accelerating) the Degenerative Diseases of Aging
O2 O2-
e- e- e- e-
H2O2 •OH H2O
30 Jan ‘08Timiras class

Estimated oxidative DNA adducts per rat liver cell
0
Old (26-mo)
Young (4-mo)
70,000
60,000
50,000
40,000
30,000
20,000
10,00024,000
67,000

Source: E. Stadtman, Science 257, 1220-1224 (1992)
carbonyl content(nmol/mg protein)
carbonyl content(nmol/mg protein)
6
5
4
3
2
2
1
0
1000
Years
20 40 60 80
Months
3 12 20 26 *

MDA (pmol/mg
protein)
Young
Old
160
140
120
100
80
60
40
20
0
Brain Liver Heart Kidney Lung
* *
*
**
6

Proc. Natl. Acad. Sci. USAVol. 91, pp. 10771-10778, November 1994
Review
Oxidative damage and mitochondrial decay in aging (bioenergetics / mitochondrial DNA / cardiolipin / acetyl-L-carnitine / neurodegeneration)
Mark K. Shigenaga, Tory M. Hagen, and Bruce N. Ames*Division of Biochemistry and Molecular Biology, 401 Barker Hall, University of California, Berkeley, CA 94720
Contributed by Bruce N. Ames, July 27, 1994

MitochondrialMatrix
Cellular Cytoplasm
Mitochondrial Outer MembraneMitochondrial Outer Membrane
Inner MembraneInner Membrane
IntermembraneSpace
VV
IIIIII
IIIIIIIVIV
CytCCytCCoQCoQ
HH++
PyruvateDehydrogenasecomplex
Citrate Synthase
-Ketoglutarate Dehydrogenase
Complex
Fumarate
L-Malate
Oxaloacetate
Acetyl-Co-A Citrate Isocitrate
-Ketoglutarate
Succinyl-Co-A
Succinate
FADFADH2
CITRICACID
CYCLE
H2OO2 ADP
ATP
ATP
NADH
NADH
NADH
NAD+
NADHNADH
HH++
HH++
HH++ HH++
HH++HH++HH++
HH++
HH++HH++
HH++ HH++HH++
HH++
HH++
HH++
HH++ HH++HH++
HH++
HH++
HH++
9

Mitochondria from old rats compared to those from young rats:
1) Lower Cardiolipin
2) Lower Membrane Potential
3) Lower Oxygen Utilization
4) Increased Oxidant Leakage
Cardiolipin Levels in 3 and 24 Month Old Rat Hepatocytes
Ca
rdio
lipin
(µ
g p
er 1
06 C
ells
) 30
20
10
0Young Old
10
**

R123 Fluorescence in old and young rat hepatocytes
Fluorescence/cell
No
rma
l ce
ll n
umbe
r
0.03
Young
1000100100.00
0.01
0.02
Old
11

L-Carnitine/Acetyl-L-Carnitine (ALCAR)
• Mediates the ratio of acetyl-CoA/CoA
• Decreases with age in plasma and in brain
• Improves cognitive function in rats12
• Transports long-chain fatty acids into mitochondria
• Removes short- and medium-chain fatty acids that accumulate

Effect of ALCAR Supplementation on Cardiolipin Levels
Young
Ca
rdio
lipin
(µ
g p
er 1
0 c
ells
) 30
20
10
0
14
+ ALCAR
Old
**

R123 Fluorescence in Young and Old Rat Hepatocytes
YOUNG
OLD
WITHALCAR
WITHALCAR
NOALCAR
NOALCAR
No
rma
lize
d C
ell
Nu
mb
er
No
rma
lize
d C
ell
Nu
mb
er

R--Lipoic Acid (LA) in mitochondria
• LA reduced to dihydrolipoic acid, a potent antioxidant, & chelator of Fe & Cu• Coenzyme of pyruvate and -ketoglutarate dehydrogenases• Involved with carbohydrate utilization for ATP production
15

Lipoic Acid Lowers Mitochondrial Oxidants in Old Rats
Fl.
Un
its
/O2 C
on
sum
ed p
er M
inu
te
20
10
0Young Old
+ LA
+ LA
**
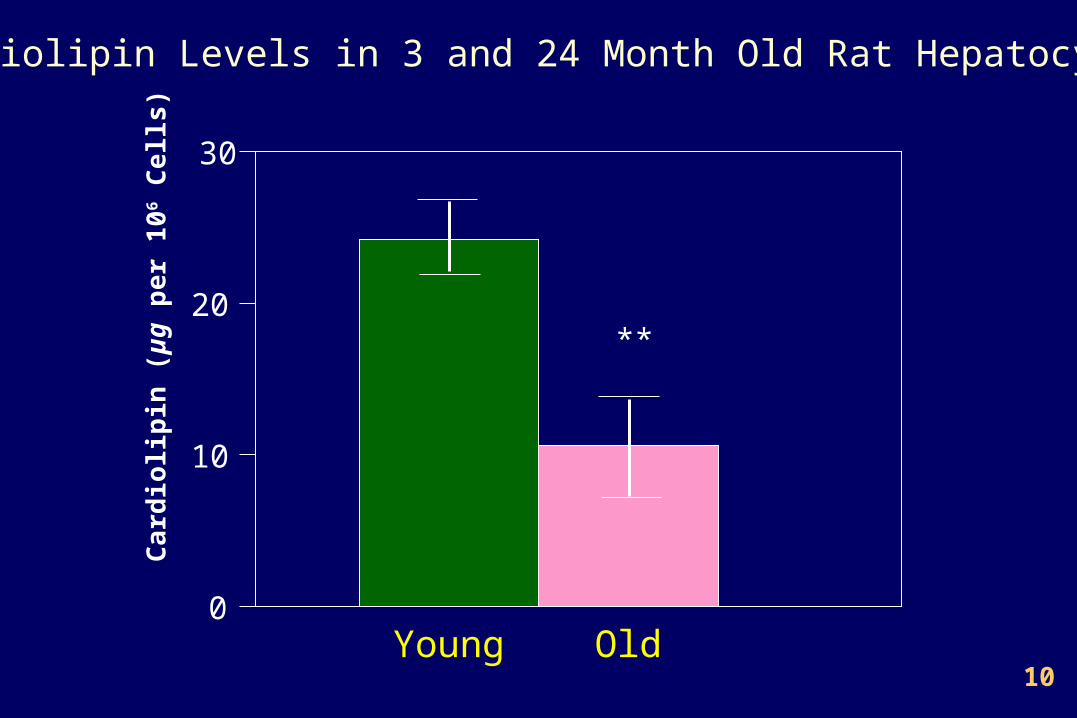
MDA levels in young and old rats with LA, ALCAR, or both
Young Old
MD
A (
pm
ol/m
g p
rote
in)
60
0
50
10
40
30
20
70
80
P<0.01P<0.05
***
+ L
A
+ A
LC
AR
+ A
LC
AR
+ L
A
+ L
A
+ A
LC
AR
+ A
LC
AR
+ L
A
20
***p<0.001 vs. young rat group

Ambulatory Activity before and After Supplementation with Lipoic Acid (LA) + Acetyl-L-Carnitine (ALCAR)
0
200
400
600
800
+ L
A +
AL
CA
R
OldYoung
+ L
A +
AL
CA
R
*
Dis
tan
ce
Tra
vel
ed
(c
m/h
ou
r/d
ay
)
*#
#
vs. young
vs. old
*

0
10
20
30
p <0.01
T c
ell
sti
mu
lati
on
ind
ex
Young
Young Tre
ated
Old T
reat
edOld
Age-associated decrease in immune function and the effect of ALCAR (0.2%) + LA (0.1%) treatment for 2 months. Values
are mean + SEM of 10-11 animals.
P <0.001

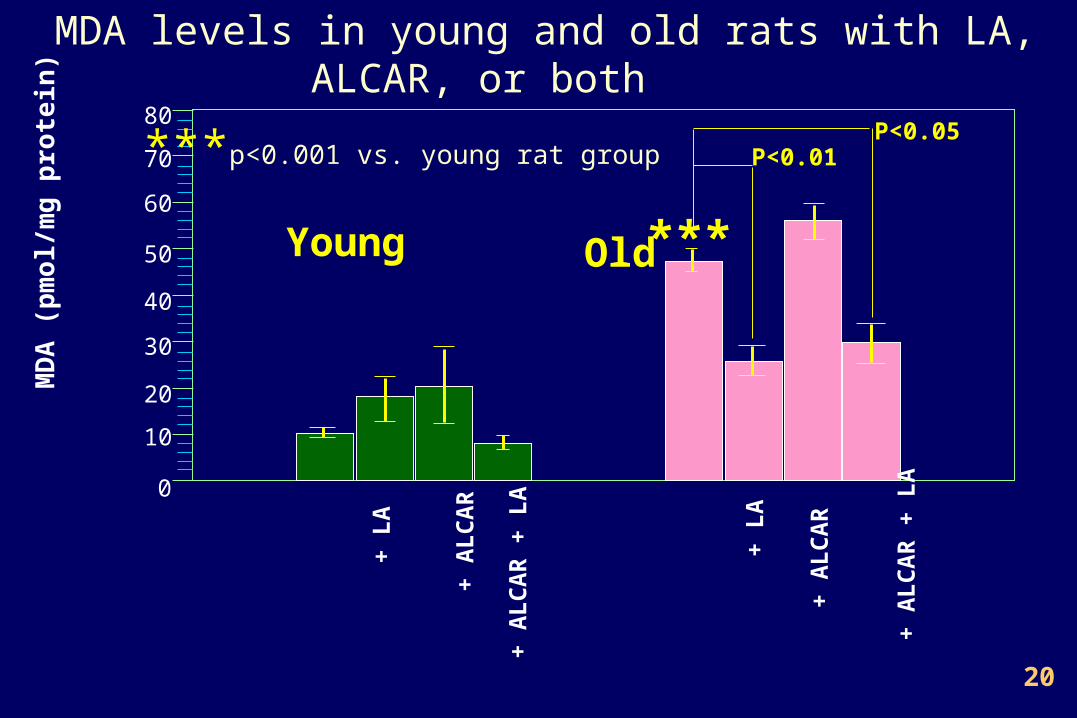
Spatial Memory relies on intact hippocampal function.
Treatments improved poor memory in old rats
Morris Water Maze for Testing Spatial Memory
22
P<0.001
20
100
80
60
40
Spatial Memory Tested With Morris Water Maze
Young Old Old Old Old 0
P<0.05
+ ALCAR + LA
+ ALCAR + LA
Tim
e in
Se
con
ds

0.00
2.00
4.00
6
8
10
12
14
SOUND: Time to Signal
0 50 100 150 200
Young
Old
Old + ALCAROld + LA
Old + ALCAR + LA
0.00
2.00
4.00
6.00
8.00
10.00
12.00
LIGHT: Time to Signal
0 50 100 150 200
Peak procedure: for measuring temporal memory. Associated with striatum, cerebellum, & hippocampus
PEAK RATE: measures learning and motivation.
PEAK TIME: measures internal clock, food is rewarded only when animals push lever 40s after sound or light signal
25

Oxidative Damage to Nucleic Acid in Old Rats by mAb to oxo8G/oxo8dG: Immunohistochemical stain of neurons
26
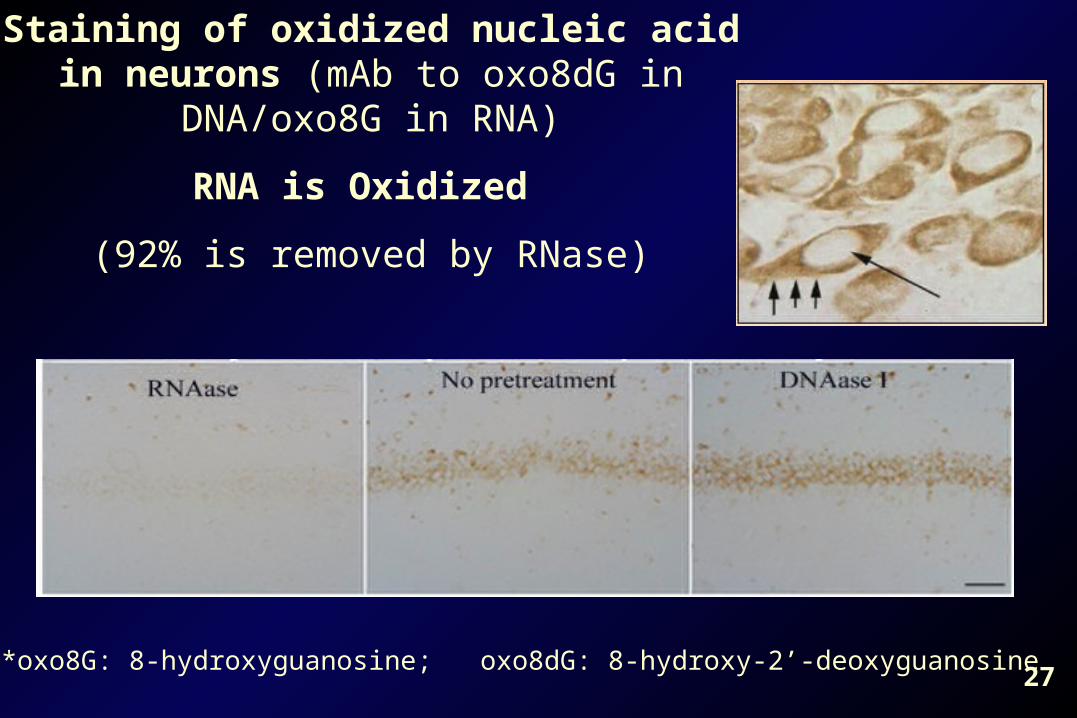
Staining of oxidized nucleic acid in neurons (mAb to oxo8dG in DNA/oxo8G in RNA)
RNA is Oxidized
(92% is removed by RNase)
*oxo8G: 8-hydroxyguanosine; oxo8dG: 8-hydroxy-2’-deoxyguanosine27

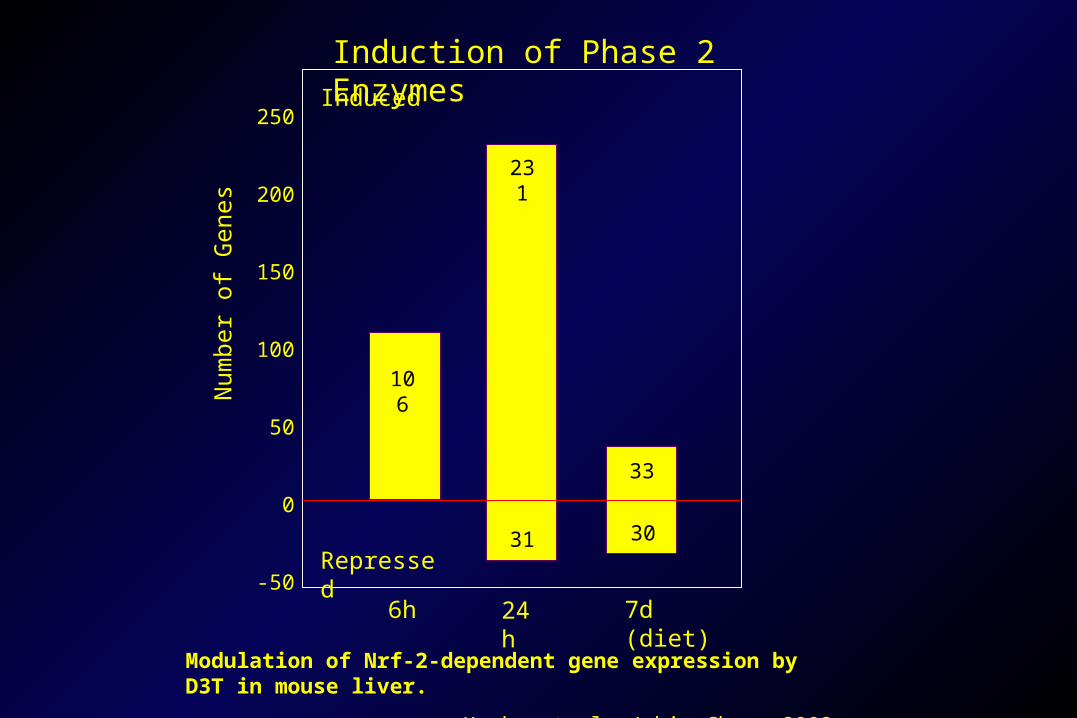
106
231
33
3031
Induced
Repressed
250
200
150
100
50
0
-50
Num
ber
of G
enes
6h 24h 7d (diet)
Modulation of Nrf-2-dependent gene expression by D3T in mouse liver.
Kwak, et al. J bio Chem, 2003
Induction of Phase 2 Enzymes
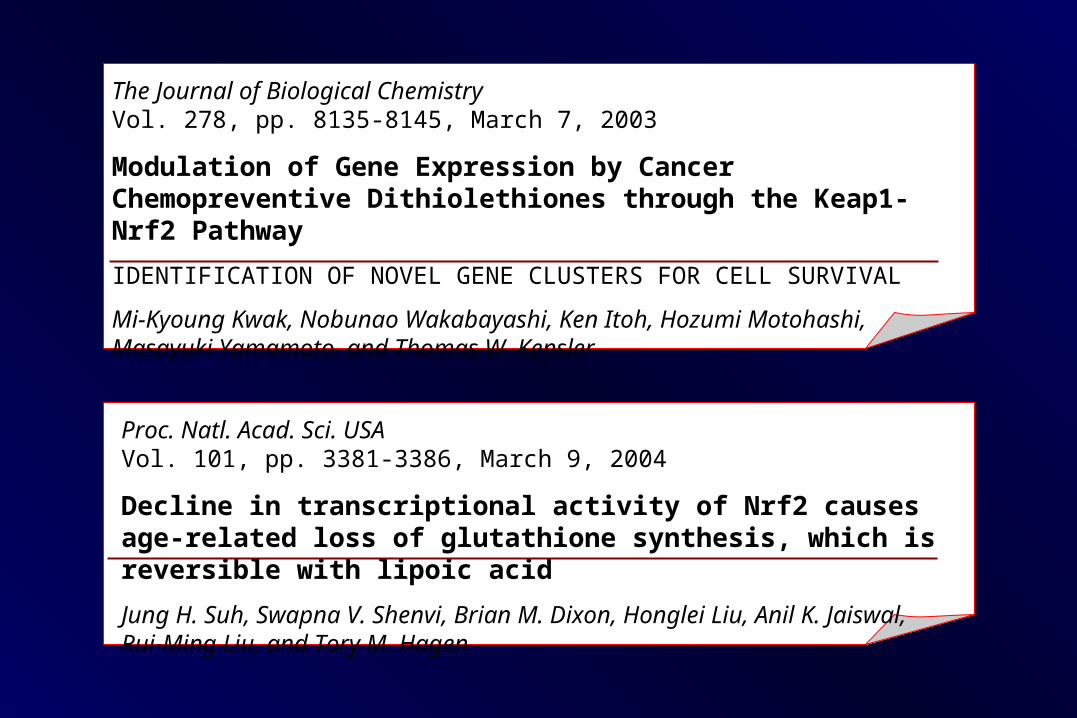
Proc. Natl. Acad. Sci. USAVol. 101, pp. 3381-3386, March 9, 2004
Decline in transcriptional activity of Nrf2 causes age-related loss of glutathione synthesis, which is reversible with lipoic acid
Jung H. Suh, Swapna V. Shenvi, Brian M. Dixon, Honglei Liu, Anil K. Jaiswal, Rui-Ming Liu, and Tory M. Hagen
The Journal of Biological ChemistryVol. 278, pp. 8135-8145, March 7, 2003
Modulation of Gene Expression by Cancer Chemopreventive Dithiolethiones through the Keap1-Nrf2 Pathway
IDENTIFICATION OF NOVEL GENE CLUSTERS FOR CELL SURVIVAL
Mi-Kyoung Kwak, Nobunao Wakabayashi, Ken Itoh, Hozumi Motohashi, Masayuki Yamamoto, and Thomas W. Kensler
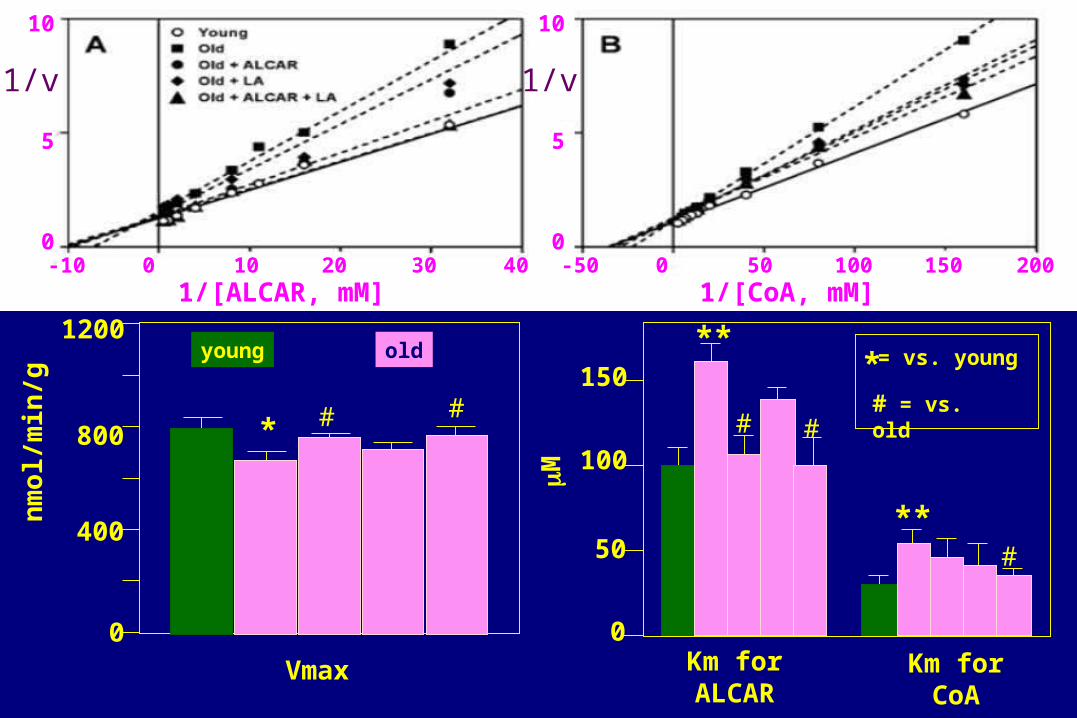
* #
nm
ol/m
in/g
1200
800
400
0
#
M
150
100
50
0Km for ALCAR
Km for CoA
**
##
#**
403020100-10
5
10
0
5
10
0200150100500-50
1/[ALCAR, mM] 1/[CoA, mM]
Vmax
young old = vs. young
# = vs. old
1/v 1/v
*


New Yorker, June 6, 2005
“You’re fifty-seven years old. I’d like to get that down a
bit.”

Meta-analysis of acetyl-L-carnitine versus placebo for mild cognitive impairment and mild Alzheimer’s disease
Montgomery, S.A., Thal, L.J., and Amrein, R., Int. Clin. Psychopharmacol 18:61-71 (2003)
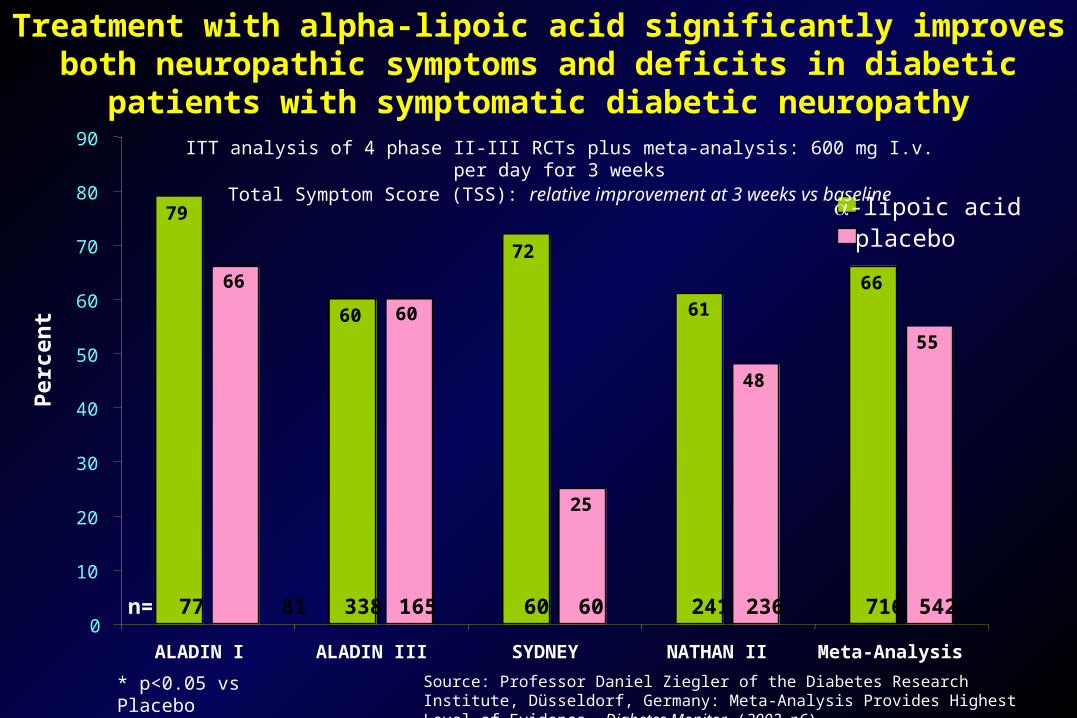
Treatment with alpha-lipoic acid significantly improves both neuropathic symptoms and deficits in diabetic patients with
symptomatic diabetic neuropathy
Source: Professor Daniel Ziegler of the Diabetes Research Institute, Düsseldorf, Germany: Meta-Analysis Provides Highest Level of Evidence, Diabetes Monitor (2002, p6)
61
79
60
72
6666
60
25
48
55
0
10
20
30
40
50
60
70
80
90
ALADIN I ALADIN III SYDNEY NATHAN II Meta-Analysis
Pe
rcen
t
-lipoic acidplacebo
* p<0.05 vs Placebo
ITT analysis of 4 phase II-III RCTs plus meta-analysis: 600 mg I.v. per day for 3 weeksTotal Symptom Score (TSS): relative improvement at 3 weeks vs baseline
n= 77 81 338 165 60 60 241 236 716 542

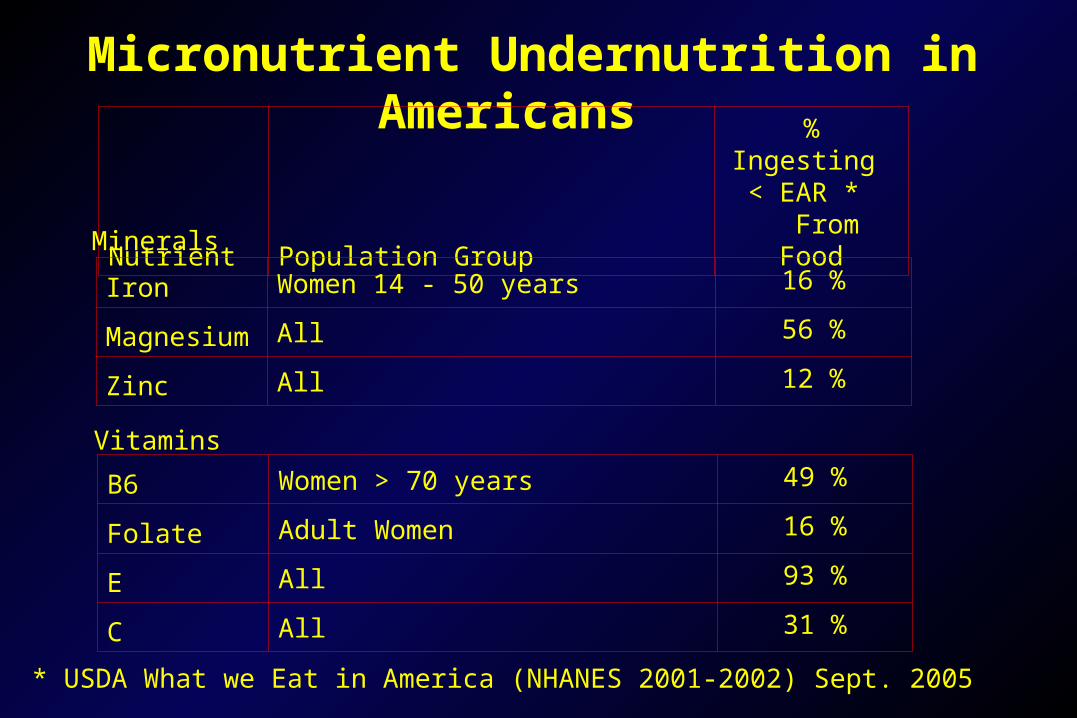
Micronutrient Undernutrition in Americans
Nutrient Population Group
% Ingesting < EAR * From Food
Iron Women 14 - 50 years 16 %
Magnesium All 56 %
Zinc All 12 %
B6 Women > 70 years 49 %
Folate Adult Women 16 %
E All 93 %
C All 31 %
Minerals
Vitamins
* USDA What we Eat in America (NHANES 2001-2002) Sept. 2005

dUMP dTMP
Methionine
SHMT
B6
Serine
MTHFR
Homocysteine
(polymorphism)
TS
MS
CH2=THF
B12CH3-THF


Micronuclei in: RNA positive erythrocytes RNA negative erythrocytes
Folic AcidFolinic Acid
TIME (DAYS)
1 yearpreRx
Normalrange
Mic
ron
ucl
ei p
er 1
000
cell
s
20
50 100 150 200 250 300 350
0
30
40
80
130

xx
PLASMA FOLATE (NG/ML)
MIN
PC
Es/
1000
PC
Es 60
50
40
30
20
10
00 5 10 15 20 25 30

Folate, Vitamin B12, Homocysteine Status and Chromosome Damage Rate in Lymphocytes of Older Men
Michael Fenech, Ivor Dreostl, and Josephine Rinaldi, Carcinogenesis 13:1329-1336, 1997
Folate, Vitamin B12, Homocysteine Status and DNA Damage in Young Australian Adults
Michael Fenech, Claire Aitken, and Josephine Rinaldi, Carcinogenesis 19:1163 - 1173, 1998
Micronucleus Frequency in Human Lymphocytes is Related to Plasma Vitamin B12 and Homocysteine
Michael Fenech, Mutation Research 42: 299 - 304, 1999
In a series of studies, we have been able to confirm that the micronucleus index in cytokinesis-blocked lymphocytes is significantly negatively correlated with plasma vitamin B12 (B12) concentration and significantly positively correlated with plasma homocysteine (HC). Furthermore we have shown in a randomized double-blind placebo-controlled dietary intervention study that intake of 3.5 times the RDI of folic acid and B12 significantly reduces the micronucleus index only in those with above average levels of micronucleus frequency. Micronucleus frequency is minimized when plasma HC is below 7.5 µmol/l and plasma B12 is above 300 pmol/l. Therefore, it is important to take account of the effect of B12 and HC when using the micronucleus assay for human biomonitoring studies.
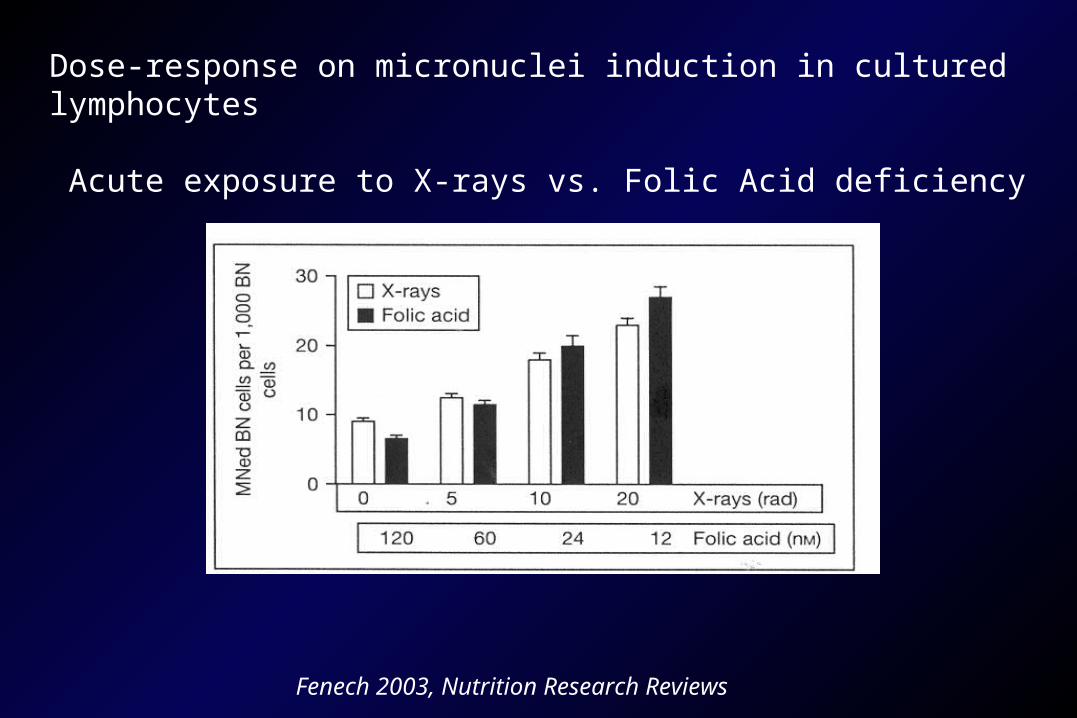
Dose-response on micronuclei induction in cultured lymphocytes
Acute exposure to X-rays vs. Folic Acid deficiency
Fenech 2003, Nutrition Research Reviews

Randomized Double-blind placebo-controlled prospective trial
with 3.5X RDA folate and Vitamin B12 supplementation.
Control Group
Intervention Group
n=31 n=33
BaselinePost-placebo P value Baseline
post-intervention P value
MNCs PER 1000 BNCs
7.02 (0.70)
6.97(0.82)
NS 6.92 (0.58)
5.86 (0.51)
0.031
Serum B12 (pmol/l) 336.0 (19.3)
330.8 (25.6)
NS 343.6 (20.3)
382.1 (19.0)
0.004
RBC folate (nmol/l) 455.5 (31.2)
404.2 (24.9)
NS 379.1 (18.9)
712.1 (41.4)
<0.0001
Plasma homocysteine(µmol/l)
8.97 (0.36)
8.45 (0.36)
NS 9.36 (0.53)
6.68 (0.39)
<0.0001
Fenech et. al. 1998 Carcinogenesis.
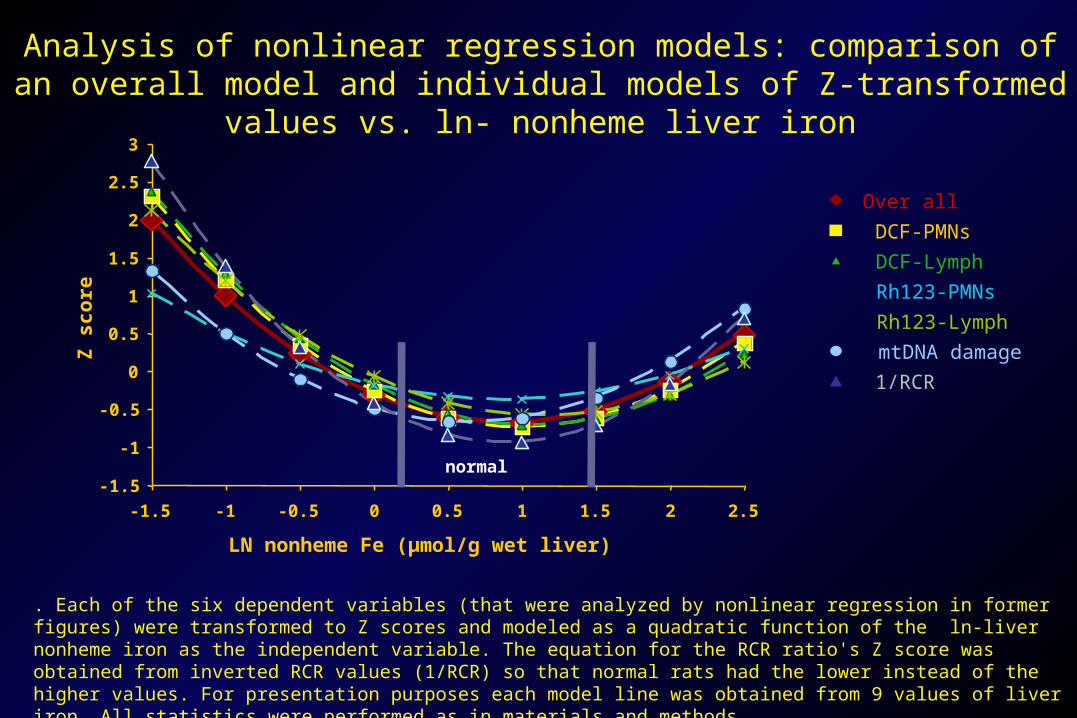
. Each of the six dependent variables (that were analyzed by nonlinear regression in former figures) were transformed to Z scores and modeled as a quadratic function of the ln-liver nonheme iron as the independent variable. The equation for the RCR ratio's Z score was obtained from inverted RCR values (1/RCR) so that normal rats had the lower instead of the higher values. For presentation purposes each model line was obtained from 9 values of liver iron. All statistics were performed as in materials and methods.
Analysis of nonlinear regression models: comparison of an overall model and individual models of Z-transformed values vs. ln- nonheme liver iron
Over all
DCF-PMNs
DCF-Lymph
Rh123-PMNs
Rh123-Lymph
mtDNA damage
1/RCR
-1.5
-1
-0.5
0
0.5
1
1.5
2
2.5
3
-1.5 -1 -0.5 0 0.5 1 1.5 2 2.5
LN nonheme Fe (µmol/g wet liver)
Z score
normal


An overview of evidence for a causal relationship between iron deficiencyduring development and cognitive or behavioral function in children
Joyce C McCann and Bruce N Ames(2007) AJCN in press
Is docosahexaenoic acid, an n3 long-chain polyunsaturated fatty acid, required for development of normal brain function? An overview of evidence from cognitive and behavioral tests in humans and animals
Joyce C McCann and Bruce N AmesAmerican Journal of Clinical Nutrition (2005) 82:281-95

Is there convincing biological or behavioral evidence linkingVitamin D deficiency to brain dysfunction?
Joyce C McCann and Bruce N AmesFaseb J in press

Neurons Contain The Enzyme That Activates Vitamin D
Eyles, DW et al (2005) J Chem Neuroanat 29, 21-30

Calcitriol Target Genes in the BrainGene products whose expression in the brain or brain cells has been reported to be affected by calcitriol
Neurotrophins and other growth factors:NGF; NT-3 & NT-4/5; GDNF; TGF-β2
Calcium-binding proteins:Calbindin D28K, parvalbumin, calretinin;
Protein sub-units for L-Type Voltage Sensitive Ca++Channels (L-type VSCCs);
Transcription factors or enzymes involved in signal transduction pathways:N-myc, c-myc, protein kinase C family (PKC);
Other enzymes:Choline acetyltransferase, responsible for synthesis of the neurotransmitter
acetylcholine; γ-Glutamyltranspeptidase, involved in recycling of the reactive oxygen species
scavenger glutathione);Hormones:
[Oxytocin, the “trust hormone”]
Biochemical or cellular brain functions in which calcitriol target gene products are involved
Synaptogenesis (formation of synaptic connections); Synaptic plasticity (e.g., memory formation); Calcium signaling and homeostasis; Neurotransmission and neurotransmitter synthesis; Survival and differentiation of dopaminergic and other neurons; Control of toxic free radicals;
Behavior affected by target gene product dysfunction
Learning and memory; Motor control; Maternal or social behavior; Aging (neuronal density);
McCann, JC, Ames BN (2007) Review Article: Is there convincing biological or behavioral evidence linking vitamin D deficiency to brain dysfunction? FASEB J, in press.

20
40
6080
100
120
140
Control ZnAD ZnDF
DC
F F
luo
resc
ence
In
ten
sity
(R
FU
)
Zinc Deficiency Induces IncreasedOxidative Stress in C6 Glioma Cells
*

Zinc Deficiency Induces Fapy Glycosylase (Fpg)-sensitive Single Strand Breaks in Human Lung Fibroblasts
0
40
80
120
160
200
Control ZnAD ZnDF
Co
met
Sco
re
Control (+Fpg) ZnAD (+Fpg) ZnDF (+Fpg)
*
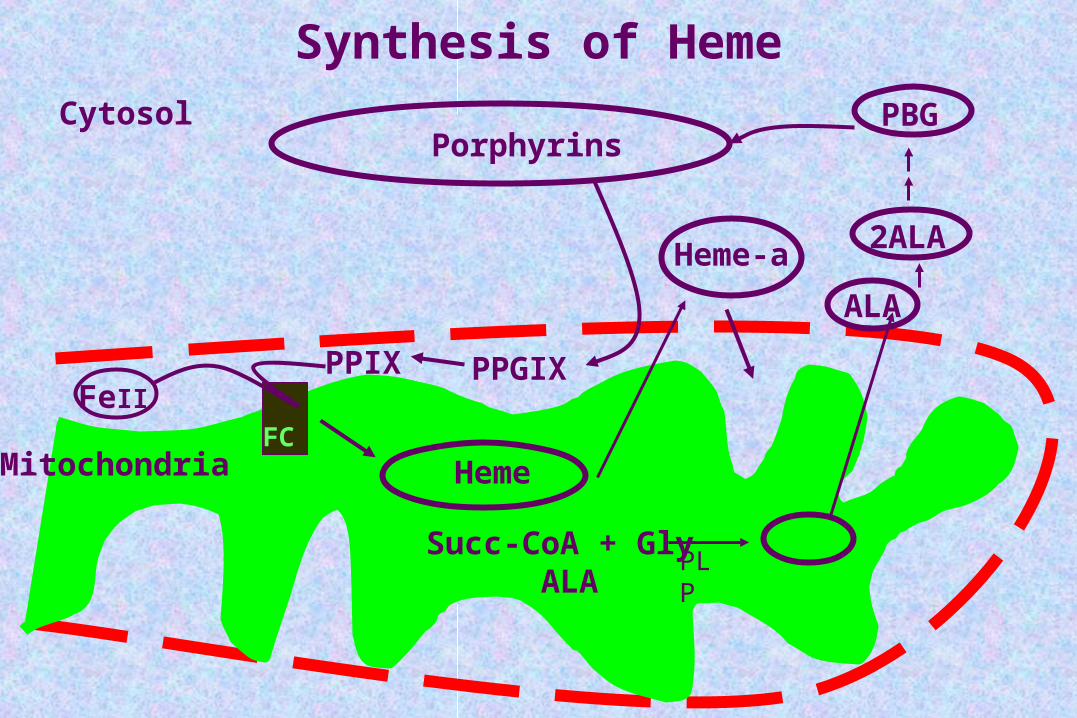
Succ-CoA + Gly ALA
2ALA
PBG Porphyrins
Cytosol
PPIX PPGIX
Heme
FeII
MitochondriaFC
Synthesis of Heme
Heme-a
PLP
ALA

MitochondrialMatrix
Cellular Cytoplasm
Mitochondrial Outer MembraneMitochondrial Outer Membrane
Inner MembraneInner Membrane
IntermembraneSpace
VV
IIIIII
IIIIIIIVIV
CytCCytCCoQCoQ
HH++
PyruvateDehydrogenasecomplex
Citrate Synthase
-Ketoglutarate Dehydrogenase
Complex
Fumarate
L-Malate
Oxaloacetate
Acetyl-Co-A Citrate Isocitrate
-Ketoglutarate
Succinyl-Co-A
Succinate
FADFADH2
CITRICACID
CYCLE
H2OO2 ADP
ATP
ATP
NADH
NADH
NADH
NAD+
NADHNADH
HH++
HH++
HH++ HH++
HH++HH++HH++
HH++
HH++HH++
HH++ HH++HH++
HH++
HH++
HH++
HH++ HH++HH++
HH++
HH++
HH++
9


Effect of Biotin on Cell Senescence
0.0 2.5 5.0 7.5 10.0 12.5 15.020253035404550556065
cdFBS-BD
nFBS-BSnFBS-+B--BS
Weeks
cdFBS+B-BS
Biotin deficiency accelerates cell senescence

MicronutrientDeficiency
HemeDeficit
Complex IVDeficit
Oxidative Stress
DNA Damage
Early Senescence
Pyridoxine [+] ++ ++
Zinc + # #
Riboflavin
Iron + + [+] [+]
Copper [+] [+] [+]
Biotin + + + + +
Lipoic Acid [+]Pantothenate [+] [+]
Micronutrient deficiency and heme synthesis in human cell culture
+ = Atamna/Ames, ++Askree /Ames, #Ho/Ames [+] Literature

Fenech 2007, Forum Nutr.
Healthy Non-smoking Males
Healthy Non-smoking Females
Variation in chromosomal DNA damage rates within and between age groups measured as MNC frequency.

Magnesium Deficiency Shortens Fibroblast Lifespan

Magnesium Deficiency Induces DNA-Protein Crosslinks

Calcium Deficiency Vitamin B12
Fenech: chromosome breaks Fenech: Chromosome breaks
Lipkin: colon cancer mice
Folate Deficiency Selenium
MacGregor/Ames/Fenech: chromosome Rao: DNA damage
breaks mice/humans Combs/Trumbo: Cancer humans
Willett: epi colon cancer humans
Vitamin D Deficiency Omega-3 FA
Holick: epi many types of cancer Denkins: Cancer
Magnesium Deficiency Niacin
Bell: chromosome breaks humans Kirkland/Depeint: DNA damage
Larsson: epi colorectal cancer humans
Zinc Deficiency Choline
Fong: esophageal cancer humans/rodents da Costa: DNA damage in humans
Potassium Deficiency Chang: Cardiovascular Disease

Proc. Natl. Acad. Sci. USAVol. 103, pp. 17589-17594, November 2006
Low micronutrient intake may accelerate the degenerative diseases of aging through allocation of scarce micronutrients by triage
Bruce N. AmesChildren’s Hospital of Oakland Research Institute, Nutrition and Metabolism Center,5700 Martin Luther King Jr. Way, Oakland, CA 94609
Inadequate dietary intakes of vitamins and minerals are widespread, most likely due to excessive consumption of energy-rich, micronutrient-poor, refined food. Inadequate intakes may result in chronic metabolic disruption, including mitochondrial decay. Deficiencies in many micronutrients cause DNA damage, such as chromosome breaks, in cultured human cells or in vivo. Some of these deficiencies also cause mitochondrial decay with oxidant leakage and cellular aging, and are associated with late onset diseases such as cancer. I propose DNA damage and late onset disease are consequences of a triage allocation response to micronutrient scarcity. Episodic shortages of micronutrients were common during evolution. Natural selection favors short-term survival at the expense of long-term health. I hypothesize that short-term survival was achieved by allocating scarce micronutrients by triage, in part through an adjustment of the binding affinity of each protein for its required micronutrient. If this hypothesis is correct, micronutrient deficiencies that trigger the triage response would accelerate cancer, aging, and neural decay but would leave critical metabolic functions, such as ATP production, intact. Evidence that micronutrient malnutrition increases late onset diseases, such as cancer, is discussed. A multivitamin-mineral supplement is one low-cost way to ensure intake of the
Recommended Dietary Allowance of micronutrients throughout life.

Immune Risk Phenotype of Aging
Low CD4:CD8 ratio
Increase in anergic effector (CD8+CD28-) T-cells
Low lymphoproliferative response
Decline in antigen-presenting cells
Decreased expression of co-stimulatory molecules
Decline in IL-12 production and Th1 response

Immune Risk Phenotype of Aging
Low CD4:CD8 ratioDef: vit A.folate, zinc,
Increase in anergic effector (CD8+CD28-) T-cellsDef: tryptophan, zinc,
Low lymphoproliferative responseDef: vit C, vit E, zinc
Decline in antigen-presenting cellsDef: vit E
Decreased expression of co-stimulatory moleculesDef: vit E, tryptophan. zinc
Decline in IL-12 production and Th1 responseDef: vit B6, Vit E, zinc
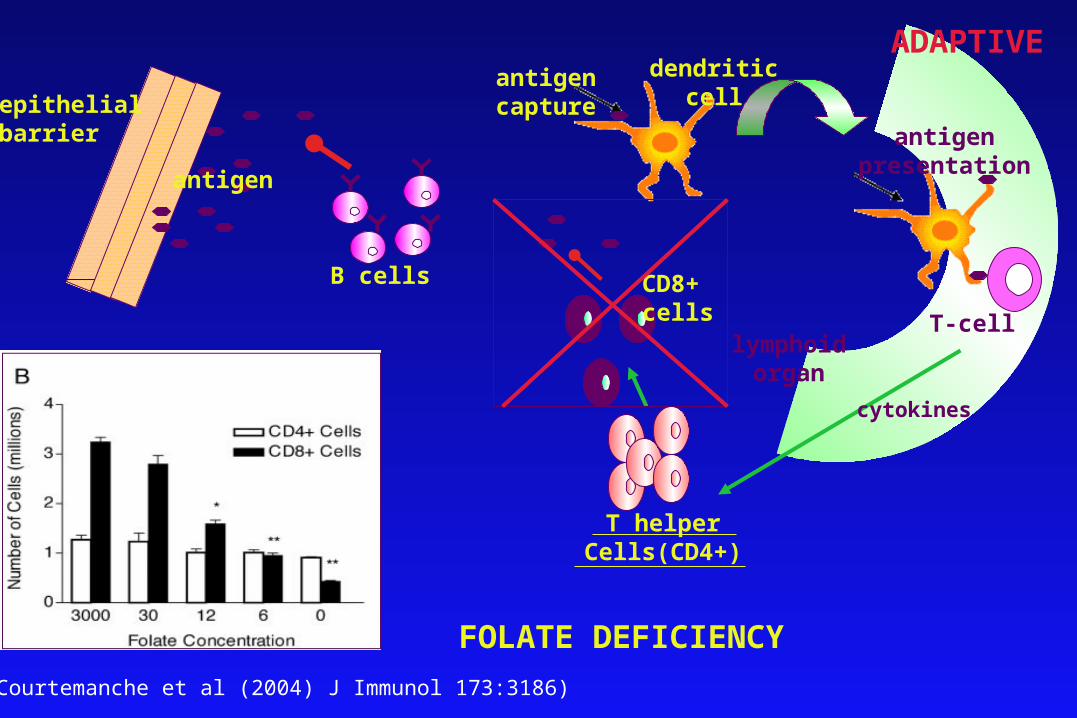
epithelialbarrier
antigen
antigencapture
T-cell
antigenpresentation
lymphoidorgan
T helperCells(CD4+)
B cells CD8+cells
dendriticcell
ADAPTIVE
cytokines
FOLATE DEFICIENCY
(Courtemanche et al (2004) J Immunol 173:3186)

80
75
70
65
60
55
50
45
401900 1910 1920 1930 1940 1950 1960 1970 1980 1990
46.4
4950.1
53.654.5
56.3
5861.3 61.4
65.7 65.666.7
71.173.2
74.9
77.578.9
71.469.9
67.1
Life Expectancy of Men and Women at Birth
SOURCE: National Institute on Aging

END