By: Hanna Olin, Astrid Sofie, Justine Marie, Shary Nathalie, Katie, Alison and Luise Marie.

© Copyright 2017
Alison Marie Thompson

Single-Cell Molecular Profiling of Nucleic Acids in the Microfluidic Self-
Digitization Chip
Alison Marie Thompson
A dissertation
submitted in partial fulfillment of the
requirements for the degree of
Doctor of Philosophy
University of Washington
2017
Reading Committee:
Daniel T. Chiu, Chair
Tomikazu Sasaki
Frantisek Tureček
Program Authorized to Offer Degree:
Chemistry

i
University of Washington
Abstract
Single-Cell Molecular Profiling of Nucleic Acids in the Microfluidic Self-
Digitization Chip
Alison M. Thompson
Chair of the Supervisory Committee:
Professor Daniel T. Chiu
Chemistry
In the last four decades, advancements in technologies to copy, measure, and manipulate
DNA and RNA in situ have enabled new methods for research and diagnosis of disease. As a
subset of these methods, novel microfluidic platforms have emerged that have demonstrated
assay that can run at lower-cost, have lower-sample consumption, are more robust, are easier-to-
perform, and/or are more accurate.
For genetic analyses, microfluidic technologies have been used to integrate DNA and
RNA measurement with upstream sample handling, such as single cell manipulation.
Performing genetic analysis on single cells can uncover cell-to-cell variation, or heterogeneity,
masked by measurements on homogenized tissues. This heterogeneity has implications for
organism development and disease. Intercellular heterogeneity is thought to play a critical role
in cancer, where subsets of a population of cancerous cells can seed metastasis, evade the
immune system, evade therapies, or cause relapse post-treatment.

ii
In this thesis, methods to perform single-cell genetic measurements are described using a
simple microfluidic device, the Self-Digitization Chip (SD Chip). An overview of microfluidics
for single-cell genetic analysis is provided, highlighting the advantages of performing analyses at
nL scale platforms over µL- or mL-scale platforms. A method is described to quantify
absolutely the amount of a specific mRNA species in a single cell by digital RT-PCR in a one-
step reaction. The quantities of mRNA measured in a single cell are found to compare well to
values obtained by mRNA fluorescence in situ hybridization (FISH). This is the first study to
show absolute quantification of mRNA by digital PCR. A single-cell genotyping method is also
described. This method is used for genotyping of single cells to determine zygosity of a gene of
interest for acute myeloid leukemia. The device allows for genotyping of hundreds of single
cells individually in a single PCR run. The reaction chambers are stationary throughout imaging
and PCR, allowing us the ability to quantify and eliminate from our zygosity calls measurement
errors such as false negatives and false positives. Possible future directions for the SD Chip are
also discussed, including work on unprocessed, whole-blood samples.

iii
TABLE OF CONTENTS
List of Tables ............................................................................................................................... viii
Chapter 1. Introduction ................................................................................................................... 1
1.1 Overview ......................................................................................................................... 2
1.2 Introduction to PCR Techniques ..................................................................................... 4
1.2.1 PCR Amplification...................................................................................................... 5
1.2.2 PCR Detection Chemistries ........................................................................................ 7
1.2.3 Real-Time PCR and Digital PCR ............................................................................... 8
Chapter 2. Review of Microfluidics for Single-Cell Genetic Analysis ........................................ 12
2.1 Abstract ......................................................................................................................... 13
2.2 Introduction ................................................................................................................... 13
2.3 Microfluidics as a solution ............................................................................................ 18
2.4 Capture and enrichment of single cells ......................................................................... 19
2.5 Compartmentalization ................................................................................................... 22
2.6 Analysis of single-cell genetic material ........................................................................ 25
2.7 Future outlook ............................................................................................................... 31
Chapter 3. The Self-Digitization Microfluidic Chip for the Absolute Quantification of mRNA in
Single Cells ................................................................................................................................... 33
3.1 Abstract ......................................................................................................................... 34
3.2 Introduction ................................................................................................................... 35
3.3 Methods......................................................................................................................... 37
3.3.1 Single-cell qPCR ....................................................................................................... 37
3.3.2 Microfluidic Device Fabrication. .............................................................................. 37
3.3.3 Device Loading ......................................................................................................... 37
3.3.4 Digital RT-PCR. ....................................................................................................... 39
3.3.5 Data processing. ........................................................................................................ 40
3.3.6 RNA standard curve. ................................................................................................. 41

iv
3.3.7 Single Cell mRNA FISH. ......................................................................................... 41
3.3.8 Cell Culture. .............................................................................................................. 42
3.4 Results and Discussion ................................................................................................. 42
3.5 Conclusions ................................................................................................................... 52
3.6 Supplemental Information ............................................................................................ 53
Chapter 4. Single-Cell Isolation and One-step genotyping in the microfluidic self-digitization
chip ................................................................................................................................................ 60
4.1 Abstract ......................................................................................................................... 61
4.2 Introduction ................................................................................................................... 62
4.2.1 Genetic Heterogeniety (Clonality) in Cancer ........................................................... 62
4.2.2 Clonality in the Bulk ................................................................................................. 63
4.2.3 Single-Cell Genetic Approaches ............................................................................... 64
4.3 Materials and Methods .................................................................................................. 65
4.3.1 Cell Lines and Template DNA ................................................................................. 65
4.3.2 Allele Discrimination Primers and Probes ................................................................ 66
4.3.3 PCR Conditions ........................................................................................................ 67
4.3.4 Cell lysis experiments ............................................................................................... 67
4.3.5 SD Chip Fabrication ................................................................................................. 68
4.3.6 SD Chip Priming and Loading .................................................................................. 68
4.3.7 Imaging of Captured Cells ........................................................................................ 69
4.3.8 SD Chip thermalcycling ............................................................................................ 70
4.3.9 Post-PCR Imaging .................................................................................................... 70
4.3.10 SD Chip Image analysis ........................................................................................ 70
4.4 Results and Discussion ................................................................................................. 71
4.4.1 Cell lysis.................................................................................................................... 71
4.4.2 Characterization of Pre-Made PCR Master Mixes ................................................... 74
4.4.3 Detection Chemistries for Allelic Discrimination Genotyping Assays .................... 77
4.4.4 Assay Optimization in Standard PCR ....................................................................... 81
4.4.5 Cell Imaging.............................................................................................................. 84
4.4.6 Assay Optimization on the SD Chip ......................................................................... 87

v
4.4.7 Single-cell Zygosity .................................................................................................. 90
4.5 Conclusions and Next steps .......................................................................................... 91
Chapter 5. Future work ................................................................................................................. 95
5.1 Future Work .................................................................................................................. 96
5.1.1 SD Chip for Low-Resource Settings......................................................................... 96
5.1.2 SD Chip on Unprocessed, Whole Blood................................................................... 97
5.1.3 Methods..................................................................................................................... 99
5.2 Summary ..................................................................................................................... 101
Bibliography ............................................................................................................................... 102
Appendix A ................................................................................................................................. 111

vi
LIST OF FIGURES
Chapter 1
Figure 1.1 Publications on digital PCR ........................................................................3
Figure 1.2 Illustration of One Cycle of PCR ................................................................6
Figure 1.3 Exponential Amplification by PCR .............................................................6
Figure 1.4 Select detection chemistries used to generate fluorescent
signal from PCR product .........................................................................8
Figure 1.5 The qPCR standard curve ............................................................................9
Figure 1.6 Quantification scenarios in digital PCR ......................................................11
Chapter 2
Figure 2.1 Advantages of microfluidics for single-cell genetic analysis ......................19
Figure 2.2 Microfluidic enrichment of rare cells ..........................................................19
Figure 2.3 Compartmentalization of single cells ..........................................................24
Figure 2.4 Digitization of genetic material for analysis ...............................................27
Chapter 3
Figure 3.1 Single-cell gene expression variation ..........................................................44
Figure 3.2 Components of the digital RT-PCR self-digitization chip ..........................45
Figure 3.3 Post-amplification well intensity .................................................................48
Figure 3.4 Amplification of GAPDH transcripts from total RNA ...............................49
Figure 3.5 Absolute quantification of TFRC mRNA copies in single cells .................52
Figure 3.6 Results of qPCR for BCR-ABL or wild type ABL expression
on K562 cells ........................................................................................55

vii
Figure 3.7 Steps in SD Chip assembly .........................................................................56
Figure 3.8 Filled SD Chip serpentine array imaged at three stages of RT-PCR ..........58
Figure 3.9 Images of filled chambers at ambient pressure
following sample digitization ...............................................................59
Chapter 4
Figure 4.1 Overview of single-cell genotyping assay ..................................................65
Figure 4.2 Cell membrane lysis in PCR buffers ...........................................................75
Figure 4.3 PCR detection chemistries investigated for the single-cell
genotyping protocol ..............................................................................78
Figure 4.4 Probe-based allele discrimination in two different PCR mixes ..................79
Figure 4.5 Effects of PCR additives in bulk PCR from whole cells .............................84
Figure 4.6 Cell imaging in PCR buffer .........................................................................85
Figure 4.7 Contribution of EvaGreen and FAM probe to green fluorescence .............87
Figure 4.7 Assessment of false-positive and false-negative rates ................................89
Figure 4.8 Zygosities of single cells .............................................................................90
Chapter 5
Figure 5.1 Amplification of a WBC gene in diluted, whole blood on the SD Chip .....98

viii
LIST OF TABLES
Table 4.1 Primer and probe sequences ................................................................................67
Table 4.2 Summary of lysis conditions investigated to reduce false negatives ...................76
Table 4.3 Four possible outcomes for SD Chip wells .........................................................88

ix
ACKNOWLEDGEMENTS
I am grateful to all the individuals who provided guidance and support during my time as a
graduate student. In particular, thank you to my advisor, Professor Daniel T. Chiu, for your
mentorship and guidance. Thank you to the current and former members of the Chiu group, our
collaborators at Fred Hutch, and the faculty of the chemistry department, for your support and
contributions that made these projects possible.

x
CHAPTER CONTRIBUTIONS
Chapter 2 of this dissertation is a Frontier Review written for Lab on a Chip. I am the
primary author and wrote a large majority of the manuscript. Dr. Paguirigan and Dr. Kreutz
contributed portions of the writing. All authors contributed to editing the final manuscript. The
published writing in this Chapter has been reproduced with permissions from the authors and
Lab on a Chip.
I am the primary author of Chapter 3, and wrote the majority of the manuscript. The
work represents a collaboration between the laboratories of Dr. Chiu at the University of
Washington and Dr. Radich at the Fred Hutchinson Cancer Research Institute (Fred Hutch). I
conducted all of the experiments with the exception of the qPCR experiments presented in
figures 3.1 and 3.7, which were conducted by Dr. Paguirigan. Dr. Kreutz and Dr. Gansen both
assisted in improving the design of the device from the formerly published designs. Dr.
Paguirigan and Dr. Kreutz wrote portions of the manuscript. The published writing in this
Chapter has been reproduced with permissions from the authors and Lab on a Chip.
Chapter 4 contains unpublished data and is in progress. This work is also a result of the
collaboration between Dr. Chiu and Dr. Radich. I conducted the majority of the experiments,
including all of the results from the device. Dr. Kreutz made significant updates to the general
design of the SD Chip from the device used in Chapter 3. These improvements were used to
design the device used in the manuscript, but the details of these improvements are not outlined
in this dissertation and are unpublished at this time. Dr. Paguirigan contributed intellectually to
the design of a many of the experiments, and oversaw the work of two research technologists,
Jordan Smith and Luke Monroe, at Fred Hutch. Jordan conducted the experiments in optimizing
standard PCR, including the data presented in figure 4.5. Luke assisted in some of the SD Chip
xi
experiments, and automated the data analysis methods I developed in Chapter 3 and early on in
the project. Dr. Paguirigan, Jordan, and Luke and also contributed to intellectual discussions
about conducting the data analysis. Dr. Radich and Dr. Chiu were the PI’s who oversaw the
work.
Chapter 5 includes unpublished data from experiments I conducted myself. The device
designs used were the same as those used in Chapter 4 and were designed by Dr. Kreutz.

1
Chapter 1. INTRODUCTION

2
1.1 OVERVIEW
The generation of scientific theories are a product of our observations, either through our
senses or with the aid of tools and instruments. As our understanding of biological systems
progresses, some of the new questions being asked will require the development of novel tools and
techniques. As we strive to stretch scientific and healthcare budgets and increase healthcare
accessibility, we will need to create tools for faster, simpler to operate, and less expensive methods.
As we seek to refine complex theories, we will need to create tools that allow for greater
measurement accuracy and that are less prone to measurement error. This dissertation explores
the need for new tools to study single-cell genetics and describes some new tools developed for
these analyses.
The tools described in this dissertation use microfluidic techniques to perform genetic
analysis on single cells. Performing genetic analyses in microfluidic volumes is a fairly recent
development, but publications in the field have grown exponentially in the last several years. This
growth can be visualized by a plot of the publications per year using the keywords “digital PCR,”
presented as Figure 1.1. Digital PCR is the most common, but not the only method using
microfluidics to perform genetic analysis. This term has grown from about 60 publications per
year when I began my graduate study, to over 500 publications in 2016. These publications
represent both research to develop the technique, but also many publications by users of the
technologies, particularly as commercial instruments have become more widely available.

3
Figure 1.1. Publications on digital PCR. Publications using the keywords “digital PCR” in the
past 20 years. Number of publications are listed on y-axis. Generated February 8, 2017 from
Web of Science by Clarivate Analytics.
In Chapter 2, a brief overview of the field of microfluidics for single-cell genetic analysis
is provided. The advantages of using microfluidic technologies for genetic analysis are
highlighted, with a focus on how microfluidics can overcome some of the limitations of current
technologies such as standard PCR or sequencing. An overview of microfluidic technologies that
have been used to isolate single-cells and perform genetic analysis of both RNA and DNA is
described. Remarks are provided on how microfluidics might help shape the future of genetic
analysis, particularly for single-cell studies.
Chapter 3 describes a project to detect and quantify specific mRNA from single cells. For
this project, the contents of a single cell was loaded onto the SD Chip, and we show that we can
measure the mRNA copy number of that gene. A description of the calculation performed to
quantify copy number using counts of a digital positive/negative readout is provided here. A
dilution series of RNA is performed across several devices to demonstrate the linearity of the
method. As evidence that the method is indeed providing absolute quantification of mRNA from

4
single-cells, a specific mRNA is measured in several single cells from a cell line on the SD Chip,
and then this mRNA is also quantified in several cells by single-molecule mRNA FISH. The two
methods show excellent agreement. This is the first study to show absolute quantification of
mRNA by digital PCR.
In Chapter 4, a novel single-cell genotyping method is described. The motivation for
gathering genotype information at the single-cell level is provided. In the method described, a
solution of cells is digitized in the SD Chip, so that wells of the device contain no cells, a single-
cell, or multiple cells. Cells are located in the device by imaging. To genotype the cells, a three-
color fluorescent probe assay is developed to determine whether cells are wild-type, mutant, or
heterozygous for a mutation. Some of the errors in the system are characterized, and results and
future work are described.
Chapter 5 concludes the work. Possible directions for future work are explored. One of
these areas of interest is in using the SD Chip for low resource settings. Some preliminary data is
presented for quantification of DNA in unprocessed whole blood, a method that simplify analyses
in low-resource settings.
The next section of this introduction provides some of the background information
necessary to understand the methods described in the remaining chapters.
1.2 INTRODUCTION TO PCR TECHNIQUES
PCR is the most commonly used laboratory gene amplification technique, though others
have been developed and have their niche. In the work described in Chapters 3-5, signal generation
occurs through the process of gene amplification by PCR. As a primer to the material discussed

5
in these chapters, the basic principles of PCR and signal generation by PCR are described in the
following sections 1.2.1 through 1.2.3.
1.2.1 PCR Amplification
PCR is a method to generate copies of a DNA sequence. The method adapts the machinery
used by biological organisms to replicate DNA in vivo for cell replication, using this machinery to
generate copies of a sequence selected by the user. The process starts with a solution containing
the target sequence, represented in Figure 1.2 as a two horizontal blue lines as the DNA backbone,
and short perpendicular lines as the nucleotides. The nucleotides are pared to their complementary
base on the opposite strand, according to the model of Watson-Crick base pairing, A-T and C-G.
Also present in the solution at this time are all the necessary reagents for the reaction, including
primers, enzymes, deoxynucleotide triphosphates (dNTPs), buffered solution, and salts. The
solution containing the initial double-stranded DNA is heated to 95°C, and the two strands melt
into single strands of DNA. The solution is cooled to 65°C, and short nucleotide sequences, chosen
by the user to compliment the template at the edges of the sequence of interest, pair with their
matching sequence on the template. As the solution begins to ramp up to 75°C, DNA polymerase
binds the template DNA-primer hybrid, and attempts to repair the unfinished sequence by adding
single nucleotides (green T’s) along the primer strand, adding A, T, G, or C to compliment the
template. Once this process is complete, two new single strands have been generated, and each
double-stranded copy of the template DNA has resulted in two copies at the end of the process.

6
Figure 1.2 Illustration of one cycle of PCR. Double-stranded DNA (blue) is heated to 95°C.
The strands are separated, allowing primers (red) to interact with the single strands. At 65°C, the
primers can bind their complementary sequence. At 75°C, DNA polymerase (orange circle) can
add nucleotides (green T’s) to the end of the primer, complementary to the blue template strand.
This process generates two double stranded copies of DNA per single starting copy.
PCR is repeated over several cycles, theoretically with the amount of double-stranded
DNA doubling during each cycle (Figure 1.3). Forty cycles is a typical amount for a PCR run,
which could theoretically generate over 1*1012 copies of DNA. In reality, PCR is not perfectly
efficient, and a doubling does not occur every cycle. Additionally, several factors prevent the
reaction from reaching an ultra-high concentration of DNA product. These include depletion of
reagents, degradation of enzyme, termination from degraded dNPTs, and competition between
primers and template strand during the annealing step.
Figure 1.3 Exponential Amplification by PCR. If the reaction proceeds with perfect efficiency,
the amount of DNA doubles every cycle of PCR. Typically 30-40 cycles are performed.

7
1.2.2 PCR Detection Chemistries
The amplification of DNA by PCR can be used to generate larger quantities of specific
product for a number of downstream analyses, but PCR is also useful for detection. In the systems
described in this work, generation of PCR products is used as a means to detect and/or quantify
low levels of target molecules in solution. Some common detection chemistries are represented in
Figure 1.3. In all of these chemistries, fluorescence intensities increase as PCR proceeds
successfully. Intercalating dyes are molecules that exhibit low fluorescence emission when free
in solution, with enhanced fluorescence upon binding double-stranded DNA. Fluorescence
intensity would therefore increase during PCR as free dNTP’s are used to generate new double-
stranded DNA with each successful extension by DNA polymerase. Intercalating dyes are
considered a non-specific detection method, as fluorescence intensity will increase even if a PCR
error generates an incorrect double-stranded product.
The Taqman probe depicted in Figure 1.4 is considered a sequence-specific detection
chemistry and adds stringency to the detection process. This is the detection method used for the
majority of experiments described in this dissertation. Taqman or hydrolysis probes are short
single-stranded sequences, complementary to the target sequence, flanked by a fluorophore on one
end and a fluorescence quencher of the other. Using this probe requires a DNA polymerase with
5’-3’ exonuclease activity, which will allow the polymerase to digest the probe as it extends along
the strand. This process frees the fluorophore from the quencher, resulting in increased
fluorescence. Select other sequence specific probe-types are described in Chapter 4.

8
Figure 1.4. Detection chemistries used to generate fluorescent signal from PCR product.
Intercalating dyes, taqman probes, molecular beacon probes, and scorpion probes can all be used
to generate fluorescent signal as double-stranded DNA product is formed.
1.2.3 Real-Time PCR and Digital PCR
The specificity of PCR to the sequence of interest, coupled with the ability to generate
fluorescent signal from double-stranded DNA generation, allows for methods to quantify
sequence-specific RNA or DNA molecules in solution by PCR. Measurement of specific
sequences of RNA or DNA has clinical utility in the diagnosis and treatment of disease.
Quantitative PCR has been the gold standard technique used to accomplish this task. Digital PCR
is a relatively new technique with several advantages over qPCR. To see the value of digital PCR,
the principles of qPCR must also be understood.

9
Figure 1.5. The qPCR standard curve. A) Fluorescence traces from 40 cycles of PCR are shown
for standards (blue trace) and unknowns (green trace). The horizontal line through the data is an
artificially drawn threshold, and the point at which the traces cross this line is the cycle
threshold, or CT of the trace. B) The CT of the standard samples (circles) is plotted versus the
known starting quantity of the gene in the reaction. The starting quantity of the unknown sample
(X’s) can be calculated from the CT and the equation of the line.
Figure 1.5 shows some data from a typical qPCR run. To perform qPCR, a set of standard
samples is first prepared. In this example, the standards are recombinant DNA plasmids containing
the gene of interest, which is quantified by UV absorbance spectroscopy and converted to gene
copy number using the known plasmid nucleotide base pairs and coefficient of absorption for
nucleotides. A logarithmic dilution of the plasmid is performed and these templates are used to
create the standard curve. PCR is performed on the standards and unknown samples, and a
fluorescence measurement is taken at each cycle. A plot of the log of fluorescence intensity verses
cycle number is generated. A horizontal line is drawn on the plot near the center of the linear
growth phase of fluorescence. The point where each sample’s trace crosses this line is the sample’s
cycle threshold, or CT. The relationship between CT and concentration will be linear if the
reactions have the same efficiency. A plot of CT versus concentration can be used to find the
equation relating concentration to CT, allowing us to find the concentration of the unknown from
it’s CT.

10
Digital PCR takes a different approach to quantification by PCR. A standard curve is not
required for quantification with digital PCR, which is perhaps the biggest advantage of the method.
The standard curve introduces many uncertainties to the quantification of gene by qPCR. Standard
samples must be quantified by separate method, such as UV absorbance, which does not
discriminate between intact genes and free nucleotides or partially degraded DNA and can be
affected by absorbing contaminants in the buffer. Additionally, in order for the standard curve
method to be valid, the efficiency of PCR amplification from standards and unknown samples
must be nearly the same. This may not be the case when the standard is a purified, single gene,
and the unknown is a more complex mixture. The efficiencies between standards and unknowns
is most certainly not the same when PCR inhibitors are present in the sample at varying amounts,
as would be the case with whole-cell samples, unpurified tissues, or many untreated biological
samples.
The basic process of digital PCR is depicted in three scenarios in Figure 1.6. To perform
digital PCR, a solution containing an unknown quantity of the specific DNA of interest is digitized
into an array. This piece of DNA, depicted as a red circle, is distributed randomly across the array.
This piece of DNA is too small to see prior to PCR, but after PCR the wells containing the DNA
become fluorescent. In the first case, the original solution is at a low-enough concentration that
the number of particles in the array is equal to the number of fluorescent wells. In the second case,
the concentration of particles is a bit higher relative to the number of wells in the array. When the
sample is digitized at random, the most probable configuration has some wells with multiple
particles. After PCR has ended, the fluorescence in wells containing one or more particles will be
indistinguishable. Assuming the particles are distributed randomly the concentration of particles
is still possible to calculate in this scenario using counts of fluorescent versus non-fluorescent

11
wells. The details of how the Poisson equation is used to determine the concentration in this
scenario are contained in Chapter 3. In the third scenario, the concentration of particles is so high
that all wells are fluorescent post-PCR. It is not possible to quantitatively determine the
concentration of particles in this scenario. This situation defines the upper limit-of-detection of
the system.
Figure 1.6. Quantification scenarios in digital PCR. If particles are distributed into discrete
volumes on an array, there are three possible scenarios that can occur dependent on the
concentration. A) The number of particles can be small compared to number of chambers, B) the
number of particles is in the middle-range of the device or C) the number of particles is so high
that every well contains at least one particle. Calculating an accurate concentration of particles is
straightforward in A, impossible in C, and requires application of Poisson statistics in B.

12
Chapter 2. REVIEW OF MICROFLUIDICS FOR SINGLE-CELL
GENETIC ANALYSIS

13
This chapter has been published as:
Thompson, A. M., Paguirigan, A. L., Kreutz, J. E., Radich, J. P. & Chiu, D. T. Microfluidics for
single-cell genetic analysis. Lab Chip 14, 3135–3142 (2014). Reproduced by permission of The
Royal Society of Chemistry.
2.1 ABSTRACT
The ability to correlate single-cell genetic information to cellular phenotypes will provide
the kind of detailed insight into human physiology and disease pathways that is not possible to
infer from bulk cell analysis. Microfluidic technologies are attractive for single-cell manipulation
due to precise handling and low risk of contamination. Additionally, microfluidic single-cell
techniques can allow for high-throughput and detailed genetic analyses that increase accuracy and
decrease reagent cost compared to bulk techniques. Incorporating these microfluidic platforms
into research and clinical laboratory workflows can fill an unmet need in biology, delivering the
highly accurate, highly informative data necessary to develop new therapies and monitor patient
outcomes. In this perspective, we describe the current and potential future uses of microfluidics at
all stages of single-cell genetic analysis, including cell enrichment and capture, single-cell
compartmentalization and manipulation, and detection and analyses.
2.2 INTRODUCTION
The sequencing of the human genome through the Human Genome Project (HGP) was a
seminal moment in biology. But like many great discoveries, it created even more questions and
spurred research into areas of biology that were previously unknown. Work in proteomics,
epigenetics, and posttranscriptional regulation, while significantly aided by the knowledge of the

14
underlying genetic information, has demonstrated that the sequence of human genes alone is a
basic framework onto which many layers of genetic regulation are applied. The disease-focused
sequencing projects following the HGP, some of which capture multiple levels of genomic data
such as The Cancer Genome Atlas, have enabled linking certain consistent genetic changes to
specific diseases. However, it has also demonstrated that there is tremendous variation between
individuals with similar diseases. Further research into the impact of this genetic information on
disease has identified variation between cell populations within individuals. The ability to study
this variation in depth will have significant implications for personalized medicine. Our knowledge
of the extent to which intercellular variation plays a role in disease evolution and therapy outcome
is currently limited by our inability to study small amounts of biological material, down to the
level of an individual cell.
Intra-sample heterogeneity likely holds valuable clues for understanding human disease
and the variability between the responses of patients with the same disease to a given therapy.1 A
clearer picture of how heterogeneity within individuals affects their disease progression and
treatment can be a valuable tool for designing therapeutic regimens and defining treatments for
different conditions. Perhaps turning an acute condition into a manageable, but chronic, one would
be less risky than attempting to cure the individual entirely, especially in the case of therapies that
involve alkylating agents or other potential mutation-inducing treatments. Or perhaps, we might
improve our ability to choose effective therapies for a given patient by adding to our understanding
of the degree of heterogeneity in a patient’s condition to risk-stratification criteria.
Over the last few decades, research methods for molecular analyses have improved in
sensitivity and accuracy because of technology developed in a wide range of fields, from
enzymology to microfluidics. This has resulted in the possibility of studying smaller quantities of

15
starting material than traditionally used, along with huge increases in the density and types of data
produced. Basic and clinical molecular research laboratories now have the ability to study a range
of genetic material, from uncovering the identity and abundance of small RNAs via RNA
sequencing to characterizing large chromosomal alterations via comparative hybridization arrays.
The sensitivity increases in molecular techniques have also allowed us to identify the presence of
low-frequency features that previously were not detectable. One issue hindering our ability to
explore the biology of heterogeneous populations is that the amount of DNA or RNA required for
most of the readily available in-depth genetic analysis methods are designed for bulk assays. These
assays need on the order of nanograms or micrograms of material, which is a considerable amount
given the minute content of a single cell for which the total available material is on the order of
picrograms. Beyond total input issues, the question of isolating and handling single-cell materials
without contamination or sample loss poses yet another hurdle for molecular analyses of
heterogeneity at the single-cell level.
Probing genetic material at the level of a single cell will require new technologies to
enhance capabilities and deliver accurate, actionable data for the wide range of questions being
asked. Although new adaptations of macroscale methods are emerging to address these needs, the
field of single-cell genetics requires a variety of fundamentally different strategies. Microfluidic
technologies are in a unique position to address the limitations of current methods because they
offer the benefits of both fluidic handling and thermal capabilities as well as flexibility in design,
throughput and automation. In this perspective, we will discuss the scope and direction of scientific
interests in single-cell genetics, highlight some of the ways microfluidics has proven useful in
single-cell genetic analysis, and define areas where further improvement is needed.

16
Intra-sample genetic diversity, also known as clonal diversity, has diagnostic value in
several diseases, such as predicting progression to malignancy in Barrett’s esophagus.22 Clonal
diversity has been demonstrated in breast cancer,33 and occurs in acute myeloid leukemia (AML)
from diagnosis to relapse.4-64–6 Current strategies for estimating and tracking clonal diversity at
the macroscale have used next-generation sequencing (NGS) of bulk tumor samples to determine
the frequencies of mutant alleles. Changes in mutant allele frequencies can be observed over the
course of therapy (comparing diagnosis to relapse), and between primary tumor sites and
metastases. While these mutant alleles can be quantitatively tracked over time and over course of
therapy in the bulk samples, the information about the specific disease-causing clone is lost in the
background of all of the other cell types present in any patient sample. This is particularly
challenging in samples where there is some ambiguity, such as in a biopsy of a tumor where the
boundary of tumor verses normal tissue is not completely clear or in a peripheral blood sample
where the amount of leukemic cells varies between patients.
Rather than attempting to infer concurrent occurrence of different genetic characteristics
seen in averaged data from a bulk sample, being able to assess the genomic or expression
characteristics of individual cells themselves can directly link genotype and expression data that
occur simultaneously in a cell. If a cell with a specific set of mutations doesn’t actually express
those alleles, or has other downstream regulatory changes that cause a different set of targets to be
expressed or inhibited, targeting that pathway would incorrectly destroy the wrong cell types and
potentially allow the rogue cell to continue to proliferate and cause relapse of disease. RNA and
DNA extracted from bulk samples does provide a general description of the population average in
the original sample, but it is impossible to reconstruct how the different populations may have
contributed to that average. One can find correlations, for example, between mutational allele

17
frequencies and the level of expression of RNAs downstream of that gene, but even this
information does not inform whether these events occur concurrently in the same cells. When a
population average is measured, the technique used requires a relatively large amount of starting
material to ensure there is enough to avoid sampling issues and stochastic variability in the results.
These methods often are not validated at the small amounts that would make integration with
single-cell assays accurate or reasonable.
Additionally, the separation of measurement or technical variability from biological
variability in each measurement platform can be challenging but is crucial for the validation of any
single-cell assay where analyte amounts are near the limit of detection. Normalization strategies
typically used in bulk measurements are not appropriate for single cells (i.e., technical variability
in control genes during a qPCR experiment would cause normalization of the target gene
measurement to be erroneous). For this reason, having suitable controls becomes an issue for
validation of single-cell data. Another challenge unique to single-cell molecular analyses is the
issue of total sample size (or total cell number analyzed per tissue sample). As for the degree of
heterogeneity in a sample, when the technical variability inherent to the assay and the number of
parameters analyzed increases, the number of cells that need to be analyzed to describe the overall
heterogeneity of a sample with statistical significance must rapidly increase. Available methods
for the physical isolation and handling of individual cells for emerging and sensitive genetic
analysis techniques limit sample size because of their low throughput, high cost per cell, or high
failure rates.
Currently, there are few powerful tools readily available to identify heterogeneity at the
single-cell level. For decades we have been able to process very large populations (millions of
cells analyzed per sample), and quickly identify frequencies of different cell types within a single

18
sample by using a wide range of cell surface markers or intracellular stains. For example, flow
cytometry is by far the most rapid, complex (multi-parameter) and immediate (protein-based) data
producing tool available for single-cell analysis. However, molecular genetic analyses of single
cells (both genomic and gene expression) has not had the benefit of decades of tools developed to
analyze multiple features simultaneously in individual cells with high enough throughput or data
complexity (multiple parameter data). Translating the discovery tools that are effective for bulk
samples, such as large scale sequencing and other genetic analysis methods, to the single-cell level
will be invaluable to further elucidate mechanisms of disease and how individual cells make
choices and regulate their various processes.
2.3 MICROFLUIDICS AS A SOLUTION
New methods for single-cell assays must provide the means to link genetic data to an
individual cell’s characteristics as well as address the major limitations for effective analysis.
Specifically, they must: 1) provide the handling precision necessary to isolate and manipulate
minute quantities of biological material, 2) approach single-molecule sensitivity to eliminate bias
due to amplification, 3) provide high accuracy as the same cell cannot be measured multiple times,
4) provide throughput high enough to efficiently generate statistically meaningful data, and 5)
eliminate contamination from the environment and components within the sample. For a method
to be successfully adopted into research and clinical settings, ease of use, integration with existing
infrastructure, and cost are critical factors. Microfluidics has shown strong performance in these
areas outside of the genetics arena. Research incorporating microfluidics and single-cell genetic
analysis, including cell capture and enrichment, cell compartmentalization, and detection can be
used to create simple and more informative tools for single-cell study. Specific advantages to

19
applying a microfluidic approach to this complex field are outlined in Figure 2.1 and highlighted
in the remainder of this paper.
Figure 2.1 Advantages of microfluidics for single-cell genetic analysis. Microfluidics
technologies offer advantages at various stages of single-cell genetic analysis. In this paper, the
current and future applications of microfluidics to provide simple and informative analyses in
this field are discussed.
2.4 CAPTURE AND ENRICHMENT OF SINGLE CELLS
Figure 2.2 Microfluidic enrichment of rare cells. Circulating tumor cells (CTCs) can be enriched
from whole blood using a variety of techniques including A) nanostructure and antibody-based
reversible surface capture [reprinted (adapted) with permission from ref. 7. Copyright 2013
Nature Publishing Group], B) affinity capture combined with electrokinetic enrichment
[reprinted (adapted) with permission from ref. 8. Copyright 2011 American Chemical Society],
C) microfluidic aliquot sorting of target cells combined with on-chip filtration Reprinted
(adapted) with permission from ref. 9. Copyright 2012 Angewandte Chemie, International

20
Edition], and D) combined hydrodynamic-magnetic methods Reprinted (adapted) with
permission from ref. 10. Copyright 2013 AAAS].
Correlation of genetic data with its single cell of origin requires a method to isolate single
cells from a tissue. Currently, methods for the selection and transfer of single cells into wells or
tubes include laser capture microdissection, optical tweezer manipulation, micromanipulation,
flow cytometry, or microfluidic methods. These methods differ in their equipment requirements,
cost, degree of user skill, tissue compatibility, and throughput. Flow cytometry is attractive
because of its multiparameter sorting and high throughput, but depositing cells into microliter
volume wells results in dilution of analytes and does not allow the user to easily confirm that cells
were deposited successfully into the analysis volume. Laser capture microdissection can provide
certainty of cell isolation, but at very low throughput.11 Enrichment and compartmentalization
within a microfluidic platform can be designed for high throughput while minimizing dilution and
contamination risk. A number of microfluidic techniques have been developed to address these
needs.
A variety of techniques have been used to indiscriminately trap single cells from a cell
suspension in microfluidic systems. These methods include hydrodynamic mechanisms, or use
electrical, optical, magnetic or acoustic fields to control trapping. An extensive review of cell
trapping methods is presented by Nilsson et al.12 To be integrated with downstream genetic
analysis, these devices must be compatible with isolation, manipulation, and analysis or retrieval
mechanisms. The commercial microfluidic C1 Single-Cell Auto Prep System form Fluidigm uses
hydrodynamic capture and isolation of single cells from suspension before cell lysis and processing
single-cell genetic material before retrieval and use with multiplex PCR, RT-PCR, or NGS
methods. A disadvantage of this and other hydrodynamic trapping devices is that an excess of

21
cells are needed for high trapping density, resulting in a loss of the majority of the single cells from
the incoming sample. These methods also are unable to select specific types of cells in a sample,
even those types that are fairly common. For many single-cell applications, a simple,
straightforward device for trapping thousands of single cells, rather than hundreds, would expand
the studies that could be executed with statistically significant data.
Some questions regarding single cells are focused on assessing genetic heterogeneity in
only a small sub-population of single cells in a biological sample. Rare cells, usually thought of
as having cellular abundance less than 0.1 percent, are relevant markers in cancer, prenatal
diagnosis, and infectious disease. In order to gather sufficient data from patient samples, single-
cell enrichment techniques typically must offer high sample throughput and yield high recoveries
of target cells. If these enrichment devices are to be used upstream of cell trapping, isolation,
manipulation and genetic analysis methods, the techniques should allow for high purity retrieval
of viable cells. Circulating tumor cells (CTCs), an extraordinarily rare cell type, are present in
quantities near one cell per 1 billion blood cells in patients with advanced stage cancer. Methods
such as Fluorescence Activated Cell Sorting (FACS), Magnetic Activated Cell Sorting (MACS),
and cell affinity separations are high-throughput and very effective for some applications, but they
typically have low-recovery efficiency for CTCs and will deposit 0.1% of background cells with
the target population. This background noise limits their applicability in cases such as genetic
analysis of single CTCs.13 In contrast, microfluidic mechanisms for isolation of CTCs have been
demonstrated that enrich these rare cells with high recovery. These techniques utilize laminar flow
and/or high surface-to-volume ratios to operate. For example, antibodies can be used to
immobilize specific cell types in static7 (Figure 2.2a) or flow8 (Figure 2.2b) systems, optical
methods can be combined with valves to create CTC-containing aliquots of sample9 (Figure 2.2c),
22
and fabricated filters and flow focusing can be integrated upstream of labelled CTC separation and
collection by magnetophoresis10 (Figure 2.2d).
2.5 COMPARTMENTALIZATION
On its own, trapping cells is insufficient for single-cell analysis because the contents of
those cells, once lysed, aren’t necessarily isolated from each other. The cells also have to be
compartmentalized in such a way as to maintain all biological materials from a single cell in an
isolated fluidic space that is separate from other cells. There are a variety of methods that have
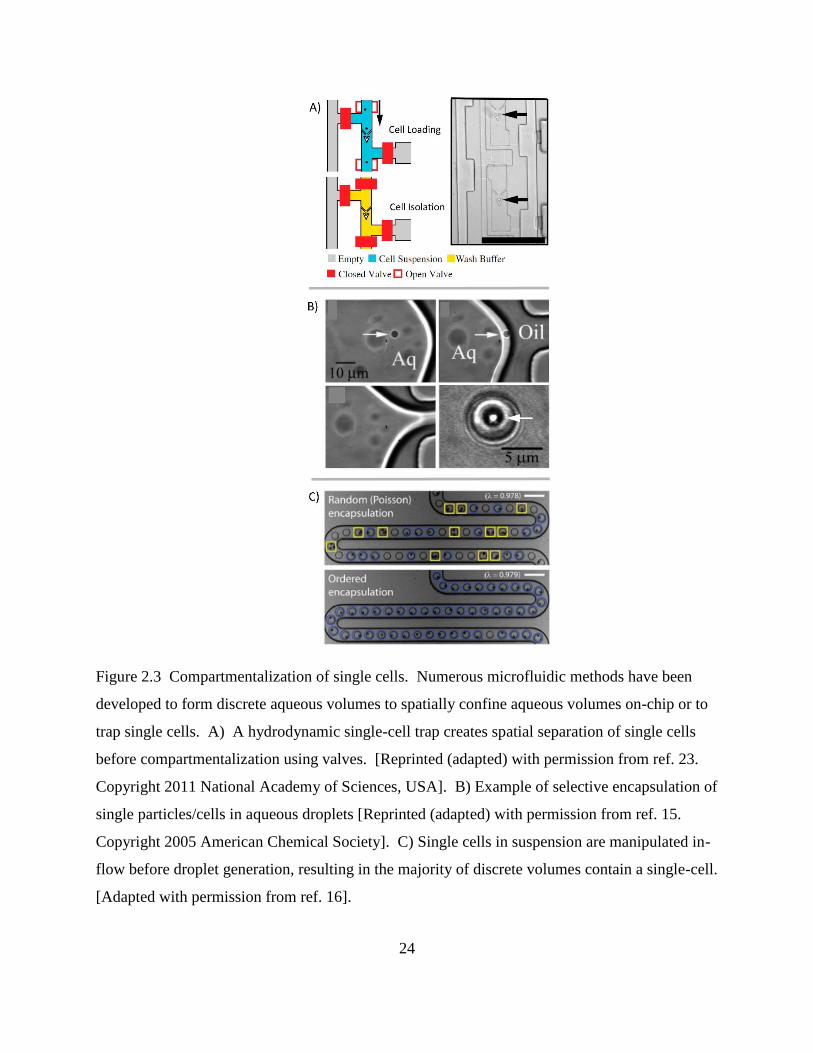
been developed for the compartmentalization of cells for downstream analysis (Figure 2.3). Valve-
based systems can pneumatically isolate cells, and often utilize traps upstream of the sample
handling (Figure 2.3A).14 Droplet generation systems also can be used to isolate cells, without the
need for traps or valves, which drastically can simplify device design/fabrication. These droplet
systems also have the potential for much higher throughput than valve-based systems. However,
droplet platforms typically rely on partitioning of cells into droplets following a Poisson
distribution, which can limit throughput due to a large number of droplets being empty and a few
with two or more cells. If throughput is high enough, a sufficient rate of single-cell measurements
can be obtained despite these uninformative droplets. Techniques also exist to selectively
encapsulate single cells into individual droplets (Figure 2.3B)15 or to “beat” Poisson statistics
(Figure 2.3C).16
Another approach is to isolate cells in chambers, but without using valves. Typically
systems that isolate chambers (containing cells, beads, or some other component) have the sample
fully fill the device and then cap the chambers with an oil or a physical barrier.17,18 Other systems
are essentially extensions of droplet platforms, but keep the volumes isolated using physical

23
barriers rather than emulsion stabilizing surfactants. This maintains some of the advantages of
droplet systems (reduced risk of fouling of the device surface and crosstalk), while facilitating the
tracking of individual samples over an extended time period. Examples of systems that enable
additional sample processing include the SlipChip,19 SD chip,20 some valve-based chips,21 and
some hybrid emulsion/physical isolation systems.22
24
Figure 2.3 Compartmentalization of single cells. Numerous microfluidic methods have been
developed to form discrete aqueous volumes to spatially confine aqueous volumes on-chip or to
trap single cells. A) A hydrodynamic single-cell trap creates spatial separation of single cells
before compartmentalization using valves. [Reprinted (adapted) with permission from ref. 23.
Copyright 2011 National Academy of Sciences, USA]. B) Example of selective encapsulation of
single particles/cells in aqueous droplets [Reprinted (adapted) with permission from ref. 15.
Copyright 2005 American Chemical Society]. C) Single cells in suspension are manipulated in-
flow before droplet generation, resulting in the majority of discrete volumes contain a single-cell.
[Adapted with permission from ref. 16].

25
It is relevant to note that by isolating single cells into compartments, intercellular
interactions and any effects of the native cell matrix on the genome are removed. Methods to
probe such interactions in a controlled environment, through arrays that incorporate cell culture or
media exchange prior to isolation and lysis, for instance, would both enhance our understanding
of cellular processes and might validate the results of techniques studying cells in isolation. A
recent review of microfluidic devices to probe cell-cell communication is given by Guo et al.24
Once isolated, performing cell lysis in these individual, microfluidic compartments
minimizes exposure to contamination from other cells within the sample or from material in the
laboratory. Lysis methods should preserve the integrity of the genetic material and chemical lysis
methods should be compatible with downstream enzymatic reactions such as PCR. Also, stress
induced cell-signalling that might alter transcript levels should be avoided. Methods for cell lysis
include physical, chemical, thermal, and electrical techniques with varying lengths of time to lyse
the cell and different design requirements for the microfluidic device. Each of these techniques
have been utilized in microfluidic nucleic acid analysis devices reviewed by Kim et al.25
2.6 ANALYSIS OF SINGLE-CELL GENETIC MATERIAL
Analyzing material from a single cell is challenging in many regards. In the single cell,
RNA is present in picrogram quantities; some low abundance RNA transcripts are present in 1-10
copies.11 While qPCR and qRT-PCR theoretically are able to amplify and detect single-molecule
quantities of nucleic acids, it is challenging to quantify low quantities in microliter-volume
reactions. For one, amplification bias causes copy number uncertainty.15 Additionally, the qPCR
signal is analog, requiring “real time” monitoring, and signal calibration26 or internal reference
standards for relative gene expression that are complicated by the stochastic nature of gene

26
expression at the single-cell level.27 Whole-genome or whole-transcriptome amplification is
requisite for single-cell analysis using NGS platforms. But in the process of amplification,
information about the spatial arrangement of sequences, copy number variation, or relative gene
expression are not fully conserved due to variations in amplification efficiency and transcript
length limitations. Additionally, while NGS provides a huge amount of data per cell, it is currently
cost-prohibitive to perform NGS on sufficient numbers of cells to describe a population or to
describe the contribution of measurement/technical error in any statistically relevant way.

27
Figure 2.4 Digitization of genetic material for analysis. (A) The genetic material in a sample
can be broken into many small volumes before gene-specific amplification. [Reprinted (adapted)
with permission from ref. 28. Copyright 2013 American Chemical Society]. Signal
accumulation allows for the counting of positive reactions. The fraction of positive volumes
correlates to absolute copy number without the need for a reference standard. [Adapted from ref.
29]. (B) Multi-volume (MV) digital PCR can reduce the number of volumes necessary to
achieve high dynamic range. [Reprinted (adapted) with permission from ref. 30. Copyright
2011 American Chemical Society]. (C) Single chromosomes are partitioned to preserve

28
haplotype information through multiple strand displacement and sequencing. [Reprinted
(adapted) with permission from ref. 17. Copyright 2011 Nature Publishing Group].
Digital PCR and RT-PCR. Digital PCR is one way to count individual gene molecules
without the need for a calibration curve or a normalization gene (Figure 2.4). For these assays, the
analysis volume is discretized such that the analyte is randomly distributed into many small
volumes before gene and signal amplification and detection. The number of volumes analyzed per
cell should be high enough so that some volumes do not contain the target analyte, and the Poisson
distribution can be applied to calculate the likelihood of multiple targets occupying the same
droplet. PCR is then performed in the discrete volumes. Endpoint detection can be used to
calculate the initial concentration based on the assumption of a random distribution of starting
analytes into the assay volumes. Microfluidic devices for this technique achieve high copy number
precision and dynamic range by rapidly generating discrete, known volumes from the target
samples. Performing these analyses in individually addressable volumes may also allow for
further downstream analysis (Figure 2.4A).28,29 As an alternative to high droplet capacity devices,
Kreutz el al. showed that a wide dynamic range and high copy number resolution can be achieved
by using a smaller number of chambers and multivolume digital PCR (Figure 2.4B).30
Despite improvements in the accuracy, sensitivity, and reproducibility of digital PCR for
the quantification of DNA, gene expression analysis has not achieved the same performance
standards. Digital RT-PCR requires a reverse-transcription step for the construction of a cDNA
library before preamplification and digitization into microfluidic volumes. This reverse
transcription step is known to suffer from variations in efficiency between transcripts.26,27,31
Variations in sample preparation steps result in vastly different results in digital RT-PCR,26

29
although with consistent sample preparation, results may be highly reproducible between
measurements.31 Performing reverse-transcription and preamplification steps in microfluidic
volumes may offer some reduction in amplification bias in microliter-volume reactions. In one
study comparing various methods of single-cell preparation, performing these enzymatic reactions
in nanoliter, rather than microliter, volumes resulted in the best correlation between quantitative
sequencing and PCR results.31
Digitization of the sample volume derived from a single cell can also be useful for
preserving haplotype information. However, information about co-localization of mutations on a
single chromosome is lost because of limitations in product length that result from enzymatic
nucleic-acid amplification. Fan et al. showed that by using a microfluidic device to
compartmentalize the individual chromosomes of a single cell, this information is preserved during
downstream analysis (Figure 2.4C).17
Microfluidic PCR. Digital PCR typically focuses on 1-2 targets per sample. But in order
to draw statistically meaningful conclusions about gene expression heterogeneity in tissues, it is
necessary to analyze a larger number of cooperating targets from a large number of single cells.
The complex and rapid sample handling procedures possible with microfluidics provide a platform
for such high-throughput gene expression analysis of single cells with the possibility to tease out
measurement/technical variability from biological variability. Using the Dynamic Array
integrated fluidic circuits developed by Fluidigm, it is possible to simultaneously measure gene
expression of 96 gene targets in 96 single cells.11 This method uses single-cell isolation by flow
cytometry or laser capture microdissection but similar preparations can be performed by using the
recently available microfluidic C1TM Single-Cell Auto Prep System (Fluidigm). Realistically,
these methods, despite being more data-dense than previous ones, still are limited by total system

30
cost per cell, overall throughput (larger number of cells are required for statistical power) and are
currently challenging to integrate with laboratory infrastructure.
Sample preparation for next-generation sequencing. NGS methods produce reads from
single nucleic acid molecules in a high-throughput fashion, and thus require whole-genome
amplification or reverse transcription and whole transcriptome amplification. Whole-genome
amplification is often carried out using multiple displacement amplification (MDA), but,
depending on the biological sample, this method has been demonstrated to have varying levels of
amplification bias. Marcy et al. showed that reducing the volume of single bacterial cell MDA
reactions from 50 μL to 60 nL reactors produced more specificity and greater amplification
uniformity.32 Although improvements in sample preparation have helped the completeness and
accuracy of the reverse transcription and preamplification steps, current RNA-sequencing methods
cannot be considered as absolute counting technologies.33 Recently, Wu et al. compared the
sensitivity and reproducibility of typical single-cell whole transcriptome preparations. They found
that performing reverse transcription and preamplification steps in microfluidic volumes of the C1
device (Fluidigm), rather than tube-based preparations, produced less gene dropout, improved
reproducibility (defined as deviations about the sample mean), and accuracy (defined by
comparing gene expression levels to those calculated by single-cell qPCR).31
Single-molecule techniques. Despite improvements in whole-genome and whole
transcriptome amplification techniques, the error inherent to these methods continues to limit the
reliability of NGS, and to a lesser extent, digital and multiplex PCR. Methods of directly counting
single molecules to avoid amplification and reverse transcription of single-cell genetic material
would be highly valuable. Other single-molecule nucleic acid counting techniques include
fluorescent labelling techniques such as single-molecule FISH26 and Nanostring’s nCounter

31
system.34 In single-molecule FISH, multiple fluorescent probes bind to each mRNA, and spots are
counted using fluorescence microscopy. The method has been demonstrated on both fixed and
live cells, the latter made possible by using probes that can be transported through the living cell
membrane.27 While the use of microfluidics is not necessary to perform single-molecule FISH,
using the method in combination with microfluidic cell compartmentalization could automate
image acquisition and analysis.35
2.7 FUTURE OUTLOOK
Despite improvements in single-cell genetic analysis capabilities, further improvements in
single-cell handling, enrichment, and analysis techniques are necessary for these methods to make
an impact on our understanding of biology. There are a number of needs that are priorities for
generating a strong set of single-cell data for human biology research. Microfluidic device designs
that address these issues early on in their development will be far more likely to allow researchers
to access a broader range of single-cell characteristics in a statistically meaningful way.
Strategies for manipulation and interrogation of single cells should aim to improve upon
information accuracy, amount of information obtained per cell, and single-cell throughput.
Performing whole genome amplification in small volumes has already been shown to better
preserve relative gene abundance for more accurate gene quantification, and future analysis
systems requiring whole genome amplification should continue to use microfluidic volumes for
these operations. Accuracy of single-cell genetic analysis systems will also be improved if whole
genome amplification is limited or avoided, which may be possible using innovative single-
molecule detection strategies that take advantage of minimal dilution offered by microfluidic
systems. Future methods to increasing the amount of information per cell might come in the form

32
of incorporating increasingly accurate whole genome amplification with highly informative NGS.
The ability to integrate multiple manipulation operations and analytical detection strategies on a
single microfluidic device could also lead to complex systems generating data on multiple gene
targets or multiple macromolecule types. Currently, the throughput of microfluidic single-cell
genetic analysis systems has been limited to hundreds single-cells. Future microfluidic designs
should explore avenues to decrease the number of cells wasted during trapping and
compartmentalization, increase the density of single cell arrays, and ultimately increase the
number of single cells analysed per device. As always, ease of use, cost, and analysis time should
be considered for any technology moving towards commercialization.
Beyond the platforms employed for isolating and analyzing single cells, additional
computational methods will be crucial for researchers to address technical variation and identify
the degree of significance of any biological variation detected. Large data sets (as from single-
cell sequencing data sets),36 and smaller, more focused data sets (as from digital PCR and RT-PCR
assays),37 will need slightly different validation strategies. Ideally, the integration of multiple data
types originating from the same single cells will be possible (for example, cell surface markers
with gene expression with genotyping). The generation and curation of single-cell data sets from
both normal and diseased human tissues would provide a valuable understanding of the types of
variation that are normal in human development and those that are hallmarks of disease evolution
and progression.

33
Chapter 3. THE SELF-DIGITIZATION MICROFLUIDIC CHIP FOR
THE ABSOLUTE QUANTIFICATION OF MRNA
IN SINGLE CELLS

34
Reproduced with permission from
Thompson, A. M.; Gansen, A.; Paguirigan, A. L.; Kreutz, J. E.; Radich, J. P.; and Chiu, D. T.
Self-Digitization Microfluidic Chip for Absolute Quantification of mRNA in Single Cells. Anal.
Chem. 86, 12308–12314 (2014). Copyright 2014 American Chemical Society.
3.1 ABSTRACT
Quantification of mRNA in single cells provides direct insight into how inter-cellular
heterogeneity plays a role in disease progression and outcomes. Quantitative polymerase chain
reaction (qPCR), the current gold standard for evaluating gene expression, is insufficient for
providing absolute measurement of single-cell mRNA transcript abundance. Challenges include
difficulties in handling small sample volumes and the high variability in measurements.
Microfluidic digital PCR provides far better sensitivity for minute quantities of genetic material,
but the typical format of this assay does not allow for counting of the absolute number of mRNA
transcripts samples taken from single cells. Furthermore, a large fraction of the sample is often lost
during sample handling in microfluidic digital PCR. Here, we report the absolute quantification
of single-cell mRNA transcripts by digital, one-step RT-PCR in a simple microfluidic array device
called the self-digitization (SD) chip. By performing the reverse transcription step in digitized
volumes, we find that the assay exhibits a linear signal across a wide range of total RNA
concentrations and agrees well with standard curve qPCR. The SD Chip is found to digitize a high
percentage (88.0%) of the sample for single-cell experiments. Moreover, quantification of
transferrin receptor (TFRC) mRNA in single cells agrees well with single-molecule fluorescence
in situ hybridization (FISH) experiments. The SD platform for absolute quantification of single-

35
cell mRNA can be optimized for other genes, and may be useful as an independent control method
for the validation of mRNA quantification techniques.
3.2 INTRODUCTION
Inter-cellular heterogeneity plays a role in cell differentiation as well as disease
development, progression, and remission or relapse in response to treatment.38–40 Studying mRNA
expression at the single-cell level can provide a means to characterize variability in cellular activity
and thus study disease etiology and pathology. Standard macroscale methods for quantitative
assessment of gene expression are not designed to handle very small volumes and are limited by
their sensitivity and accuracy when applied to single-cell analyses.41,42 In response to these
challenges, various microfluidic platforms have been developed to measure gene expression in
single cells. High-throughput platforms, such as the BioMark HD System (Fluidigm), have
provided a way to study expression levels of multiple genes in a set of single cells simultaniously.43
However, challenges persist in dealing with the technical variability in the protocols, where
uncertainty can be introduced from cell lysis, reverse transcription, preamplification, PCR and
other steps.44 It has been found that when performing microfluidic RNA quantification, using
different reagents and protocols can give varying results for each step, and that some methods do
not work for certain genes.26 It has also been shown that when dealing with the small quantities
of mRNA from a single cell, detection of RNA transcripts at or below 102 copies per cell may be
unreliable even with the sensitive microfluidic detection strategies.45 This unreliability
complicates the assessment of the biological variability within single cells and makes the
comparison of different preparation methods impractical. Technical advancements are still needed
in instances where sensitive and absolute measurement is necessary such as single-cell gene

36
expression measurements, and in validation of evolving quantitative or semi-quantitative gene
expression instrumentation.
One method for the absolute quantification of DNA or cDNA with high accuracy is digital
PCR.46,47 However, RNA must be measured indirectly through enzyme-generated cDNA; the
efficiency of this RNA-to-cDNA conversion varies between enzymes and across the
transcriptome.48 Digital PCR platforms, where RNA-to-cDNA conversions are performed prior
to digitization, have shown these measurements to be precise under consistent reaction conditions
in larger homogenized samples26 and for single cells when compared to qPCR.49 However, these
techniques demonstrate cDNA quantification and have thus far not delivered absolute
quantification of mRNA present in a single cell.
In this study, both reverse transcription and PCR occur in digitized volumes without prior
reverse-transcription or pre-amplification, hereinafter referred to as one-step digital RT-PCR. A
few reports of one-step digital RT-PCR have demonstrated quantification results that agree well
with other quantitative or semi-quantitative methods, using RNA standards50 or standard virus
quantification methods50–52 to indirectly quantify RNA for comparison with system performance.
This is the first study to perform one-step digital RT-PCR for a single cell.
In this work, we show some of the limitations of using standard qPCR measurements to
study single cell heterogeneity. We then show an absolute quantification method of single-cell
gene expression analysis using a microfluidic self-digitization (SD) Chip platform. We assess the
performance of our device for, one-step digital RT-PCR using two methods. The first approach is
an indirect method (standard curve) and the second approach is a direct RNA counting method
called single-molecule FISH (fluorescence in situ hybridization).53 We demonstrate that the
reverse transcription step can be performed reliably in digitized volumes; this workflow

37
successfully performs single-cell analysis; and that the absolute mRNA quantification in single
cells can be accurately performed using digital microfluidics.
3.3 METHODS
3.3.1 Single-cell qPCR
Single K562 cells were flow-sorted into PCR plates so that the wells were known to contain
1, 10, or 100 cells. Reverse transcription was performed in 10μL of the High Capacity Master mix
(Applied Biosystems, Carlsbad, CA, USA) and duplicate reactions were analyzed by qPCR based
on duplex hydrolysis probes to simultaneously measure expression levels of the target gene, BCR-
ABL, and the control gene, wild type ABL. Fold change in gene expression was calculated relative
to the average of all samples in the category (1, 10, or 100 cells). For extracted RNA experiments,
total RNA was extracted from K562 cells using Trizol (Invitrogen, Carlsbad, CA, USA) according
to the manufacturer’s protocol. Quantities were assessed by UV absorbance (Nanodrop 2000,
Thermo Fisher Scientific, Waltham, MA, USA).
3.3.2 Microfluidic Device Fabrication.
Devices were prepared by soft-lithography as described previously29 with the following
modifications. The main channel height was measured to be 25 ± 1 μm and the chamber height
was 104 ± 3 μm as determined by a custom-built white-light interferometer54. Details of device
assembly are available in Figure 3.7.
3.3.3 Device Loading
The RT-PCR reaction mix was prepared from the CellsDirectTM One-Step qRT-PCR Kit
(Life Technologies, Carlsbad, CA, USA). A PCR master mix was prepared according to the

38
manufacturer’s guidelines with the addition of bovine serum albumin (Invitrogen, Carlsbad, CA)
to a final concentration of 3 mg/mL and Tween 20 (Millipore, Darmstadt, Germany) to final
concentration of 0.15 percent (m/v). The concentration of SuperScript® III RT/Platinum® Taq
Mix was doubled from manufacturer’s guidelines. PCR assays for GAPDH and TFRC were
purchased from the library of prepared PrimeTime® qPCR 5’ Nuclease Assays available from
Integrated DNA Technologies (GAPDH assay Hs.PT.42.1164609, TFRC assay
Hs.PT.56a.3164874, IDT, Coralville, IA, USA). PCR assays were purchased with
FAM/ZEN™/Iowa Black FQ probes. Final primer concentrations were 500 nM forward/reverse
primer and 250 nM probe. The lysate mixture was prepared separately. For RNA dilution
experiments, 2 μL of RNA diluent (Total RNA Control (Human), Applied Biosystems, Carlsbad,
CA, USA) prepared by serial dilution to concentrations of 52, 35, 17, 7, and 1.4 pg/μL in 10 mM
Tris buffer pH 8.0 (1 M Tris, pH 8.0, Ambion, Carlsbad, CA, USA; diluted with UltraPure
DNase/RNase-free water, Invitrogen, Carlsbad, CA, USA) was added to 6 μL of CellsDirect™
lysis solution. This RNA mix was incubated according to manufacturer’s instructions and then 3-
µL RNA and 7-µL RT-PCR master mix were mixed and added to the SD Chip inlet.
For single-cell experiments, 0.5 μL of SKBR3 Cells (ATCC, Manassas, VA) suspended in
1X PBS (10 X Phosphate buffered saline, Sigma-Aldrich; diluted with UltraPure water) was
pipetted onto the inside of a lid from a PCR tube (0.2 mL PCR tube strips, BioRad, Hercules, CA).
Droplets were inspected with an inverted bright-field microscope (Axio Vert.A1, Zeiss,
Oberkochen, Germany) with a 20X, 0.45 NA objective to determine cell quantities. For lids
containing a single cell in suspension, 1.6 μL of CellsDirect™ lysis solution was pipetted into the
lid. These lids were again observed with a bright-field microscope, and only lids twice confirmed
to contain only a single cell were used in analysis. These lids were capped onto the PCR tube

39
base, stored inverted on ice and transferred to -80°C for storage up to 4 weeks. Frozen samples
were thawed on ice and droplets were covered with 20 μL of continuous phase oil mix before
incubating according to the manufacturer’s instructions. These samples were cooled briefly on ice
before pipetting 6 μL of master mix under the oil layer. The prepared reaction mix was stored on
ice and transferred to a 4°C cold room for device loading.
A continuous oil phase, composed of Abil® WE 09 (Evonik Industries, Essen, Germany),
Tegosoft® DEC (Evonik Industries, Essen, Germany), and light mineral oil (M8410, Sigma-
Aldrich, St. Louis, MO, USA) was prepared within 24 hours of device priming. The concentrations
were, by weight, 0.075 percent Abil, 90 percent Tegosoft, and 9.9 percent light mineral oil. This
continuous phase was pipetted into the inlet and outlet of the device main channel. The device
was then placed in a vacuum chamber under vacuum overnight to displace air from the channel
and array.
Samples were digitized in a 4°C cold room. A vacuum manifold formed from poly(methyl
methacrylate) was attached via double-sided Kapton tape to the SD Chip outlet. Drilled access
holes in this piece were used to interface with up to four SD chips in parallel to the vacuum pump
via connected tubing. In this arrangement, four devices were simultaneously connected to a
vacuum pump (DOA-P104-AA, Gast, Benton Harbor, MI, USA) that generated 575 mmHg
vacuum to create a pressure differential along the device channels to drive flow.
3.3.4 Digital RT-PCR.
Thermal cycling was performed in an Eppendorf Mastercycler® fitted with the in situ
Adapter (Eppendorf, Hamburg, Germany). A layer of light mineral oil was sandwiched between
the in situ Adapter and the device. GAPDH amplification was performed at two-step thermal

40
cycler conditions to optimize signal-to-noise: reverse transcription 50°C for 35 minutes, hot start
95°C for 2.5 minutes, denature 95°C for 15 seconds, and anneal/extend at 61°C for 30 seconds
(GAPDH) or 45 seconds (TFRC).
3.3.5 Data processing.
Imaging was performed using a variable mode imager (Typhoon FLA9000, GE Healthcare,
Pittsburgh, PA, USA) as described previously.29 Analysis was performed using ImageJ
(http://rsbweb.nih.gov). The same rolling ball background subtraction was performed on each
image. A macro was written in ImageJ to overlay region-of-interest (ROI) grids on the array to
collect mean and integrated intensity from the center and total area of each chamber. Two such
ROI grids were used per image. The first grid covered a small area in the center of the well, 16 x
8 pixels. The mean intensity in the center of the chamber was used to determine PCR positive
status, as chambers typically fall into either a PCR-negative or PCR-positive cluster as seen in
Figure 3.4. Chambers with a mean intensity below a low threshold were considered unfilled and
were discarded from analysis. Chambers with mean intensity above a high threshold were
discarded due to possible fluorescent fibers or dust that would give inaccurate assessment. A
second ROI grid covered the entire chamber area, 48 x 27 pixels, and the total intensity for this
area was determined in ImageJ. A ratio of total chamber intensity versus mean pixel intensity at
the chamber center multiplied by total chamber pixels was used as a second quality metric. It was
found that this value should be near 1 for a fully filled chamber. Chamber with values below a
low threshold were considered low volume and discarded from analysis, while chambers with
values above a high threshold were discarded due to possible fluorescent fibers or dust. The

41
volume of droplets on the outer edges of the array was found to decrease during thermal cycling,
therefore these volumes were not used in the analyses.
3.3.6 RNA standard curve.
A RNA standard curve was generated from total RNA (Total RNA Control (Human),
Applied Biosystems, Carlsbad, CA, USA). First, total RNA was reverse transcribed using a
combination of random primers and oligo(dT)s (iScript RT Supermix, BioRad, Hercules, CA,
USA). The resulting cDNA underwent two rounds of PCR amplification (SsoFast EvaGreen
Supermix, BioRad, Hercules, CA, USA) using GAPDH primers that had the T7 sequence. The
PCR-amplified cDNA was purified (MiniElute, Qiagen, Germantown, MD, USA) and its purity
was confirmed by melt-curve analysis and gel electrophoresis after each round of PCR. From the
purified cDNA, a 594 base pair ssRNA standard was generated using MegaScript kit with
TurboDNase treatment (Life Technologies, Carlsbad, USA). The resulting RNA standard was
purified (MegaClear Kit, Life Technologies, Carlsbad, USA), confirmed to be a single product by
gel electrophoresis, and quantified by UV absorbance (Nanodrop 2000, Thermo Fisher Scientific,
Waltham, MA, USA). Each kit was used according to the manufacturer’s protocol.
3.3.7 Single Cell mRNA FISH.
Cells were grown on Lab-Tek chambered cover glass (Thermo Fisher, Waltham, MA,
USA) for two days. Cells were washed with 1X PBS and incubated at room temperature in fixation
buffer (4 percent formaldehyde in 1X PBS, Sigma Aldrich, St. Louis, MO, USA) for 10 minutes.
Cells were washed twice with 1X PBS and stored in 70 percent ethanol at 4°C for one hour. Cells
were incubated for 5 minutes at room temperature with wash buffer (10% formamide, Ambion,
Carlsbad, CA, USA in 2X SSC, Ambion, Carlsbad, CA, USA), then incubated overnight in a 37°C

42
incubator in a hybridization buffer (10% formamide, 2X SSC, 125 nM FISH probes, 10% dextran
sulfate, Sigma Aldrich, St. Louis, MO, USA). TFRC FISH probes were obtained from Biosearch
(Stellaris® FISH Probes, Human TFRC with Quasar® 570, Biosearch Technologies, San
Francisco, CA, USA). The following day, cells were incubated 37°C with wash buffer for 30
minutes followed by a 30-minute, 37°C incubation with nuclear dye (wash buffer with 5 ng/mL
DAPI, Sigma Aldrich, St. Louis, MO, USA). Before imaging, cells were washed with 2X SSC
and covered with 25 μL Vectashield Mounting Medium (Vector Laboratories, Burlingame, CA,
USA) and an 18x18 mm No. 1 coverslip. Cells were imaged using a Nikon Eclipse Ti inverted
microscope fitted with a 60X, N.A. 1.4 objective. Image stacks were created by manually focusing
on image planes containing individual RNA spots, approximately 30 images per cell. Image slices
were evaluated using software developed by the Arjun Raj lab at University of Pennsylvania
(http://rajlab.seas.upenn.edu/StarSearch/launch.html).
3.3.8 Cell Culture.
SKBR3 cells were cultured in McCoy’s 5A Medium (ATCC, Manassas, VA, USA)
supplemented with 10% fetal bovine serum and 100U/mL penicillin and 100 mg/mL streptomycin.
K562 cells were cultured in Dulbecco’s Modified Eagle’s Medium (ATCC, Manassas, VA, USA)
supplemented with 1x L-glutamine, 10% fetal bovine serum, 100 U/mL penicillin and 100 mg/mL
streptomycin.
3.4 RESULTS AND DISCUSSION
Real-time quantitative PCR (qPCR) is considered to be the gold standard method for gene
expression assays.45 To analyze homogeneous, larger input samples well above the qPCR limit of
detection, ΔΔCT calculations are often used. These calculations relate expression of the target

43
gene to that of a control gene in the same sample, and results are normalized to a uniform input
sample.55 This accounts for random changes in target amount. As the input is reduced to quantities
near the limit of detection, the validity of this calculation is questionable. For single cell
measurements, errors are introduced from the variability of sample handling and PCR protocols.
Comparison of target and control gene are no longer relevant at the single-cell level, as cycles of
gene expression burst and degradation are known to occur across all genes, including
housekeeping or control genes.39,56 As a result of these sources of variability, ΔΔCT calculations
tend to compound error in single-cell measurements rather than reducing the contribution of
qPCR’s inherent experimental uncertainty.
To demonstrate the specific limitations of ΔΔCT qPCR for single cells, we analyzed
populations of a leukemia cell line, called K562, which is known for its high expression of the
BCR-ABL gene. BCR-ABL is a fusion gene resulting from a translocation that is the hallmark of
chronic myeloid leukemia. Typically, BCR-ABL expression is compared to a reference gene, such
as wild type ABL. Traditional qPCR methods were adapted for use with single cells to accurately
quantify fold differences between BCR-ABL and ABL expression levels down to less than single-
cell quantities, as defined by typical quality control descriptions (such as linearity of the standard
curve for titrated RNA, Figure 3.6). When this assay was applied to populations of cells, we saw
that as the cell number input to the reactions decreased from 100 down to a single cell, more
apparent variability in BCR-ABL gene expression was observed while the mean of each population
size was identical to that observed in extracted, homogenized RNA from these cells (Figure 3.1).
The high variability observed in these single cells shows that even in cell lines presumed to be
homogeneous, the differences in the expression levels of target and control genes is high.
Additionally, it is challenging to identify with certainty that the variability demonstrated was truly
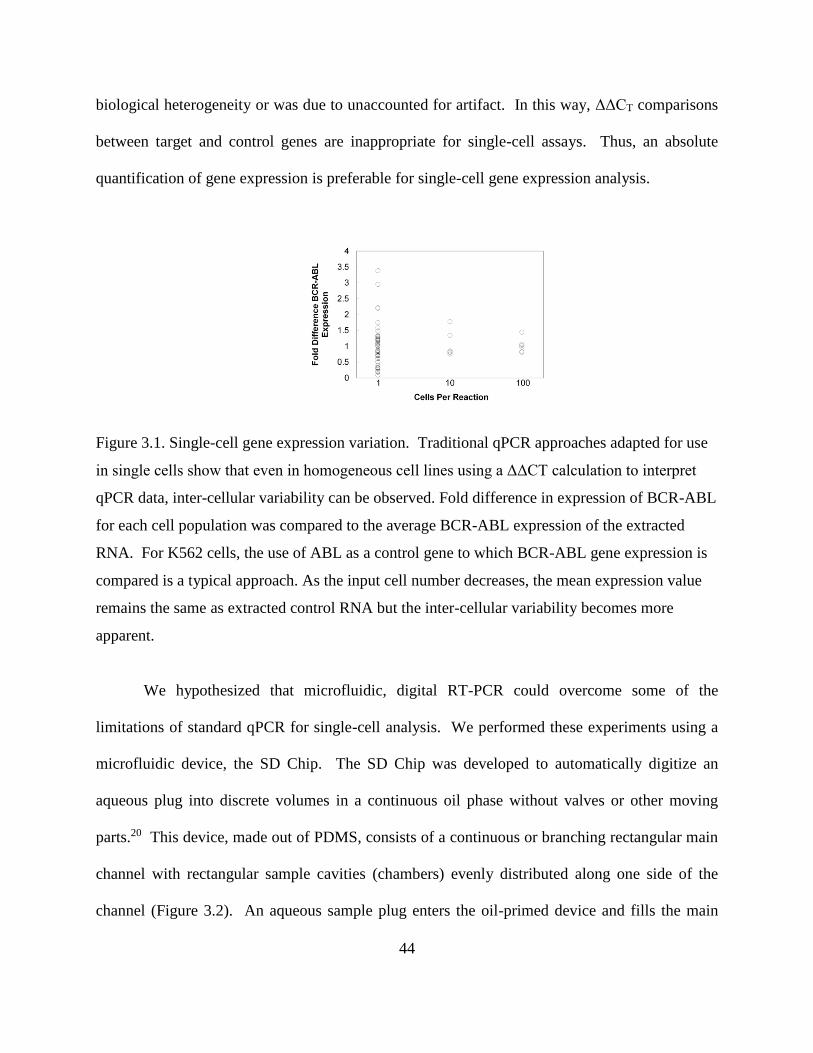
44
biological heterogeneity or was due to unaccounted for artifact. In this way, ΔΔCT comparisons
between target and control genes are inappropriate for single-cell assays. Thus, an absolute
quantification of gene expression is preferable for single-cell gene expression analysis.
Figure 3.1. Single-cell gene expression variation. Traditional qPCR approaches adapted for use
in single cells show that even in homogeneous cell lines using a ΔΔCT calculation to interpret
qPCR data, inter-cellular variability can be observed. Fold difference in expression of BCR-ABL
for each cell population was compared to the average BCR-ABL expression of the extracted
RNA. For K562 cells, the use of ABL as a control gene to which BCR-ABL gene expression is
compared is a typical approach. As the input cell number decreases, the mean expression value
remains the same as extracted control RNA but the inter-cellular variability becomes more
apparent.
We hypothesized that microfluidic, digital RT-PCR could overcome some of the
limitations of standard qPCR for single-cell analysis. We performed these experiments using a
microfluidic device, the SD Chip. The SD Chip was developed to automatically digitize an
aqueous plug into discrete volumes in a continuous oil phase without valves or other moving
parts.20 This device, made out of PDMS, consists of a continuous or branching rectangular main
channel with rectangular sample cavities (chambers) evenly distributed along one side of the
channel (Figure 3.2). An aqueous sample plug enters the oil-primed device and fills the main

45
channel and chambers. The aqueous plug is followed by the continuous oil phase which fills the
main channel and traps the aqueous sample into individual volumes with minimal loss to the
sample outlet. The SD Chip has been previously used for small molecule crystallization studies20
and for isothermal loop-mediated DNA amplification (LAMP).29 In this study, we extend its use
to digital one-step RT-PCR. The SD Chip is an excellent platform for a single-cell sample where
the available genetic material is small because the design maximizes the amount of sample
digitized in the array. Additionally, microfluidic features can be added for retrieval of volumes,
and the flexibility in the size and number of sample cavities per device makes the platform
amenable to match the dynamic range and resolution requirements for the gene of interest.
Figure 3.2. Components of the digital RT-PCR self-digitization chip. A) Image of assembled
device with sketch of chip components. B-C) Possible chip designs include: B) Bifurcated chip
design C) Serpentine chip design to minimize sample loss.
The implementation of RT-PCR in the SD chip, however, required four notable
modifications over the design previously used for isothermal amplification.29 First, since PCR
requires higher temperatures than the LAMP reaction, additional measures were necessary to
reduce evaporation of the digitized solution through the semi-permeable PDMS substrate. Second,

46
the number of chambers had to allow for quantification of low to intermediate abundance
transcripts present in a single cell (less than 1000 copies).57 Third, the continuous phase
composition had to be modified to accommodate both viscosity changes and the switch in
surfactant for the final PCR mix; the digitized volumes had to be prevented from shifting into the
device main channel at the PCR denaturation temperatures. Four, modifications to the sample
inlet and pressure source had to be made to facilitate sample loading and minimize sample loss in
the inlet.
An image and diagram of the device are shown in Figure 3.2 and assembly details are
shown in Figure 3.7. Notable features of this device compared to its predecessor include: (1) a
tapered, funnel-like sample inlet, interfaced with the microfluidic channel to minimize dead-space,
to direct a pipetted sample into the main channel, (2) the thin PDMS microfluidic feature layer is
sandwiched between a spin-coated PDMS glass microscope slide and a glass coverslip to prevent
evaporation above and below the array, (3) an oil-filled channel surrounding the array acts as a
horizontal evaporation barrier during thermal cycling (Figure 3.8). To fill the device, we found
that thermal stable oil-surfactant systems adopted from emulsion PCR systems ensure that the high
temperatures achieved during thermal cycling do not cause digitized volumes to enter into the main
channel where they might combine with neighboring volumes. Additionally, loading the chip with
negative pressure, using a vacuum pump on the outlet versus positive pressure on the inlet,
prevented overloading of individual chambers in the compressible PDMS substrate (Figure 3.9).
With these modifications, 88.0 percent (SD = 3.3%) of the single-cell sample was digitized in the
12 single cell experiments. In contrast, workflows for high-throughput, single-cell, microfluidic
qPCR using preamplification of cDNA before digitization typically use less than 5% of the
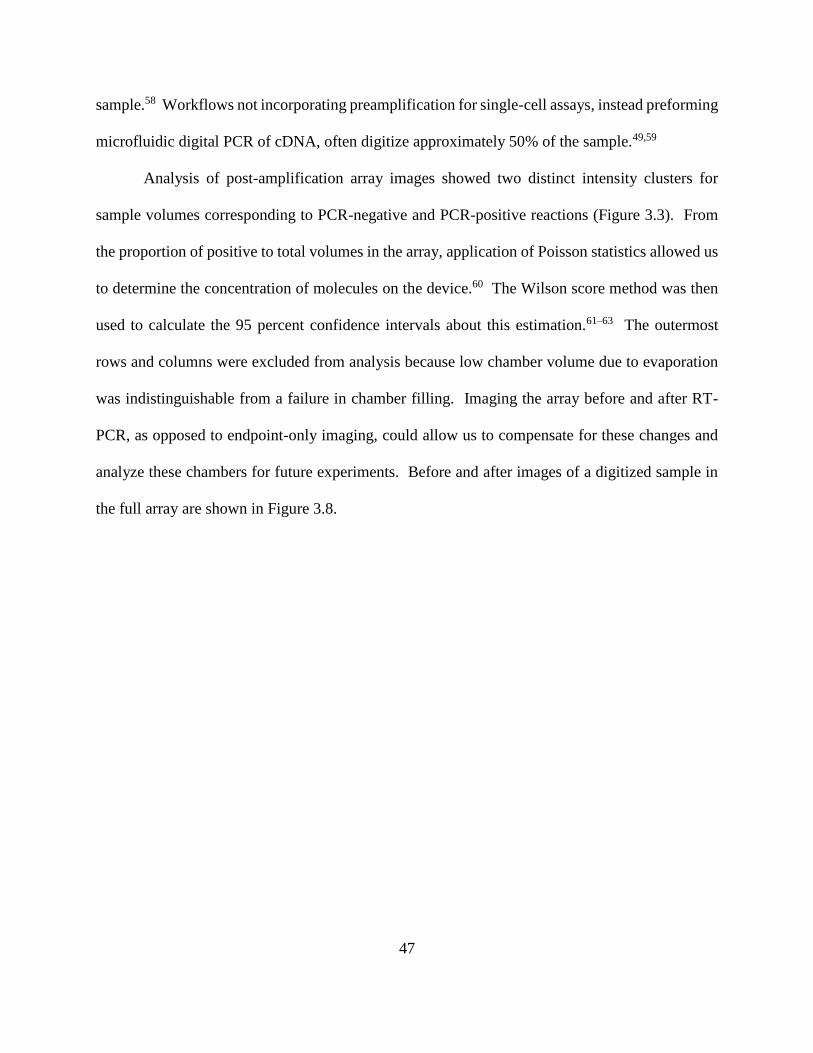
47
sample.58 Workflows not incorporating preamplification for single-cell assays, instead preforming
microfluidic digital PCR of cDNA, often digitize approximately 50% of the sample.49,59
Analysis of post-amplification array images showed two distinct intensity clusters for
sample volumes corresponding to PCR-negative and PCR-positive reactions (Figure 3.3). From
the proportion of positive to total volumes in the array, application of Poisson statistics allowed us
to determine the concentration of molecules on the device.60 The Wilson score method was then
used to calculate the 95 percent confidence intervals about this estimation.61–63 The outermost
rows and columns were excluded from analysis because low chamber volume due to evaporation
was indistinguishable from a failure in chamber filling. Imaging the array before and after RT-
PCR, as opposed to endpoint-only imaging, could allow us to compensate for these changes and
analyze these chambers for future experiments. Before and after images of a digitized sample in
the full array are shown in Figure 3.8.
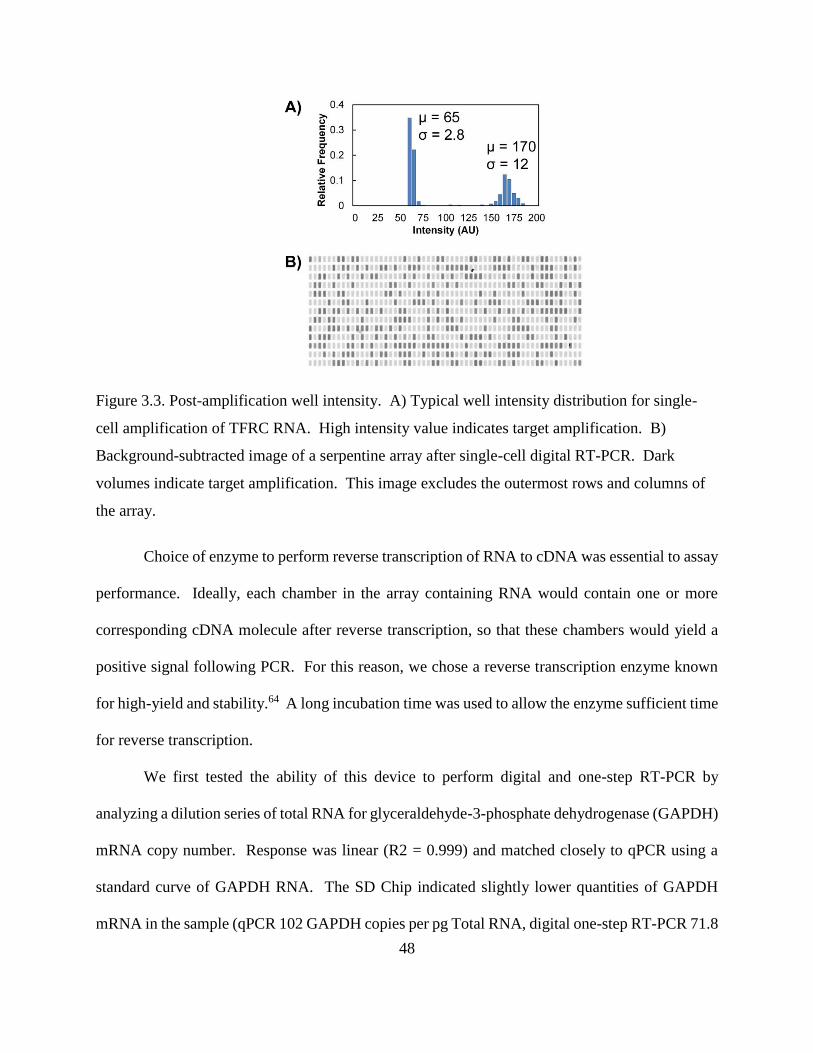
48
Figure 3.3. Post-amplification well intensity. A) Typical well intensity distribution for single-
cell amplification of TFRC RNA. High intensity value indicates target amplification. B)
Background-subtracted image of a serpentine array after single-cell digital RT-PCR. Dark
volumes indicate target amplification. This image excludes the outermost rows and columns of
the array.
Choice of enzyme to perform reverse transcription of RNA to cDNA was essential to assay
performance. Ideally, each chamber in the array containing RNA would contain one or more
corresponding cDNA molecule after reverse transcription, so that these chambers would yield a
positive signal following PCR. For this reason, we chose a reverse transcription enzyme known
for high-yield and stability.64 A long incubation time was used to allow the enzyme sufficient time
for reverse transcription.
We first tested the ability of this device to perform digital and one-step RT-PCR by
analyzing a dilution series of total RNA for glyceraldehyde-3-phosphate dehydrogenase (GAPDH)
mRNA copy number. Response was linear (R2 = 0.999) and matched closely to qPCR using a
standard curve of GAPDH RNA. The SD Chip indicated slightly lower quantities of GAPDH
mRNA in the sample (qPCR 102 GAPDH copies per pg Total RNA, digital one-step RT-PCR 71.8

49
GAPDH copies per pg Total RNA) (Figure 3.4A). Errors inherent to real-time PCR calibration
curves likely contributed to this variance, including UV absorbance measurements and variation
in enzymatic reaction efficiencies between standards and total RNA samples. This finding is
consistent with other studies comparing digital PCR and real-time PCR measurements.46
Figure 3.4. Amplification of GAPDH transcripts from total RNA. A) Measured GAPDH copies
versus total RNA input measured by qPCR or the SD Chip. B) Estimated GAPDH starting
concentration determined by digital RT-PCR at five dilution points. Dark blue bars represent
concentration estimation and 95% confidence intervals (CI) for each run; light grey bars
represent concentration and CI estimation for the sum of positive and total chambers for the three
SD Chips analyzed at each dilution.
Results from the GAPDH mRNA dilution series were also multiplied by their dilution
factors to return to the starting concentration of GAPDH mRNA in the total RNA starting sample

50
(Figure 3.4B). The final two points in this dilution series fell slightly below the average starting
concentration. This may be due to an error in the creation of the dilution series, either caused by
pipetting error or a loss of the minute quantities of RNA inside pipet tips or vessels used to prepare
reagents. These data are significant because it shows that any bias between low and high copy
numbers of the mRNA transcript is minimal. However, this result does not show that the absolute
quantities determined from the analysis reflect the absolute quantities of mRNA present in a single
cell.
Having shown that the SD chip’s digital one-step RT-PCR gave results comparable to the
qRT-PCR, we next sought to validate the absolute quantification of mRNA in single cells by
comparison with another single-cell mRNA quantification technique, single-molecule mRNA
FISH. FISH is independent of the variable efficiency of reverse transcription and PCR and was
developed specifically for quantification in single-cells. For these reasons, it’s an excellent
independent validation method. In this method, direct counting of single RNA molecules is
performed in a sample of fixed cells by attaching multiple probes labeled with fluorophores along
the length of each RNA. With high-resolution fluorescence microscopy, it is possible to identify
single RNAs as diffraction-limited spots in a z-stack of images. Challenges with probe design and
spatial resolution of fluorescent signals limits the compatibility of this method for highly
concentrated transcripts or for those that cluster within the cell.27 We chose to study the transferrin
receptor (TFRC) gene, a relevant protein in some cancers such as mantle cell lymphoma.65 The
typical intercellular mRNA spatial distribution and concentration for this gene made it an excellent
candidate for this study; a well-characterized TFRC FISH assay was commercially available.
We found that results from both methods agreed well, yielding on average 455 ± 171
(n=31) copies of TFRC transcripts per single cell using FISH and 442 ± 207 (n=12) copies using

51
the SD Chip with digital RT-PCR (Figure 3.5). This value is similar to TFRC values found in
HeLa cells using single-molecule FISH.66 We also found that the distribution of TFRC mRNA
copy number was similar between the two methods. The statistical error for dRT-PCR data,
displayed as 95% confidence intervals, are small compared to the variation in TFRC in these cells.
The magnitude of associated theoretical uncertainty per cell in digital PCR is dependent on the
total number of volumes analyzed, and thus can be reduced to fit the needs of the user by adding
more reaction volumes per sample.28,67 Importantly, unlike single-molecule FISH, digital, one-
step RT-PCR is not limited by the optical resolution of mRNA transcripts that cluster in vivo. The
number of digitized volumes per device also can be scaled to quantify transcripts of any abundance.

52
Figure 3.5. Absolute quantification of TFRC mRNA copies in single cells. A) Comparison of
single-cell TFRC copy number distributions using FISH or the SD Chip. Individual single-cell
measurements are presented (left) as well as the distribution of mRNA values (right). Histogram
bin size is 150 mRNA copies. Average copy number, standard deviation, and distribution were
similar for the two methods. B) False-color mRNA FISH image. Nuclei are colored blue and
TFRC mRNA appear as white spots. The scale bar is 10µm. C) Droplet containing a single cell
in PBS to be used for analysis in SD Chip; the inset shows the single cell pointed to by the
arrow. The scale bar is 100μm.
3.5 CONCLUSIONS
The SD chip is a simple device for sample digitization that is compatible with single-cell
digital RT-PCR. The device maximizes the fraction of sample digitized into the array, making the
design ideal for working with the occasional low mRNA copy numbers present in a single cell.
We have demonstrated that digital RT-PCR with reverse transcription performed in the digitized
volumes gives a linear response to the mRNA template concentration. Additionally, absolute
quantification of mRNA from single cells agrees well with the copy numbers obtained from
another absolute mRNA counting technique with the same transcript and cell line.

53
Counting absolute quantities of mRNA allows us to overcome the need for a reference gene
or calibration standard, which are restrictions at odds with the stochastic nature of gene expression
at the single-cell level and introduce technical variability. We feel that this method based on the
SD Chip can also be valuable as a calibration or validation tool for new mRNA measurement
techniques, such as digital systems with RT-PCR protocols, and other single-molecule counting
techniques, such as next-generation sequencing platforms or imaging techniques. Validation by
an independent device, such as the SD Chip, would allow for single-cell expression data to be
shared between laboratories even when different instruments and workflows are used.
Future work to improve the SD Chip for single-cell genetic analysis will focus on
increasing throughput. We recently demonstrated a high-density array for self-digitization of
sample volumes that could be adapted for improved copy number resolution in this device28.
Another modification could be a multiple-channel parallel scheme for the rapid analysis of many
cells. The chip could also be used for multiplex gene detection when combined with spectrally
resolved probes in each reaction chamber.
3.6 SUPPLEMENTAL INFORMATION
PCR primers
ABL:
5’-CAG GCA TCA ACA CTG CTT CTG-3’
5’-TCG GCC AGG GTG TTG AA-3’
probe: CalFluor Gold 540-5’-TGG CAA GCT CTA CGT CTC CTC CGA GA-3’-Black
Hole Quencher

54
BCR-ABL:
5’-CAT TCC GCT GAC CAT CAA TAA-3’
5’-AAC GAG CGG CTT CAC TCA GA-3’
probe: FAM-5’-AGC GGC CAG TAG CAT CTG ACT TTG AGC-3’-Black Hole
Quencher
GAPDH RNA standards:
5’-GAT GAT GTT CTG GAG AG-3’
5’-TAA TAC GAC TCA CTA TAG GGA TTT GGT CGT ATT GG-3’
Oligomers were purchased as standard, desalted DNA from Integrated DNA Technologies.
GAPDH and TFRC were purchased from a catalog of hydrolysis probe assays available
from Integrated DNA Technologies. GAPDH assay ID# Hs.PT.42.1164609 and TFRC assay ID#
Hs.PT.56a.3164874.

55
Figure 3.6. Results of qPCR for BCR-ABL or wild type ABL performed on individual, 10 or 100
K562 cells alongside a titration of extracted total RNA from K562 cells. While the duplex qPCR
assays demonstrated linearity and accuracy down to inputs of total extracted RNA below the
levels found in single cells (R2 of 0.9959, slope of -3.24 for ABL and R2 of 0.9979, slope of -
3.29 for BCR-ABL), the variability seen in single cells was far more than expected due to
technical variability alone.

56
Figure 3.7. Steps in SD Chip assembly. 1) Spin-coat PDMS on microscope slide and cure at
70°C for 3 hours, 2) plasma-bond PDMS feature piece to microscope slide, 3) plasma-bond
cylindrical outlet piece and cover glass to feature piece, 4) insert guidewire, place a small
amount of uncured PDMS over wire, and place PDMS inlet piece onto uncured PDMS. The
devices were cured overnight at 115°C and stored at room temperature before oil priming.

57
PDMS elastomer (Sylgard 184 silicone elastomer kit, Dow Corning Corp., Midland, MI,
USA) was mixed at a ratio of 5:1 for replication of microfluidic structures and for the spin-coating
of glass microscope slides. The PDMS was mixed at a ratio of 10:1 for inlet and outlet reservoir
features. Spin-coating of microscope glass and the microfluidic feature mold was performed at
4000 RPM and 300 RPM, respectively, for 1 minute each. PDMS was then cured at 70°C for 3
hours. Inlet features were cast against the outer bottom of a PCR tube, creating a tapered cylinder
inlet with a convex bottom surface to direct the sample into the main channel. Outlet features were
cut to fit from a slab of PDMS approximately 7 mm thick. An access hole was punched into the
inlet with a 16-gauge punch and another was punched into the outlet with a 10-gauge punch to fit
channel geometries. Devices were assembled in several steps. First, access holes were punched
in the microfluidic feature piece using a 10-gauge punch. This feature piece along with a PDMS-
coated glass slide was sealed on contact after exposure to oxygen plasma at medium level for 60 s
(plasma cleaner/sterilizer, Harrick Plasma, Ithaca, NY). In a second plasma treatment step, the
outlet feature and a No. 1 cover glass cut slightly larger than the array geometry were sealed to the
device to create an access reservoir and vapor barrier over the array. Next, a 38-gauge Ni-Chrome
guide wire was threaded part-way into the inlet channel. The inlet channel was sealed with a dab
of PDMS cured at 70°C for 15 minutes. The inlet reservoir was threaded along the wire and sealed
to the device with PDMS. The assembled device was incubated in a 115°C oven for 2 days to
promote hydrophobic recovery of the PDMS surface. Prior to continuous phase priming, the guide
wire was removed from the inlet and a piece of double-sided Kapton® tape (DuPont, Wilmington,
DE, USA), cut with access holes, was placed on the outlet feature.

58
Figure 3.8. Filled SD Chip serpentine array imaged at three stages of RT-PCR. A) Before
heating B) following reverse transcription and hot-start steps C) following reverse transcription,
hot start, and 40 cycles of PCR. Because chambers on the outermost rows and columns of the
filled array lose volume during heating, these volumes were excluded from analyses.

59
Figure 3.9. Images of filled chambers at ambient pressure following sample digitization. A)
When using an air compressor to drive flow during digitization, some chambers overfill and
sample is pushed into the main channel after pressure is released. The arrow indicates an area
where sample exits the chamber. B) When vacuum pressure was used to digitize the sample this
effect was not present.

60
Chapter 4. SINGLE-CELL ISOLATION AND ONE-STEP
GENOTYPING IN THE MICROFLUIDIC SELF-
DIGITIZATION CHIP

61
4.1 ABSTRACT
With the development of new high-throughput tools to analyze genetic material such as
next-generation sequencing, it has become well known to cancer biologists that inter-cellular
genetic variations occur within tumors. It is suspected that in some cases of cancer metastasis,
resistance to treatment, and disease relapse, the root cause is a subset of genetically-unique cells
and within the heterogeneous tumor. Measurements of heterogeneity in cancer are typically
carried out using quantitative data obtained from homogenized tissues. These data have thus far
been unsuccessful for informing treatment decisions. Part of the reason these data have failed to
provide a meaning impact could be due to the sometimes large and sometimes unmeasurable errors
in these systems. These errors occur in part due to technical errors in the measurements and also
result from the assumptions used to fit a single-cell model to ensemble measurements.
Development of single-cell methods to work alongside these measurements on homogenized
tissues could allow us to test our theories of tumor evolution and allow for new insights into genetic
heterogeneity. While some emerging methods have allowed researchers to study genetic
variability at the single-cell level, cost, uncertainty of clinical benefit, and technical barriers have
prevented the widespread use of these techniques over the course of a patient’s disease
management. In this chapter, we describe a simple, transparent assay to perform single-cell
genotyping for a recurrent mutation in acute myeloid leukemia. The method incorporates imaging
of single-cells in their reaction chambers and one-step PCR to identify mutant and wild-type alleles
from each single-cell. The method uses the SD Chip, a simple, valve-free microfluidic device.
The device allows for genotyping of hundreds of single cells in a single PCR run. The reaction
chambers are stationary throughout imaging and PCR, allowing us the ability to identify and
eliminate measurement errors such as false negatives and false positives.

62
4.2 INTRODUCTION
4.2.1 Genetic Heterogeniety (Clonality) in Cancer
Cancer is a highly heterogeneous disease, and with any newly developed treatment, only a
subset of patients will respond. Successful elimination of cancer relies on our ability to match the
unique characteristics of the neoplasm to the best suited treatment option. In certain cases, such
as HER2+ breast cancer, targeted therapies tied to specific diagnostic criteria have improved
outcomes for a subset of patients.
Increasingly available sequencing platforms have revealed in many cases complex
heterogeneities within a single patient. The evidence indicates that tumors are not clones derived
from a single cell, but instead multiple cancer cell clones exist within a tumor. A better
understanding of this heterogeneity has fueled theories as to why cancers presenting similarly can
result in highly different outcomes. It is now widely accepted among cancer biologists that
evolution of subsets of clones, either by the selective pressure of treatment or during the natural
history of the disease, is an important contributor to metastasis and relapse.68–71 Attempts to map
the evolution of these clones have resulted in models ranging from simple linear evolution models
to highly complex models with branching and convergence.72,73
Acute myeloid leukemia (AML) is an ideal case for us to study how intra-patient
heterogeneity affects outcome. Evolution of clones in AML has been observed previously,4–6,74
and considerable effort, including that by The Cancer Genome Atlas, has uncovered 23 mutations
that occur frequently in AML.75 Despite this wealth of information, efforts to correlate
chemotherapy outcomes with the presence of these 23 mutations have found only weak
correlation.76–78 A possible explanation for this lack of correlation is that the mutation status of a

63
patient has not been described in fine enough detail, and having a more accurate map of the clonal
variants within a patient could uncover stronger treatment correlations.
4.2.2 Clonality in the Bulk
Current tools to assess the clonal structure of a tumor have significant shortcomings that
make accurate calls difficult. The majority of work in tumor heterogeneity uses homogenized
tissue measurements rather than single-cell approaches. Assigning the landscape of clones in the
tumor requires fitting allele frequencies from this ensemble data to a model of clonal structure.
This process requires certain assumptions that may not be accurate. Typical assumptions are that
all mutations occur in cells in a heterozygous state, that more frequent mutations occurred early in
the cancer’s evolution, and that all mutations are one-time events in the tumor. The shortcomings
of these assumptions have been shown in single-cell analysis of AML, where simple clonal
structures assigned from ensemble measurements are found to be far more complex.79
Understanding the true clonal structure of these tumors will be important for understanding relapse
and developing approaches to eliminate the tumor fully and permanently.
While current next-generation sequencing ensemble measurements allow us to detect inter-
cellular heterogeneity, it is unclear how this information should be used to inform treatment
decisions.80–82 As long as cancer researchers remain interested in the impact of clonal
heterogeneity on patient disease progression, refining the tools used to assess this heterogeneity
will be necessary. Using the most accurate tools available can only serve to accelerate research
into this complex phenomenon. Monitoring clonal heterogeneity throughout treatment can allow
for refinement at each stage, so that the most problematic clones are continually targeted.

64
4.2.3 Single-Cell Genetic Approaches
Improvements in sensitivity of NGS, as well as innovative fluid handling techniques, have
allowed researchers to view genetic, epigenetic, and transcriptomic heterogeneity at the single-cell
level. This work has produced large amounts of data on a relatively small patient population,83
but is still in its infancy and remains challenging. Technical and statistical issues remain, including
the difficulty of addressing allele dropout and bias introduced during gene amplification.73 Despite
cost reductions in these techniques, the technical and computational challenges, as well as the need
to generate large amounts of data to reach statistically meaningful numbers, limits the utility of the
techniques. Crucial next steps towards making relevant biological conclusions from single-cell
analyses include unifying the technical ability to derive accurate data at the single-cell level,
developing methods to appropriately process and filter these data, and scaling techniques to study
larger cohorts of patients.
A microfluidic approach to single-cell genetic analysis provides potential advantages over
conventional genomic analysis.41 The ability to manipulate small quantities of fluid can drastically
reduce reaction volumes for manipulating genetic material, bringing down the cost of expensive
enzyme solutions and allowing the user to work at scales much closer to single-cell volumes.
There is evidence that using a microfluidic-scale reaction volume can improve sensitivity and
reduce amplification bias sometimes apparent in standard-volume DNA amplification.32,84 The
detection limit for PCR at these picoliter or nanoliter-volumes routinely reaches single-molecule
sensitivity.47,85
In this manuscript, we describe a method to perform single-cell genotyping in a low-cost,
simple format. The method allows us to locate and confirm the presence of a single cell prior to
PCR. The microfluidic volumes are stationary throughout the process, allowing us to determine

65
which cells produced PCR amplicon and which cells failed PCR. In this way, our method allows
us to directly measure points of bias and error in the system.
The partitioning of single-cells and subsequent genotyping is accomplished using the
microfluidic self-digitization chip (SD Chip). The SD Chip is a microfluidic device used to
generate a 2D array of digitized, stationary volumes. The device has been described and
characterized previously,20,28 and has been used to perform both mRNA and DNA
amplification,29,85 including amplification of mRNA from single cells.85 The SD Chip platform
provided us the freedom to alter reaction buffer composition as needed, and the design flexibility
allowed us to perform the protocol using only common and commercially available laboratory
instrumentation (vacuum pump, microscope, thermalcycler, gel scanner). A schematic of the
method is presented in Figure 4.1.
Figure 4.1. Overview of single-cell genotyping assay. LNA hydrolysis probes were designed
specific to the wild-type gene, the NPM1 insertion mutation, and a non-mutated control region.
Cells were loaded into the microfluidic array and imaged to locate single-cells. PCR was
performed in the array and intensity of the three probe colors was measured to determine
zygosity of single-cells.
4.3 MATERIALS AND METHODS
4.3.1 Cell Lines and Template DNA
OCI-AML3 cells (DSMZ) were cultured in 20% FBS (VWR) in RPMI media (Gibco).
Before qPCR use, cells were washed once in DPBS and resuspended in DPBS. Genomic DNA

66
was extracted from cells using Qiagen Gentra PureGene Cell Kit (Cat No./ID: 158745), according
to manufacturer’s protocol. Reference sequence plasmids for NPM1 alleles were lab-designed and
purchased from Life Technologies. Plasmids were ordered from Life Technologies (now part of
Thermo-Fisher). Single-zygosity plasmids (homozygous mutant or homozygous wild-type)
contained one copy of the amplicon region per plasmid. Heterozygous plasmids contained one
copy of wild-type and one copy of mutant amplicon region inserted in series.
4.3.2 Allele Discrimination Primers and Probes
Primers were designed to amplify a 162 base-pair (166 bp with insertion) stretch of
genomic DNA spanning the NPM1 insertion site. A FAM-labeled general amplification
hydrolysis probe was designed as a positive-control to confirm amplified product. Locked nucleic
acid (LNA) allelic discrimination hydrolysis probes were designed according to the criteria
outlined in You et al.86 —one HEX-labeled wild-type-specific probe and one Cy5-labeled NPM1-
insertion-specific probe. All probes were ordered from IDT. Fluorophores for each probe were
chosen to minimize fluorescent overlap between probe targets, for optical compatibility with Real-
Time and microfluidic device imaging systems, and for maximum signal for allelic discrimination.
Primer and probe sequences are listed in Table 4.1.

67
Table 4.1. Primer and probe sequences. Nucleotides are listed 5’ to 3’. Locked nucleic acid
(LNA) bases are indicated with a “+” before the base. Primers and probes were ordered from
IDT DNA. Probes were purified by HPLC. IBFQ is 3’ Iowa Black® FQ. IBRQ is 3’ Iowa
Black® RQ.
Forward primer GTCTATGAAGTGTTGTGGTT
Reverse primer CGGTAGGGAAAGTTCTCA
Wild-type specific probe HEX-AGAT+CT+CT+G+G+CAG-IBFQ
Mutation specific probe Cy5-AGA+TC+T+C+T+GT+CTG-IBRQ
Positive control probe FAM-ATT+TCTGTA+ACAGTT+GATATCTGGC-IBFQ
4.3.3 PCR Conditions
PCR conditions were optimized for maximum allele discrimination and endpoint
fluorescence in a 10 μL standard PCR reaction. The optimized buffer was composed of 1.5X PCR
Buffer solution (Invitrogen), 4.5 mM MgCl2, 0.6mM each dNTP, 750 nM each primer, and 600
nM each probe. All bulk qPCR reactions were performed on a BioRad CFX384. To simulate on-
chip cycling, the following PCR protocol was used: 95°C for 3 minutes then 60°C for 1 minute,
cycled 3 times followed by 95°C for 15 seconds then 60°C for 45 seconds, cycled 40 times. The
heating ramp rate was set at 1.5°C/second; the cooling ramp rate was 0.9°C/second. For standard
PCR, plasmid templates were used at 104 copies per reaction. Genomic DNA was used at a
concentration of 10 ng per reaction, and whole cells were used at 2000 cells per reaction.
4.3.4 Cell lysis experiments
For cell imaging experiments to study the effect of PCR buffers on cell membranes, cells
were incubated with calcein violet AM at a concentration of 5 mM for 30 minutes. Cells were
washed once and resuspended in DPBS. Cells were spiked into PCR buffers or PBS containing

68
0.5X EvaGreen dye. Solutions were loaded immediately into a hemocytometer and imaged on an
Olympus MVX10 macrozoom microscope with a 2X objective at zoom 0.63X.
4.3.5 SD Chip Fabrication
SD chips were fabricated using soft-lithography as described previously.85 The desired
micro-scale features were drafted using CAD software (AutoCAD) and printed in high-resolution
on transparent film (Fineline Imaging). Masters were constructed from transparencies using
photolithography on silicon wafers spin-coated with SU-8 photoresist (Microchem) according to
manufacturer protocol. PDMS (Dow Corning) was cast against these silicon and SU-8 masters.
Oil reservoirs were created for the device inlets and outlets by punching through-holes in
additional PDMS blocks. Glass slides were cleaned by boiling one hour in a base bath of 1:1:1
ammonium hydroxide : 35% hydrogen peroxide : MilliQ water, then rinsed with water followed
by ethanol, dried under nitrogen, and spin coated with PDMS. Final device construction occurred
in two oxygen plasma bonding steps; first the master replica to the spin coated glass slide, and then
the inlet/outlet reservoirs and coverglass vapor barrier. Devices were baked in a 115°C oven for
24-72 hours, then used immediately or stored at room temperature for up to two weeks.
4.3.6 SD Chip Priming and Loading
Devices were primed with an oil mixture prior to sample loading. This mixture was
composed of Abil We 09 (Evonik), Tegosoft DEC (Evonik), and light mineral oil (Sigma). The
proportions of each component varied with the surfactant content of the aqueous sample. For
aqueous samples without added triton x-100, a mixture of 0.030% Abil, 93% Tegosoft, and 7.0%
light mineral oil was measured by weight and mixed by vortexing. For aqueous samples including
triton x-100, the ratio was 0.006% Abil, 93% Tegosoft, and 7% light mineral oil. In each case, the

69
oil mixture was added to the inlets and outlets of the device such that each reservoir was half-
filled. The device was placed in a sealed chamber and vacuum was applied to a pressure of -23
inches of Mercury. The device was held under vacuum for 5-30 minutes. The pressure was then
released and was inspected under the microscope to ensure no air pockets remained in the device
channels or chambers. Infrequently, devices would be found to still contain air after five minutes
at atmospheric pressure. These devices were placed under vacuum for an additional five minutes.
Any devices containing air at this point were considered defective and not used.
Devices were loaded in a cold-room at 4°C. The aqueous PCR samples were loaded
directly into the device inlet-reservoir under the surface of the residual oil from device priming.
A vacuum gasket was aligned with the device outlet reservoirs and attached using double-sided
Kapton tape. Vacuum was applied at a regulated -8 in Hg, pulling the sample through the device
and digitizing the sample. When no remaining aqueous sample was visible in the device inlet,
after approximately 8 minutes, remaining oil in the inlet was exchanged for a mixture of 99.97%
50 cSt silicone oil and 0.03% Abil. This mixture was allowed to flow into the device for 4 minutes
before vacuum was released. Any aqueous sample in the device outlet was removed by pipet. Oil
reservoirs were filled with the silicone oil and Abil mix.
4.3.7 Imaging of Captured Cells
The array was imaged using the Olympus MVX10 macro zoom microscope. The
microscope was outfitted with a 2X objective and a 0.63X demagnifying camera adapter, and was
used at zoom 0.63X, for a total image magnification of 0.8X. A Prosillica GX1920 camera
controlled by Labview to capture images. For fluorescence images, illumination was provided by
an X-Cite 120PC Q mercury light source (Excelitas Technologies) using filter set for FITC

70
(Semrock) at 750 ms exposure. Eight images were collected per array and stitched together with
home-built software.
4.3.8 SD Chip thermalcycling
Loaded and imaged devices were cycled on a Mastercycler fitted with the in situ Adapter
(Eppendorf). A cell lysis and denaturing step was performed with three cycles of 97°C for 2 min
and 60°C for 1min, followed by 45 cycles of thermalcycling at 97°C for 30 seconds and 60°C for
1minute.
4.3.9 Post-PCR Imaging
Devices were imaged post-PCR using a Typhoon FLA 9000 (GE) at 25μm resolution.
Channel PMT values were 600, 800 and 1000 for FAM, HEX and Cy5 respectively.
4.3.10 SD Chip Image analysis
For each array of the device, the FAM image was thresholded based on the PDMS
autofluorescence to create a mask. This mask was applied to each array’s FAM, HEX and Cy5
images and a region-of-interest grid was overlaid. The integrated density of each region of interest
was measured and normalized by the well’s aqueous volume as determined by the mask. Channels
between wells were analyzed for aqueous content. Both the normalized integrated density data and
the well linkage data were merged with cell count data. A binary positive/negative fluorophore
signal was manually determined using each fluorophore’s baseline fluorescence in that array, and
for wells containing a single cell this binary was used to determine zygosity.

71
4.4 RESULTS AND DISCUSSION
4.4.1 Cell lysis
In order to perform analysis on single cells, the components necessary for PCR
(thermostable DNA polymerase, dNTPs, primers, dyes or probes) must either enter the nucleus or
the template DNA must be freed into solution. Additional manipulation may be necessary if the
target is tightly bound by histone proteins in the chromosomes. Methods of cell lysis to free mRNA
or DNA include chemical and mechanical stressors. Due to our desire to perform PCR directly
from whole cells without fluid exchange, any method of cell lysis would need to be compatible
with the thermostable DNA polymerase.
Sonication is one form of mechanical cell lysis where pressure waves are created in
solution to destabilize cell membranes. Although this method would be expected to disrupt a
polymerase protein, sonication is used in the purification of recombinant polymerase from E. coli,
and therefore might be compatible with our one-step system. Sonication for cell lysis in
microfluidic devices has been previously reported. Taylor et al. demonstrate cell lysis in
microfluidic channels using an ultrasonic horn tip coupled to the fluid via a flexible interface.87
Potential drawbacks to implementing this form of lysis in our device include the added complexity
needed to interface with the wells and ensure that waves of sufficient strength are distributed
evenly across the array. Ultrasonic horn tips also generate high amounts of heat, often requiring
that solutions be kept on ice during sonication in short bursts of a few seconds. Precautions such
as these would need to be implemented on-chip to avoid damage to the DNA polymerase. Indeed,
a few initial attempts to introduce ultrasonication by immersing a horn tip in the oil of the inlet
reservoir resulted in smoking at the tip with no visible effect on the cells in the chambers.

72
Lasers can also be an effective means of cell lysis. In our laboratory, lasers have been used
to disrupt membranes of lipid vesicles in solution.88 It is understood that a pulsed laser is able to
form a cavitation bubble which expands and collapses, physically damaging the cell membrane to
permit lysis.89 The low throughput of this method made it an unreasonable choice.
Given that the device will be heated on a programmable block to perform PCR, a thermal
lysis method would be the simplest to implement into the protocol. Thermal energy has the
capacity to damage cells by disrupting bonds in the fluid lipid bilayer and disrupting membrane
proteins, allowing cell contents to disperse. Thermal lysis is sometimes used in crude preparation
of DNA from cells for PCR. This would typically be carried out by boiling the sample at 100°C
for a short time in low-osmolality solution. DNA polymerase and other PCR reagents would be
added after this step, allowing the polymerase to escape premature thermal damage.
A few studies have attempted to use thermal lysis in a one-step PCR reaction, where whole
cells deposited in a PCR reaction would undergo a polymerase-compatible heat lysis program prior
to PCR cycling. In one study, PCR reagents including un-purified blood underwent one
freeze/thaw cycle followed by 20 cycles between 90°C and 50°C for 1 minute each.90 In another
study using whole blood directly in PCR buffer, samples a two-step incubation was performed
(94°C 3 minutes and 55°C 3 minutes repeated 3 times) prior to typical PCR thermalcycling.91 This
two-step incubation ramping protocol gave improved results over a continuous incubation at 94°C.
Taq polymerase, though described as a thermostable enzyme, is not undamaged by
temperatures required to denature DNA for PCR. The half-life of Taq polymerase is reported to
be 40 minutes at 95°C, and only 5 minutes at 97.5°C. It is worth noting here that such one-solution
thermal lysis is incompatible with reverse transcription enzymes. The half-life of reverse
transcription enzymes is only five minutes at 80°C.

73
Freeze/thaw is another method of disrupting proteins and membranes that has been used to
lyse cells for PCR. In one study were one-step cell lysis and PCR was performed, it was found
that performing a short denaturing step at 95°C made freeze/thaw more effective.92
Chemical lysis is the most common form of DNA or RNA preparation from cells.
Proteinase K, a common addition to cell lysis buffers, is damaging to the polymerase protein, but
some surfactants employed in cell lysis are also common PCR additives at low concentrations.
Tween-20, Triton X-100, used at around 1% in lysis buffers, are both considered to stabilize DNA
polymerase at a concentration of less than 0.1%. This low concentration is likely enough to do
significant damage to cell membranes. A study of the effects of Triton X-100 on cell membranes
using SEM found that concentrations below 0.01% caused membrane permeabilization.93 Triton
X-100 was successfully used to generate PCR product direct from whole tissues at a concentration
of 0.4%.94
In microfluidic devices, these methods have been used in various forms and combinations
to perform DNA or mRNA extraction a microchambers. Some of these methods rely on
subsequent reagent exchanges to perform genetic amplification steps. Methods to extract mRNA
typically rely on chemical lysis strategies49,84,95–97 or heating.98 DNA extraction in microchambers
has been carried out using dehydration,99 chemical lysis.100–102 In one study, researchers were able
to selectively extract the mRNA and DNA separately from individual cells, using chemical lysis
to extract mRNA and increasing the pH of the solution to lyse the nucleus.103
While it may be easy to imagine a cell bursting open with violence with chemical lysis, the
method could at times be gentle enough to disrupt only certain fractions of the cell while leaving
structures intact. Irimia et al., using fluorescent markers selective to cell structures, found that
actin and DNA were not quickly freed into solution using their on-chip chemical lysis strategy.101

74
4.4.2 Characterization of Pre-Made PCR Master Mixes
As a starting point for investigating PCR directly from whole cells, we tested the effects of
several pre-made master mixes on whole cells. Initial tests revealed that some commercially
available PCR master mixes were more cell-disruptive than others. Three master mixes were
tested, all from BioRad. To test the effects of these buffers on cell membranes and nuclei, cells
were stained with either Hoechst or calcein violet and imaged in these buffers. Hoechst is a nuclear
stain able to penetrate both live and dead cells. Calcein violet is a live-cell cytoplasm stain. In
Figure 4.2, fluorescence images are shown for each buffer for cells stained with the Hoescht
nuclear stain or calcein cytoplasm stain. In the control solution, 1X DPBS, we can see both the
nucleus and cytoplasm of the cells. In BioRad QX200 buffer, cell membranes do not appear to
lyse, with the cells appearing as in the PBS control, with both calcein and Hoechst visible in live
cells. In BioRad iTaq buffer, cell membranes appear to lyse rapidly, allowing the calcein to diffuse
into solution, but the nuclei appear intact, stained with Hoechst. This same result was seen in
BioRad SsoFast buffer.

75
Figure 4.2. Cell membrane lysis in PCR buffers. SUPB15 cells stained with either a nuclear
stain (Hoechst 33342) or cytoplasm stain (calcein violet) were imaged in either 1X PBS or 1X
PCR reaction mix. Images were captured immediately at room temperature. Intact nuclei are
seen in all buffers, while cytoplasm stain diffuses quickly in both iTaq and SsoFast buffers,
indicating loss of cell membrane integrity. Scale bars are 100 μm.
The BioRad QX200 ddPCR buffer, being the least cell-disruptive, was determined to be
the best candidate moving forward. Cells were labeled with a live-cell cytoplasm dye, calcein
violet, which would have low spectral overlap with EvaGreen and allow for probe detection with
multiple colors, including FAM, HEX, and Cy5.
Initial tests showed high false negative rates, with less than 10 percent of imaged cells
providing PCR signal, as well as high false positive rates, with over 30 percent of PCR signals
resulting in a cell-negative well. Suspecting that some of the false-positive signal was a result of
cell lysis during filling, devices were loaded cold at 4°C. These experiments did result in lower
false positive rates, though the percentage of cells producing signal now fell below 5 percent.

76
Thermal cycling conditions were varied in an attempt to disrupt the cell membrane and
nucleus to free the gene template for PCR. These conditions are listed in Table 4.2. Under all
conditions attempted, false negative rates remained prohibitively high, with little difference seen
between conditions. Positive control experiments were performed in parallel to each cell
experiment to ensure the thermal lysis conditions did not disable the polymerase. This positive
control array, containing template plasmid, showed expected concentrations of template for all
conditions tested.
Table 4.2 Summary of lysis conditions investigated to reduce false negatives.
A 95°C 3 minutes, 60°C 3 minutes, repeated 3x
B 90°C 1 minute, 60°C 1 minute, repeated 20x
C 90°C 30 seconds, 60°C 30 seconds, repeated 40x
D Freeze-thaw -20°C to room temperature, repeated 2x, then condition
“B”
E Freeze-thaw -80°C to room temperature, repeated 2x, then condition
“B”
Because the number of cells producing signal was so low in the ddPCR buffer, we
hypothesized that a more cell-destructive PCR buffer might be useful. Although the SsoFast buffer
causes cell membrane lysis, the cell nucleus appears to remain intact and still could allow for cell
imaging. Knowing that a cytoplasm stain would be ineffective with this buffer, a nuclear stain
was needed. Hoechst was ineffective because high background fluorescence from PDMS in the
UV channel made cells difficult to detect. However, it was found that the EvaGreen contained in
the master mix is an effective nuclear stain. Other nuclear stains, such as Draq5, could be a good
option to avoid spectral overlap with the probes. Some of the dye options we explored are
described further in Appendix A.

77
From two runs using the SsoFast buffer, it was apparent that this cell membrane disruptive
buffer was indeed better at producing PCR signal from whole cells. From two devices, 90 percent
and 75 percent of cells produced PCR signal. False positives were relatively low, with less than
10 percent of non-cell-containing wells producing signal.
This understanding of how chemical composition of the buffer affects cell membrane and
cell nucleus, as well as its effect of the successful PCR amplification of whole cells, laid the
foundation for developing the method. The next challenge was to develop a genotyping assay that
would detect both mutant and wild-type sequences in the same well with high sensitivity and
specificity.
4.4.3 Detection Chemistries for Allelic Discrimination Genotyping Assays
In order to perform the probe-based allele discrimination assay, a three color detection
scheme was proposed as outlined in Figure 4.1, with one color used as a positive PCR control, and
one color for each allele of the gene of interest. Three probe options were investigated for the
allelic discrimination. These probe types are illustrated in Figure 4.3.
The first choice for these probes was the Taqman hydrolysis probe assay. This probe type
was used for the gene expression assay in Chapter 3. Taqman assays are used widely in real-time
PCR, and are favored for their relatively low cost, design flexibility, and high signal to noise.
Taqman probes depend on the 5’ to 3’ exonuclease activity of DNA polymerase, such that
the probe will be destroyed during primer extension, releasing fluorophore from its quencher
molecule into solution. It has been reported that this interaction of the probe with the polymerase
can slow extension of the strand. These probes may also not be ideal for allelic discrimination, as
even loosely-bound, mis-matched probes could be cleaved by DNA polymerase. In the case of

78
only a single base pair difference between alleles, this mis-matching is likely to occur to some
extent.
Figure 4.3. PCR detection chemistries investigated for the single-cell genotyping protocol.
Intercalating dye bind dsDNA non-specifically to signal amplification. Taqman probes contain a
dye linked to a quencher by a short, allele-specific sequence that is cleaved during extension.
Molecular Beacon probes contain a short, self-complementary stem flanking an allele-specific
sequence. A fluorophore and quencher at either end of the molecular are separated upon probe-
template hybridization. Scorpion probes use a design similar to Molecular Beacons, but the
probe portion is covalently linked to one of the PCR primers. After extension, the probe is
bound to the sequence being interrogated, increasing reaction kinetics.
We attempted to design several Taqman allele discrimination assays with some success.
One of the taqman assays performed well in a home-made buffer containing Platinum Taq
polymerase, but performed poorly in BioRad SsoAdvanced EvaGreen buffer. This data is shown
in Figure 4.4.

79
Figure 4.4. Probe-based allele discrimination in two different PCR mixes. A) In a home-made
PCR mix with Platinum Taq Polymerase, reactions with wild-type (WT) plasmid produce signal
from WT probes but not mutant (MT) probes, and MT plasmid reactions produce signal from
MT probes but not WT probes. B) In BioRad SSoAdvanced buffer, reactions with WT plasmid
produce signal from WT and MT probes, and MT plasmid reactions produce MT probe signal
and potentially low levels of WT probe signal.
Molecular Beacons are not dependent on enzyme cleavage for detection, and thus might
be less sensitive to changes in assay enzyme. Like Taqman probes, Moleular Beacon probes are
single-stranded DNA with a fluorophore at one end and a quencher molecule on the opposite end.
Unlike Taqman probes, Molecular Beacon probes contain a self-hybridizing “stem” portion
flanking the gene-specific sequence. In this way, the unbound probe forms a stem-loop where

80
fluorophore and quencher are in close proximity. Upon probe binding, fluorophore and quencher
are separated by enough distance that the quencher effect is negligible. Given sufficient time for
hybridization to occur, it is thus the thermodynamic competition between stem-loop structure and
probe-template structure that determines overall solution fluorescence. In the case of a single base
mismatch between template and probe, the probe could be designed such that the stem-loop is
more favorable than binding of mistmatched probe, making for strong discrimination between
match and mis-match.
Compared to Taqman probes, disadvantages of molecular beacons include the increased
cost of a longer probe. Additionally, Molecular Beacon probes have a temperature dependent
fluorescence. Imaged at a temperature too high, the probe will denature from a matched template
and assume a random coil with fluorescence intermediate to the bound probe and stem-loop
conformations. Imaged too low, the molecular beacon could hybridize a mis-matched template.
As with Molecular Beacons, Scorpions probes also contain a stem-loop structure that is
linearized upon binding to a target sequence. In a Scorpions probe, the stem-loop probe is
covalently bound to one of the PCR primers via a hydrocarbon linker. In this way, the probe
becomes bound to the newly synthesized PCR product. Here, the probe can bind the product strand
by hinging on the hydrocarbon linker to bind the complementary strand upstream of the prime, or
remain as a stem-loop structure. The thermodynamics of probe binding in this system should be
similar to that of the Molecular Beacon, but the reaction kinetics for this conformation would be
faster for the Scorpions Probe due to the intramolecular mechanism. This increased reaction
kinetics was found to be true in one study, where Scorpions Probes outperformed Molecular
Beacons under rapid PCR cycling conditions, but results were similar between the two when slow
cycling was used.104

81
Variations on the original Scorpions probe design could be useful for some applications.
A Scorpions bi-probe design removes the stem sequence from the beacon portion of the probe. In
this design, the fluorophore is attached to the probe sequence and a second molecule containing
the quencher can hybridize to the probe. This bi-probe design is less expensive than the uni-
molecular design. The effectiveness of this alternate design may depend on assay design, as the
bi-probe has at times been reported to be more105 or less sensitive than a uni-molecular design.
Another option in designing this probe is to use the primer portion of the molecule to perform the
allelic discrimination, with the probe portion of the Scorpion complementary to a conserved region
upstream.106,107 This method allows for the more common allelic discrimination method using
allele-specific primers, but adds the fluorescent reporter necessary for protocols such as ours.
Beacon Designer software (Premier Biosoft) was used to design allelic discrimination
assays for several different genes of interest. For the six genes attempted, no Scorpion assay
designs were suggested by the program. This could be expected, as the design for Scorpion probes
is the most restrictive, requiring the placement of favorable primer-binding and probe-binding
regions of the target gene to be near one another, while Taqman and Molecular Beacon assays can
have probe binding regions nearly anywhere along the amplicon.
4.4.4 Assay Optimization in Standard PCR
Knowing that buffer composition could affect both the ability of our method to work from
whole cells, and our ability to discern wild-type and mutant alleles, we chose to work with a PCR
buffer with known composition and optimize it with additives.
We developed a hydrolysis-probe based, one-step PCR assay to simultaneously and
specifically detect both wild-type and mutant alleles. We introduced a third probe, located

82
upstream of the mutated region of the gene as a non-discriminate amplification control. We
selected the NPM1 Type A insertion mutation occurring in the OCI-AML3 cell line. Locked
nucleic acid (LNA) probes were used to increase the discrimination ability of hydrolysis probes,
and are often recommended for SNP assays. Fluorophores for the probes were selected to
minimize spectral overlap. The FAM color was chosen for the control probe, HEX for the wild-
type allele, and Cy5 for the mutant allele.
We tested the specificity of the LNA probes both for a standard 10μL PCR reaction and
for reactions in the SD Chip. Plasmids containing one mutant copy of the NPM1 allele produced
only signal from the mutant and control probes. Likewise, the wild-type plasmid only produced
wild-type and control signal. This specificity was seen both in standard PCR and on-chip. On the
SD Chip, the plasmids were dilute enough such that some wells did not contain plasmid DNA.
Each plasmid was loaded onto a separate device. Empty wells show only background fluorescence
post-PCR, while other wells contained both control signal and the signal specific to the allele
present. Data is shown Figure 4.7.
Thorough optimization of the assay was necessary to ensure accurate zygosity calls. Due
to the reduced size of in aliquot in SD Chip PCR versus standard PCR, the signal from the SD
Chip is considerably lower than in a standard reaction due to delayed cell lysis, inhibition, or
fluorophore quenching. Signal intensity can also suffer using a whole cell as a PCR template
versus purified DNA. We therefore optimized the reaction in standard PCR for maximum signal
intensity from whole cells, while retaining specificity from plasmid templates.
Another requirement of this microfluidic technique is a PCR reagent solution that would
allow whole cells or intact nuclei to survive digitization and allow for cell imaging in the device.
Some PCR additives are also components of cell lysis solutions, and high surfactant concentrations

83
have been used previously for PCR directly from whole-cells.94 We tested regents with varying
concentrations of surfactants in standard PCR to determine how these additives affected specificity
and endpoint signal. For these whole-cell template reactions, concentration of cells were selected
to approximate the concentration of one cell in a single 6nL microfluidic well, which translates to
2000 cells in a 10μL PCR reaction.
For the conditions tested in standard PCR, we found that Triton X-100 had a noticeable
effect on endpoint fluorescence from genomic DNA and whole-cell starting material. In Figure
4.5, the results from standard PCR with increasing concentrations of Triton X-100 are shown.
Specificity of the reaction can be seen from the asterisks and plus signs, representing the wild-type
and mutant plasmids, respectively. These single-allele plasmids show high fluorescence for their
corresponding PCR probe, HEX being the wild-type probe and Cy5 the mutant probe. No
noticeable change in specificity or endpoint fluorescence is seen with increasing Triton
concentration. Heterozygous plasmids, OCI-AML3 cells, and extracted OCI-AML3 DNA all
contain both mutant and wild-type alleles, and show above-background fluorescence for both HEX
and Cy5 fluorophores. Endpoint fluorescence increases for both extracted DNA and whole cells
with increasing Triton concentration, which may indicate that the surfactant increases accessibility
of the enzyme to the gene.

84
Figure 4.5. Effects of PCR additives in bulk PCR from whole cells. Endpoint fluorescence of
plasmid samples is unchanged in increasing Triton X-100 concentrations, while higher Triton X-
100 increases fluorescence from extracted DNA and whole cells. Specificity is unchanged. This
effect was not observed for Tween 20, where endpoint fluorescence remained relatively constant
for all templates (data not shown).
4.4.5 Cell Imaging
Cell staining is required for this method so that cells can be single-cells can be located prior
to PCR. Understanding the condition of the cells is pertinent to choosing a dye, as cell surface
markers, membrane dyes, and cytoplasm stains might be ineffective in cells with compromised
cell membranes. In selecting a cell stain fit for imaging single cells in a PCR reagent solution, we
considered the effect of PCR buffer and select surfactant additives on individual cell membrane
permeability. We expected conditions for PCR to favor cell lysis. The osmolarity of PCR
solutions are typically below isotonic, and even low amounts of surfactants such as Triton X-100
are known to permeabilize cell membranes.93
To test the effects of in our assay-optimized buffers, we again observed cells using both a
cytoplasm stain and a nuclear stain. We stained cells with calcein AM, a cytoplasm stain that is
●
●●
0.01% Triton X−100 0.02% Triton X−100 0.05% Triton X−100
6000 8000 10000 6000 8000 10000 6000 8000 10000
4000
5000
6000
Cy5 (Mutant) Probe Fluorescence (AU)HE
X (
Wild
−ty
pe)
Pro
be F
luore
sce
nce (
AU
)
Zygosity
● CELLS
DNA
HET
MUT
NTC
WT

85
only fluorescent upon enzymatic cleavage in live cells. Because the dye is located in the
cytoplasm, cells stained with calcein AM become non-fluorescent upon cell membrane lysis. As a
nuclear stain we used EvaGreen, which only stains cells with compromised cell membranes.108
We found that in PCR buffer with no added surfactant, cell membranes were sufficiently
intact to maintain calcein fluorescence and prevent staining of the cell nucleus with EvaGreen
(Figure 4.6). This result was maintained over a 30 minute, room temperature incubation (data not
shown). No change in membrane permeability was seen with 0.05% Tween 20 added to the PCR
buffer. In 0.02% Triton X-100, an increase in EvaGreen signal was observed. In PCR buffer with
0.05% Triton X-100, cells stain more brightly with EvaGreen, likely due to increased membrane
permeability. Importantly, even in 0.05% Triton X-100 the nuclei appeared intact and could be
observed in bright field (data not shown).
Figure 4.6. Cell imaging in PCR buffer. Surfactants added to the PCR buffer can improve PCR
signal from whole cells. Cells were stained with calcein violet AM, a live cell stain confined to
the cytoplasm. EvaGreen was added to the PCR buffer, which stains the nuclei of dead cells.
Calcein signal is preserved in the cells in all the buffers tested. EvaGreen stains cells in PCR
buffer with 0.02% and 0.05% Triton X-100, indicating cell death but an intact nucleus. Scale bar
is 50μm. No change was seen in cell or nucleus integrity after 30 minute incubation (data not
shown).

86
To ensure that the EvaGreen signal would not interfere with the FAM amplification probe
in PCR, we performed 10uL PCR reactions with 0.5X EvaGreen with and without the FAM probe.
We saw that the FAM signal from the EvaGreen was below the background FAM signal of the
FAM amplification probe. This data is shown in Figure 4.7. Thus, even with EvaGreen added to
the PCR probe mixture, we can still discriminate zygosity with end point fluorescence.

87
Figure 4.7. Contribution of EvaGreen and FAM probe to green fluorescence. PCR signal
generated by 0.5X EvaGreen used for cell imaging was found to be much lower than signal
generated by the FAM probe. The endpoint fluorescence from standard PCR in the Cy5 channel
is plotted versus the endpoint fluorescence in the FAM/EvaGreen channel. For the upper three
plots, no FAM probe was added. The endpoint FAM fluorescence in all samples is higher than
the no template control (NTC) sample. In the lower three plots, where FAM probe is added, the
FAM fluorescence difference between samples and NTC’s is larger. The background
fluorescence is also higher for the NTC when FAM probe is included. As more Triton X-100 is
added, the separation between positive and negative wells becomes more pronounced. From this
data, we are confident that most of our green fluorescence signal in the wells will come from the
more specific probe, rather than the intercalating dye which could give non-specific signal.
4.4.6 Assay Optimization on the SD Chip
Using our knowledge from standard PCR optimization, we tested various conditions on-
chip to optimize signal intensity and reduce errors. Because the cells are imaged before PCR and

88
their PCR status is known, each well can have one of four outcomes as shown in Table 4.3. Wells
not containing aqueous sample or containing multiple cells are excluded. True positives (TP)
contain a single cell and are control probe (FAM) positive. True negatives (TN) contain no cell
and are control probe negative. False negatives (FN) contain a single cell but are control probe
negative. False positives (FP) contain no cell but are control probe positive. An example of false
positive and false negative images is provided in figure 4.8A.
Table 4.3. Four possible outcomes for SD Chip wells. Wells not containing aqueous or
containing more than one cell are excluded.
Cell + Cell -
PCR + True Positive
TP
False Positive
FP
PCR - False Negative
FN
True Negative
TN
From these four outcomes, we can calculate a false positive rate, a false discovery rate, and
a false negative rate for each array. The most optimal assay condition will have the lowest error
rate by all three measures. The rates were defined as follows:
𝐹𝑎𝑙𝑠𝑒 𝑝𝑜𝑠𝑖𝑡𝑣𝑒 𝑟𝑎𝑡𝑒 =𝐹𝑃
𝐹𝑃 + 𝑇𝑁
𝐹𝑎𝑙𝑠𝑒 𝑑𝑖𝑠𝑐𝑜𝑣𝑒𝑟𝑦 𝑟𝑎𝑡𝑒 =𝐹𝑃
𝐹𝑃 + 𝑇𝑃
𝐹𝑎𝑙𝑠𝑒 𝑛𝑒𝑔𝑎𝑡𝑖𝑣𝑒 𝑟𝑎𝑡𝑒 =𝐹𝑁
𝐹𝑁 + 𝑇𝑃

89
We measured these three error rates in under five PCR conditions. The same
theremalcycling program was used under each condition. The results are depicted in Figure 4.8B.
We found that the percentage of false-positive and false-negative wells was dependent on the
concentration of surfactant additives in the PCR buffer. Low amounts of surfactant produced a
high number of false negatives and low false positives, indicating incomplete cell lysis; while high
amounts of surfactant resulted the majority of cells producing PCR data. Of the conditions tested,
0.02% Triton X-100 proved to be the most optimal for reducing both false positives and false
negatives.
Figure 4.8 Assessment of false-positive and false-negative rates. A) The occurrence of false
positives and false negatives could be directly observed in the SD Chip by analyzing images of
the array pre and post-PCR. False positives occur when PCR amplification is observed, but no
cell was detected in that well. False negatives occur when a cell is detected but PCR
amplification is not observed. Scale bar is 100 µm B) We calculated an error rate per array in
three ways. 0.02% Triton X-100 produced the lowest false discovery rate as well as low false
negative rate.

90
4.4.7 Single-cell Zygosity
We ran 3 arrays of the optimal PCR mix condition, all on the same device and the same
day, to obtain zygosity data for OCI-AML3 cells. In Figure 4.9, the zygosities of the replicates
are shown. Three populations of NPM1 type A mutation in this cell line has been observed
previously through single-cell genotyping.79
Figure 4.9. Zygosities of single cells. A) Single-cell zygosity calls for imaged single OCI-
AML3 cells in wells of the SD Chip. Heterozygous (HET) cells are positive for the control
probe color and the two allele probe colors. Mutant (MUT) are control and mutant positive, and
wild-type (WT) are control and wild-type positive. B) Zygosity calls for heterozygous plasmids.
Mutant and wild-type calls are allele dropout errors.
We also performed an experiment to determine the allele dropout rate for this assay in the
SD chip. The allele dropout rate is defined as the frequency at which an allele is present in a well
of the SD Chip but not detected. To quantify this rate for this assay on this chip, we employed
heterozygous plasmids containing exactly one copy of the amplicon region containing the wild
type sequence and the mutant sequence, ensuring that whenever one is detected, the other should
be as well because they are physically connected. Adjustments of the plasmid concentrations were

91
done to ensure that the probability of two plasmids occurring in a single well was negligible prior
to collecting data. For this device, two arrays of the SD Chip were measured. The allele dropout
rate for the each allele was calculated as the number of mutant or wild-type zygosity calls divided
by the total number of wells with zygosity calls. The allele dropout rate for the wild-type allele
was calculated as 5.5 percent, and the dropout rate for the mutant allele was 14.6 percent.
4.5 CONCLUSIONS AND NEXT STEPS
Due to the complex heterogeneity occurring in cancer, genetic measurements at the single-
cell level provide a direct way to understand the disease landscape of an individual with the aim
of delivering the most effective treatment. Because of the way these measurements are typically
carried out, errors are likely to occur and difficult to measure. We hope that by simplifying single-
cell measurements and making errors more transparent, single-cell genetic measurements can
become routine in difficult-to-treat malignancies, and that their results would be informative to
treatment.
We have developed a simple assay, requiring a single buffer for both cell lysis and PCR,
and where the cells can be imaged before analysis. The device is simple to operate, requiring a
single pressure source and no valves. After digitization, the cell remains localized in the small
volume of the nL scale chamber, permitting us to track individual cells and containing the PCR
products, preventing contamination. The device employs imaging of the digitized cells prior to
PCR allowing us to generate metrics of the false positive (no cell is present but amplification
occurs) and false negative (a cell is present but fails to amplify) rates. This illustrates a major
difference from current approaches to single cell analysis.

92
Imaging allows us to address multiple aspects of uncertainty that have previously been left
unaddressed in single cell analysis techniques. One issue is the digitization of more than a single
cell per analysis volume. Without imaging and cell staining to assess the presence of only a single
cell, additional uncertainty is imparted to the resulting zygosity data describing the whole
population. Our technique allows for a straightforward gating of false positives as well as multi-
cell wells in such a way that when these artifacts occur, we can identify them and remove them
from analysis. Additionally, when imaging cells being manipulated in buffer mixes suitable for
molecular biological assessments, we see a wide range of degrees of cell lysis simply by being
exposed to the buffers. The possibility of cell lysis prior to digitization and PCR amplification is
a very context-dependent phenomena and an important source of possible PCR contamination.
The impact of free-floating DNA in single cell assays either from previously lysed cells or from
the environment during multi-step processes often employed is another major source of uncertainty
unique to single cell assays. Because all single cell analysis techniques require a significant
amount of amplification of genetic material, these assays are also uniquely sensitive to
contamination. The ability to assess both false positive and false negative rates for a given
protocol, assay and chip, we can provide these basic quality control metrics to researchers
employing these devices for biological experimentation.
Another possible source of error common to all single cell analysis techniques that is
typically very challenging, if not impossible to quantify due to the destructive nature of single cell
analytics, is the rate of allele dropout. To date it has been a challenge unique to this field, but
depending on the design of the assays themselves, is typically nearly impossible to assess. We
have begun addressing this problem for all molecular assays developed for the SD-chip, by
employing heterozygous plasmid DNA and assessing the rate at which one or the other allele fails
93
to be detected. This issue is a critical one for the future of single cell analysis, because if the rate
of a target being missing from an analysis due to partial failure of the technique is not balanced or
uniformly distributed, it can result in biased results. For example, if an assay fails to detect the
presence of a mutant allele more often than the wild type allele, all results would be skewed toward
populations always having more wild type and heterozygous cells than they truly do. However,
because this is a feature of the assay itself and those exact single cells can never be assessed again,
it is impossible to detect this artifact. By carefully validating all single cell molecular assays using
this approach, we can then provide additional descriptions of the uncertainty associated with a
given population zygosity distribution identified by using the chip. This additional ability along
with the much larger sample sizes (number of cells per population assessed) now allows us to
begin to use bulk-level statistics and knowledge of the system itself to be a platform on which
hypothesis testing could occur rather than simply descriptive data collection.
We envision improvements to the current method allowing for higher-throughput in terms
of cells and genes. Active trapping methods that would allow us to obtain more single-cell data
per array than allowed by unguided distribution, and these methods have been described both in
our laboratory109 and by other research groups.49 We are also working to develop other genotyping
assays interesting to AML, particularly for untangling some of the complicated heterogeneity
difficult to puzzle together from bulk sequencing measurements.
As genetic processing increasingly demands high-throughput technologies, the capability
to amplify genetic material from whole cells without any reagent exchange could allow for
impactful new technologies. Performing PCR without DNA extraction or purification saves time
and reduces the amount of equipment necessary to perform an assay, an important step towards
developing assays for point-of-care, low resource settings, or routine analyses. Using unprocessed

94
samples can also be useful in cases where the sample size is small, as in the case of rare cells or
tissues collected via less-invasive sampling methods. Contamination risk is also much lower if
containers remain closed as much as possible during pre- and post-processing, an important
concern for gene amplification techniques.
We are also exploring ways to combine this technique and the knowledge gained about
single-solution lysis and PCR to screen for genotypes and perform further PCR, RT-PCR or
sequencing on droplets.
As the single-cell genetic field continues to develop, we hope to see a broad range of
technologies that will help us to define heterogeneity and how it affects disease treatment and
outcomes. With any new technologies, we urge developers to seek to understand the errors in their
systems.

95
Chapter 5. FUTURE WORK

96
5.1 FUTURE WORK
The SD Chip has been shown to be an adaptable platform for performing genetic analysis,
and there are other interesting avenues to be explored using this platform. The device has been
used to perform single-cell digital RT-PCR, and single-cell genotyping with PCR in this thesis,
and has also been used for digital LAMP of DNA templates by a former group member.
Adaptations for high sensitivity and high dynamic range are ongoing projects in the Chiu
laboratory. We are also interested in adapting the device for low resource settings.
5.1.1 SD Chip for Low-Resource Settings
The SD Chip would have several advantages for low resource settings over standard
genetic detection schemes. One reason is the potential cost-savings of performing analyses in
smaller volumes, limiting reagent consumption. Since the analysis volume is smaller, the
requirements for patient sample size might also be minimized in certain applications. A smaller
sample size could eliminate the need for a trained technician to perform a blood draw; replacing
this with a finger-stick sample.
The way that the sample is contained in the device is another potential advantage. Because
of the enormous amount of product generated in PCR and other gene amplification techniques,
care must be taken to prevent contamination of future reactions with products previous runs. This
contamination can result in false-positive detection. In the SD Chip, the amplified products remain
trapped in the device.
The instrumentation used for genetic detection on the SD Chip also has the potential to be
miniaturized. Some methods of gene amplification and detection other than PCR do not require
the cyclic heating. For example, LAMP uses a constant temperature of 63°C, and NASBA 41°C.

97
This constant temperature could be provided from a device smaller and less complex than a PCR
thermalcycler, such as a heating pad or heating bath. Other researchers have also demonstrated
methods to miniaturize fluorescence detection in arrays with similar-sized volumes. For instance,
several groups have discussed using a cell phone to capture the image and transmit the data for
off-site analysis.
One benefit of the SD Chip for low resource settings, and really any microfluidic digital
PCR device, is that the method is less sensitive to inhibitors in the solution. Resistance to inhibitors
could allow for gene detection in unprocessed samples such as urine, feces, blood, or plasma.
Some preliminary data on using the SD Chip for PCR from unprocessed, whole blood is presented
in the next section.
5.1.2 SD Chip on Unprocessed, Whole Blood
While qPCR is strongly affected by the presence of inhibitors, digital PCR can still produce
quantitative data from these samples. There are two reasons for this increased robustness of digital
methods. First, the relative concentration of template to inhibitor is increased in the digitized
volume compared to the bulk sample. Secondly, because digital PCR uses endpoint detection, it
is not dependent on PCR reaction efficiency. High reaction efficiency is a requirement to obtain
quantitative data from real-time PCR.

98
Figure 5.1. Amplification of a WBC gene in diluted, whole blood on the SD Chip. A) real-time
PCR traces show greater reaction inhibition as whole-blood concentration increases. The
fluorescent signal increase is delayed as concentration increases, and total signal increase is
much lower in more concentrated samples. B) The same samples run on the SD Chip produce
quantitative data at each dilution. Circles represent the concentration of WBC at each dilution.
Error bars represent the confidence interval resulting from the Poisson calculation, where a
random distribution of cells is assumed. The shaded area represents the WBC count in a healthy
blood sample (3500 – 10,500 white blood cells/μL). C) Images of the SD Chip arrays following
PCR are shown with plotted well intensity. Although signal-to-noise decreases in more
concentration blood samples, positive and negative droplets are distinguishable.
Whole blood contains multiple inhibitors of PCR, with hemoglobin from red blood cells
and lactoferrin from white blood cells being two highly concentrated inhibitors.110 In Figure 5.1,
the effect of various dilutions of whole blood on real-time PCR are demonstrated. In this
experiment, primers for the NPM1 gene are used to amplify genetic material in white blood cells
using whole blood without upstream processing. Amplification in 10 μL volumes with real-time
PCR shows increasing inhibition as blood concentration increases (Figure 5.1A). In an uninhibited
sample, more concentrated samples to produce above-threshold signal at earlier cycles. In this
example, inhibition causes the more concentrated samples to show delayed and stunted intensity.

99
In contrast, digital PCR from the same samples produces quantitative data (Figures 5.1B and 5.1C).
In Figure 5.1B, the data points show concentrations of white blood cells detected at each dilution
by digital PCR, while the grey shading represents values for a normal white blood cell count (3500
– 10,500 white blood cells/μL). Images of the digital PCR device are shown in Figure 5.1C with
well-intensity data. While the most concentrated blood sample shows a smaller signal/noise ratio,
positive and negative wells are distinguishable. Further modification using PCR buffer additives
or decreasing chamber volume might also allow us to process more concentrated samples.
While this demonstration used a DNA assay, the sample result might extend to mRNA
detection. Many commercial buffers are available that allow for one-step cDNA synthesis and
PCR amplification.
5.1.3 Methods
Whole blood was diluted into 1X Dulbecco’s PBS (Gibco) to obtain 1:20, 1:100, or 1:200
dilutions. PCR reaction mixes were prepared containing 25µL 2x SsoFast Evagreen buffer
(BioRad), 500nM forward and reverse NPM1 primers, 0.1% BSA, 10 µL blood dilution, and
nuclease free water up to 50 µL. Real-Time reactions were run in duplicate in 10 µL volumes on
a CFX-96 (BioRad). Thermalcycling consisted of three cycles of 95°C for 3 minutes to 59°C for
3 minutes to lyse cells91 followed by 45 cycles of 95°C for 5 seconds, 60°C for 30 seconds, and
72°C for 30 seconds. Data was analyzed using the BioRad CFX Manager 3.1. Digital PCR
reactions were run on an SD Chip containing 1024 reaction chambers of 6 nL volume each.
Devices were primed with an oil mix of 0.030% Abil we 09 (Evonik Industries), 90% Tegosoft
DEC (Evonik Industries), and 10% light mineral oil (Sigma). Devices were loaded by pipetting
20 μL of PCR reaction mix under the oil reserve in the device inlet. Negative pressure was applied

100
via a gasket taped to the device outlet and a vacuum pump at -10 in Hg for 10 minutes. PCR
cycling was performed on an Eppendorf Mastercycler with In-Situ Adapter. Thermalcycling
consisted of three cycles of 95°C for 3 minutes to 59°C for 3 minutes followed by 40 cycles of
97°C for 15 seconds, 59°C for 60 seconds, and 72°C for 30 seconds. Arrays were imaged post-
PCR with the Sybr Green I channel on a Typhoon FLA 9000 (GE) at 10μm resolution. A macro
was written in ImageJ to analyze the images of the chambers post-PCR. Regions of interest were
drawn over individual well locations in the images. The ImageJ analyze particles function was
used on the cell images to obtain cell counts per well. Analyze particles was also used on the post-
PCR image to find the droplet and measure the median intensity. These two data sets were
exported to Excel where each well is categorized as PCR +/-. Concentrations per μL were obtained
using a Poisson calculation using the number of positive, negative, and total volume of the
analyzed chambers. Partially filled droplets were excluded from analysis.
When PCR is performed in the SD Chip on three dilutions of whole blood, a plot of S/N
vs. concentration of blood shows an inverse relationship. This is likely do to both inhibition of the
DNA polymerase by components in the blood, and also quenching of the EvaGreen reporter
fluorophore by hemoglobin. Extrapolating the linear regression, we find the limit where S/N for
the average positive well reaches ten times the standard deviation of the noise. At this point,
positive wells could still be distinguished from negative wells. This corresponds to 2% blood
concentration per PCR reaction volume. This limit for DNA quantitation in whole blood by dPCR
using the SD Chip exceeds the referenced limits for DNA amplification in standard PCR reaction,
typically cited as 0.2% whole blood for standard Taq polymerase.111
While the above limit was calculated for DNA using SsoFast DNA polymerase, the
literature suggests that a higher concentration of blood could be used in RT-PCR using mutants of

101
Taq polymerase resistant to inhibitors. Taylor et al. were able to perform quantitative real-time
PCR using 10% whole blood to detect Plasmodium DNA.112 To overcome reporter dye quenching,
the authors used high concentrations of SYBR Green dye, concentrations inhibitory to native Taq
polymerase. Likewise, reverse transcriptase enzymes have been sighted to be active in whole
blood up to 8%.113 Because digital PCR only relies on endpoint fluorescence to perform
quantitative measurements, optimization of enzyme type and concentration should allow us to
meet or exceed these reported values of blood concentration. RNase inhibitor enzymes, commonly
used in RT-PCR, would also need to be used during the protocol to neutralize RNase in blood.
5.2 SUMMARY
Heterogeneity is likely to remain an interesting and beneficial area of research for
biologists and clinicians. Variation among single-cells in their epigenetics and gene expression
profiles is necessary for stem cell differentiation during human development, and complex diseases
such as cancer can have variation within a tumor in their mutation status, epigenetics, and gene
expression. These variations can impact the manifestation of the disease. In the case of cancer,
this variation among single cells has been shown to affect disease progression, metastasis, success
or failure of treatment, and disease relapse. We will need new tools to study genetic variability in
single cells to better understand these phenomenon.
This work summarizes the major research accomplishments during several years of work,
but the projects contained here only scratch the surface of the unknown landscape of genetic
heterogeneity in single cells. New tools for single-cell genetic measurements will surely be under
development for a long time to come.

102
BIBLIOGRAPHY
1. Wills, Q. F. et al. Single-cell gene expression analysis reveals genetic associations masked
in whole-tissue experiments. Nat. Biotechnol. 31, 748–752 (2013).
2. Merlo, L. M. F. et al. A comprehensive survey of clonal diversity measures in Barrett’s
esophagus as biomarkers of progression to esophageal adenocarcinoma. Cancer Prev. Res.
3, 1388–1397 (2010).
3. Park, S. Y., Gonen, M., Kim, H. J., Franziska, M. & Polyak, K. Cellular and genetic
diversity in the progression of in situ human breast carcinomas to an invasive phenotype.
J. Clin. Invest. 120, (2010).
4. Ding, L. et al. Clonal evolution in relapsed acute myeloid leukaemia revealed by whole-
genome sequencing. Nature 481, 506–10 (2012).
5. Jan, M. et al. Clonal evolution of preleukemic hematopoietic stem cells precedes human
acute myeloid leukemia. Sci. Transl. Med. 4, 149ra118 (2012).
6. Welch, J. S. et al. The origin and evolution of mutations in acute myeloid leukemia. Cell
150, 264–78 (2012).
7. Hou, S. et al. Capture and stimulated release of circulating tumor cells on polymer-grafted
silicon nanostructures. Adv. Mater. 25, 1547–1551 (2013).
8. Dharmasiri, U. et al. High-throughput selection, enumeration, electrokinetic manipulation,
and molecular profiling of low-abundance circulating tumor cells using a microfluidic
system. Anal. Chem. 83, 2301–9 (2011).
9. Schiro, P. G. et al. Sensitive and high-throughput isolation of rare cells from peripheral
blood with ensemble-decision aliquot ranking. Angew. Chemie - Int. Ed. 51, 4618–4622
(2012).
10. Ozkumur, E. et al. Inertial Focusing for Tumor Antigen-Dependent and -Independent
Sorting of Rare Circulating Tumor Cells. Sci. Transl. Med. 5, 179ra47-179ra47 (2013).
11. Sanchez-Freire, V., Ebert, A. D., Kalisky, T., Quake, S. R. & Wu, J. C. Microfluidic
single-cell real-time PCR for comparative analysis of gene expression patterns. Nat.
Protoc. 7, 829–38 (2012).
12. Nilsson, J., Evander, M., Hammarström, B. & Laurell, T. Review of cell and particle

103
trapping in microfluidic systems. Anal. Chim. Acta 649, 141–157 (2009).
13. Gao, Y., Li, W. & Pappas, D. Recent advances in microfluidic cell separations. Analyst
138, 4714–21 (2013).
14. White, A. K. et al. High-throughput microfluidic single-cell RT-qPCR. Proc. Natl. Acad.
Sci. U. S. A. 108, 13999–4004 (2011).
15. He, M. et al. Selective encapsulation of single cells and subcellular organelles into
picoliter- and femtoliter-volume droplets. Anal. Chem. 77, 1539–1544 (2005).
16. Edd, J. F. et al. Controlled encapsulation of single-cells into monodisperse picolitre drops.
Lab Chip 8, 1262–1264 (2008).
17. Fan, H. C., Wang, J., Potanina, A. & Quake, S. R. Whole-genome molecular haplotyping
of single cells. Nat. Biotechnol. 29, 51–57 (2011).
18. Rissin, D. M. et al. Single-molecule enzyme-linked immunosorbent assay detects serum
proteins at subfemtomolar concentrations. Nat. Biotechnol. 28, 595–599 (2010).
19. Du, W., Li, L., Nichols, K. P. & Ismagilov, R. F. SlipChip. Lab Chip 9, 2286 (2009).
20. Cohen, D. E., Schneider, T., Wang, M. & Chiu, D. T. Self-digitization of sample volumes.
Anal. Chem. 82, 5707–17 (2010).
21. Leung, K. et al. A programmable droplet-based microfluidic device applied to
multiparameter analysis of single microbes and microbial communities. Proc. Natl. Acad.
Sci. 109, 7665–7670 (2012).
22. Schmitz, C. H. J., Rowat, A. C., Köster, S. & Weitz, D. A. Dropspots: a picoliter array in a
microfluidic device. Lab Chip 9, 44–49 (2009).
23. White, A. K. et al. High-throughput microfluidic single-cell RT-qPCR. Proc. Natl. Acad.
Sci. U. S. A. 108, 13999–4004 (2011).
24. Guo, F. et al. Probing cell–cell communication with microfluidic devices. Lab Chip 13,
3152 (2013).
25. Kim, J., Johnson, M., Hill, P. & Gale, B. K. Microfluidic sample preparation: cell lysis
and nucleic acid purification. Integr. Biol. (Camb). 1, 574–586 (2009).
26. Sanders, R., Mason, D. J., Foy, C. A. & Huggett, J. F. Evaluation of digital PCR for
absolute RNA quantification. PLoS One 8, e75296 (2013).
27. Raj, A. & van Oudenaarden, A. Single-molecule approaches to stochastic gene expression.

104
Annu. Rev. Biophys. 38, 255–70 (2009).
28. Schneider, T., Yen, G. S., Thompson, A. M., Burnham, D. R. & Chiu, D. T. Self-
Digitization of Samples into a High-Density Microfluidic Bottom-Well Array. Anal.
Chem. 85, 10417–10423 (2013).
29. Gansen, A., Herrick, A. M., Dimov, I. K., Lee, L. P. & Chiu, D. T. Digital LAMP in a
sample self-digitization (SD) chip. Lab Chip 12, 2247–54 (2012).
30. Kreutz, J. E. et al. Theoretical Design and Analysis of Multivolume Digital Assays with
Wide Dynamic Range Validated Experimentally with Microfluidic Digital PCR. Anal.
Chem. 83, 8158–8168 (2011).
31. Wu, A. R. et al. Quantitative assessment of single-cell RNA-sequencing methods. Nat.
Methods 11, 41–46 (2013).
32. Marcy, Y. et al. Nanoliter reactors improve multiple displacement amplification of
genomes from single cells. PLoS Genet. 3, 1702–1708 (2007).
33. Picelli, S. et al. Smart-seq2 for sensitive full-length transcriptome profiling in single cells.
Nat. Methods 10, 1096–8 (2013).
34. Geiss, G. K. et al. Direct multiplexed measurement of gene expression with color-coded
probe pairs. Nat. Biotechnol. 26, 317–325 (2008).
35. Matsunaga, T. et al. High-efficiency single-cell entrapment and fluorescence in situ
hybridization analysis using a poly(dimethylsiloxane) microfluidic device integrated with
a black poly(ethylene terephthalate) micromesh. Anal. Chem. 80, 5139–45 (2008).
36. Yilmaz, S. & Singh, A. K. Single cell genome sequencing. Curr. Opin. Biotechnol. 23,
437–443 (2012).
37. McDavid, A. et al. Data exploration, quality control and testing in single-cell qPCR-based
gene expression experiments. Bioinformatics 29, 461–467 (2013).
38. Lorthongpanich, C. et al. Single-cell DNA-methylation analysis reveals epigenetic
chimerism in preimplantation embryos. Science 341, 1110–2 (2013).
39. Raj, A., Peskin, C. S., Tranchina, D., Vargas, D. Y. & Tyagi, S. Stochastic mRNA
synthesis in mammalian cells. PLoS Biol. 4, e309 (2006).
40. Almendro, V. et al. Inference of tumor evolution during chemotherapy by computational
modeling and in situ analysis of genetic and phenotypic cellular diversity. Cell Rep. 6,

105
514–27 (2014).
41. Thompson, A. M., Paguirigan, A. L., Kreutz, J. E., Radich, J. P. & Chiu, D. T.
Microfluidics for Single-Cell Genetic Analysis. Lab Chip (2014). doi:10.1039/c4lc00175c
42. Bengtsson, M., Hemberg, M., Rorsman, P. & Ståhlberg, A. Quantification of mRNA in
single cells and modelling of RT-qPCR induced noise. BMC Mol. Biol. 9, 63 (2008).
43. Livak, K. J. et al. Methods for qPCR gene expression profiling applied to 1440
lymphoblastoid single cells. Methods 59, 71–9 (2013).
44. Reiter, M. et al. Quantification noise in single cell experiments. Nucleic Acids Res. 39,
e124 (2011).
45. Fox, B. C., Devonshire, A. S., Baradez, M.-O., Marshall, D. & Foy, C. A. Comparison of
reverse transcription-quantitative polymerase chain reaction methods and platforms for
single cell gene expression analysis. Anal. Biochem. 427, 178–86 (2012).
46. Sanders, R. et al. Evaluation of digital PCR for absolute DNA quantification. Anal. Chem.
83, 6474–6484 (2011).
47. White III, R. A., Blainey, P. C., Fan, H. C. & Quake, S. R. Digital PCR provides sensitive
and absolute calibration for high throughput sequencing. BMC Genomics 10, 116 (2009).
48. Ståhlberg, A., Kubista, M. & Pfaffl, M. Comparison of Reverse Transcriptases in Gene
Expression Analysis. Clin. Chem. 50, 1678–1680 (2004).
49. White, A. K., Heyries, K. A., Doolin, C., VanInsberghe, M. & Hansen, C. L. High-
throughput microfluidic single-cell digital polymerase chain reaction. Anal. Chem. 85,
7182–7190 (2013).
50. Shen, F. et al. Multiplexed quantification of nucleic acids with large dynamic range using
multivolume digital RT-PCR on a rotational SlipChip tested with HIV and hepatitis C
viral load. J. Am. Chem. Soc. 133, 17705–12 (2011).
51. Rački, N., Morisset, D., Gutierrez-Aguirre, I. & Ravnikar, M. One-step RT-droplet digital
PCR: a breakthrough in the quantification of waterborne RNA viruses. Anal. Bioanal.
Chem. 406, 661–7 (2014).
52. Beer, N. et al. On-chip single-copy real-time reverse-transcription PCR in isolated
picoliter droplets. Anal. Chem. 80, 1854–1858 (2008).
53. Levesque, M. J. & Raj, A. Single-chromosome transcriptional profiling reveals

106
chromosomal gene expression regulation. Nat. Methods 10, 246–8 (2013).
54. Yen, G. S. et al. A rapid and economical method for profiling feature heights during
microfabrication. Lab Chip 11, 974–7 (2011).
55. Bustin, S. A. et al. The MIQE guidelines: minimum information for publication of
quantitative real-time PCR experiments. Clin. Chem. 55, 611–22 (2009).
56. Chubb, J. R., Trcek, T., Shenoy, S. M. & Singer, R. H. Transcriptional pulsing of a
developmental gene. Curr. Biol. 16, 1018–25 (2006).
57. Carter, M. G. et al. Transcript copy number estimation using a mouse whole-genome
oligonucleotide microarray. Genome Biol. 6, R61 (2005).
58. Devonshire, A. S., Baradez, M.-O., Morley, G., Marshall, D. & Foy, C. A. Validation of
high-throughput single cell analysis methodology. Anal. Biochem. 452, 103–13 (2014).
59. Warren, L., Bryder, D., Weissman, I. L. & Quake, S. R. Transcription factor profiling in
individual hematopoietic progenitors by digital RT-PCR. Proc. Natl. Acad. Sci. U. S. A.
103, 17807–12 (2006).
60. Dube, S., Qin, J. & Ramakrishnan, R. Mathematical analysis of copy number variation in
a DNA sample using digital PCR on a nanofluidic device. PLoS One 3, e2876 (2008).
61. Wilson, E. Probable inference, the law of succession, and statistical inference. J. Am. Stat.
Assoc. 22, 209–212 (1927).
62. Newcombe, R. G. Two-sided confidence intervals for the single proportion: comparison of
seven methods. Stat. Med. 17, 857–72 (1998).
63. Shen, F., Du, W., Kreutz, J. E., Fok, A. & Ismagilov, R. F. Digital PCR on a SlipChip.
Lab Chip 10, 2666–72 (2010).
64. Wacker, M. & Godard, M. Analysis of one-step and two-step real-time RT-PCR using
SuperScript III. J. Biomol. Tech. JBT 16, 266–271 (2005).
65. Salaverria, I. et al. Specific secondary genetic alterations in mantle cell lymphoma provide
prognostic information independent of the gene expression–based proliferation signature.
J. Clin. Oncol. 25, 1216–1222 (2007).
66. Battich, N., Stoeger, T. & Pelkmans, L. Image-based transcriptomics in thousands of
single human cells at single-molecule resolution. Nat. Methods 10, 1127–33 (2013).
67. Heyries, K. A. et al. Megapixel digital PCR. Nat. Methods 8, 649–51 (2011).

107
68. Tao, Y. et al. Rapid growth of a hepatocellular carcinoma and the driving mutations
revealed by cell-population genetic analysis of whole-genome data. Proc. Natl. Acad. Sci.
U. S. A. 108, 12042–7 (2011).
69. Yachida, S. et al. Distant metastasis occurs late during the genetic evolution of pancreatic
cancer. Nature 467, 1114–1117 (2010).
70. Ding, L. et al. Genome remodelling in a basal-like breast cancer metastasis and xenograft.
Nature 464, 999–1005 (2010).
71. Gerlinger, M. et al. Intratumor heterogeneity and branched evolution revealed by
multiregion sequencing. N. Engl. J. Med. 366, 883–892 (2012).
72. Wu, X. et al. Clonal selection drives genetic divergence of metastatic medulloblastoma.
Nature 482, 529–33 (2012).
73. Hughes, A. E. O. et al. Clonal Architecture of Secondary Acute Myeloid Leukemia
Defined by Single-Cell Sequencing. PLoS Genet. 10, (2014).
74. Klco, J. M. et al. Functional heterogeneity of genetically defined subclones in acute
myeloid leukemia. Cancer Cell 25, 379–392 (2014).
75. Atlas, T. C. G. Genomic and Epigenomic Landscapes of Adult De Novo Acute Myeloid
Leukemia The Cancer Genome Atlas Research Network. N. Engl. J. Med. 368, 2059–74
(2013).
76. Sloan, C. E. et al. A Modified Integrated Genetic Model for Risk Prediction in Younger
Patients with Acute Myeloid Leukemia. PLoS One 11, e0153016 (2016).
77. Papaemmanuil, E. et al. Genomic Classification and Prognosis in Acute Myeloid
Leukemia. N. Engl. J. Med. 374, 2209–2221 (2016).
78. Klco, J. M. et al. Association Between Mutation Clearance After Induction Therapy and
Outcomes in Acute Myeloid Leukemia. Jama 314, 811 (2015).
79. Paguirigan, A. L. et al. Single-cell genotyping demonstrates complex clonal diversity in
acute myeloid leukemia. Sci. Transl. Med. 7, 1–9 (2015).
80. Shah, S. P. et al. The clonal and mutational evolution spectrum of primary triple-negative
breast cancers. Nature 486, 395–9 (2012).
81. Estey, E., Levine, R. L. & Bob, L. Current challenges in clinical development of ‘ targeted
therapies ’ : the case of acute myeloid leukemia. Blood 125, 2461–2466 (2015).

108
82. Jamal-Hanjani, M., Quezada, S. A., Larkin, J. & Swanton, C. Translational implications of
tumor heterogeneity. Clin. Cancer Res. 21, 1258–1266 (2015).
83. Hou, Y. et al. Single-cell exome sequencing and monoclonal evolution of a JAK2-
negative myeloproliferative neoplasm. Cell 148, 873–885 (2012).
84. Streets, A. M. et al. Microfluidic single-cell whole-transcriptome sequencing. Proc. Natl.
Acad. Sci. 111, 7048–7053 (2014).
85. Thompson, A. M. et al. Self-Digitization Microfluidic Chip for Absolute Quantification of
mRNA in Single Cells. Anal. Chem. 86, 12308–12314 (2014).
86. You, Y., Moreira, B. G., Behlke, M. A. & Owczarzy, R. Design of LNA probes that
improve mismatch discrimination. Nucleic Acids Res. 34, 1–11 (2006).
87. Taylor, M. T. et al. Lysing bacterial spores by sonication through a flexible interface in a
microfluidic system. Anal. Chem. 73, 492–496 (2001).
88. Sun, B. & Chiu, D. T. Determination of the encapsulation efficiency of individual vesicles
using single-vesicle photolysis and confocal single-molecule detection. Anal. Chem. 77,
2770–2776 (2005).
89. Rau, K. R., Quinto-Su, P. A., Hellman, A. N. & Venugopalan, V. Pulsed laser microbeam-
induced cell lysis: time-resolved imaging and analysis of hydrodynamic effects. Biophys.
J. 91, 317–29 (2006).
90. Burckhardt, J. Amplification of DNA from Whole Blood. PCR Methods Appl. 3, 239–243
(1994).
91. Mercier, B., Gaucher, C., Feugeas, O. & Mazurier, C. Direct PCR from whole blood,
without DNA extraction. Nucleic Acids Res. 18, 5908 (1990).
92. Pierce, K. E., Rice, J. E., Sanchez, J. A. & Wangh, L. J. QuantiLyse: Reliable DNA
amplification from single cells. Biotechniques 32, 1106–1111 (2002).
93. Koley, D. & Bard, A. J. Triton X-100 concentration effects on membrane permeability of
a single HeLa cell by scanning electrochemical microscopy (SECM). Proc. Natl. Acad.
Sci. U. S. A. 107, 16783–16787 (2010).
94. Liu, Y. S., Thomas, R. J. & Phillips, W. A. Single-step direct PCR amplification from
solid tissues. Nucleic Acids Res. 23, 1640 (1995).
95. Gong, Y., Ogunniyi, A. O. & Love, J. C. Massively parallel detection of gene expression

109
in single cells using subnanolitre wells. Lab Chip 10, 2334–7 (2010).
96. Rival, A. et al. EWOD-based microfluidic chip for single-cell isolation, mRNA
purification and subsequent multiplex qPCR. Lab Chip 14, 3739–3749 (2014).
97. Eastburn, D. J., Sciambi, A. & Abate, A. R. Ultrahigh-Throughput Mammalian Single-
Cell Reverse-Transcriptase Polymerase Chain Reaction in Micro fl uidic Drops. Anal.
Chem. 85, 8016–8021 (2013).
98. Zhu, Y. et al. Printing 2-Dimentional Droplet Array for Single-Cell Reverse Transcription
Quantitative PCR Assay with a Microfluidic Robot. Sci. Rep. 5, 9551 (2015).
99. Dimov, I. K. et al. Discriminating cellular heterogeneity using microwell-based RNA
cytometry. Nat. Commun. 5, 3451 (2014).
100. Ma, S. et al. Diffusion-based microfluidic PCR for ‘one-pot’ analysis of cells. Lab Chip
14, (2014).
101. Irimia, D., Tompkins, R. G. & Toner, M. Single-cell chemical lysis in picoliter-scale
closed volumes using a microfabricated device. Anal. Chem. 76, 6137–6143 (2004).
102. Yu, Z., Lu, S. & Huang, Y. Microfluidic Whole Genome Amplification Device for Single
Cell Sequencing. Anal. Chem. 86, 9386–9390 (2014).
103. Han, L. et al. Co-detection and sequencing of genes and transcripts from the same single
cells facilitated by a microfluidics platform. Sci. Rep. 4, 6485 (2014).
104. Thelwell, N., Millington, S., Solinas, A., Booth, J. & Brown, T. Mode of action and
application of Scorpion primers to mutation detection. Nucleic Acids Res. 28, 3752–3761
(2000).
105. Solinas, A. et al. Duplex Scorpion primers in SNP analysis and FRET applications.
Nucleic Acids Res. 29, E96 (2001).
106. Whitcombe, D., Theaker, J., Guy, S. P., Brown, T. & Little, S. Detection of PCR products
using self-probing amplicons and fluorescence. Nat. Biotechnol. 17, 804–807 (1999).
107. Mitrofanov, D. V, Chasovnikova, O. B., Kovalenko, S. P. & Liakhovich, V. V. Detection
of 5382insC mutation in human BRCA1 gene using fluorescent labeled oligonucleotides.
Mol. Biol. 43, 999–1005 (2009).
108. Chiaraviglio, L. & Kirby, J. E. Evaluation of impermeant, DNA-binding dye fluorescence
as a real-time readout of eukaryotic cell toxicity in a high throughput screening format.

110
Assay Drug Dev. Technol. 12, 219–28 (2014).
109. Anand, R. K., Johnson, E. S. & Chiu, D. T. Negative dielectrophoretic capture and
repulsion of single cells at a bipolar electrode: The impact of faradaic ion enrichment and
depletion. J. Am. Chem. Soc. 137, 776–783 (2015).
110. Al-soud, W. A. & Rådström, P. Purification and Characterization of PCR-Inhibitory
Components in Blood Cells. J. Clin. Microbiol. 39, 485–493 (2001).
111. Abu Al-Soud, W. & Rådström, P. Effects of amplification facilitators on diagnostic PCR
in the presence of blood, feces, and meat. J. Clin. Microbiol. 38, 4463–4470 (2000).
112. Taylor, B. J. et al. Real-time PCR detection of Plasmodium directly from whole blood and
filter paper samples. Malar. J. 10, (2011).
113. Damhorst, G. L. et al. Smartphone-Imaged HIV-1 Reverse-Transcription Loop-Mediated
Isothermal Amplification (RT-LAMP) on a Chip from Whole Blood. Eng. (Beijing,
China) 1, 324–335 (2015).
114. Eischeid, A. C. SYTO dyes and EvaGreen outperform SYBR Green in real-time PCR.
BMC Res. Notes 4, 263 (2011).
115. Gudnason, H., Dufva, M., Bang, D. D. & Wolff, A. Comparison of multiple DNA dyes for
real-time PCR: Effects of dye concentration and sequence composition on DNA
amplification and melting temperature. Nucleic Acids Res. 35, 1–8 (2007).
116. Higuchi, R., Dollinger, G., Walsh, P. S. & Griffith, R. Simultaneous Amplification and
Detection of Specific DNA Sequences. Nat. Biotechnol. 10, 413–417 (1992).
117. Japaridze, A., Benke, A., Renevey, S., Benadiba, C. & Dietler, G. Influence of DNA
binding dyes on bare DNA structure studied with atomic force microscopy.
Macromolecules 48, 1860–1865 (2015).
118. Van Poucke, M., Van Zeveren, A. & Peelman, L. J. Combined FAM-labeled TaqMan
probe detection and SYBR green I melting curve analysis in multiprobe qPCR genotyping
assays. Biotechniques 52, 81–86 (2012).
119. McDermott, G. P. et al. Multiplexed target detection using DNA-binding dye chemistry in
droplet digital PCR. Anal. Chem. 85, 11619–11627 (2013).

111
APPENDIX A
In Chapter 4, a single-cell genotyping assay was described. A requirement of this assay
was imaging of cells in PCR buffer prior to PCR, and detection of three DNA sequences
simultaneously in three probe colors. It was necessary to find a stain for cell imaging on-chip that
would 1) stain the cells sufficiently bright on-chip, in these buffers, for imaging 2) would not
interfere with PCR 3) would be spectrally compatible with at least two PCR hydrolysis probe
colors. Several nuclear stains were screened for these purposes.
One of the dyes tested was SYTO 82. This dye, excitation 541nm and emission 560nm,
has been used previously for real-time PCR assays,114,115 and would allow us to use FAM and Cy5
channels for allele-specific probes. This dye was found to be incompatible with the device, as the
hydrophobic dye was found preferentially partition into the hydrophobic PDMS, despite the
presence of a thin barrier of oil between the digitized volume and the chamber walls. This
partitioning happened slowly enough during filling at 4°C and imaging at room temperature to
allow for imaging the cells, but was insufficient to serve as a PCR amplification marker after
several rounds of PCR cycling. Other hydrophobic dyes were eliminated from the candidate pool,
including other SYTO dyes and YOYO dyes.
Propidium iodide is another nuclear stain exciting near 532nm, though with a considerably
broader excitation and emission spectrum. This dye did not appear to inhibit PCR at low
concentrations.
UV nuclear stains were also an attractive option because their low excitation and emission
wavelengths would allow for flexibility of dye selection for multiplexing. These stains include
DAPI, ethidium bromide, and Hoechst and might be worth investigating further. Ethidium

112
bromide has a relatively board excitation and emission spectrum, but this dye has been used in real
time PCR, and there is some evidence that it can disrupt double stranded DNA coiling, which
could be beneficial for amplification from whole cells.116,117 These dyes were more challenging
to study, since they are not compatible with commercial real-time PCR instruments.
Red color dyes were another interesting option. Draq5, excitation 633nm emission 680nm,
gave excellent signal when doped into PCR buffer, and did not seem to inhibit the PCR reaction
based on PCR product density on an agarose gel. Researchers using AFM to study Draq5 were
able to show that the dye had a disruptive effect on histones, which could be an advantage for
amplification from whole cells.117 Draq5 is an intercalating dye that does not show an increase in
fluorescence upon DNA binding, so would not be useful as a real-time PCR dye. It was decided
that having a dye that would work for both cell imaging and PCR indicator would be helpful for
troubleshooting both the method and individual PCR assays.
During these experiments with nuclear stains, it was found that washing the cells before
depositing them in PCR buffer would severely reduce the amount of signal per nucleus. The best
option for obtaining high signal to noise was to add the nuclear stain to the PCR buffer at
concentrations at or below 2 μM.
Despite other nuclear stains offering specific advantages, it was decided that EvaGreen was
an optimal dye for the current method. EvaGreen is known to be compatible with PCR, does not
appear to partition into oils or PDMS, and stains nuclei brightly. Additionally, multi-color assays
using a similar dye, SYBR green I, or EvaGreen simultaneously with a sequence specific probe
have been reported.118,119 It would be favorable to leave the green channel open for probe
fluorophores in the future, since FAM is a bright probe dye, but a three color assay of EvaGreen,
HEX, and Cy5 had good spectral separation that was possible to image with the equipment

113
available to us. If future assays would require more multiplexing, it would be feasible to do more
than three colors by carefully selecting dyes and filters.

114
VITA
Alison (Herrick) Thompson was born in Toledo, Ohio on August 12, 1986, the daughter of
Janet Radecki Herrick and Larry Herrick. She graduated as valedictorian of Swanton High School
in 2005 and continued her studies at Miami University in Oxford, Ohio. She participated in
research as an undergraduate in the laboratory of Richard L. Bretz, and completed a departmental
honors thesis titled “Identification of a Biologically Active Component from Aloe arborescens.”
As an undergraduate, she also completed a summer research internship in the laboratory of Charles
S. Henry at Colorado State University in Fort Collins, Colorado under the NSF Research
Experience for Undergraduates program. She graduated cum laude from Miami University in
2009 with a Bachelor of Science degree in chemistry and a minor in molecular biology. She started
her graduate studies in chemistry at the University of Washington in Seattle, Washington in the
laboratory of Daniel T. Chiu, where she completed her dissertation work. She graduated in 2017
with a Doctor of Philosophy in chemistry.