20050104.pdf - CANDU Owners Group Library/20050104.pdf · 125 - B.4.2 Heat & Thermodynamics MODULE...
34
125 HEAT & THERMODYNAMI CS MODULEB.4.2 ENTROPY, TllROTTLING AND MOllER DIAGRAM
Transcript of 20050104.pdf - CANDU Owners Group Library/20050104.pdf · 125 - B.4.2 Heat & Thermodynamics MODULE...

125
HEAT & THERMODYNAMI CS
MODULEB.4.2
ENTROPY, TllROTTLING AND MOllER DIAGRAM

125 - B.4.2
Heat & Thermodynamics
MODULE B. 4 • 2
ENTROPY, THROTTLING & MOLLIER DIAGRAM
Course Objectives
1. Gi yen a calculator and a set of S. I. steam tables, youwill be able to perform the following calculations:
a) Determination of final dryness fraction of steamexpanded isentropically.
b) Initial dryness fraction of steam prior to throttling.
2. Usingdrawn,
a sketch of ayou will be able
Mollier diagramto explain:
that you have
a) Why nozzle governing is used on peak loading turbines, and
b) Why throttle governing is used on base loading turbines.
Enabling Objectives
1. Illustrate asteam turbinehas sketched.
serieson a
of processes associated with theMollier diagram, which the student
2. You will be able to explain how moisture separation andreheating increase the enthalpy of the process system.
November 1981 - 1 -

Entropy
Thecause itthat has
125 - 8.4.2
conception of "Entropy·l presents a difficulty bedoes not represent anything tangible or anything
an immediate physical significance.
Entropy means I spread I and any increase of entropy, increases the spread of energy, and as a result, lowers theavailability of that energy for doing useful work.
If we had two different quantities of liquid, both having the same amount of heat but at different temperatures,the liquid at the higher temperature would have less entropythan the liquid at the lower temperature. Although the energy levels are the same, there is less energy available fromliquid at the lower temperature.
In any real process, the entropy increases. In a com-pletely ideal process, entropy stays constant. The processwhen entropy stays at the same value is called an ISENTROPICprocess and provides a useful base to compare the performance of practical systems with the ideal performance.
We will not concern ourselves with entropy beyond asimple state. You may recall in Module 8.5 'Steam Tables',that the only columns we did not look at were those headed"Specific Entropy".
When looking at the simple use of entropy, we can useit in exactly the same way as we did enthalpy, ie,
entropy of saturated steam is Sg
entropy of saturated liquid is Sf
entropy of wet steam is Sf + qSfg'
Example
Saturated steam enters a low pressure turbine at 20QoCand is exhausted at a pressure of 6 kPa{a). Determine thedryness fraction of the steam leaving the low pressure turbine if the expansion is ideal, ie, isentropic.
Before we look at any values, the whole question revolves around the fact that the value of entropy before thesteam expands is exactly the same as after the expansion.
- 2 -

125 - B.4.2
The steam prior to expansion is saturated at a temperature of 200°C. The entropy will be 8 g at 20DoC, which fromTable 1, is 6.4278 kJ/kgOC. (The units for entropy are thesame as those for specific heat capacity).
After expansion the steam will be 'wet I
know the value of 'q', the dryness fraction.at 6 kPa(a). Using Table 2,
Sf = 0.5209 kJ/kg'C.
Sfg = 7.8104 kJ/kg'C.
and we don I .~.
The steam is
If the entropy is to be constant during the process,the initial entropy is equal to the final entropy.
ie, Sg200 = Sf(0·06bar) + q Sfg(0·06 bar)
thus 6.4278 = 0.5209 + q x 7.8104
5.9069 = q x 7.8104
5.9069 75.6%.q = =7.8104
Do these examples and compare your answers at the endof the module.
B.4.2.1
Saturated steam at 160°C is allowed to expand isentropically until it is rejected to a condenser at pressure of 1bar. Determine the dryness fraction of the steam at theexhaust to the condenser.
B.4.2.2
Steam which is 4% wet at 15 bar is expanded, isentropic-ally to 60°C. Determine the dryness fraction of the finalsteam condition.
B.4.2.3
Saturated steam is expandedwhere the dryness fraction is 87%.ture of the initial steam.
- 3 -
isentropicallyDetermine the
to 36°Ctempera-

125 - B.4.2
Throttling
This is a process where a compressible fluid expandsfrom one pressure to a lower pressure. This is the processwhich occurs through the governor steam valves on the turbine when the governor steam valves are not full open. Thesmaller the percentage opening the greater the throttlingeffect becomes.
When throttling takes place, the enthalpy of the fluidremains constant, ie, the enthalpy before the partially closed governor steam valve is equal to the enthalpy after thevalve. This is true because the process occurs at high speedand there is no time for heat to pass through the containmentwalls. Secondly, there is no reduction of enthalpy due towork because there is no work done.
A significant change occurs with steam that is wet whenthrottled to a lower pressure.
- 4 -

125 - 8.4.2
A look at the temperature enthalpy diagram will helpillustrate the condition.
Temperature,
°c
P2/'- "- -JrIB
/
Entholpy. J/kgFig. 4.2.1
Suppose at point A we have stearn which has a small moisture content and exists at pressure Plo If we throttle thesteam to a lower pressure P2f the enthalpy will remain constant and condition of the steam will be at point B.
The saturation line for the steam is not vertical and wecan see that as the pressure falls, during the throttlingprocess, the steam becomes dryer until it becomes saturatedat point I C I and then becomes superheated steam at point B.Donlt forget the enthalpy has not changed.
Why is this event of any significance? During performance tests and commissioning of steam turbines using wetsteam, it is essential to check the stearn quality againstdesign value to ensure that the turbine does not suffersevere erosion damage because of excessive levels o·f moisture.
You know that you have wet steam and you know the temperature and pressure. Is it any problem determining thedryness fraction of this steam? Sure there is! Knowing onlythe temperature and pressure you could have anything fromsaturated liquid through to saturated vapour. The missingfactor is the value of enthalpy and with the given information, pinpointing this quantity is impossible.
- 5 -

125 - 8.4 ..
However - if we could throttle the wet steam to a lowerpressure and produce superheated steam, then knowing thepressure and temperature at this point would allow us to lookup the enthalpy in Table 3 of the steam tables. Once we havefound the enthalpy, which remains constant, we can determinethe dryness fraction of the wet steam.
Here's an example - wet stearn is throttled from a pressure of 40 bar to a pressure of 0.1 bar when the temperatureis IOOcC. Determine the dryness fraction of the initial wetsteam.
Using Table 3, at IOQce and a pressure of 0.1 bar, theenthalpy of the superheated steam is 2688 kJ/kg.
We knowh = hf + qhfg
tha t the enthalpywe can find l q I.
was constant and by using
Using Table 2, at 40 bar hf = 1087.4 kJ/kg, and
hfg = 1712.9 kJ/kg.
The enthalpy of the steam is 2688 kJ/kg.
Thus 2688 = 1087.4 + q x 1712.9
1600.6 = q x 1712.9 kJ/kg
1600.6q = 1712.9
= 93.4%.
Do these problems and check your answers at the end ofthe module.
8.4.2.4
Wet steam at 154°C is throttled to atmosphere at 1 barand the temperature is measured to be l25°C. Determine thedryness fraction of the wet steam.
8.4.2.5
Initially wet steam at 15 bar is throttled to producesteam at 75°C and a pressure of 5 kPa(a). Determine t11e dryness fraction of the wet steam.
- 6 -

125 - B.4.2
Mallier Diagram
This chart may be thought of as a graph of steam tablevalues, with some other information added. Although thereare many calculations that may be effectively performedusing the diagram, we shall not be concentrating on this useof the diagram.
The temperature enthalpy diagram is limited in what itcan show is happening in a process and this is the majorbenefit of looking at a Mallier diagram. We are going touse the diagram to describe the process and use the steamtables to make any calculations that are necessary.
Let I 5 examine the information which is presented on thediagram.
Axes
The diagram is a plot of enthalpy against entropy andfor most purposes we can ignore the entropy values.
Saturation Line
EnthalpykJ/kg
11111 If,'/ rIff -'fl , I'//. , Y "-. ,
Superheoted II~c><l-, Steam
yt ./' ~, II II I' """",IllfI, 'I)) L.- II-
I/HIlIn. '¥l1/ I- f/7 I<- " I-~VIlli 'tI :..- 'I II I"l' v. "- '/ Irtal VSo, il -...
lr~",.o,. I.I ,
~ / :><. "" 1/.l;"e,
I,( J h,
~ I'> ....,17 1)'-. i'\.l/ / '/ i"
T t-... ~.'" We' 'f I' )' Ki /••I;,
,-{.. Steam t-.... ......a
."'l\ y. J "- I I.( .,( :><. .,( r-.. "'"-..:'" a
-J ,,,- J " I')(1/ I"l' )' r-., r-., 1/
Nfl' .0 b( / I -... f-.< e.
Entropy. kJ/kg °cFig. 4.2.2
- 7 -
125 - B.4.2
The saturation line lies between wet steam and super-heated steam regions as shown. Anything below the line iswet steam and anything above the line is superheated steam.
Constant Moisture Lines
These lines run somewhat parallel to the saturationline in the wet steam region. The moisture content increases as the constant moisture lines become further away fromthe saturation line.
kJ/kg
II~ViTJ
"l(~i/l. '11'
I IJfIl
7/fTT"IIIII
:../~I
'f ,.... (.-/'1
1/" v7/, 7 __
/1 p, 1/1....., II
7I
I
/.1/
: "" .....
/
II
I
1
1/o.
Entropy. kJ/kgOC
Fig. 4.2.3
Constant Superheat Lines
These lines follow a similar shape to the ~,aturation
line but are in the superheat region. The first line represents a condition which is 50°C above the saturation temperature at that pressure.
- 8 -

125 - 8.4.2
1/
i I
"-'I I
wII
IIII.
,{
I
, ,r Ittl VI1ifiJ rn7
Ti'l/lAl,11
l11H ~.
•
III1K
II"
kJ/kg
En!ropy. kJ/kg eCFig. 4.2.4
~ines of Constant Pressure
These lines run feam the bottom left of the diagram towards the top right hand corner.
En.oelpkJ/kg
rN. 7W 1c; '7 Y 17 ~
·x c.... "-1..- 17
WI If '''''' 'I IJIJfIl 1,1 ''f;:: ':=t
1I111ft, lI' IF ;;, , ,, ,'7 ..;0 "'-II II I
If/I I-,.
~0
'UI III II 1'>1 '"I ,. I. 1/ II,f/
~I2.' II -"
U"" / .!?
ttu, -",,-0/; 0 (i- -J. 00 r.J I -(.
• Yo 7 [T l/:-';o• -- V~ .... ,
't '.! K "J / I Z~ ..... )' 7
-:"... c 1.1. ~ N "• . ,pO
f'1l o ~~" l'-I II ~JJ "\,('1 ~ h<'r IIrt... o f'.. eii' J)l1IM I)' . i h "" J$~ 17
·0• I~ I......., r-- o.
Entropy. kJ/kg °cFig. 4.2.5
- 9 -

125 - 8.4.2
Lines of Constant Temperature
1/
II
I
1'-.'/
r->'I. _,
I
IIi;!:
II.
I )
1/
17
II
II
/1
rl
In the wet steam region the lines of constant temperature and constant pressure are parallel. This is becauseall the time the water is at saturation conditions, ie, saturated liquid through to saturated vapour, the temperatureremains constant. Above the saturation line the constant temperature line moves over to the right as shown below.
L.-17t.--
'.7
Entholpy,\c---l-H4-41WIFkJ/kg :;~;~
Entropy. kJ/kg °cF;g.4.2.6
dothe
Before we look at howthe following exerciseback of the module.
weand
can usecompare
thiswith
array of 1 ines,the diagram at
8.4.2.6
theUsing
module,the Mollieras a guide,
diagram, given at thesketch the following:
beginning of
al Draw and label the axes required for the Mollierdiagram.
bl Draw the saturation line.cl Draw a single constant moisture line.d) Draw a single constant superheat line.e ) Draw a single constant pressure line.f) Draw a single constant temperature line.
- 10 -

125 - B.4.2
We must examine a few processes to see how they are displayed on the Mollier diagram.
Suppose we consider a typical steam turbine in a nuclear station and plot the various points. You remember whenwe looked at "entropy" we said that in the real world theentropy always increases. If you watch the progress on theMellier diagram you will see this is true.
Expansion of Steam in the hp Turbine
If we look at the initial steam condition entering thehigh pressure turbine where the steam is saturated and at250°C we have the starting point for the process.
The steam is saturated so the point must lie on thesaturation line. If you examine the lines of constant temperature you will find that the intervals are every 20°C.Consequently 250°C will lie between the lines representing240°C and 26D Q C.
~AI f~fWH+.H+-H-Hf,n 'Id/l rf Y
lilA ~f
All. , 1/1 '/I 1/ I J
II 1/ 1"
/III
1/
hLh
II
I
1/1....1/N
1:,IIi
'IILL
•
Entropy. kJ/kg"C
F;g.4.2.7
- 11 -

125 - B.4.2
The initial operating point is where the 250°C temperature line intersects the saturation line. If you look at thepressure line that passes through I A I you will see that thesaturation pressure is 40 bar. On the enthalpy axis, theenthalpy of the steam is represented by HAo
The steam is expanded to a lower pressure in the highpressure turbine, down to a pressure of 10 bar. The moistureof the steam leaving the high pressure turbine is 10%. Thismakes the plotting of the second point very easy. If we follow the constant pressure line for 10 bar up until it intersects with the 10% constanl moistul':"€ line, th is is the operating condition at the turbine exhaust.
,)
II
""'1
II
II
t'-. . Aj",
II
II
1/
II
II
IIII
II
•
t7 1/ V--!7
LI
Ui/.JI('I" 1
. 11/, U ¥I/HII'IT/IV
'I
1111
1-+--1."'-,I-+-HHiIW,1I frl'~~
The temperature at 'B' is the saturation temperature fora pressure of 10 bar which from the diagram is ISO°C. Youwill notice that point B is further to the right of the diagram than point B' because entropy has increased due to surface and fluid friction. In the ideal case the entropy wouldremain constant and instead of expanding to point B the steamwould have expanded to point B l
•
The maximum amount of work available from the turbinewould be the enthalpy difference between points A and B', ie,HA - HS I. In practice the work available waR less thanthe ideal and only equal to the enthalpy difference HA HB·
- 12 -

125 - 8.4.2
From the information that we used, you can see that wecould calculate the enthalpy drop either by using tables, 8.-=
we have already seen, or by using the scales on the Mollier:diagram.
Moisture Separation
This part of the process can be a stumbling block if weare not careful. There are several things happening at once,some real and some apparent.
Ignoring the pressure drop through the moisture separator, we can show moisture separation as taking place at constant pressure. Before we get into detailed discussion, takea look at the separation process on the Mollier diagram.
UIJI nflt!IIJ
I ,I.<
II
III
I
kJ/kg
HeH--l-f--
VI,z
H.,+-hi'll'
IfIU If,)
Yll J1I1/1l11VIIlIMItif
Ilf/) ,
VI
, ,
It,vi
Entropy. kJ/kg °cFig, 4,2.9
II
III
II
1/
II
II1/
vII 1/,'
Kill
", r+-'
,--..- I',,..+
The pressure remains constant and the process proceedsfrom condition B where the steam is 10% wet to condition Cwhere the steam is saturated.
Looking across at the enthalpy scalethe enthalpy has risen from HB to He.ously have added some heat - Not true!!some heat.
- 13 -
you will see thatSo we must obvi
In fact we removed

125 - B.4.2
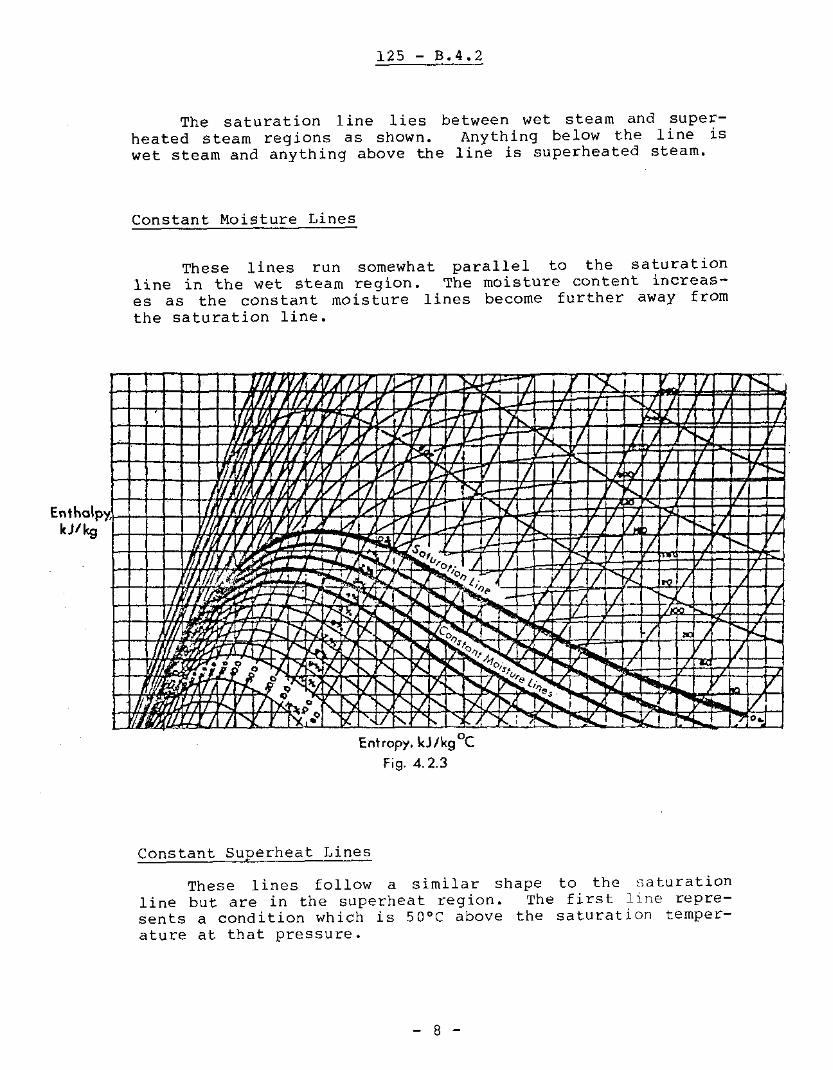
B.4.2.7
If this is so, how iscess steam appears to havethe end of the module.
Reheat
it that theincreased?
en thalpy of the proCheck your answer at
Again for purposes of illustration assume that there isno pressure drop through the reheater. Heating is takingplace at constant pressure, so the process will continue tofollow the constant pressure line.
kJ/kg
He
I.
,lA --rL--
I.r; II h'
. r'J;:Jo , 1l/ t-f7 D
'7 v
71
1/ 1/
flt'o-lJrlII
I
I
II II
I
1/
hi i"-II IIIT " 7
'; 1'1' l/;'-;~ :f f" f.... J--.,.
z _ 'I'll V" V "'- K r--, 1/1'/",- f'.. :J"- Y IINl '9 i --,.r"i.f! .Q 'hi XI .:....::.t_"'-_: "- "-
Entropy. kJlkg DC
Fig. 4.2.10
II
o.
Before we leave point I C I we did not mention that thetemperature did not change throughout the moisture separation process and is of course the saturation temperatl1!:'t? corresponding to pressure of 10 bar and t s = I80°C.
The addition of beat from the reheater is qr>lng toraise the temperature above the saturation tempet-ature andproduce superheated steam. For ease of illustration assumethat the reheater adds 50°C of superheat. The opcooratingpoint '0' occurs where the constant pressure line intersectsthe constant superheat line of 50 0 (. 'fh(; tempera i - ll:'(': of the
- 14 -

125 - B.4.2
steam is nowthe steam isthe reheater.
B.4.2.8
180 +HD -
50He
= 230°C.which is
The change in enthalpyequal to the heat lost
ofby
How does reheating increase the enthalpy of the processsteam?
* * * * *
Expansion in the Low Pressure Turbine
The expansion of the steam in the low pressure turbineis the same in principle to the expansion in the high pressure turbine, the only difference being that the steam isinitially superheated.
The steam will expand to condenser pressure, say5 kPa(a) and the condition will be 10% moisture. If we plotthis point on the diagram, this represents the end of thesteam process before condensation occurs.
- 15 -

125 - B.4.2
f,.-1-,
H-++-+-+-HtllFi1-++-+++--+I I#if' JV.IJ!llJv A
/VIflit 11
IIIfU rt4' Il/Imu r,
vII·,
kl/t'-
I
'j h( I..t-.,
V 11
II
1#
•
•
,1/ ..
11'l
Enthalpy. •WI.g
•
\ r/1\/ 1/
! I 1/ I, 1/1/
1/ 1/ r; -IH<''l-'c.u...J!,>;Cl.l..Ll-..L-,--,lXo..L-L..LLL/-l--l:.--L-D<"--,,E'J-l-_f':L:;;<J-..l-L.l-l--LL-J--L...LLl--L...Ll-J1
Enlmpy. kJ/kg°cFig. 4.2>11
If the expans ion in the low pressul-e turbine had beenideal, ie, had there been no friction, then entropy wouldhave been constant and the available work from the low pressure turbine would have been equal to HD - HE'·
Using the Mallier diagram to illustrate the completeprocess, we can see the trends in changes of enthalpy, moisture, etc. and when used 1n conjunction with tl'lC steamtables it provides a good graphical aid to he1r' solve theproblem.
- 16 -

HPTurbine ~
125 - B.4.;'
:...rl
D
II
II
II
1/
1/
'[II
0<-:11 .
II.1/
'I
~-~Moisture 1'0SepCfotO( 1)10, 'ff 1- r-;;
-:-I-... "- 'f. " j 7 7j
'" 1-... I'-... "- LP, 'f' . I "- :L Turbine t><. .,( ""If 'J'B
" 'I- 'I 'I- r-.. I I
'!.B' "- "-. ...... '5' 17 0
Enthalpy. . 1/ r .J' "'- y... D<.. .,( '~
kJ/1<g f.../ , h( r-.... t--. 7' ." ,~ IIV '" .
l/ I~ r-(/ .1/ I)( 1/ -1 r-.. .,
1/11 II l>{ lYIf I I' l><. 1/ t>- ,
[>Ii I .:1 1/ t-\ D' I) t--. 1/,I'. ~ PI" I'l? t--. 1/ ,
1I 0
" t--. I.E1/ ,/ '\ ,I 1'1 ." "I 'I i\ I / II "1/ II I)' / I. 1/ b#
\ / '\ 'j
" I I'o'? 1/1/ II 1/ 17 1/ /
/ J 1\1 1/ A '7 ,.II IV 7 7 "'-
,/ 17 / ht ~.
f\ IX E' "'-
oEn'<opy. kJ/kg C
Fig. 4.2.12
Do these problems and check your answers at the end ofthe module.
B.4.2.9
Sketch your own Mollier diagram to illustrate the following series of processes: A high pressure turbine uses
- 17 -

125 - 8.4.2
saturated steam at 240°C and exhaust the 10% wet steam to amoisture separator at 160°C. The separator produces 2% wetsteam and is followed by a reheater which produces 40°C ofsuperheat. The superheated stearn expands in a low pressureturbine to 10% moisture at 35°C.
8.4.2.10
Explain how your sketch wouldthe condensation process in thequestion B.4.2.9.
B.4.2.11
change ifcondenser
you had toassociated
showwith
The mass f lowra te ofbine, in question B.4.2.9flow into the reheater.
Throttling
steam into theis 900 kg/so
high pressureDetermine the
turmass
We have already looked atvalues from the steam tables.shown on the Mallier diagram.
this process using enthalpyThe process may be clearly
Remember that throttling iscess, so on the Mollier diagramhorizontal line.
a constant enthalpythis is represented
proby a
An example will illustrate the process. Steam at 40 barwith 3% moisture is throttled to 2 bar. Determine the finaltemperature of the steam and the degree of superheat.
Before we look at the diagram, we know that by throttling wet steam to a low enough pressure we can produce notonly saturated steam, but superheated steam.
- 18 -

125 - 8.4.2
T i nllV fl, l)(/]I' v [..ow l"- - - . -N II'~': '1"",W" .
H rl I -ri.ctii:,. ,.~, Ii'" ',' j •
"I1/
' ~~.
+. ,·,L·T', : "t:"":'~
rJ fl V II r-. LI.oII i·'j'-,~.
~I .. r~¥:;,f},f/
VII.f/
~C'l f/ 1--. ' 71 ,
flltfJ 17"0 1--.IlllI~
s II!:S'v"°1' •J.JAl
~~ II• t,". to...
l',n' I:'" \./ ~ IIt><- 1/
'("j N II 1'7 I).~ J><. '" I"-
-~' •
I'" % U I'. II ~ hi' b( hi' !'" .... ,10,' II f', ,,~... I'> 1/h 1'7 1'> t... l>" III
1'< • 0- l"- f' 1)' i~
EnthalpykJlkg
Entmpy, kJlkg"c
F;g, 4.2.13
As the steam is throttled from point A, to the lowerpressure at point B f the quality changes from wet steam tcsuperheated steam at a temperature of 140°C which, from thE'diagram, is roughly 2QoC above the saturation temperature anctherefore there are 20 Q C of superheat.
This looks like a convenient way of producing superheated steam and perhaps we should use this technique to producesuperheated steam entering the high pressure turbine.' It canbe done thermodynamically without any difficulty.
Suppose we take the saturated steam at 250°C, which isthe normal condition of steam entering the high pressure turbine, and produce superheated steam by throttling it to 1 barprior to entry to the turbine. All the time the heat contentremains constant.
- 19 -

125 - 8.4.2
H--HH-+-+fIIIJ-I1lf~"i'V
II
II
,I} •
1/
.....1/.....
V,1/
II
B
ll" J IIr"l
II
If J
If
••
/I Ib
~""';'-+--I-m:1Hr-/-v'\1 AUllll
kJ/l<g
Ent,cpy. kJ/kg°cFig.4.2.14
This process produces steam which is well superheatedwith a temperature around 65(>C above the saturation temperature so no problems of excessive moisture.
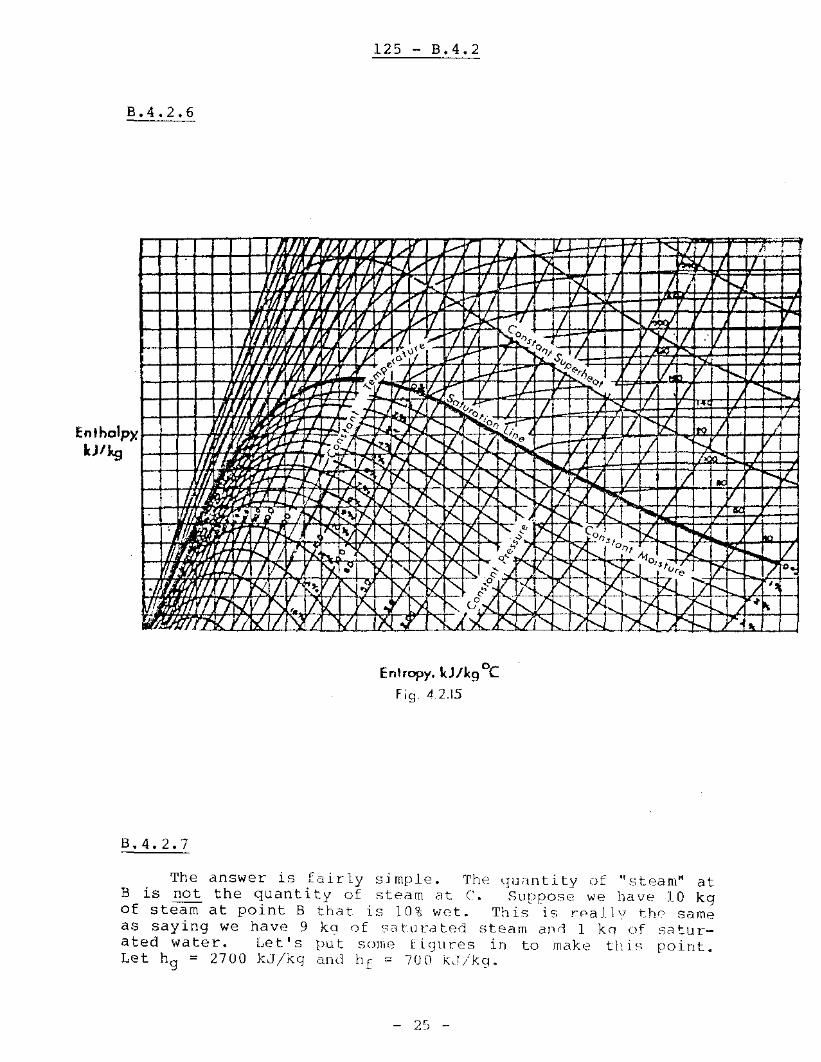
8.4.2.12
Why don I t we take advan tage of th is process? There isno loss of enthalpy and we have steam which is well superheated - how can we go wrong! Analyse th is s1 tuation and ina few lines write down why you think we do not use this as asolution to the moisture problems in our turbines. Checkyour answer at the end of the module.
Throttling increases the entropy of the process and wecannot get as much work out of the steam. This factor becomes of major consideration when we consider the control ofgovernor steam valves. Suppose we have a turbine with fourgovernor steam valves. If they all open at the same time,then all four valves will be throttling the steam until the
- ?O -

125 - B.4.2
valves are all fully opened when no throttling occurs. Thismethod of control is called "throttle governing" and it produces a loss of efficiency if operating at any load otherthan full load. If the governor steam valves open one afterthe other, in principle, there is no more than one valvethrottling the steam. This method of control is called "nozzle governing".
B.4.2.13
Using a Mollier diagram, explain why nozzle governing isused for control purposes in peak loading units and whythrottle governing is used for control purposes in base loading units. Check your answer at the end of the module.
* * * * *
We have looked briefly at entropy and performed simplecalculations. We have looked at the throttling process, bothwith steam tables and with the Mollier diagram. We haveexamined the use of the Mollier diagram as an aid to describing the turbine process which is difficult to achieve usingthe temperature/enthalpy diagram.
If you are confident that you can meet the objectivesand are ready to take the criterion test, ask the Course/Shift Manager for the test.
After you have written the test, ask for the self evaluation sheet and compare your answers with those on the evaluation sheet.
Finally, discuss your criterion test with the Course/Shift Manager and if you are both satisfied with the results,have the Manager sign the progress summary sheet. If youidentify areas that need reinforcing, return to the coursematerial and retake the test when you feel that you are competent.
When you have successfully completed this module you mayproceed to Module 8.4.1.
- 21 -

125 - 8.4.2
Answers
MODULE 8.4.2
ENTROPY, THROTTLING & MOLLIER DIAGRAM
8.4.2.1
The whole process takes place at constant entropy I ie,the initial entropy is equal to the final entropy.
The initial condition is saturated steam at 160°C. FromTable 1, 59 at 160°C = 6.7475 kJ/kgOC.
The final condition is wet steam at 1 bar, the drynessfraction is unknown.
At 1 barand
= 1.30276.0571
kJjkgOCkJjkgOC.
Sl bar = Sf = qSfg
= 1.3027 + q x 6.0571 kJjkgOC.
Equating the initial and final conditions,
8 g 160 = 81 bar"
Substituting 6.7475 = 1.3027 + q x 6.0571 kJ/kgOC
5.4448 = q x 6.0571
hence q 5.4448= 6.0571 = 89.9%.
Again we know that the entropy remains constant throughout the process and that the initial and final entropies areequal.
The initial condition isusing Table 2 we can determine
4%the
wet steam atentropy using
15 bar and
S = Sf + qSfg'
Sf at 15 bar = 2.3145 kJjkgOC.
Sfg at 15 bar = 4.1261 kJjkgOC.
- 22 -

125 - 8.4.2
S = 2.3145 + 0.96 x 4.1261 kJ/kg'C
= 2.3145 + 3.9611
= 6.2756 kJ/kg'C.
The final condition will be wetter steam than 4% at60()C.
Sf at 60'C = 0.8310 kJ/kg'C.
Bfg at 60'C = 7.0798 kJ/kg'C.
Equating initial and final conditions we get:
6.2756 = 0.8310 + q x 7.0798 kJ/kg'C
5.4446 = q x 7.0798.
• • q = 76.9%.
'1.4.2.3
Again we know that the entropyand we can determine the value ofcondition using S = Sf + qSfgo
is constant throughoutentropy at the final
Using Table 1, at 36'C Sf = 0.5184 kJ/kg'C
and Sfg = 7.8164 kJ/kg'C.
Thus S = 0.5184 + 0.87 x 7.8164
= 0.5184 + 6.8003 kJ/kg'C
= 7.3187 kJ/kg'C.
We know that the entropy is constant so this value of7.31~7 kJ/kgOC is also the initial value.
If we look at S , because we are told that the initialsteam condition is sa~urated, in Table 1, we will be able tofind the value of t s which most nearly has a correspondingvalue of 8 g = 7.3187 kJ/kgOC.
The nearest value is 8 g = 7.3196 kJ/kgOC at t s = 103°C.
- 23 -

125 - B.4.~
B.4.2.4
The final condition of the superheated steam allows usto pinpoint the enthalpy. Using Table 3, 125°C is halfwaybetween the quoted values, so at a pressure of 1 bar and atemperature of 125°C, h is
2776 + 26762
= 2726 kJ/kg.
This enthalpy remains constant.
Using Table 1 we can find the values of hf and hfg at154°C which are 649.4 kJjkg and 2100.6 kJ/kg respectively.
Using h = hf + qhfg we get
2726 = 649.4 + q 2100.6 kJ/kg
2076.6 = q x 2100.6
2076.6q = 2100.6
= 98.9%.
B.4.2.5
Again the final condition is the key to the solution.Using Table 3, 75°C is in between the stated values. At apressure of 5 kPa(a) and a temperature of 75°C,
2594h = + 26882 = ~oll kJ/kg.
Thisdetermineda pressuretively.
enthalpy remains constant and allows Iql to beusing h = h f + 411£go Using Table 2, tl E and hfg atof 15 bar are 844.7 kJ/kg and 1945.2 kJ/kg respec-
Using h = h f + qhfg we get
2641 = 844.7 x q x 1945.2 kJ/kg
1796.3 = q x 1945.2
1796.3q = 1945.2
= 92.3%.
- 24 -
125 - B.4.2
B.4.2.6
II, f)
lIlt),VI"'.
IJIMW/j
En tholp)ll-H-f-lli~kJ/1<g
I-
8.4.2.7
f7
Iv
En'",py. kJ/kg °cFig_ .d 2.15
...
r'l'
""'J:7 ! ;/1
I fo..
I.
/ 1fo.. I
"-II
N!j< ..... 1/
D- h- I) .,,
f-- .~
The answer is fairly sirnI)le. The lIlJ;lntity of "steam" atB is not the quantity of steam at C'. SlJ[JpoSe we 11dve :1.0 kgof steam at point B that is 10% wet. This is r0aJ]V th0 sameas saying we have 9 ka of sat:IJrated steam dl,rl 1 kq (If saturated water. Letls put SOllie ti(Jures in to make thl~; point.Let hg = 2700 kJjkg an(l ll[ = 70r) k.l/kg.

125 - B.4.2
Then the average enthalpy of this mixture is
(9 kg x 2700 kJ/kgl + (1 kg x 700 kJ/kgl10 kg
24300 + 700= 10
= 2500 kJ/kg.
When we pass the wet steam through the moisture separator we removed the 1 kg of saturated liquid, ie, the low gradewater and now the enthalpy of the working fluid which issaturated steam, is 2700 kJ/kg, an increase of 200 kJ/kg.BUT the overall quantity of steam has now been reduced by10%. This is the pitfall when negotiating this part of theprocess. You must make sure that you change the flowrateafter the moisture separation to account for the mass ofliquid removed. If the steam leaving the moisture separatoris saturated and the steam was x% wet, then the reduction insteam flow as a result of moisture separation is also x%.
B.4.2.8
Reheating increases the enthalpy of the process steam bymeans of a transfer of heat from main steam that is takenfrom the balance header. This main steam loses heat (in thereheater) to the process steam, increasing the temperatureand thus the enthalpy of the process steam. Typically steamat balance header is 250°C and heats the process steam flowing through the reheater, from 175°C to 235°C.
- 26 -

125 - B.4.2
B.4.2.9
'Itf .r
'A f
Enlhalpy. .kJfkg I
I~
1"- "-1:71
II I ~
~ I=iII r--.
2';::.71 ·1/ Iiv .
'00If
....
Iflff IX t\ V 1'- !lit'-. / 1-. I / >
'I
IXII'
II
Iv
•II
IIV II f... II'> I 0
.,"I)'
'" 1'><r'-.
E'Wl- i'
Enl,opy, kJfkg°cFig. 4.2.16
. ,
Process A - B
Initial condition is saturated steam at 240°C. Expansion in the high pressure turbine, allowing for frictionaleffects, takes the process to the right of point B I at amoisture level of 10%.
- 27 -

125 - B.4.2
Process B - C
The moisture separator, assuming no pressure drop,removes moisture from 10% to 2%. The temperature remainsconstant at the saturation temperature of 160°C.
Process C - D
Again assuming no pressure loss in the reheater, theenthalpy of the steam is increased at constant pressure,initially up to the saturated steam condition, after whichfurther addition of heat raises the temperature from 160°C toZODoC.
Process D - E
The superheated stea.m expands in the low pressure turbine and allowing for friction takes the process to the rightof point E' where the final temperature is 35°C and the moisture level is 10%.
B.4.2.10
If the condensation process was illustrated on theMellier diagram this would take place at constant pressureand temperature while the latent heat was being removed. Theprocess would move down the constant pr.essure/temperatureline to some point off the diagram when the moisture would be100%, ie, at the saturated liquid line.
- 28 -

125 - B.4.2
IA'/I'/
I nflV KI,III,
1-+++++-IcjjfJYHiIIV I
1',11
'I
••
1/
1
1/ •,•
II
1/7I,;;r--
1
II
1
1":1/17 >. 'y.f y..hJ /'-,11 "- ~ht
OJ Iii'" I'.1 • :1 ~ ,i F::: ~.
11
iliTTI/f/if7'If~
I If.
, II,
Enthalpy. •kJ/kg
fI
il
oEn'<opy. kJ/kg C
Fig. 4.2.1 7
B.4.2.11
The change in mass flow occurs in the moisture separatorwhere the dryness fraction is increased from 90% to 98% byremoving the moisture droplets. Consequently 8% of the working fluid has been removed and the flow into the reheater
= 0.92 x 900
= 828 kg/5.
- 29 -
125 - B.4.2
B.4.2.12
f,
-;
I f':"-II
B II17
II I,(
II I'J.
The enthalpy at points A dnd B is the same. The amountof work that is available depends upon the change of enthalpy. In practice we expand the steam i(l the turbine to atemperature which is dictated by the ccnling water supply.Assume that the turbine exhaust is at 35"C. The enthalpydrop from the ini t ia 1 cond it ion to the cons tant temperatureline will indicate the wor"k available.
- 30 -

125 - B.4.2
H... ,H.+--.-,----
EnlholnkJ/J.g
H.'
Entropy. kJlkg°cFig. 4.2.19
• 'j. • .1- ..........
, I '. ,
If we consider the process from point A, the enthalpydrop is HA - HA'. Similarly, if we consider the enthalpydrop at point B, the value is HB - HB I. You can see thatalthough the enthalpy is the same, the work available isdecreased as a result of the throttling process increasingthe unavailable part of the enthalpy. If the enthalpy HS HB' was only 50% of HA HA', then the steam flowratewould have to be doubled to achieve the same power outputusing the throttling technique. In practice the low pressureturbines are large enough without increasing the size toaccommodate a larger steam flow, which incidentally wouldresult in a less efficient cycle.
- 31 -
125 - 8.4.2
B.4.2.13
-,~
~ _'._'_-," I
; ,
1
A
:T
i I •
"k"tti::;n.: :.,:till",-..v:- I ,i', -1L
~\l~--·""'-' ~"-,,,,,,, -l- _"'-4 -: __J_+~_'
'(~~'N:;( .,1~" ~ ,eo; i '11 : I j , i
t~\I'~ I' 'i~,~:' -<-, "+ I I I ' ! : ;
:1' t r~" 'r l: 1"'1-:1 :IT'I I.~ ., + ) ,! I
I I I ! I! I : I Iiii Ii'ii, 'I' I , I, i I
I i I II I, i! i i
Entropy. kJ/kgOCFig.A.2.20
i ,I1 • 1 1" ,r ' , ,,
I ,
,i ' , I
I! I" ,Ii' .J-tL--
I ,Enthalpy,:kJ/kg
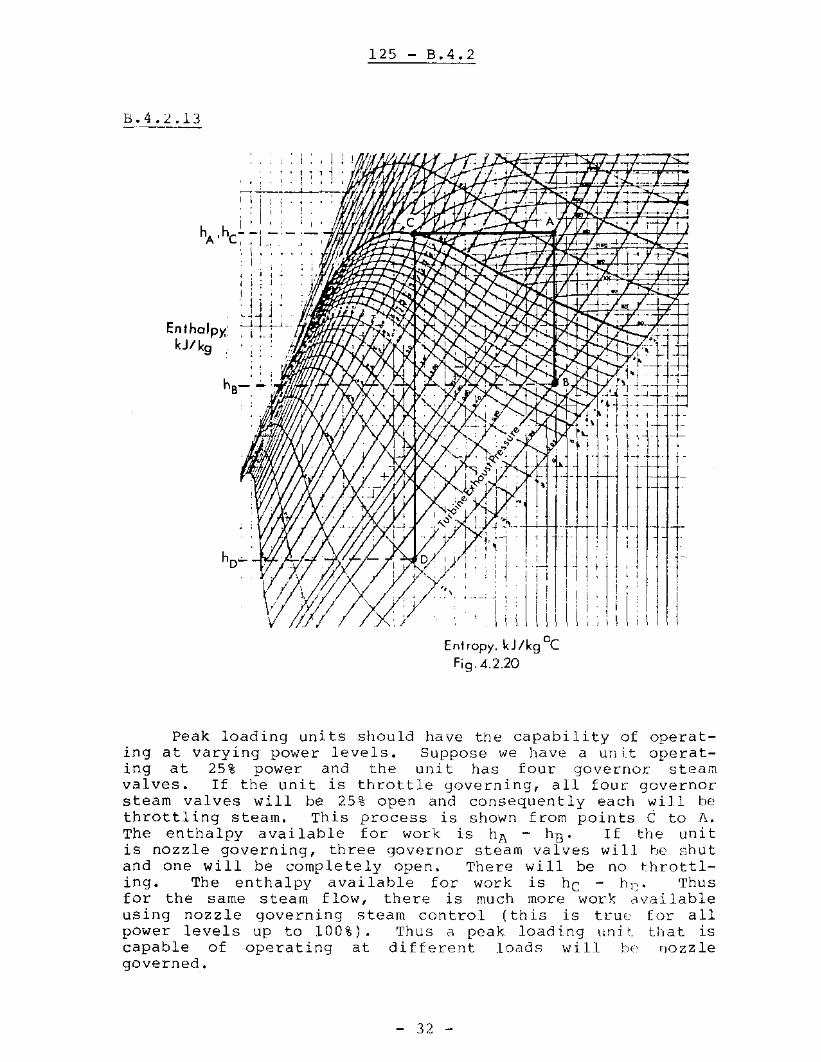
Peak loading units should have the capability of operating at varying power levels. Suppose we have a un i.t operating at 25% power and the unit has four governor steamvalves. If the unit is throttle governing, all four governorsteam valves will be 25% open and consequently each will bethrottling steam. This process is shown from POillts t to A.The enthalpy available for work is hl\ hB' If the unitis nozzle governing, three governor steam valves will he shutand one will be completely open. There will be no ttlrottling. The enthalpy available for work is he h r;. Thusfor the same steam flow, there is much more work dvailableusing nozzle governing steam control (this is tl._-uc (or allpower levels up to lOOt). Thus a peak loading llnit. tllat iscapable of operating at differellt loads will t1(' rlozzlegoverned.
- 32 -

125 - 6.4.2
Base loading units run ideally at 100% power for longperiods. At 100% power levels neither throttle governed nornozzle governed units will throttle steam. Thus each willbehave the same the choice of which type of control isdetermined by economics. Throttle governing control is lesscostly, so it is used for base loading units.
J. Irwin-Childs
- 33 -