
© BRE Trust (UK) Permission is granted for personal ... · © BRE Trust (UK) Permission is granted...
38
© BRE Trust (UK) Permission is granted for personal noncommercial research use. Citation of the work is allowed and encouraged.
Transcript of © BRE Trust (UK) Permission is granted for personal ... · © BRE Trust (UK) Permission is granted...

© BRE Trust (UK) Permission is granted for personal noncommercial research use. Citation of the work is allowed and encouraged.

FeR, Note No, 572
DEPARTMENT OF SCIENTIFIC AND INDUSTRIAL RESEARCH AND FIRE OFFICES' COMMITTEEJOINT FIRE RESEARCH ORGAliIZATION
THE EFFECT OF WIND ON PLUMES FROM A LINE HEAT SOURCE
by
P, H, Thomas
SUMMARY
'rhe precl.Lut:i.on of the temperature rise downwind from a long fire fronts:d.Yaneing in the open is of interest in the study of fire spread, This reportNhiJ:h '3xtund.s ana. revises an earlier report Fire Research Ncte 510 presents asimplIfi.ed. cor-r-eLat.ion in terms of dimensionless variables of the exper-iment.e.L
ta p;.,blLshed by Rankine on the effeet on the downwind temperature rise of theoutput from 2, line burner and the wind speed, Desp.i. te some variations of
tomperat).,lre rise with the absolute values of the wind speed and heat output othert1::,fLn those aecounted for by the dimensionless variables, the correlations are onl;h2 whole satisfactory
ifj' 1.the velocity'tTo, (.' "T--)3
.. '- 0
due to gravity ,
is the rate of heat release per unit length of fire
:i..8 the density of air
is the apec.i.f'Lo heat of air
is the accelerationg
Q
Jo
the experimental results to a simplified theoretical model first.L Taylor assuming a uniform wind velocity Uo and allowing only
"Tert:Leal diffusion with a .i ncr-eaai ng in proportion to :Y: thedi"-::9,nc8. from the burner, or to the local height of the plume, gives a diffusivity
e qua.L to 0,048 l<!:'Uo,,,,1,95
,,) LVJ,hE';;j~'8 1..fL a s the rctt:to of Uo to
and. is the absolute temperature
The s.imp l i.f'Le d theory employed was shown by G. 10 Taylor to be not entirelyself consi stant and this is discussed further,
The most immediately practically useful result is that over the range ofdimensionless wind. speeds in these experiments the maximum temperature rise at ad.istance ~L downwind is near the ground and given by
8 = 2,35 "V:;~o ,FL!4or ro-1J:ghl~I
"\12 To
ax11

THE EFFECT OF WIND ON PLUMES FROM A LINE HEAT SOURCE
by
Po H. Thomas
Introduotion
During the last war the possibility was examined of olearing airfields offog by u~ing line souroes of heat to set up a hori~o~tal flow of air near theground(1) and as part of the investigation Rankine\2) studied the effect of windon the flow from a long line burner in the Empress Hall, Earls Court, London~
Air was drawn by a large fan aoross a long line burner and extensive velocity andtemperature measurements were made. In addition some full scale tests wereundertaken in the open and satisfactory agreement was obtained between the fieldand laboratory experiments. Such experiments are of considerable interest in thestudy of the effect of wind on the spread of a long fire f'ro.n t and in this paperthe experimental results tabulated by Rankine are correlated by dimensionlessvariable s , At long dis t.ances from a fiui te source the diffusion of the plume isoontrolled by the turbulence in the wind and the role of thermal instability isnegligible. The upper edge of the plume would appear to diverge from a sourceabove the ground by an amount dependant on the buoyancy. Near to the real sourcethe effects of buoyancy are predominant and these results are examined on thisbasis. Some observations are made regarding these var'Lous assumptions and other(3)(4r~ of the problem which have been studied. theoretically by Sir Geoffrey Taylor
Results obtained by Rankine
Fig 1 shows diagrammatically the exper-Lmerrta.L arrangement and also de f'Lnesthe measured quanti ti. ets , The ranges of the independent variables and thepositions at which the temperature rise and velooity were measured are given inTable 1.
TABLE 1
The R~nge of Experimental Variables
Gross heat outputWind" Distances Heights
per unit length speeJd downwt.ndabove
of burner groundUo x z
0.04 - 0 0 48 - 5 ft/s 3' 9"e 7' 6~V: 'I .6'" to 80"I
Therms per hour in steps. and 15'per yard in of ~ :ftj,ssteps of 0.01+1 Therm '" 100,000 Btu
Ranlcme vstates that "the r-esu.I ts have been ana.lysed , interpolated and smoothedto remove evd.derrt er-rcr-s in the customary manner" • He did not in his tabulationof the data include any tempera~ure rises over 30oC, and he estimated from a heatbalance the net conveotion flux to be 80 per oent of the gross input. Of theremaining 20 per cerrt the major portion (15.J1IS1r cerit; of the total) was lost asthermal radiation, presumably largely from the flames. The remaining 5 per centwas taken to be lost to the ground. This constant factor of 80 per cent is usedthroughout this paper to convert the tabulated gross values to net values ofconvec.ted he.at , The results are given in Rankine's report in tables for eachvalue of distance x d.ownwind from the line burner and the height z above theground, each table giving either the temperature or horizontal veIo ci ty for allheat flows and wind speed UOA

Scaling Laws
Let Q be the net convective flux per unit length of line per unit time,(i. e. 0.8 of the tabulated value), U the local horizontal velocity, Do theapplied wind (free stream velocity) To the absolute ambient temperature, .fthe density of air, c the specific heat of air, g the gravitationalacceleration, and G the rise in temperature at a distanoe x downwind fromthe line butner" and. a height z above the gr-ound.,
The following assumptions are made here.
1. The effects of changes in density other than those on the puoyanoyare negligible Le. G «S;: To.
2. The gases o.bey the ideal gas laws so that the effect of buoyanoy is aforoe per unit mass of g G/To 6
3. The main effect of friotion with the ground is confined to alayer near the. ground. Outside this layer mixing is assumed to be controlled.primarily by turbulenoe generated by thermal instability, an assumption whichis discussed further in the Appendix.
4. The flow outside this ground layer is assumed. to be independent ofviscous fO,rces.
Ei ther from the differential equations governing the heat balance and themomentum, or f'rom a direct dimensional analysis of the above terms it followsthat the solution tak$S the form
where,J"Lis
and Vthe. dimenricmless=. (I>: ~ )3p;
it may 'be regarded as a
F (~i)
wind speed
dimensionles.s temperature rise.
(1)
Equation (n is more. general than Rankine's own statement regarding scalingwhich is physioally eauivalent. The data tabulated b;jT Rankine have been usedto obtain both ¢ and lI/Uo as fune tj.ons of z/x for different values of JL, andalternatively, as functions ofJl..,for different values of z/x.
Variatio.n in temperature
Rankine's data have been evaluated in terms of the dimensionless ¢ andJL.with}) =. 0.08 lb/ft3, c =. 0.24 Btu lb~1()F.~1 To =. The accur-acy of thetemperature measurement was reported to be about 0.2oF and only one deoimalplace was given in the averagEiB. recorded. Temperature rises equal to or lessthan 0.3oF have therefore been omitted from the dimensionless temperature risesshown in ~ig. (2=14). It is seen that except near the cold upper edge of theplume (Fig. ~2, 3 and 4) where any experimental error is of most consequence,and ncar the ground (Fig. 9e'14-) t.he different sets of data are reasonably wellcorrelated together; e.go the one graph of Fig. (5) includes all the data inthree of Rankine's tables. FOr the results in Fig. (7) there is a slighttendenoy for absolutely higher windspeeds to give absolutely higher temperaturesthan expected on the basis of the pr-ecedf.ng argument and the effeot is morepronounced. at 15 l t.han at 7' 6" from the burner. At the higher speeds theresults for the two different positiona are in closer agreemell"t than at lowerspeeds.
In Fig.e (9~14-). which pertain to a region cLoae to the ground ~~~ On 11 ~

where the flow was thermally stratified there is a general tendency at high windspee® for an increase in the speed to increase the temperature at the measuringpoint. There is a ncticeable variation in 9f with the absolute wind speed aswell as wi th the dimensionless wind speed J1., and for each velocity, rj usuallyhas a minimum Fig. (9,11,12 and 14) which occurs at a value of JL approximatelyproportional to Uo. i.e. at the same value of V" for each.* However the effectis absent or ill-defined at 7' 6" the middle (see Fig. 10 and 13) of the threedistances downwind at which measurements were made. This apparent lack ofsystematic behaviour means further study is. necessary before conditions near theground in these experiments could be discussed in much further detail.
Except near the ground the lack of correlation, although systematic as inFig. (7),is slight, If from Fig, (2-14) we take a series of values of yf througlnutthe range of JI.,. and from the smoothed curves plot yf against z/x we obtain theourves in Fig. (15). For Fig, (10) and (13) the upper line was used. Obviouslythe part of the profile near the ground is not expecte.d to be accurate. It willbe notioed in Fig. (15) that abovez/x equal to about 0 •. 1 increasing the windr educes the temperature; below Z/X about O~.t it increased it.
The variation in local velaoity
In the veloci ty profiles given by Rankine for the unheated condition thevelooity U was found to be pr-opcr tdona.L to TIc and independent of x , U/Uois plotted against logez in Fig .• (16). From the profile equation
U = 2.5 UX Loge z/zo
the friction velocity UX is obtained as
UX 0.047 Uoand the characteristic roughness Zo as
0.029 em 0.00075 ft
The macr-e-vj.scoai ty UX Zo varied from 53 x 10-6 ft2/s to 170 xi 0-6 ft2/ sso that flow was intermediate between smooth and fully rough, Zo is sufficientlyl.arge for it to be.)2ffectivelY ind.ependent of Uo' The skin friotion coefficient<f taken as 2 ~~) is equal to 0.0045. The eda.y visoosity near the wall is.0.4 UXz 0
i.e. -Eo",,,, 0.019 Uoz (3)
and this would obtain,for zuis below about 100. With \J the kinematicViSC(ifS.i~y 150x 10-6 ft2/s, ~nd UI{ in_~hese experiments in the range 1·~ ft/s. ~o5 ft/s lt follows that e quatd.on (3) app.Lt.e s for z less than about 3". In t.h.i aregion, no velocity measurements were made and the temperature rises were measuredonly at z = 1.6J
{ at 3' 9f' , 7' 6f f and 15' from the bur-nar ,
At values of a UX greater than about 100 the eddy vt.sco s.i, ty, according teClauser (5) has a uniform value
displacement thickne~s and
J = jcL U/Ue) dz,o
A graphical integration of'the profile where there was no heating gave;..
d =
10where J is the
*This was drawn to my attention by Dr, B. R. Morton
- 3 ~

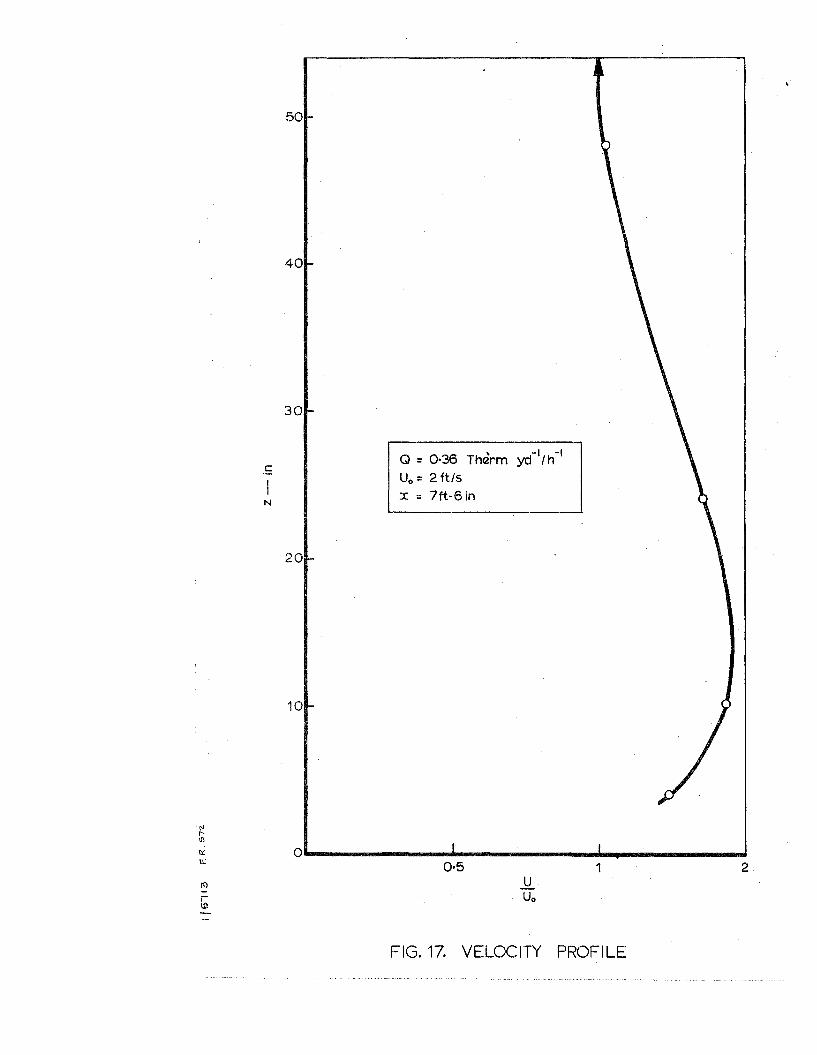
so that for these experiments tev reached a maximum value 'lra,rying from0.012 ft2/a to 0.04 fifs over the range of wind speed. It is shown in theAppendix that in the range of these experiments this.. is at most i of the eddyviscosity calculated from thermal instability and in the middle of theexperimental range an order less. Wh.en Q was not zero and the wind speednot too high the velocity profile had a maximum exceeding the main streamwind speed - see Fig.• (17). Figs. (18) (19) and (20) give values of U/Uoagainst J'l- for var'Leua positions in the stream, each group corresponding toa particular height of the measuring, po i.nt.; and it can be seen that thevelocity enhanoement, as Rankine described it, d.i.sappear-s for Jl.>3 even whenUo is as low as 1~ ft/s. The cur-ves of U/UQ versu.sJ'L show that at highvalues of Uo the value of U/Ue; does not rise. progr:essively as JL. falls.This is partioularly notioeable near the ground- see: Fig. (2.0). The valueof JL at which U/Uo reaches a maximum is approximately proportional to UqLe. the maximum U OCOll)?'S at a particular value of "1f (,......1.5 ft/s) whichis close to the value which WaS pointed out above as marking minima in thetemperature curves hear the ground. At higher values of -U- the temperatureis above and the velocity below that exps c ted from the trend of theoorrelation for lower values of 'tI .
The ve.Lcc i. ties at any one position appear to be aeymp totzl.c to a singleourve for low values of Uo.o TherE;! is, however, one position (Fig. 18A) wherethe correlation is partioularly poor'.
At highwhere U isFor non-zeroJl. and Z..
different ~
values of Jl.,the va.Luea of U tend to those typioal of lIero Q,determined by ground friotion and U/U@ is a f'unctzi.on of z."Q local velocities oannot~ however, be oorrelated in terms ofOnly two compar-i.sons are poaa.i.b.Le for equal values of :fix and
and these (Figs. (18A) and (18B) are inconclusive.
In a vertical plume diffusion in the horizontal direction is greater thanin vertical direotion. For a bent over pLume the reve.rse is true ao theremust be a region of low Jt where diffusion in one diX'!3:\tiom cannot be negleotedin compar-i aon with the other (Le •. no boundary layer approxi.m.ation is possible)but largely because of e.xperimental diffioulties with recirculation under theroof the transition from a vertioal to a hcriz.Qntal plane coul.d not be examined.by Rankine.
In still air a horizontal flow is induced into a vertical plume(6) equalto 0.29'\J from each side. If the transition were a gr-adual. one it might beexpeoted that as. Uo. decr-easea the horizontal ve Ioc.l. ty U should approach alimit
U -7'" 0.29 -u
U/U~ 0.29/JL
At high values. of Jl, U/U m.ight be expected to approach the limitgiven by the profile in Fig. (16~ for zero Q, Le. JlY/u o should tend to belinear with Jl e AocordinglyJlU/Uo has. been evaluated and plotted against
.)1..... (not shown here), but in view of the Lack of oorrelation between datafor different values of Uo and the limited range ofl.!'V for whioh there is alarge enough exoess of U/Uo above its minimum value, the extrapolation to~ero JLi.s. rather imprecise. It was. possible to use si.x s.ets of data andthe extrapolati.on g8,ye values between 0.6 and 1.2 with a mean of 0.8.5. Thisis three timea larger than the figure 0.29 arid i.t suggests that it may not bepossible to regard the limiting form of these plumea a/J one half' of a verticalplume nor perhaps even as one half of a vertical plume entraining as much airon one side. as. a vertioal plume entrains on both sides.

Discussion
Sir Geoffrey Taylor(3)(4) considered the theoretical interpretation of thisproblem by assuming as an approximation that the velooity was uniform and in onedireotion. Only transport of heat in the z direction was allowed foro Theheat balance equation then beoomes
Ic)cu ~,; a O~
(5 )
Two forms for the effeetive diffusivity were considered viz.
6T }c Cd/Tand t T ;;(.. C2eJ!J:...}~&)
V -r;; (./7/
(6A)
(6B)
where C1 and C2 are oonstants to be determined from the experiments y 1 is amixing length assumed proportional to. the height of the plume",
f <A- x TanoL- (7)
The constant of proportionality can be absorbed into C1 or C2 and .L is theangle the upper edge of the plume makes with the horizontal... He assumed thatthere was a similarity solution such that the distribution of temperature aorossany vertioal section of the plume was the same though the scale both of thetemperature distribution and the height of the plume were assumed functions of thewind speed and the heat output·~ The only independent parameter in thisformulation that oan determine these scales is the dimensionless wind speed and heassumed a similarity solution and that the dependenoe of the soales on this termtook the form of a power lawA Equation (1) then takes the form
(8)
where
The indices ill and n have yet to be determined", If equations (8) and (9) aresubstituted into equations (5) and (6) we obtain whf.chever- form is used for 6'T
The heat balance is )(X O<M.-"l
!e) U.&.dz '" Qo
and using equations (8) and (9) this gives
(10)
(11 )
m -+n + 1 '" 0 (12)
Equating the indices of Jl in equations (9) and (10) then gives
m '" t and n '" 3/2
The tangE)nt of the plume angle should therefore vary as Qt;U3/2 and themaximum dimens.ionless temperature 00 as ;A} 0 These results have recently beendisoussed again by Sir Geoffrey Taylor(4rand he emphasized that they are aconsequence of assuming that the turbUlenCE) is produced by thermal instability~
If the turbulence were assumed to originate from horizontal shear then Tan ~would be independent of the dimensionless windspeed. In fact the experimental

observations(2) showed that
J . 0 )0.286Tan oC '""---u}
and he commented that this is intermediate between the two results and suggestedthat shear and thermal instability were of comparable .i.mpor-tance , Rankiner ef'er s to field measurements 75 yd.s downwind and this represents a scale factorof from 15 : 1 to 60 : 1 compared with the measurements at 15 T and 3' 9n in thelaboratory. To obtain similarity between the effects of shear and thermalinstability would require equal values of
Le. equal values of
The comparison was made at equal values of~ so it must be deduced that thevalues of Cf were effectively the same oX' of little consequence.
( 13B)
( 13A)
equations (5) and (13)
C~xFf _~ s: J 81 2
C2 'X. T' (~)to
and (9) into
E-r =Jcf T = f~
substituting equations (7) (8)
JLJ11 - z.
Tan g(. ""'~ 3
we obtain on
However there is an interesting alternative. Equations (6a) and (6b)are both based on the view that the characteristic mixing length is proportionalto 1 the local height of the plume c;n the assumption that plumes (and jets)are in local equilibrium. Maczynski\7) has recently argued that this failsfor a jet injected inter a stream moving in the same direction and showed thathis resUlts were in accordance with the characteristic mixing length beingproportional to the distanCe from the scur-ce ,
If eTis wriHen as
(14)
Equating the indices in equation (9) and (14) and. using equation (1a)
We obtain
3Hence 'tan "f is proportional to J'L4 Le~ the tangent of the plume angle
varies as (J4:/U04 and this is very close to the experimental result of Jl..--O.86as given by Rankine. In accordance with this and the assumption of a uniformvelocity we obtain
1 i2.
15 =~~ (~ J>.4)1 3
It can ryadily be shown that %v'13 and (z/x) rJL4 correlate the data better thando 15 vt-2 and (z/x) Jl.}lz but in fact no pair of variables of the form 15J1.-Mand (z/x) vt1-m is satisfactory. For low values of Jl,the value of U/uo is.noticeably larger than 1 and there are insufficient data for;/L>2 to provide asatisfactory test of a simplified theory assuming U is constant. Fig. (21)shows an empirical correlation betwe.en ¢.A!?c:14 and z/x dt0 •75 • For manypractical purpesen it will be necessary only to estimate the maximum temperaturerise downwind and this is seen from Fig. (Z1) to be approximately given by
if- T. 0.14e = 2.35 g x 0 JL
Since JL0.14 varies only slightly iD~t;he range \ < J'L,< SVZTg
9 = 2.5 g x
:'" 6 -

0.048 Uoli:Jt: .95
Equation (13) would, however, lead to E:r being proportional to J'l-~1 c- ,5 insteadof the ,jl,-3 from equation (6). The above expression for (; T should give Tan -cas proportional to J't~O.98 but the temperature profiles show this is a little toolarge a dependence em Jl. A model assuming a constant plume angle and adiffusivity propor~io:~IaI to either th~ clis~anc:, from tel ?urner.or the height,ofthe plume and a veLoc.ity having the dimEmS:LOnaJ. formJ~ ::.e. 81 theT of equa b.on
(13) or the modification of it used in the Appendix is thus not entirely selfconsistent.
It is shown in the Appendix that it is possibLe from the experimental data toexpress 6T as
The ccnc.LusLon from the arguments given above wou'Ld seem to be t hat the valuesof s/t: although suffi ciently high to maka the plume bend over are not all sufficientlyhigh for it to be considered as a full;y ho:dzontal plume in the sense demanded bythe aasump td.on of a uniform horizontal and negligible horizontal diffusion.The difficulties in acoepting that the ground friotion is of oomparable importanceto the thermal instability can be partially met if the mixing length is determinedby the distance from the heat. source Lnatead 0 f the distance from the ground.•
Ref'er-ences
(1) "The Di.sper-saL of Fog from Airfield Runways" ed.,Min. of Supply. London, 1946.
Walker R. G. and Fox Do Ao
Rl\NKINE, A. O. "Experimental St;ud.:i.es in Thermal Convection" Proc , Phys,Soc. London, 1950 63 Part 5. (365A) 417.
TAYLOR, G. I. ~ see Appendix E of ref. ('I).
(2)
TAYLOR, Go L "Fire under influence. of ThermalSympo;sium on the Use of McdeLa in F:Lre Raaear-ch p.IO,786, National Academy of Science National Reaear-ch Council.
InternationalPublioation
Washington D.G o
(5) CLAUSER, F. a. "The TurbulentBounda:r;yMechanics, New York 1956, .!±cj'~51 •
Advances in Applied
(6) ROUSE HUJ\1'rER, YIH, Co S. and. IDJMPHREYS, H. «, "Gravitational Cenve ct.i.onfrom a Boundary Source" 0 Tenus (1952) 210.
(7) MACZYNSKI, J. F. J. "A round jet in an ambient co-axial stream".Mechanics (1962) 12 p.597.
J. Fluid

APPENDIX
A value for. the Effective Diffusivity
To obtain numerical values of E: T from the data we shall assume that 6 T isindependent of z, L,e. it is constant across the height of the plume at anysection.
If as an approxiwRtion D is taken as constant equal to Do equation (5)may be written from equation (1) as
(f T.) r/! + AI/ + )6 c= 0 (15i)Uox
where the dash denotes differentiation with respeot to >-. (= i)·. eT (~o) isproportional to the distance from the burner or the height of the plume; in eithercase ~ is independent of A. If A a is the value of A at which )6 is zero,
equation (14) becomes Uox. 2- "2l (~-A.o) (15ii)
)6=)60 -e: T
where Po is the value of P at i\ 'Ci Figure (15) shows that;" is a:r~ro:ximatelybetween 0,,08 and 0"10,,, Figure (22) shows Log )6 plotted against (~- Ao ) withvalues of ¢ taken from the curves of ¢ against .;1..for various z and x andAo =On09~ There are few data in the outer. region of the heated flow but theysuggest that the regime changes for ¢<0,,1!1 where all the data comprisetemperature rises of less than 2 OF" Apart from this outer region and thestratified layer near to the ground the data lie on straight linesy tlie negativeslope increasing with~~ This set of data are,shown in a different form inFig", (23) where no assumption is made regarding (\ 0 but the data are plotted interms of an estimate of )60£ Here too the lines are straight"
For simplicity we shall take the square root term in the expression for t:-Tas J ~ 1)";:J~"- instead of the forms in equations (&II) and "(6B)" This is
- f9-d.'z.7;;"
dimensionally of the same form and the difference will be partly absorbed by theconstant of proportionality~
We now write
(16)
where I = 1 if the mixing length is proportional to the height of the plume andzero i • it is proportional to the distance from the burner.
From equation (15) we have
Tan t< j (17)
From the heat balance equation (11).~~d...
ff21! = !~Uoso that from equations (16) (17) and (18)
~f,.)t-~ .:~ -e J) 31z.-U. '>l.< <./f.--
(18 )

i.e ouo;;~
The Lnver-ses o f the slopes fram Figs. ('22) and (23) are plotted in Fig. (24)against J1-- for seven chosen values ofv1 in the range I <A <s.
The line drawn through the points corresponds to
/' 0.04-$ Uo'lCC""T '" 1 95Jl' .
The dependence of t-T on utiS greater than thai; corresponding to p=:Obut differs from it by more from that cor-r-e spondf.ng to P '" 1. The aboveresult would imply that Tan ()( varies almost inversely proportionally to vLbut the correlation in Fig. (21) would be less satisfactory if 'thi.s were usedinstead ofvt-O•75. The correlation of the r-esu.l.t.s with this type of theory~s therefore not entirely consistent. The ratio. of CT to 4i.n equation (4)lS
The mlnlmum valuethan 30
2..77:/tI'QS
in these experiments is )0720.43 8.7 and elL is less
e-In the middle of the range..-(. il> 7 ft 6 in and. <JL-= 2 so that there J ""-'10.Thus except at the positions nearest the burner, at the hi.ghes t wind 7f'peed andlowest heat output the effects of thermal instability are expected to bepredominant.
c I
Nearer the burner the value of CT decr-eaaes relathe to EiI but theeffective thicknel'\S of the. plume becomes less and it becomes more appropriateto use equation 0) for tV' The value of :;.; is less than .:lc.. Tan ()( so onecan obtain the minimum value of the ratio of ~ T to ~a£\
CT;:. o.oM;) 'lnJ'QS-T 0001.9 -r-,",,-q(
V ~ C.T"6 , IfIITan ~ fro.m Fig, (15) may be taken as approximately O. -:!JI..4 so that ~ > . (tAl"'!.
" Over the range of LIt used in the experiments thi.s ratio \Tarl~ from
about 0.9 to ),4 and so near the burner it is nOl'!; possible to disregard eitherthermal instability or shear. Whether €-T depends on t. he distance. from theburner or on the height of the plume the: implicatio.n of the above is thatthermal instability becones mo.re imporitant as. ~ increases, pro.vided th'B:' f'o.rmstaken for Cv'still apply. This of course is. not sa for all ~ Beyond adistance from a finite line source where the lateral diffusion of heat and thelOBS of heat to the ground. become significantly large buoyancy per unit widthof plume is no longer cenaer-ved aa is implied by the use. of equation (18).
Acknowledgements
The author would like to thank Messrs. Naughton and Theobald foraasl stance with calculating the data in dimensionless. f'orlIt,

u,ozoI«I-zW(f)
W0:::0..W0:::
UI«22«0:::<D«o
2wI(f)
>(f)
()1.... 'o :J
.s:::. .21........0'1_; 0- ()1.... c:.- C1c:_:J a.'- 0()1 ....0.,-
0.2:J
ell U.- ii()1 c:ell ()1C1 a.()1 '- ()1~ a..... 'C1 ()1eI c:s: '-
:J'0.0()1 ()1.... c:C1 .Cl::..J
o::>
ga.III
'0cj

The maximum temperatureri se in these data is 2 deg F
in 0·1 deg F intervals
1 - 5
2-0
2-5
3'0
3'5
4-0
4-5
5·0
Wind speedft Is
xooA
•••A
Symbols.!-=1·33x-x= 3ft-ginz = 60in
0·1
0'05
~ = 0·89xJC= 3ft-ginz = 40in
0-1
0·05
..!.. = 0·667X-
x = 7ft-6inz = 60in
0·2
0-1
0·1
0-05
o 1 2 o 1 2 o 1
FIGS. 2,3 AND 4. DIMENSIONLESS TEMPERATURE RISES

1·0.--------------------------,
54
Position
0·445
3
cc =15ft-Oin z =80in
x. = 7ft-6in z =40in
X= 3ft-9in z s zorn
oX
x
Symbols
21o...-------...o!o---~---~--~
0·25
0·75
o,...l/)
FIG.5. DIMENSIONLESS TEMPERATURE RISES

O ....A.. J......_ .........I
1· 5
0·5
1 .n.
~ :: 0·333
X = 15ft-Oin z= 60in
Symbols Wind speedft I s
X 1·5
o 2'0
o 2'5
/:::,. 3·0
• 3'5• 4·0
• 4'5I. 5'0
2
FIG.5. DIMENSIONLESS TEMPERATURE RISES

1 ·5
2-02·53·0
3·54·04·55·0
+9Q
*t",•
~ = 0·222
xoo!:J.
•••A
Symbols Wind speed
z .. 20 in z:: 40in ft I s
x=7ft-6in x ..15ft Uo
t
*
1· 5
1·0
2·0
0-5
tNr-
'" 0;i 1 2 3 4 5u: .Q..
\'0.,r- FIG.7. DIMENSIONLESS TEMPERATURE RISESill::-

~= 0-178zcx= 3ft-gin z = 8 in
Symbols Wind speedft Is
2-52-0
X 1 -5
0 2-0
0 2-5
b. 3-0
• 3-5
• 4-0
• 4-5
A 5-0
1-5
o
oXXX 0
o 0o
2-
2-0
FIG. 8. DIMENSIONLESS TEMPERATURE RISES

2-5
S
2·0
321
1- 5 ...... ... .....i1o.... ..........,l
o...n.
..!.. = 0·111:x:
x= 15ft-Oin z = 20 in
Symbols Wind spC2C2dft/s
X 1 ·5
0 2·0
0 2'5
t::. 3-0
• 3·5
• 4·0
• 4-5
& 5-0
FIG.9. DIMENSIONLESS TEMPERATURE RISES

3·0..------------~----------...
2·5
2
..R.
:i = 0·089
X =7ft-6in z =8in
Symbols Wind speedft Is
X 1 - 5
0 2-0
0 2'5
fj, 3- 0
• 3·5
• 4-0
• 4-5
• 5-0
FIG.10. DIMENSIONLESS TEMPERATURE RISES

3-0r---------------------------,
2-5
2-0
o
.£.. = 0·044ocX =15ft-Oin z =8 in
Symbol s Wind speedft Is
X 1 • 5
o 2·0o 2-5
A 3· 0
• 3·5
• 4'0• 4'5A 5'0
3-02-01·01.0 0.....------....------.......------..............
FIG.11. DIMENSIONLESS TEMPERATURE RISES
rer\0

•3·0
o •
2·0
Ii)e.....\0-
2
i: = 0-0355
X = 3ft-9in z=1-6in
Symbols Wind speedft/S
X t 5
0 2-0
D 2·5
l:i 3-0
• 3-5
• 4·0
• 4·5
A 5-0
3
FIG. 12. DI MENSIONLESS TEMPERATURE RISES

3'O..-----------------------·----m
2·5
2·0
3'02-01-0
J1
1··5I-.......-----......L-....... ...I.... ......__--'
o
z = 0'018Xx =7ft-6in z =1-6in
Symbols Wind speed ft/s
X 1· 5
0 2·0
0 2·5
t::. 3-0
• 3-5
• 4·0.. 4·5.,l 5·0
FIG_ 13. DIMENSIONLESS TEMPERATURE RISES

2-5..---------------------------,
2-0
3211 -o.......------......------....,jl..-------............."o
J:.. = 0-0089zcx = 15ft- Oin z = 1-6 in
Symbols Wind sp<Zczdft I s
X 1 - 50 2'0
0 2-5
t::. 3'0
• 3·5
• 4'0
• 4·5
.A 5'0
FIG. 14. DI MENSIONLESS TEMPERATURE RISES

Dato from figuNZs 2-8,10, 12 and 13
u
2·0
1'0
0·5
0·2 0'3 0'4zx
oli
+•
1·75
2·0
2·53·0
0'5 0·6 0·7
F!C3. 15. TEMPER/\TURE PROFILES

!{5112.. FR.S72.
z-in
10 20 30 40 50
------::==r=====----,- U
_ - -- Uo = 0·55+ 0-117 L% z
04
0·2
1 2 3 4 5
FIG. 16. VELOCITY PROFILE OF UNHEATED AIR
c
N
50
40
30
, -I-IQ = 0·36 Therrn yd IhUo = 2 ft/s
. x = 7ft-6 in
20
10
0 ...... ........ .............. ...
1UUo
FIG. 17. VELOCITY PROFILE
2

If 5114- F.R. 572
x =3ft-gin z = 24 inSymbols Wind spood fils
X 1·5o 2·0o 2·5~ 3·0
• 3·5
• 4'0• 4·5J. 5·0
----------
- - - Curve from Fig. 18b.
\\\\\\\\\
\\
1·2.---------.----------------------------------------.
1·0
5432O·g....-""'L--.......--------"'""---------....--------.....--------........-....,Io
FIG. 180. LOCAL VELOCITY

.,~ .!O 00<4.~.~
.!IJ /I II
& x N
~~!O",(\\ X 0 o <l .. ... ..
II 11X N
~
I ~0 I(l 0 III
~III Q
'" '"..,
'" ..j- III
~~
On7i
•
M )0-I-
~~
~• ...J«~
'" ~0G:

1·6....-------------~----------_i
1·5
1·4
1·3
e:JI:J
1·1
1-0
0-9
0-8
x = 3ft-9in z » 10in
SymbolsWind speed
ft IsX 1 - 50 2-0
o 2-5
A 3-0
• 3'5
• 4-0
• 4-5.. 5-0 .
FIG. 190. LOCAL VELOCITY

H5r--"-----------'----------:..------,
1·4
1·3
1·2
1·0
1 4
x .7ft-5In z II 10 in
S~mbolsWind spGGd
ft/s
X 1 t!50 2-0l:I 2-5/)" 3·0
• 3-5
• 4-0
• 4·5.. 5'0
-- ....... -- -- UppGr curve from Fig. 1.9a. for x. II 3ft-9inz IB 10in
FIG.19b. LOCAL VELOCITY

1·1....-------------..,
0·8
321007 - _ ........
o
x = 15ft-Oin z =10 in
Symbols Wind sp~d ft/s
0 2-0
0 2-5
6- 3'0
• 3-5
FIG. 19c. LOCAL VELOCITY

1·5.---------------------------,
54.n..
1·2
1'0
1·4
0·8
0·9
ec = 3ft-9in z =4in
Symbols Wind sp(l(ldft Is
X 1·5
0 2·00 2·5A. 3·0
• 3·5
• 4-0
• 4-5... 5'0
(J"l
rIn--
FIG. 200. LO CAL V EL·OCITY

1·7·,.---------------------------,
1·6
1·
1·4
1·3
1·0
os
0·8
x =7ft 6in z =4in
Symbols Wind speed ft/s
X 1·5
0 2·0
0 2·5b. 3·0
• 3·5
• 4·0
• 4·5
A 5·0
543210·7....---......--------.....,j1o----.....---.............,jo
FIG.20b. LOCAL VELOCITY

1·1.--------------...
1,0-
:':)1::>o.g-
0'8'-
3I
2I
10·7 ---"""""' ........
o
X : 15ft-Oin z: 4in
Symbols Wind speed ftls
0 2·00 2·5b. 3·0
• 3·5
FIG. 20c. LOCAL VELOCITY

2·5....--------------------------,
Symbols J'l.
41 1·0X 1·5
0 1·75t::. 2·0
+ 2·5A 3·0
0C'/
0,1 0'2 0·3 0'4 0·5 0·6 0·7 008ti\ ;n0'15
c::: Xu.:~Nr-IO
FIG. 21, EMPIRICAL TEMPERATURE-- PROFILE(BASED ON FIG. 15.)

---~~
.,~
0
~~
I"~1 ..
~~
SI-e
~ - \.l
~
~~
8 !.2lL.

2·0r------------,-------------.
1'6
1·
1·2
0·6
0·4
0·2
o 0·1 0·2 0·3
Symbols ..n.• 1·0X 1·50 1·75t:. 2'0
+ 2·5.. 3'0
0·5 0·6 0·7
FIG. 23. EVALUATION OF DIFFUSIVITY

0·05,..------------------.
32J1..
1·5
0-03
0·005........---.......Il.......__....L..._-"--_............I1
FIG. 24. EFFECTIVE DIFFUSIVITIES


