© Association of Public Health Observatories Health inequalities Delivered by Alison Hill...
51
© Association of Public Health Observatories Health inequalities Delivered by Alison Hill Association of Public Health Observatories © Association of Public Health Observatories Day 1 Session 4 Non-PHO contributors (from University of Bristol): Mary Shaw Bruna Galobardes Mildred Blaxter
-
Upload
maximillian-mckinney -
Category
Documents
-
view
221 -
download
1
Transcript of © Association of Public Health Observatories Health inequalities Delivered by Alison Hill...

© Association of Public Health Observatories
Health inequalitiesDelivered by Alison Hill
Association of Public Health Observatories
© Association of Public Health Observatories
Day 1 Session 4
Non-PHO contributors (from University of Bristol):Mary Shaw Bruna GalobardesMildred Blaxter

© Association of Public Health Observatories
Learning Objectives
By the end of this session, participants should be able to:
Identify different kinds of health inequalities and understand their importance for health
Recognise the central importance of socio-economic inequalities and deprivation
Understand different ways of measuring socio-economic factors, both at individual and group (area) level
Interpret information on deprivation and health

© Association of Public Health Observatories
Overview:
What are health inequalities?
How can we measure socio-economic deprivation?
- individual level
- group (area) level

© Association of Public Health Observatories
What do we mean by ‘health inequalities’?

© Association of Public Health Observatories
What do we mean by ‘health inequalities’?
Differences between groups of people in terms of their health, including:• determinants of health (eg smoking, obesity)• experience of health and disease (including incidence and prevalence of diagnosed disease AND self-reported health / well-being)• access to health care (eg GP consultations, hospital admissions, treatment)• health outcomes (survival, mortality etc)

© Association of Public Health Observatories
“Inequality in health is the worst inequality of all. There is no more serious inequality than knowing that you’ll die sooner because you’re badly off.”
- Frank Dobson, 1997
“Tackling health inequalities is a top priority for this Government, and it is focused on narrowing the health gap between disadvantaged groups, communities and the rest of the country.”
- Department of Health, 2007

© Association of Public Health Observatories
What kinds of health inequality are there?

© Association of Public Health Observatories
What kinds of health inequality are there?
Age
Sex
Geography
Ethnicity
Disability
Socio-economic
© Association of Public Health Observatories
Inequalities in England
660
0
100
200
300
400
500
600
700
800
900
1000
1100
1998
1999
2000
2001
2002
2003
2004
2005
2006
2007
2008
/09
2009
/10
2010
/11
All-a
ge, a
ll-ca
use
mor
tlity
rate
per
100
,00
mal
es
Year
All-age, all-cause mortality rate per 100,000 males: trend 1998 to 2007 for England, Spearhead LSPs, best and worst regions, England forecast rates to 2010/11 (with 95% confidence intervals) and England PSA
target rate
England
North West
South East
Spearhead LSPs
England forecast rate
England forecast rate 95% lower CI
England forecast rate 95% upper CI
England PSA Target Rate
© Association of Public Health Observatories

© Association of Public Health Observatories

© Association of Public Health Observatories
Key concepts and measurements in health inequality (and some evidence)
PART 1: Individual level socio-economic position (SEP)
PART 2: Ecological/Area level: deprivation

© Association of Public Health Observatories
Part 1: Individual level: socio-economic position
Socio-economic position: an umbrella term for the way that people are ordered into a hierarchy based on their social and economic circumstances. Encompasses a range of concepts with different theoretical and disciplinary origins.
© Association of Public Health Observatories
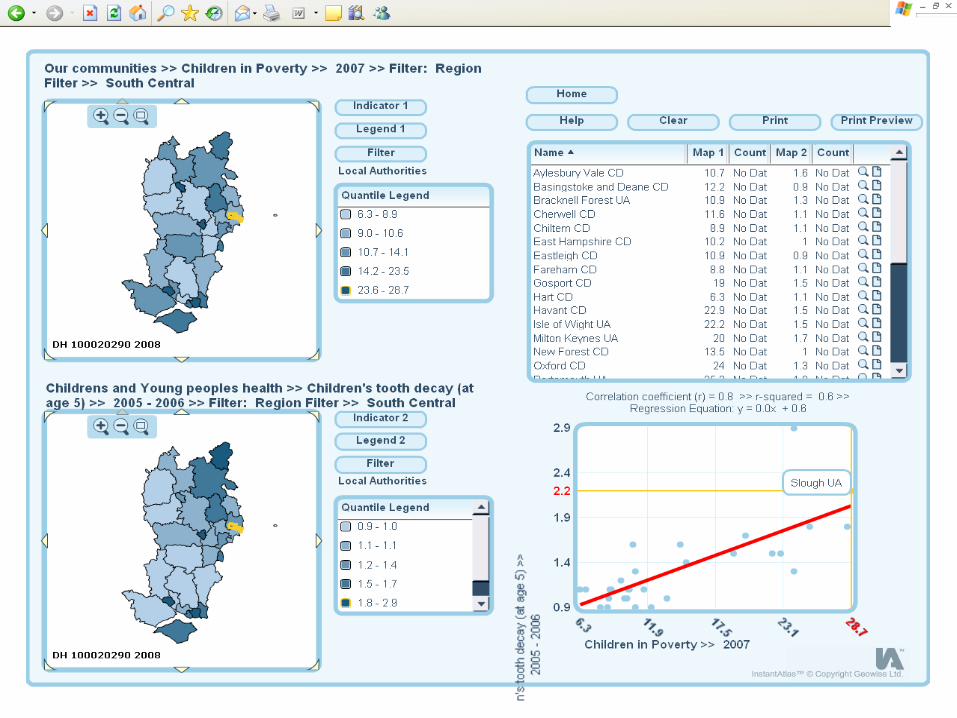
Occupation-based indicatorsthings to bear in mind
Relative position of different occupations changes over time
Differences between ethnic groups & gender in relative position of different occupations
Limited to those in paid employment
Possibility of reverse causality – downward mobility with ill-health

© Association of Public Health Observatories
Some historical evidence comparing occupations…
Age at death among different social orders, by district District Gentry and
professional Farmers and tradesman
Labourers and artisans
Rutland 52 41 38 Bath 55 37 25 Leeds 44 27 19 Bethnal Green 45 26 16 Manchester 38 20 17 Liverpool 35 22 15 Source: Chadwick (1842) cited in Macintyre (1999)
Edwin Chadwick

© Association of Public Health Observatories
Common occupation-based indicators
Registrar General’s Social Classes
– (prestige/status)
The new UK NS-SEC
– (employment relations)

© Association of Public Health Observatories
The Registrar General’s Social Classes
I Professional, e.g. lawyer, doctor, accountant
II Intermediate, e.g. teacher, nurse, manager
III-NM Skilled non-manual, e.g.typist, shop assistant
III-M Skilled manual, e.g. plumber, electrician
IV Partly skilled manual, e.g. bus driver.
V Unskilled manual e.g. cleaner, labourer
VI Armed forces

© Association of Public Health Observatories
Accidents
Cancers
DigestiveRespiratory
Genitourinary
Circulatory

© Association of Public Health Observatories
Evidence from the Acheson Report, 1998
All causes
280 300426 493 492
806
0
200
400
600
800
1000
I II IIINM IIIM IV V
Lung cancer
17 24 3454 52
82
020406080
100
I II IIINM IIIM IV V
Coronary Heart Disease
81 92136
159 156
235
050
100150200250
I II IIINM IIIM IV V
Stroke
14 1319
24 25
45
0
10
20
30
40
50
I II IIINM IIIM IV V
Source: Independent Inquiry into Inequalities in Health, 1998
Death rates per 100,000 by occupational social class, men aged 20-64, 1991-93
Death rates

© Association of Public Health Observatories
UK National Statistics
Socio-Economic Classification
(NS-SEC)
•As of 2000 this has replaced the Registrar General’s social classes for use in official
statistics and surveys.
• It is explicitly based on differences between employment conditions and relations

© Association of Public Health Observatories
National Statistics Socio-economic Classification – analytic classes
1 Higher managerial and professional
occupations
Directors and chief executives of major organisations; civil engineers; medical practitioners; IT strategy and
planning professionals; 2 Lower managerial
and professional occupations
Teachers quantity surveyors; public service administrative professionals; social workers; nurses; IT
technicians3 Intermediate
occupations medical and dental technicians Civil Service
administrative officers and local government clerical officers; counter clerks; school and company secretaries;
4 Small employers and own account
workers
Hairdressing proprietors; shopkeepers; self-employed taxi drivers;
5 Lower supervisory and technical occupations
Bakers; plumbers; electricians and motor mechanics employed by others; gardeners;
6 Semi-routine occupations
Pest control officers; clothing cutters; traffic wardens; farm workers; veterinary nurses; shelf fillers
7 Routine occupations;
Hairdressing employees; van, bus and coach drivers labourers; hotel porters; bar staff; cleaners and domestics; road sweepers; car park attendants

© Association of Public Health Observatories
Self-reported health of women aged 16-74 by NS-SEC, %, England and Wales, 2001 (Census, ONS)

© Association of Public Health Observatories
Trends in infant mortality by socio-economic groupEngland and Wales 1994-2006, three-year rolling average
note that records before 2000 have been “re-coded” into NS SEC 90 for compatibility

© Association of Public Health Observatories
OTHER MEASURES OF SOCIOECONOMIC STATUS
Education
Employment status
Income
Housing
Any others?

© Association of Public Health Observatories
Think longitudinal: life course

© Association of Public Health Observatories
Socio-economic position (summary)
There is no single best indicator of SEP
What is your aim/research question?
Is the measure equally relevant to all subgroups?
Is there a cohort effect to consider?
‘Off the shelf’ – take note of what you are using
© Association of Public Health Observatories
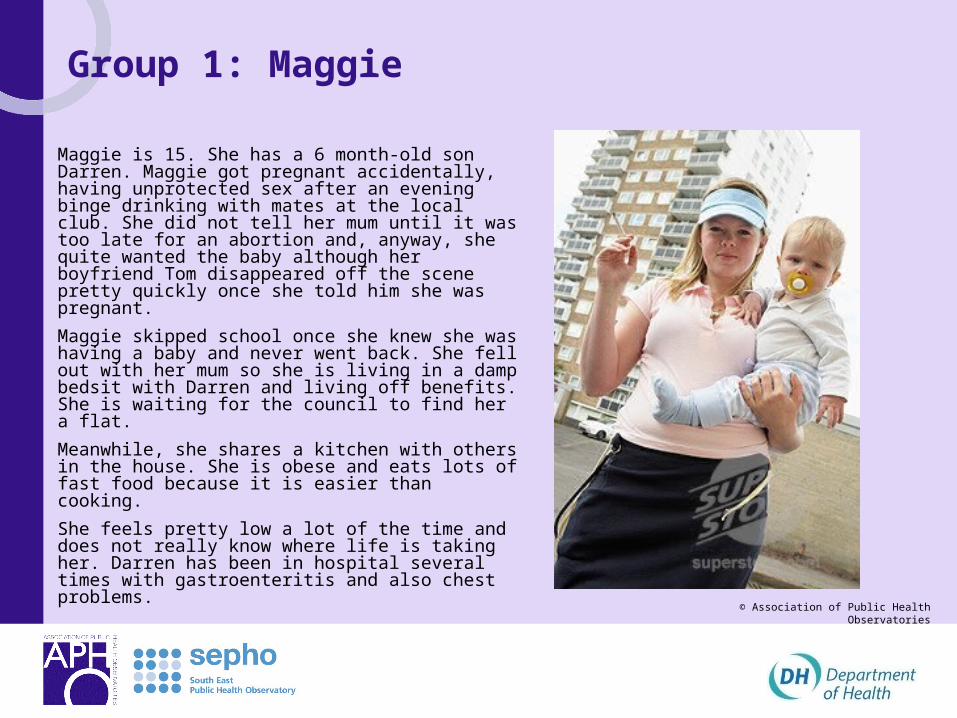
Group 1: Maggie
Maggie is 15. She has a 6 month-old son Darren. Maggie got pregnant accidentally, having unprotected sex after an evening binge drinking with mates at the local club. She did not tell her mum until it was too late for an abortion and, anyway, she quite wanted the baby although her boyfriend Tom disappeared off the scene pretty quickly once she told him she was pregnant.
Maggie skipped school once she knew she was having a baby and never went back. She fell out with her mum so she is living in a damp bedsit with Darren and living off benefits. She is waiting for the council to find her a flat.
Meanwhile, she shares a kitchen with others in the house. She is obese and eats lots of fast food because it is easier than cooking.
She feels pretty low a lot of the time and does not really know where life is taking her. Darren has been in hospital several times with gastroenteritis and also chest problems.

© Association of Public Health Observatories
Group 2: Gary
Gary is 25 years old and is currently unemployed and homeless. He is on probation following arrest for shoplifting.
He has a drugs habit and is also clinically depressed and feels he is useless. He grew up in a violent household, often witnessing his dad hitting his mum, and spent some time in care. His mother has now left his father to go back home abroad.
He left school with one GCSE and has never had a job. Last year he was in prison, not for the first time, for shoplifting—a short sentence which meant he lost his flat when his girlfriend moved away.
He sleeps rough when he does not have the money to get into the night shelter and finds it difficult to keep the appointments made for him with his care worker.

© Association of Public Health Observatories
Group 3: LucyLucy is 78. She lives in a small rural community and has managed on her own until recently, when she had a minor stroke, and walks with the aid of a stick. She is determined to carry on living in her own home, but needs a home help to get on top of the household chores.
Her neighbours are very good to her, but they go to work during the day. They do help her to get to church on Sundays and she gets visits from other churchgoers during the week.
She really enjoys the lunch club which meets twice a week in the neighbouring village and relies on the local voluntary group to come and collect her. Her GP surgery is also in the next village so if her friends are busy she has to rely on a taxi to pick her up for her appointments as there is no bus through the village any more.
The village shop closed 2 years ago because many of the people in Lucy’s village are only there at weekends, so getting fresh fruit and vegetables can be a bit of a problem.
Lucy owns her house—which is now too big for her. One of her main anxieties is that the roof is falling into disrepair—and she does not use the central heating because of the cost.
Last year she slipped on the ice and broke her wrist so she tends to stay in during the winter, which can be a bit depressing.

© Association of Public Health Observatories
Group 4: Sanjay
Sanjay is in his early 50s. His parents came to Britain in the 1950s and set up a local convenience store in South London. He was born in London.
He left school at 16 and helped in the shop until his parents retired.
Sanjay now manages the shop and also runs a small taxi business.
He is overweight and a heavy smoker. He was recently diagnosed as a type 2 diabetic.
He is having chest pain on climbing stairs.
His GP has just referred him to the local hospital and he is on the waiting list for a CABG. The GP has advised Sanjay to stop smoking but he is finding it difficult.

© Association of Public Health Observatories
Case studies: Maggie, Gary, Lucy, Sanjay
List the social and economic circumstances that could be creating adverse life experiences for these people?
What are the implications for measurement of inequalities in what you have listed?

© Association of Public Health Observatories
PART 1: Individual
measures of socio-economic position, such as social class based on occupation, are important for describing the extent of inequalities in health. They may also be used in targets and for tracking trends over time.
PART 2: Area-based (ecological)
indicators of deprivation may be used in the absence of individual level data, or in their own right, and can also tell us about areas per se (and by implication about the individuals within those areas).
They are also used for making decisions about the allocation of resources to those areas

© Association of Public Health Observatories
Beware the ecological fallacy
The Ecological Fallacy is a situation that can occur when a researcher or analyst makes an inference about an individual based on aggregate data for a group

© Association of Public Health Observatories
Sometimes we express the same measure in a different way
e.g. Unemployment
Employment status is an individual indicator
Unemployment rates are an area-level indicator
© Association of Public Health Observatories
Area level: deprivation
Deprivation: a relative and broad concept, referring to not having something that others have
“a state of …observable and demonstrable disadvantage relative to the local community or the wider society or nation to which an individual, family or group belong.” (Townsend, 1987)

© Association of Public Health Observatories
Measures of area level deprivation
There are a number of deprivation measures available
These are based mainly on Census 2001 data• Townsend Index of material deprivation• Carstairs deprivation index• Jarman UPA score
This is mainly administrative data• Index of Multiple Deprivation

© Association of Public Health Observatories
Indices of Deprivation
Third release (2007) from Department of Communities and Local Government
• A summary measure at Super Output Area (SOA) level (and others) calculated from
• 7 domains in total
• two supplementary Indices •Income Deprivation Affecting Children Index (IDACI)
• Income Deprivation Affecting Older People (IDAOPI)
•www.communities.gov.uk/communities/neighbourhoodrenewal/deprivation/deprivation07

© Association of Public Health Observatories
IMD domains

© Association of Public Health Observatories
Using IMD
Make sure you understand the constituents of each domain
Use the domain most closely associated with the aspect of deprivation you are considering

© Association of Public Health Observatories
Geodeomographics
“analysis of people by where they live” – assumes “birds of a feather flock together”
Use a combination of Census and commercial data to identify groups with similar lifestyles, eg where they shop, what papers they read
People and Places is available through Observatories
APHO technical briefing 5: Geodemographic Segmentation – in print

© Association of Public Health Observatories
Geodemographics has a long and honourable history
Maps Descriptive of London Poverty Charles Booth's Inquiry into Life and Labour in London (1886-1903)

© Association of Public Health Observatories
Two very different areas of London
http://booth.lse.ac.uk/static/a/4.html#i
Whitechapel
Fitzrovia

© Association of Public Health Observatories
Common geodemographic tools
Supplier Tool
Smallest geographical level
construction variables cost
CACI ACORN postcode Census + survey subscribe
CACI Health Acorn Output area Census + survey subscribe
Experian Mosaic UKPostcode/Household Census + survey
subscribe/free academic use
ONSOutput Area Classification OA Census free2001 area Classification SOA Census free
Beacon Dodsworth
People and Places, P2 OA Census + survey free NHS
Axicom Personix Geo postcode Census + survey subscribe

© Association of Public Health Observatories
Structure of People and PlacesTree
A Mature Oaks
B Country Orchards
C Blossoming Families
D Rooted Households
E Qualified Metropolitans
F Senior Neighbourhoods
G Suburban Stability
H New Starters
I Multicultural Centres
J Urban Producers
K Weathered Communities
L Disadvantaged Households
M Urban Challenge
U Unclassified
H22 Student In the Community
H25 Working Singles
H26 Student Life
Branch
Leaf

© Association of Public Health Observatories

© Association of Public Health Observatories
Prevalence of hospital admission for mental health
conditions North West residents 1998-2002
Increasing deprivation
NW average

© Association of Public Health Observatories
What are the limitations of geodemographic tools?
Birds of a feather don’t always flock together
Largely Census dependent
Other data largely modelled
Not suitable for monitoring trends
Geodemographics in themselves do not provide the answer.
– They are simply one of a range of tools and approaches that can be used to generate insight and health intelligence to support social marketing decisions

© Association of Public Health Observatories
Which measure to use?
•What does it measure?
•Spatial level and ecological fallacy
•How recent/frequent?
•Components – single or multiple components?
•Applicable to subgroups?
•suitable for time trends?

© Association of Public Health Observatories
Health inequalities: explanatory mechanisms Material factors
– Environment
Lifestyle factors
– Behaviour
Psychosocial factors
– Stressors
– Coping capacity

© Association of Public Health Observatories
The targets for tackling health inequalities incorporates these individual and aggregate levels:
National (PSA) target for 2010
To reduce the gap in infant mortality across social groups, and raise life expectancy in the most disadvantaged areas faster than elsewhere

© Association of Public Health Observatories
What you should know a little more about:
What are health inequalities?
Examples of past and current ways of measuring deprivation
– Individual level
– Area level
links between deprivation and health