Post-Secondary Planning Night Washington-Lee Counseling Department Presentation January 21, 2015 1.
Upload
rodger-hutchinsonCategory
view
217download
0
© Anita Lee-Post
Quality ControlPart 2
Quality ControlPart 2
ByBy
Anita Lee-PostAnita Lee-Post
ByBy
Anita Lee-PostAnita Lee-Post

© Anita Lee-Post
Statistical process control methodsStatistical process control methods
• Control charts for variables: process Control charts for variables: process characteristics are measured on a characteristics are measured on a continuous scale, e.g., weight, volume, continuous scale, e.g., weight, volume, widthwidth• Mean (X-bar) chartMean (X-bar) chart• Range (R) chartRange (R) chart
• Control charts for attributes: process Control charts for attributes: process characteristics are counted on a discrete characteristics are counted on a discrete scale, e.g., number of defects, number of scale, e.g., number of defects, number of scratchesscratches• Proportion (P) chart Proportion (P) chart • Count (C) chartCount (C) chart
• Process capability ratio and indexProcess capability ratio and index

© Anita Lee-Post
Control chartsControl charts
• Use statistical limits to identify whether Use statistical limits to identify whether a sample of data falls within a normal a sample of data falls within a normal range of variation or notrange of variation or not
• Use statistical limits to identify whether Use statistical limits to identify whether a sample of data falls within a normal a sample of data falls within a normal range of variation or notrange of variation or not
© Anita Lee-Post
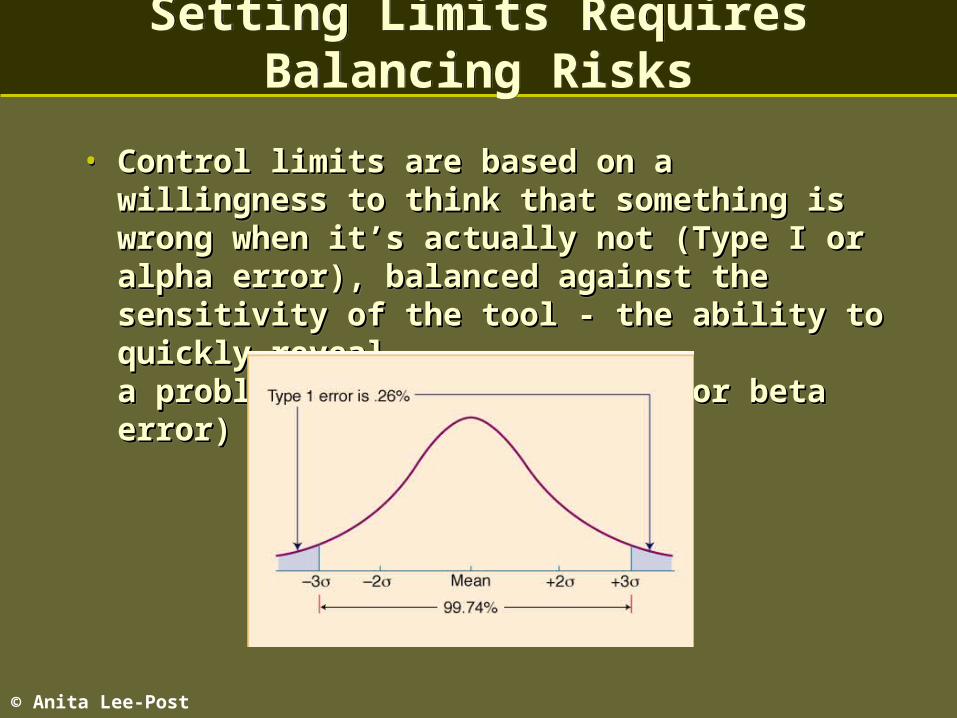
Setting Limits Requires Balancing RisksSetting Limits Requires Balancing Risks
• Control limits are based on a willingness to think Control limits are based on a willingness to think that something is wrong when it’s actually not that something is wrong when it’s actually not (Type I or alpha error), balanced against the (Type I or alpha error), balanced against the sensitivity of the tool - the ability to quickly reveal sensitivity of the tool - the ability to quickly reveal a problem (failure is Type II or beta error)a problem (failure is Type II or beta error)
• Control limits are based on a willingness to think Control limits are based on a willingness to think that something is wrong when it’s actually not that something is wrong when it’s actually not (Type I or alpha error), balanced against the (Type I or alpha error), balanced against the sensitivity of the tool - the ability to quickly reveal sensitivity of the tool - the ability to quickly reveal a problem (failure is Type II or beta error)a problem (failure is Type II or beta error)

© Anita Lee-Post
Control Charts for Variable DataControl Charts for Variable Data
• Mean (x-bar) chartsMean (x-bar) charts
• Tracks the central tendency (the average Tracks the central tendency (the average value observed) over timevalue observed) over time
• Range (R) charts:Range (R) charts:
• Tracks the spread of the distribution over Tracks the spread of the distribution over time (estimates the observed variation)time (estimates the observed variation)
© Anita Lee-Post
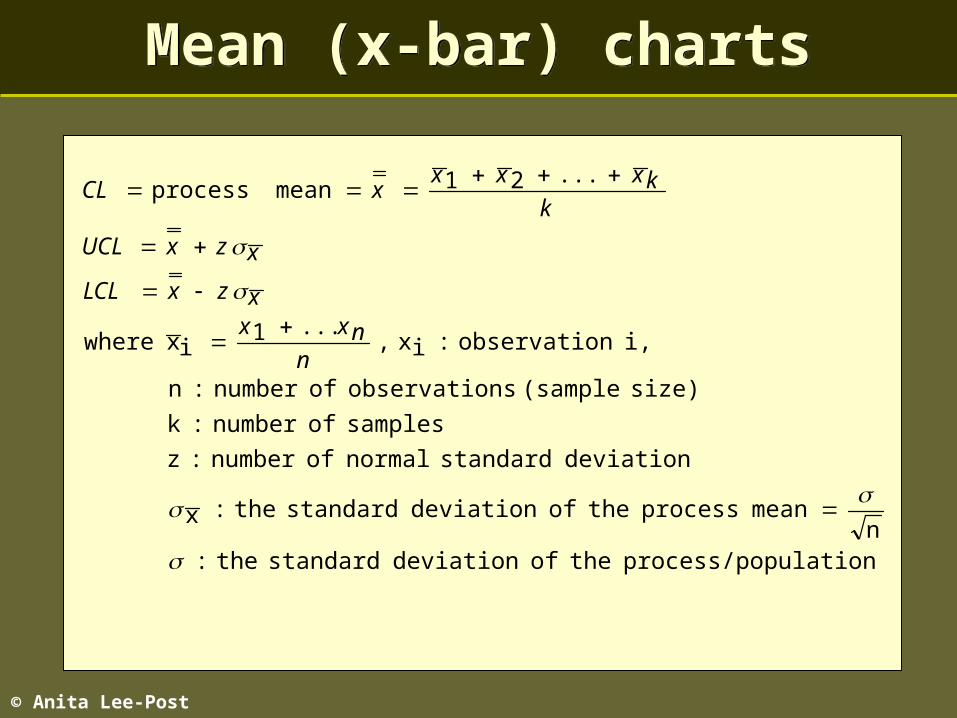
Mean (x-bar) chartsMean (x-bar) charts
pulationprocess/po the of deviation standard the : n
meanprocess the of deviation standard the :x
deviation standard normal of number :z
samples of number :k
size) (sample nsobservatio of number :n
i, nobservatio :ix ,...1
ix where
...21 meanprocess
nnxx
xzxLCL
xzxUCL
kkxxx
xCL

© Anita Lee-Post
Mean (x-bar) charts continuedMean (x-bar) charts continued
• Use the x-bar chart established to Use the x-bar chart established to monitor sample averages as the monitor sample averages as the process continues:process continues:
• Use the x-bar chart established to Use the x-bar chart established to monitor sample averages as the monitor sample averages as the process continues:process continues:

© Anita Lee-Post
An exampleAn example
The diameters of five C&A bagels are The diameters of five C&A bagels are sampled each hour during a 8-hour period. sampled each hour during a 8-hour period. The data collected are shown as follows:The data collected are shown as follows:
The diameters of five C&A bagels are The diameters of five C&A bagels are sampled each hour during a 8-hour period. sampled each hour during a 8-hour period. The data collected are shown as follows:The data collected are shown as follows:

© Anita Lee-Post
An example continuedAn example continued
a)a) Develop an x-bar chart with the control limits set Develop an x-bar chart with the control limits set to include 99.74% of the sample means and the to include 99.74% of the sample means and the standard deviation of the production process (standard deviation of the production process () ) is known to be 0.2 Inches.is known to be 0.2 Inches.
Step 1. Compute the sample mean x-bar:Step 1. Compute the sample mean x-bar:

© Anita Lee-Post
An example continuedAn example continued
Step 2. Compute the process mean or center line of Step 2. Compute the process mean or center line of the control chart:the control chart:
Step 2. Compute the process mean or center line of Step 2. Compute the process mean or center line of the control chart:the control chart:
04.48
34.32
8
03.404.408.403.401.418.494.303.4
xCL

© Anita Lee-Post
An example continuedAn example continued
Step 3. Compute the upper and lower control limits:Step 3. Compute the upper and lower control limits:
To include 99.74% of the sample means implies that the To include 99.74% of the sample means implies that the number of normal standard deviations is 3. i.e., z=3number of normal standard deviations is 3. i.e., z=3
8.35
2.0304.4
3.45
2.0304.4
xzxLCL
xzxUCL

© Anita Lee-Post
An example continuedAn example continued
b.b. C&A collects the process characteristics (i.e., C&A collects the process characteristics (i.e., diameter) of their bagels in days 2 through 10. Is diameter) of their bagels in days 2 through 10. Is the process in control?the process in control?
b.b. C&A collects the process characteristics (i.e., C&A collects the process characteristics (i.e., diameter) of their bagels in days 2 through 10. Is diameter) of their bagels in days 2 through 10. Is the process in control?the process in control?
Day 2 3 4 5 6 7 8 9 10Average of 5 observations 4.21 3.99 3.89 4.05 4.22 4.28 3.55 3.78 5.00
Diameter of Sample
The process is not in control because the means of recent sample averages fall outside the upper and lower control limits
x-bar Chart for Samples of 5 Bagels
3.50
3.75
4.00
4.25
4.50
4.75
5.00
5.25
2 3 4 5 6 7 8 9 10
Sample
Av
era
ge
Dia
me
ter
(in
in
ch
es
)
LCL = 3.83
UCL = 4.25

© Anita Lee-Post
Range (R) chartsRange (R) charts
LCL for factor chart-R the :3D
UCL for factor chart-R the :4D
i sample of nobservatio the :ix
)imin(x)i max(x i sample of range the :iR
samples of number :k
range sample the of average the :R where3
4
...21
RDLCL
RDUCLk
kRRRRCL

© Anita Lee-Post
An exampleAn example
The diameters of five C&A bagels are The diameters of five C&A bagels are sampled each hour during a 8-hour period. sampled each hour during a 8-hour period. The data collected are shown as follows:The data collected are shown as follows:
The diameters of five C&A bagels are The diameters of five C&A bagels are sampled each hour during a 8-hour period. sampled each hour during a 8-hour period. The data collected are shown as follows:The data collected are shown as follows:

© Anita Lee-Post
An example continuedAn example continued
a)a) Develop a range chart.Develop a range chart.
Step 1. Compute the average range or CL:Step 1. Compute the average range or CL:
a)a) Develop a range chart.Develop a range chart.
Step 1. Compute the average range or CL:Step 1. Compute the average range or CL:
0.27 8
13.021.013.021.012.007.110.018.0
RCL

© Anita Lee-Post
An example continuedAn example continued
Step 2. Compute the upper and lower control limits:Step 2. Compute the upper and lower control limits:Step 2. Compute the upper and lower control limits:Step 2. Compute the upper and lower control limits:
Control Limit Factors for Range Charts
Sample size, n D3 D4
2 0.00 3.27
3 0.00 2.57
4 0.00 2.28
5 0.00 2.11
6 0.00 2.00
7 0.08 1.92
8 0.14 1.86
0
27.00
57.0
27.011.2
3
4
RDLCL
RDUCL

© Anita Lee-Post
An example continuedAn example continued
b.b. C&A collects the process characteristics (i.e., diameter) C&A collects the process characteristics (i.e., diameter) of their bagels in days 2 through 10. Is the process in of their bagels in days 2 through 10. Is the process in control?control?
b.b. C&A collects the process characteristics (i.e., diameter) C&A collects the process characteristics (i.e., diameter) of their bagels in days 2 through 10. Is the process in of their bagels in days 2 through 10. Is the process in control?control?
Day 2 3 4 5 6 7 8 9 10Range of 5 observations 0.30 0.20 0.33 0.20 0.14 0.11 0.05 0.35 0.20
Diameter of Sample
The process is in control because the ranges of recent samples fall within the upper and lower control limits
Range Chart for Samples of 5 Bagels
0.00
0.10
0.20
0.30
0.40
0.50
0.60
2 3 4 5 6 7 8 9 10
Sample
Ran
ge
UCL = 0.57
LCL = 0
CL = 0.27

© Anita Lee-Post
Using both mean & range chartsUsing both mean & range charts
• Mean (x-bar) chart: measures the central tendency Mean (x-bar) chart: measures the central tendency of a processof a process
• Range (R) chart: measures the variance of a Range (R) chart: measures the variance of a processprocess
Case 1: a process showing a drift in its mean but Case 1: a process showing a drift in its mean but not its variance not its variance
can be detected only by a mean (x-bar) chartcan be detected only by a mean (x-bar) chart

© Anita Lee-Post
Using both mean & range charts continuedUsing both mean & range charts continued
Case 2: a process showing a change in its variance Case 2: a process showing a change in its variance but not its mean but not its mean
can be detected only by a range (R) chartcan be detected only by a range (R) chart
Case 2: a process showing a change in its variance Case 2: a process showing a change in its variance but not its mean but not its mean
can be detected only by a range (R) chartcan be detected only by a range (R) chart

© Anita Lee-Post
Construct x-bar chart from sample rangeConstruct x-bar chart from sample range
chart bar-x for factor limit Control :2A
samples of number :k
i sample for nobservatio :ix
)min()i max(x:iR
...21RR
2
2
...1
ixk
kRRwhere
RAxLCL
RAxUCL
kkxx
xCL
© Anita Lee-Post
Control Charts for AttributesControl Charts for Attributes
• p-Charts:p-Charts:
• Track the proportion defective in a Track the proportion defective in a samplesample
• c-Charts:c-Charts:
• Track the average number of defects per Track the average number of defects per unit of outputunit of output

© Anita Lee-Post
Proportion (p) chartsProportion (p) charts
• Data requirements:Data requirements:• Sample size Sample size • Number of defectsNumber of defects• Sample size is large enough so that the Sample size is large enough so that the
attributes will be counted twice in each attributes will be counted twice in each sample, e.g., a defect rate of 1% will sample, e.g., a defect rate of 1% will require a sample size of 200 units.require a sample size of 200 units.

© Anita Lee-Post
Proportion (p) charts continuedProportion (p) charts continued
size sample :n
)1(
deviation standard sample the
deviation standard normal ofnumber :z where
size Sample samples ofNumber
samples all from defects ofNumber Total
p
n
pp
zpLCL
zpUCL
pCL
p
p

© Anita Lee-Post
Count (c) chartsCount (c) charts
• Data requirementsData requirements
• Number of defectsNumber of defects• Monitoring processes in which the items Monitoring processes in which the items
of interest (in this case, defects) are of interest (in this case, defects) are infrequent and/or occur in time or space, infrequent and/or occur in time or space, e.g., errors in newspaper, bad circuits in e.g., errors in newspaper, bad circuits in a microchip, complaints from customers.a microchip, complaints from customers.

© Anita Lee-Post
Count (c) charts continuedCount (c) charts continued
deviation standardof number :z where
cz c LCL
cz c UCL
/unitsdays/weeks of number :n where,n
x
defects of number average cCLn
1ii