$ and Crystallization 7KLV Fundamentals of Gas-Induced ... · The Nature of Methylamine-MAPbI3...
11
The Nature of Methylamine-MAPbI 3 Complex: Fundamentals of Gas-Induced Perovskite Liquefaction and Crystallization Dmitry Bogachuk 1,2 , Lukas Wagner 1,2 , Simone Mastroianni 1,3 , Michael Daub 4 , Harald Hillebrecht 3,4 and Andreas Hinsch 1* 1 Fraunhofer Institute for Solar Energy Systems ISE, Freiburg, 79110, Germany 2 Laboratory for Photovoltaic Energy Conversion, Albert-Ludwigs-Universität Freiburg, Freiburg, 79110, Germany 3 Materials Research Center FMF, Albert-Ludwigs-Universität Freiburg, 79104 Freiburg, Germany 4 Institute for Inorganic and Analytic Chemistry, Albert-Ludwigs-Universität Freiburg, 79104 Freiburg, Germany Electronic Supplementary Material (ESI) for Journal of Materials Chemistry A. This journal is © The Royal Society of Chemistry 2020
Transcript of $ and Crystallization 7KLV Fundamentals of Gas-Induced ... · The Nature of Methylamine-MAPbI3...

The Nature of Methylamine-MAPbI3 Complex Fundamentals of Gas-Induced Perovskite Liquefaction and Crystallization Dmitry Bogachuk12 Lukas Wagner12 Simone Mastroianni13 Michael Daub4 Harald Hillebrecht34 and Andreas Hinsch1
1 Fraunhofer Institute for Solar Energy Systems ISE Freiburg 79110 Germany 2 Laboratory for Photovoltaic Energy Conversion Albert-Ludwigs-Universitaumlt Freiburg Freiburg 79110 Germany3 Materials Research Center FMF Albert-Ludwigs-Universitaumlt Freiburg 79104 Freiburg Germany4 Institute for Inorganic and Analytic Chemistry Albert-Ludwigs-Universitaumlt Freiburg 79104 Freiburg Germany
Electronic Supplementary Material (ESI) for Journal of Materials Chemistry AThis journal is copy The Royal Society of Chemistry 2020
Figure S1 Visualized representation of building units [Pb2I9]5- and [CH3NH3CH3NH2]+ in (CH3NH3)5(CH3NH2)2Pb2I9 based on the obtained XRD data
Table S1 Crystallographic data of (CH3NH3)5(CH3NH2)2Pb2I9 Pb(CH3NH2)4I2 and Pb(CH3NH2)6I2 estimated standard deviations in parentheses
Compound (CH3NH3)5(CH3NH2)2Pb2I9 Pb(CH3NH2)4I2 Pb(CH3NH2)6I2
Temperature 100 KCrystal system monoclinic monoclinic cubicSpace group P 21c P 21c Fm3mUnit cell in [Aring] a = 137676(14) a = 85684(2) a = 10487(7)
b = 148730(14) b = 126121(3)c = 190855(19) c = 133607(3)β = 110585(4)deg β = 98877(1)deg
Z = 4 Z = 4 Z = 4dcalc 3233 gcm3 2725 gcm3 2208 gcm3
RadiationData collection
Mo-Kα microsourceBruker APEX II CCD
2Θ max 60deg 874deg 60degndash19 lt h lt 0 ndash16 lt h lt 16 ndash17 lt h lt 17ndash15 lt k lt 11 ndash24 lt k lt 24 ndash17 lt k lt 17ndash14 lt l lt 22 ndash25 lt l lt 25 ndash17 lt l lt 17
μ 1680 mmndash1 1612 mmndash1 1183 mmndash1
Absorption correction
multiscan program SADABS[1]
Rint Rsigma 0024 0044 0 062 0039 0085 0021Refinement SHELXTL[2]
N(hkl) meas unique
6651 4470 89003 10940 7344 187
Nrsquo(hkl) ( I gt 2σ(I))
3751 8601 179
Parameters refined
171 104 8
R-values R1(F) = 0052 wR2(F2)= 0138
R1(F) = 0029 wR2(F2)= 0050
R1 = 0065 wR2(F2) = 0175
all data R1 = 0062 R1 = 0048 R1 = 0067Weighting scheme[2]
00104 358 00127 22762 008 200
Extinction correction[2]
000024(4) minus 00014(5)
Goodness of fit 0939 1026 1287Residual electron density (max min sigma)
377 ndash 272 029 endashAring3 187 ndash 265 026 endashAring3 282 ndash 231 039 endashAring3
at 100 K the crystal shows multiple twinning with a close relation to a cubic parent structure As a result the profiles were split For each reflection up to eight maxima were observed with more or less overlapping It was impossible to assign individual orientation matrices in order to describe the diffraction pattern as a sum of separated twin domains Because no super structure reflections were observed the data set was integrated assuming an F-centred unit cell with a asymp 105 Aring and merged in Laue class m3m [1] G M Sheldrick Program SAINT Bruker Analytical X-ray Systems Madison Wisconsin USA 2006 Program SADABS University of Goumlttingen Germany 1996[2] G M Sheldrick SHELXTL Crystallographic System Bruker AXS Analytical Xndashray Instruments Inc Madison 2013
Figure S2 Complete Raman spectrum with identification of band regions The inset shows the gradual band shift during the crystallization in the low-wavenumber region
Figure S3 The process of MA0xMAPbI3 complex formation in a closed vial (a) initial MAPbI3 powder (b) viscous MA0xMAPbI3 (c)
MA0xMAPbI3 diluted in ACN
(a) (b) (c)
0 500 1000 1500 2000 2500 3000 350000
01
02
03
04
05
06
07
08
09
10
NH3 CH3 strecthing modes
84 104
94 101
78
3013 32
3831
49 3280
296029
4429
1428
9228
14
1421 14
70
1190
1583
1030
990
961
911
290
242
CH3NH3+ vibrations
under MA atm (3 bar) 3 min opened in ambient atm 15 min opened in ambient atm 25 min opened in ambient atm 55 min opened in ambient atm 125 min opened in ambient atm heating MAPbI3 (ref)
Nor
mal
ized
Inte
nsity
Raman shift (cm-1)
Pb-I framework
70 75 80 85 90 95 100 105 110 115
084
088
092
096
100
82
A transparent FTO-plate connected to a power supply was placed on the bottom side of the transparent chamber with ZrO2 and Graphite layers filled with perovskite in it The real-time PL measurement starts once the chamber is turned and the PL originating from the radiative charge carrier recombination is detected by camera Immediately methylamine gas is supplied causing a liquefaction of MAPbI3 and loss of photoluminescence After a small outlet is opened methylamine gas starts to leave the liquefied complex reforming the perovskite structure Furthermore the supplied electrical current flowing through the FTO-plate is dissipated through heat thus acting as a transparent annealing hotplate for the perovskite in the ZrO2Graphite layers with T = 70degC
Figure S4 Schematic representation of the setup during the real-time PL measurement of the liquefaction and recrystallization
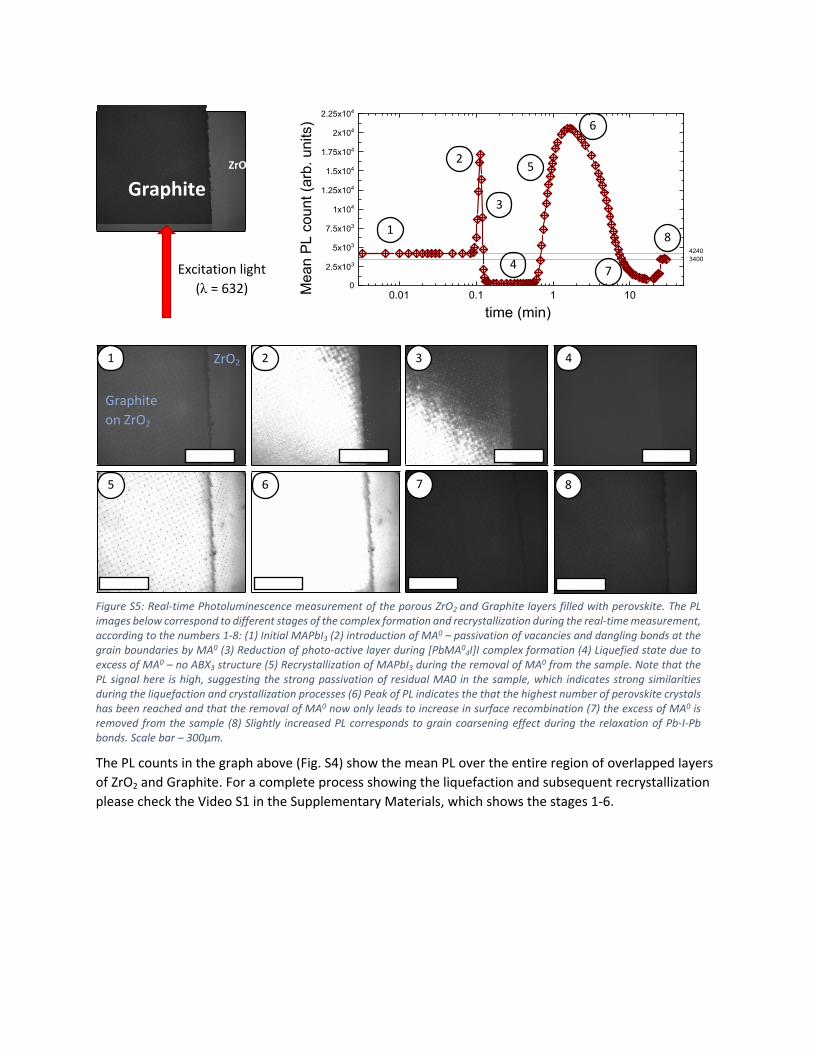
The PL counts in the graph above (Fig S4) show the mean PL over the entire region of overlapped layers of ZrO2 and Graphite For a complete process showing the liquefaction and subsequent recrystallization please check the Video S1 in the Supplementary Materials which shows the stages 1-6
Figure S5 Real-time Photoluminescence measurement of the porous ZrO2 and Graphite layers filled with perovskite The PL images below correspond to different stages of the complex formation and recrystallization during the real-time measurement according to the numbers 1-8 (1) Initial MAPbI3 (2) introduction of MA0 ndash passivation of vacancies and dangling bonds at the grain boundaries by MA0 (3) Reduction of photo-active layer during [PbMA0
4I]I complex formation (4) Liquefied state due to excess of MA0 ndash no ABX3 structure (5) Recrystallization of MAPbI3 during the removal of MA0 from the sample Note that the PL signal here is high suggesting the strong passivation of residual MA0 in the sample which indicates strong similarities during the liquefaction and crystallization processes (6) Peak of PL indicates the that the highest number of perovskite crystals has been reached and that the removal of MA0 now only leads to increase in surface recombination (7) the excess of MA0 is removed from the sample (8) Slightly increased PL corresponds to grain coarsening effect during the relaxation of Pb-I-Pb bonds Scale bar ndash 300microm
GraphiteZrO2
Excitation light (λ = 632)
1 2 3 4
5 6 7 8
1
2
3
4
5
6
7
8
001 01 1 100
25x103
5x10³
75x103
1x10⁴
125x104
15x104
175x104
2x10⁴
225x104
Mea
n PL
cou
nt (a
rb u
nits
)time (min)
42403400
Graphite on ZrO2
ZrO2
The evaluation of amount of methylamine gas per mole of perovskite (xMA0) has been done using a non-ideal gas (van der Waals equation of state) equation using a correction accounting for volume occupied by gas molecules and intermolecular forces 1
[119875 + 119886(119899119881)2](119881 ‒ 119899119887) = 119899119877119879
Where P ndash gas pressure (which is measured using a gauge) n ndash moles of MA0 gas V ndash volume occupied by the gas R ndash Gas constant (83144610-2 LbarK-1mol-1) T is temperature a is a correction factor for the intermolecular forces and b is for adjustment due to volume occupied by the gas particles The values for a and b were found in the reference source2
The system of gas supply is presented in FigS7a-b The methylamine was firstly supplied to the glass column where the flow was controlled by valves as depicted on Figure 41 For filling valves 12 and 4 have to be open and valve 3 should be set in such position to block the gas flow to the exhaust When the column is filled it has to be disconnected from the system which means that the valves 124 are closed and the valve 3 is set into position where all the pipes are connected together in order to allow the leftover Methylamine in the pipes to be removed The gas flow during the process of filling the column with methylamine and removing the methylamine from the pipes is depicted with green and purple arrows respectively Later the column was transported to the location where cell filling takes place Then the glass column was connected to vial with perovskite powder supplying MA to the vial as it is shown in Figure 42 The final solution was produced by exposing perovskite to MA gas in a 15 mL vial in addition to Acetonitrile as an agent to reduce viscosity of solution
Figure S6 (a) Illustration of the station used to fill the gas column (a buffer later used for supplying MA to perovskite in (b)) The arrows indicate the gas flow of filling process and then the process of releasing MA in the pipes to the exhaust Illustration of melting the perovskite process to create solution for filling the cells (b)
In such method we were able to produce solution with various and controllable xMA0 The values are presented in a table below
Table S2 Evaluated amount of supplied MA0 gas to the perovskite powder in planar and mesoporous layers
In planar films In the mesoporous layersPerovskite mass (mg) x ndash mol(MA0)mol(PVSK) Perovskite mass (mg) x ndash mol(MA0)mol(PVSK)
352 115 469 862816 144 364 1112112 192 274 148
2226 182
(a) (b)
115 144 182000
005
010
015
020
025
030
MA0perovskite ratio (x)
Late
ral C
ryst
al A
rea
(microm
2 )
x = 115 x = 144 x = 182
Figure S7 Crystal size distribution obtained by analyzing SEM images of the perovskite films with various MA0perovskite ratios using ImageJ software The crystals were isolated by applying FFT filter adjusting the threshold noise correction and using embedded particle analysis plug-in The black boxes denote the mean value of lateral crystal area which increases with higher MA0perovskite ratio in the complex
Figure S8 PL images of absorber layers crystallized from solutions with various concentrations of MA0 inside mesoporous ZrO2 layers (a-d) The white scale bar represents 300 microm
00 50x103 10x104 15x104 20x1040
1x10⁵
2x10⁵
3x10⁵
4x10⁵
5x10⁵
Num
ber o
f pix
els
PL counts
x=86 x=111 x=148 x=182
Figure S9 PL counts distribution from the PL images shown in Fig 5
To quantify the homogeneity (h) of the PL image we propose to use the following relationship
ℎ =119899119898119886119909
120593119898119886119909
int120593119898119894119899
119899(120593) 119889120593
Where the nmax describing the number of pixels with the most frequently occurring local PL intensity is divided by the integrated area under the distribution curve of PL signals (here denoted as φ) which can be found in Figure S9
0 200 400 600 800 1000
001
01
1
PL c
ount
s (n
orm
)
time (ns)
x = 86 x = 111 x = 148 x = 182
References(1) Silbey R J Alberty R A Bawendi M G Physical chemistry 4th edition Princeton NJ 2004
Figure S10 Time-resolved photoluminescence on the perovskite in porous ZrO2 layers (ie without a quencher) produced using different x in the MAPbI3xMA0
Figure S11 I-V parameters of the graphite-based perovskite solar cells produced using an optimal xMA0 showing a high Voc (a) G-PSC structure with a corresponding band diagram (b) Note that even without hole-transport material some cells have Voc above 1V suggesting that low number of charge carriers recombine non-radiatively
0
4
8
12
16
20
24
06
07
08
09
10
11
30
40
50
60
70
80
0
4
8
12
J sc (
mA
cm2)
V oc (
V)
FF (
)
PCE
()
(a) (b)
(2) Chemistry Libretexts van der Waals constants for real gases httpschemlibretextsorg (accessed November 25 2019)

Figure S1 Visualized representation of building units [Pb2I9]5- and [CH3NH3CH3NH2]+ in (CH3NH3)5(CH3NH2)2Pb2I9 based on the obtained XRD data
Table S1 Crystallographic data of (CH3NH3)5(CH3NH2)2Pb2I9 Pb(CH3NH2)4I2 and Pb(CH3NH2)6I2 estimated standard deviations in parentheses
Compound (CH3NH3)5(CH3NH2)2Pb2I9 Pb(CH3NH2)4I2 Pb(CH3NH2)6I2
Temperature 100 KCrystal system monoclinic monoclinic cubicSpace group P 21c P 21c Fm3mUnit cell in [Aring] a = 137676(14) a = 85684(2) a = 10487(7)
b = 148730(14) b = 126121(3)c = 190855(19) c = 133607(3)β = 110585(4)deg β = 98877(1)deg
Z = 4 Z = 4 Z = 4dcalc 3233 gcm3 2725 gcm3 2208 gcm3
RadiationData collection
Mo-Kα microsourceBruker APEX II CCD
2Θ max 60deg 874deg 60degndash19 lt h lt 0 ndash16 lt h lt 16 ndash17 lt h lt 17ndash15 lt k lt 11 ndash24 lt k lt 24 ndash17 lt k lt 17ndash14 lt l lt 22 ndash25 lt l lt 25 ndash17 lt l lt 17
μ 1680 mmndash1 1612 mmndash1 1183 mmndash1
Absorption correction
multiscan program SADABS[1]
Rint Rsigma 0024 0044 0 062 0039 0085 0021Refinement SHELXTL[2]
N(hkl) meas unique
6651 4470 89003 10940 7344 187
Nrsquo(hkl) ( I gt 2σ(I))
3751 8601 179
Parameters refined
171 104 8
R-values R1(F) = 0052 wR2(F2)= 0138
R1(F) = 0029 wR2(F2)= 0050
R1 = 0065 wR2(F2) = 0175
all data R1 = 0062 R1 = 0048 R1 = 0067Weighting scheme[2]
00104 358 00127 22762 008 200
Extinction correction[2]
000024(4) minus 00014(5)
Goodness of fit 0939 1026 1287Residual electron density (max min sigma)
377 ndash 272 029 endashAring3 187 ndash 265 026 endashAring3 282 ndash 231 039 endashAring3
at 100 K the crystal shows multiple twinning with a close relation to a cubic parent structure As a result the profiles were split For each reflection up to eight maxima were observed with more or less overlapping It was impossible to assign individual orientation matrices in order to describe the diffraction pattern as a sum of separated twin domains Because no super structure reflections were observed the data set was integrated assuming an F-centred unit cell with a asymp 105 Aring and merged in Laue class m3m [1] G M Sheldrick Program SAINT Bruker Analytical X-ray Systems Madison Wisconsin USA 2006 Program SADABS University of Goumlttingen Germany 1996[2] G M Sheldrick SHELXTL Crystallographic System Bruker AXS Analytical Xndashray Instruments Inc Madison 2013
Figure S2 Complete Raman spectrum with identification of band regions The inset shows the gradual band shift during the crystallization in the low-wavenumber region
Figure S3 The process of MA0xMAPbI3 complex formation in a closed vial (a) initial MAPbI3 powder (b) viscous MA0xMAPbI3 (c)
MA0xMAPbI3 diluted in ACN
(a) (b) (c)
0 500 1000 1500 2000 2500 3000 350000
01
02
03
04
05
06
07
08
09
10
NH3 CH3 strecthing modes
84 104
94 101
78
3013 32
3831
49 3280
296029
4429
1428
9228
14
1421 14
70
1190
1583
1030
990
961
911
290
242
CH3NH3+ vibrations
under MA atm (3 bar) 3 min opened in ambient atm 15 min opened in ambient atm 25 min opened in ambient atm 55 min opened in ambient atm 125 min opened in ambient atm heating MAPbI3 (ref)
Nor
mal
ized
Inte
nsity
Raman shift (cm-1)
Pb-I framework
70 75 80 85 90 95 100 105 110 115
084
088
092
096
100
82
A transparent FTO-plate connected to a power supply was placed on the bottom side of the transparent chamber with ZrO2 and Graphite layers filled with perovskite in it The real-time PL measurement starts once the chamber is turned and the PL originating from the radiative charge carrier recombination is detected by camera Immediately methylamine gas is supplied causing a liquefaction of MAPbI3 and loss of photoluminescence After a small outlet is opened methylamine gas starts to leave the liquefied complex reforming the perovskite structure Furthermore the supplied electrical current flowing through the FTO-plate is dissipated through heat thus acting as a transparent annealing hotplate for the perovskite in the ZrO2Graphite layers with T = 70degC
Figure S4 Schematic representation of the setup during the real-time PL measurement of the liquefaction and recrystallization
The PL counts in the graph above (Fig S4) show the mean PL over the entire region of overlapped layers of ZrO2 and Graphite For a complete process showing the liquefaction and subsequent recrystallization please check the Video S1 in the Supplementary Materials which shows the stages 1-6
Figure S5 Real-time Photoluminescence measurement of the porous ZrO2 and Graphite layers filled with perovskite The PL images below correspond to different stages of the complex formation and recrystallization during the real-time measurement according to the numbers 1-8 (1) Initial MAPbI3 (2) introduction of MA0 ndash passivation of vacancies and dangling bonds at the grain boundaries by MA0 (3) Reduction of photo-active layer during [PbMA0
4I]I complex formation (4) Liquefied state due to excess of MA0 ndash no ABX3 structure (5) Recrystallization of MAPbI3 during the removal of MA0 from the sample Note that the PL signal here is high suggesting the strong passivation of residual MA0 in the sample which indicates strong similarities during the liquefaction and crystallization processes (6) Peak of PL indicates the that the highest number of perovskite crystals has been reached and that the removal of MA0 now only leads to increase in surface recombination (7) the excess of MA0 is removed from the sample (8) Slightly increased PL corresponds to grain coarsening effect during the relaxation of Pb-I-Pb bonds Scale bar ndash 300microm
GraphiteZrO2
Excitation light (λ = 632)
1 2 3 4
5 6 7 8
1
2
3
4
5
6
7
8
001 01 1 100
25x103
5x10³
75x103
1x10⁴
125x104
15x104
175x104
2x10⁴
225x104
Mea
n PL
cou
nt (a
rb u
nits
)time (min)
42403400
Graphite on ZrO2
ZrO2
The evaluation of amount of methylamine gas per mole of perovskite (xMA0) has been done using a non-ideal gas (van der Waals equation of state) equation using a correction accounting for volume occupied by gas molecules and intermolecular forces 1
[119875 + 119886(119899119881)2](119881 ‒ 119899119887) = 119899119877119879
Where P ndash gas pressure (which is measured using a gauge) n ndash moles of MA0 gas V ndash volume occupied by the gas R ndash Gas constant (83144610-2 LbarK-1mol-1) T is temperature a is a correction factor for the intermolecular forces and b is for adjustment due to volume occupied by the gas particles The values for a and b were found in the reference source2
The system of gas supply is presented in FigS7a-b The methylamine was firstly supplied to the glass column where the flow was controlled by valves as depicted on Figure 41 For filling valves 12 and 4 have to be open and valve 3 should be set in such position to block the gas flow to the exhaust When the column is filled it has to be disconnected from the system which means that the valves 124 are closed and the valve 3 is set into position where all the pipes are connected together in order to allow the leftover Methylamine in the pipes to be removed The gas flow during the process of filling the column with methylamine and removing the methylamine from the pipes is depicted with green and purple arrows respectively Later the column was transported to the location where cell filling takes place Then the glass column was connected to vial with perovskite powder supplying MA to the vial as it is shown in Figure 42 The final solution was produced by exposing perovskite to MA gas in a 15 mL vial in addition to Acetonitrile as an agent to reduce viscosity of solution
Figure S6 (a) Illustration of the station used to fill the gas column (a buffer later used for supplying MA to perovskite in (b)) The arrows indicate the gas flow of filling process and then the process of releasing MA in the pipes to the exhaust Illustration of melting the perovskite process to create solution for filling the cells (b)
In such method we were able to produce solution with various and controllable xMA0 The values are presented in a table below
Table S2 Evaluated amount of supplied MA0 gas to the perovskite powder in planar and mesoporous layers
In planar films In the mesoporous layersPerovskite mass (mg) x ndash mol(MA0)mol(PVSK) Perovskite mass (mg) x ndash mol(MA0)mol(PVSK)
352 115 469 862816 144 364 1112112 192 274 148
2226 182
(a) (b)
115 144 182000
005
010
015
020
025
030
MA0perovskite ratio (x)
Late
ral C
ryst
al A
rea
(microm
2 )
x = 115 x = 144 x = 182
Figure S7 Crystal size distribution obtained by analyzing SEM images of the perovskite films with various MA0perovskite ratios using ImageJ software The crystals were isolated by applying FFT filter adjusting the threshold noise correction and using embedded particle analysis plug-in The black boxes denote the mean value of lateral crystal area which increases with higher MA0perovskite ratio in the complex
Figure S8 PL images of absorber layers crystallized from solutions with various concentrations of MA0 inside mesoporous ZrO2 layers (a-d) The white scale bar represents 300 microm
00 50x103 10x104 15x104 20x1040
1x10⁵
2x10⁵
3x10⁵
4x10⁵
5x10⁵
Num
ber o
f pix
els
PL counts
x=86 x=111 x=148 x=182
Figure S9 PL counts distribution from the PL images shown in Fig 5
To quantify the homogeneity (h) of the PL image we propose to use the following relationship
ℎ =119899119898119886119909
120593119898119886119909
int120593119898119894119899
119899(120593) 119889120593
Where the nmax describing the number of pixels with the most frequently occurring local PL intensity is divided by the integrated area under the distribution curve of PL signals (here denoted as φ) which can be found in Figure S9
0 200 400 600 800 1000
001
01
1
PL c
ount
s (n
orm
)
time (ns)
x = 86 x = 111 x = 148 x = 182
References(1) Silbey R J Alberty R A Bawendi M G Physical chemistry 4th edition Princeton NJ 2004
Figure S10 Time-resolved photoluminescence on the perovskite in porous ZrO2 layers (ie without a quencher) produced using different x in the MAPbI3xMA0
Figure S11 I-V parameters of the graphite-based perovskite solar cells produced using an optimal xMA0 showing a high Voc (a) G-PSC structure with a corresponding band diagram (b) Note that even without hole-transport material some cells have Voc above 1V suggesting that low number of charge carriers recombine non-radiatively
0
4
8
12
16
20
24
06
07
08
09
10
11
30
40
50
60
70
80
0
4
8
12
J sc (
mA
cm2)
V oc (
V)
FF (
)
PCE
()
(a) (b)
(2) Chemistry Libretexts van der Waals constants for real gases httpschemlibretextsorg (accessed November 25 2019)

(2) Chemistry Libretexts van der Waals constants for real gases httpschemlibretextsorg (accessed November 25 2019)