NTI · along with XLR and phono audio connectors. The Minirator is no-table for its connector that...
7
The MR1 generator, or Minirator, and the ML1 analyser, or Minilyzer, are handheld. They’re completely autonomous, using LR6 1.5 V bat- teries, which are widely available. A built-in pocket clip is included along with XLR and phono audio connectors. The Minirator is no- table for its connector that folds out, like something you’d find on a Swiss army knife. knife. Â The MR1 source The Minirator audio generator works in the 20 Hz to 20 kHz frequency range. It generates sinusoidal si- gnals and square waves, white noi- se, pink noise and a special signal used for speaker phase testing. Thus it offers an entire range of si- gnals that are perfectly adapted to audio testing. Signal amplitude va- ries between a mic level and a stu- dio line level, i.e., between –76 dBu (a weak level, corresponding to about 130 μV) and + 6 dBu, or about 1.6 V. Everything is controlled via buttons and LCD displays. You can even change the units—the level changes automatically to match the reading. + 6 dBu doesn’t correspond exact- ly to 1.6 V! The sinusoidal signal is pure. The distortion rate is very low: NTI says it’s less than 0.025% at maximum output level. This rate rises at low le- vels, primarily as a result of back- ground noise, since according to NTI the rate of distortion + noise is less than 0.18%. Digital signal generation is linked to a discrete variation in frequen- cy. The MR1 generates the 31 ISO frequencies (or close) with third- octave distribution. The square waves also benefit from the same frequency series, but li- mited to 5 kHz. In effect, audio di- gital generation limits the spectrum to 20 kHz. For our signal, only the third harmonic, at 15 kHz, will be distributed; the others fall outside the passband. The rise time here is li- mited to a twentieth of a microse- cond. Consequently, the square wave generator can’t be used to measure an amplifier’s rise time— better to use a pair of transistors and do it yourself. Moreover, the shape of the square waves clearly betrays its digital origins. But this is an important tool because it of- fers a relatively wide spectrum, and by monitoring the square wave in a multiamp system you can detect any problems that might exist. The sinusoidal signals can be used to measure passband or level. Keep in mind that if you’re testing a sys- tem with speakers, the generator transmits a signal of the same am- plitude at every frequency, even treble (say goodbye to your twee- ters!). All in all, the generator’s level sta- bility is perfect, which can’t be said of every low-distortion oscillator, and this makes it an effective tool for measuring distortion. The polarity test signal is an unba- NTI Minirator MR1 & Minilyzer ML1 The Swiss army knives (well, almost) of audio 1.The balanced output connector opens up like a knife blade. The 1 pin, for the earth, longer than the others, which are gold- plated. 2.The MR1’s LCD display indicates the signal type, the frequency and the level. Yo use the buttons to access the parameters. 4 4 4 // MEASURING INSTRUMENTS _ __ > Test Bench ... How does one evaluate a sound system or console, or learn about its limitations or performance le- vels, or simply verify that every- thing is working properly? Using measuring instruments is a good method, so long as they’re prac- tical, not too bulky and, if pos- sible, inexpensive. Considerations such as these have led Neutrik Test Instruments to design these mini-tools. 1 2
Transcript of NTI · along with XLR and phono audio connectors. The Minirator is no-table for its connector that...

The MR1 generator, or Minirator,
and the ML1 analyser, or Minilyzer,
are handheld. They’re completely
autonomous, using LR6 1.5 V bat-
t e r i es, which are widely available.
A built-in pocket clip is included
along with XLR and phono audio
connectors. The Minirator is no-
table for its connector that folds
out, like something you’d find on a
Swiss army knife.
knife.
å The MR1 source
The Minirator audio generator works
in the 20 Hz to 20 kHz frequency
range. It generates sinusoidal si-
gnals and square waves, white noi-
se, pink noise and a special signal
used for speaker phase tes t i n g .
Thus it offers an entire range of si-
gnals that are perfectly adapted to
audio testing. Signal amplitude va-
r i es between a mic level and a stu-
dio line level, i.e., between –76 dBu
(a weak level, corresponding to
about 130 µV) and + 6 dBu, or about
1.6 V.
Everything is controlled via buttons
and LCD displays. You can even
change the units—the level changes
a u t o m a t i cally to match the reading.
+ 6 dBu doesn’t correspond exact-
ly to 1.6 V!
The sinusoidal signal is pure. Th e
d i s t o rtion rate is very low: NTI sa y s
it’s less than 0.025% at maximum
output level. This rate rises at low le-
vels, primarily as a result of back-
ground noise, since according to
NTI the rate of distortion + noise is
less than 0.18%.
D i g i tal signal generation is linked
to a discrete variation in frequen-
cy. The MR1 generates the 31 ISO
f r e q u e n c i es (or close) with third-
octave distribution.
The square waves also benefit from
the same frequency series, but li-
mited to 5 kHz. In effect, audio di-
g i tal generation limits the spectrum
to 20 kHz. For our signal, only the
third harmonic, at 15 kHz, will be
distributed; the others fall outside the
passband. The rise time here is li-
mited to a twentieth of a microse-
cond. Consequently, the square
wave generator can’t be used to
measure an amplifier’s rise time—
better to use a pair of transistors
and do it yourself. Moreover, the
shape of the square waves clearly
betrays its digital origins. But this
is an important tool because it of-
fers a relatively wide spectrum, and
by monitoring the square wave in
a multiamp system you can detect
any problems that might exist.
The sinusoidal signals can be used
to measure passband or level. Ke e p
in mind that if you’re testing a sys-
tem with speakers, the generator
t r a n s m i ts a signal of the same am-
plitude at every frequency, even
treble (say goodbye to your twee-
ters!).
All in all, the generator’s level sta-
bility is perfect, which can’t be sa i d
of every low-distortion oscillator,
and this makes it an effective tool
for measuring distortion.
The polarity test signal is an unba-
NTIMinirator MR1 & Minilyzer ML1
The Swiss army knives (well, almost) of audio
1.The balanced output connector opens uplike a knife blade. The 1 pin, for the earth, islonger than the others, which are gold-plated.
2.The MR1’s LCD display indicates thesignal type, the frequency and the level. Youuse the buttons to access the parameters.
4 4 4 // MEASURING INSTRUMENTS_ __>Test Bench ...
How does one evaluate a soundsystem or console, or learn aboutits limitations or performance le-vels, or simply verify that every-thing is working properly? Usingmeasuring instruments is a goodmethod, so long as they’re prac-tical, not too bulky and, if pos-sible, inexpensive.Considerations such as thesehave led Neutrik Test Instrumentsto design these mini-tools.
1 2

lanced signal intended for use with
the analyser, whose polarity tester
was designed on the basis of this si-
gnal. It’s a straight-front signal, with
high-order harmonics. Since its fun-
d a m e n tal is at 20 Hz, all system
transducers are evaluated.
Pink and white noise are used for
real-time analyses or sliding fre-
q u e n cy tes ts. The first uses third-oc-
tave filtering, i.e., at a constant re-
lative bandwidth; and the second
uses constant bandwidth filtering,
as in standard FFT (fast Fo u r i e r
transform) analysers.
Pink noise registers a drop to 3 dB
per spectral content octave when
the frequency rises.
The final signal scans the spectrum
from one end to the other. In other
words, it passes automatically from
one frequency to the next after emit-
ting a sta rt tone at 315 Hz or 1 kHz.
A range of increment options is
available, from 50 ms (very fast) to
five seconds. This allows you to es-
timate frequency response using a
simple sonometre. Once again, wat-
ch out for high frequencies: the le-
vel is just as high as at low fre-
q u e n c i es and treble radio fre-
quencies.
The scan process is looped. To stop
it, you have to change the signal.
We would have preferred a manual
s ta rt, so as to have just enough time
to get ready without wasting time
waiting for the next cycle.
The tonality is used to provide syn-
chronization with an external devi-
ce, such as the ML1, which can dis-
tinguish between the start tonality
and the tonality in the scan signal.
The output pin 1 on the XL R
connector is silver-plated and lon-
ger than the others (the earth is
connected before the signal); the
others are gold-plated. The 2 is the
hotpoint—this is important, in terms
of the polarity test in any case. For
a sine signal, which changes pola-
rity with each half-cycle, the 2 pin
s o m e t i m es generates a
positive cycle and so-
m e t i m es a negative one;
the 3 does this as well,
but in phase opposition.
The operating manual
p r o v i d es a sinusoidal
explanation of the signal polarity.
The controls consist of three but-
tons and the display screen; each ef-
fect is insta n taneously displayed
on the output. You can switch from
one parameter to another with the
touch of a button; a blinking light on
the screen indica t es the acces s i b l e
parameter.
å The ML1analyser
The ML1 includes a large LCD dis-
play. There are four direction keys
and an Enter key along with the
S ta rt and Escape keys—a handy
holdover from computer keyboards.
The analyser includes a toolbox that
is both complete and practica l .
Incredibly; it boasts an absolute and
relative voltmetre / noisemetre, a
f r e q u e n cy metre, a distortion metre,
a VU metre and peak metre, a po-
larity tes t e r, a balance tes t e r, a time
and frequency recorder, a third-oc-
tave analyser and finally an oscil-
loscope. Phew! It’s truly a mobile
laboratory.
Well, we shouldn’t go too far: it’s
not intended to replace an analy-
ser in the lab. Instead, it’s for use
in the field—it provides insta l l e r s
with a powerful and irreplaceable
diagnostic tool.
å The level
The screen displays the level in the
unit measurement of your choice,
and also indica t es the frequency
and the balance (at the point on
the XLR connector producing the
highest level).
At bottom, an analogue scale lo-
ca t es the signal on a 100 dB range
(or from 0 to 1 V). There’s an op-
tion that allows you to measure the
relative level; the reference volta-
ge is stored insta n taneously and
the display indica t es a decibel rea-
ding, a ratio or a percentage grea-
ter or less than 100. The reference
voltage value is displayed in small
characters.
NTI
3.A clip attaches the Minirator to your pocket. The RCAconnector provides an unbalanced output. The texts are laser-engraved.
4.The small connector next to the ML1’s battery compartmentloads the ML1 programme, either from another ML1 or from acomputer.
4 4 4
4 4 4 // MEASURING INSTRUMENTS_ __Test Bench ...
SOWOR
I S S U
3 4

å Distortion
The ML1’s distortion metre is en-
tirely automatic: you feed in a vol-
tage and it figures everything out
on its own. It automatically adjusts
to match the fundamental and dis-
plays the latter along with the to-
tal level, from which it ca l c u l a t es
total harmonic distortion plus noi-
s e*. Here too, various units of mea-
surement are available, including
the traditional percentage with an
i n d i cation in dB, two readings in
terms of 100% or 0 dB of the vol-
tage RMS value.
å VU metre /peak metre
The dual level indicator provides
two analogue, linear readings: a VU -
type reading, with ballistics that
c o r r espond to those of the well-
known needle indicators, and/or a
peak metre-type reading, including
a p p l i a n c es that are much faster,
with control and display instruments
that are purely electronic.
The 0 dB (the reference value for
each instrument) adjusts accor-
d i n g l y, and the maximum value is
stored twice. A segment remains
for about a second after the level
drop; in addition, the highest level
a t tained is stored permanently. Th i s
e n a b l es you to detect any sa t u r a t i o n
of a digital device.
å Polarity
Even when used together, the MR 1
and ML1 are no replacement for
polarity testers, which boast an
acoustic generator that’s lacking
here.
You can’t test the polarity of a mi-
crophone directly. The signal that’s
generated has a fundamental fre-
q u e n cy of 20 Hz, but a full spec-
trum isn’t neces sary for proper ope-
ration.
The ML1 receives the signal in
sweeps: electrical on its RCA and
XLR inputs (when testing the po-
larity of an electrical device) and
acoustic on a microphone (for the
speakers).
The internal processor has enor-
mous calculating power: no fewer
than four methods are available. If
the result generated by the ML 1
with one method seems dubious,
you can move on to the next me-
thod until you get a reliable result.
The result is clearly indicated with
the words Out of Phase or In Phase.
å Balance
This time you measure the relative
amplitude of the incoming signals
on the two XLR connector inputs. If
one is greater, the ML1 tells you
so. The display indica t es the dis-
parity as a percentage or in a vol-
tage ratio.
This measurement is used for ana-
logue output circuits and allows
you to check whether an output
v o l tage is balanced or unbalanced.
SONOWORLD
I S S U E 1 8
4 4 4 // MEASURING INSTRUMENTS_ __>Test Bench ...
A. B.
C. D.
A.Frequency responses forthe ML1’s built-in filters. TheMinirator acts as a source. Wehave three weighting curvesand three highpass curves; thelatter eliminate excessively lowfrequencies that could interferewith the measurement.
B.Frequency responses for theML1’s seven third-octaveanalyser filters. Some (thoughnot all) of the filters areextremely straight. This is theresult of the DSP’s synthesis ofthese filters and theapproximations imposed by thistechnology, if you don’t want tohave an array of processors.Their dynamic is over 30 dBgreater than what is shownhere. On the right, we havetransposed the response fromtwo of the filters and addedtemplates that correspond toClass II filters. No problems:all requirements are met.
C.The square waves change inshape with the frequency: thehigher the frequency, the fewerthe harmonics. At 5 kHz, onlythe 3 harmonic remains.
D.These sweeps are used forthe polarity test: the straightfront is positive if you’re inphase, negative when out ofphase. The DSP stores thisinformation intelligently.

å Scanning
Now we come to data storage. Tw o
s cans are available, a frequency
s can and a time scan. The frequency
s can is activated automatically with
the scanned signal generated by
the MR1. The frequency and the
level at the input are measured and
displayed, so you get a direct rea-
dout on the screen of the frequen-
cy response curve for the system
you’re testing.
You can’t just feed any old thing
into the ML1. It recognizes stable,
broken and increasing frequencies .
The second scan mode is time-ba-
sed. The ML1 can store a maximum
of 1600 pieces of data over a per-
iod lasting between 60 seconds and
100 hours. Several settings are sto-
red, including frequency, distort i o n
and level. You can choose to dis-
play any one of them, but all are
stored and can be recalled later.
This system reveals problems that
arise intermittently, e.g., activation
of the thermal circuit breaker on an
overloaded amplifier, or problems
relating to non-linearity. Several pa-
rameters are recorded simulta-
neously so that you can detect a
problem before you’ve identified its
origin. A level drop may be ac-
companied by an increase in dis-
tortion. All that’s missing is an au-
tomatic tone sta rt, such as for plot-
ting a curve with a test disk: vinyl
or compact disc, etc.
å Third-octaveanalyser
With third-octave analysis, you ca n
quickly monitor the operation of an
equalizer or any non-linear fre-
quency circuit, such as a filter.
If you connect a measuring micro-
phone and its preamplifier ups-
tream, you can detect any non-li-
near res p o n s es in an insta l l a t i o n
and resolve them with a graphic
equalizer.
You adjust its time factor, the sca l es
and the total level, although the lat-
ter is only present in the form of an
analogue bar; a memory would be
useful if it’s impossible to apply an
overlong signal to the circuit you’re
measuring. The recorder and ana-
lyser have a cursor that provides a
digital readout of the value for the
parameter being displayed; once
the recording process is complete,
you’ll have plenty of time to analy-
se the data.
If the batteries die, you won’t lose
your data—they’re stored in flash
memory.
5.NTI installs all the ML1’s connectorson a single side. Here we have theacoustic input on the mike and thebalanced and unbalanced inputs on twoother sockets; you can also connect aheadset.
6.In scan mode, the analyser screenshows the frequency response for one ofthe filters. The MR1 was used as agenerator, followed by the ML1.
7.Use the menu to select a functionfrom among those available. With someprogrammes you can make twoselections.
5 6 7
8.No buttons for this oscilloscope: itadjusts its time base and vertical scaleon its own.
9.Using the phono input, you get aperfect imbalance, as the 99.7%indicates.
10.We are in phase. We used theelectrical input here rather than themicrophone input.
8 9 10
4 4 4 // MEASURING INSTRUMENTS_ __Test Bench ...

å Oscilloscope
F i n a l l y, the device serves as an oscil-
loscope. Designed for audio use, it
has the corresponding passband (20
kHz) and a display resolution linked to
that of the screen. It’s possible to de-
tect major incidents but not small tran-
s i e n ts that may stray in on a sine wave.
The main thing is to know the tool’s li-
m i ts. You can incorporate an array of
filters into the measuring equipment,
including high-pass filters, two weigh-
ting filters and a filter for voice pass-
band. A 3.5-mm jack output gene-
r a t es a signal when music is pres e n t .
The internal processor can recognize
a musical signal and will connect the
output accordingly. The output level
d o es not depend on the input level.
Since plenty of people will find a tool
like this helpful, NTI has installed four
user memories that store all the pa-
rameters associated with each type
of measurement.
å Engineering
Both devices are digital, with a sa m-
pling frequency of 48 kHz. The ge-
nerator is based on a programmable
circuit. Signal synthesis is comple-
tely digital, by means of a table of
v a l u es, and an 18-bit AKM conver-
ter puts analogue signals within
your reach as well. Po w e rful though
it is, the DSP uses little energy and
i n c l u d es a microcontroller to mo-
nitor consumption. There’s a flash
memory for storing data. The gain
is monitored by a relay as well as
by a digitally controlled pot. Yo u
can modify the DSP’s programming
as the software evolves through a
connector that’s accessible via the
battery cover. With this you ca n
transfer the programme from one
ML1 to a more recent version, or
channel everything through a com-
puter.
The components are surf a c e - m o u n-
ted, with all connectors included.
NTI has streamlined the manufac-
turing process and is using some
novel ideas, such as helicoid conta c t
springs for activating the MR1’s ro-
tating output connector. Servicing
the device isn’t too complicated if
you’re equipped to handle surface
work, since everything is acces s i b l e .
The internal power feed uses
c o n v e rters that provide positive and
negative voltage, using the power
supplied by two or three 1.5 V bat-
teries.
å Handling
N e e d l ess to sa y, we tested the ins-
trument, on a mixing console in par-
t i c u l a r. We have to point out that,
even though they have some pretty
p o w e rful features, these devices are
by no means intended to replace la-
b o r a t o r y - t esting equipment. It’s es-
sential that you be aware of their li-
m i tations, or at least the fact that
the passband is limited to 20 kHz.
The maximum permissible input vol-
SONOWORLD
I S S U E 1 8
4 4 4 // MEASURING INSTRUMENTS_ __>Test Bench ...
11.The decibels given here arerelative; the reference level is indicatedbelow. This shows the frequency and theinput type. An analogue scale at thebottom expresses the value.
12.In addition to distortion, the ML1indicates the level and frequency andwhether the input is balanced orunbalanced.
13.The third-octave analyser screen:here we see the spectrum for a squarewave. The cursor automatically goes tothe fundamental, for which the level isdisplayed. The vertical scale is 100 dB,but the value shown has a resolution of0.1 dB. You can also move the cursor inorder to analyse each component.
11 12 13
MR1Square sine wave, 20 Hz/20 kHz scanning, whitenoise, pink noise, polarityFrequency: 20 Hz – 20 kHz, 31 frequenciesSine level: - 76 – +6 dBu in increments of 2 dBu, or0.13 mV – 1.6 V in increments of 23%Distortion: t y p i cally 0.025% at + 6 dBuAccuracy: ± 0.5 dB ± 1 unit of measurementOutput impedance: 200 EDimensions: 1 40 x 74 x 25 mmWeight: 170 g with batteries
ML1Level: dBu, dBV and RMS value. A c c u r a cy : 0 . 5 % .R esolution: up to three digits in dB, four digits inv o l ts .Frequency: 10 Hz – 20 kHz. R es o l u t i o n : up to four di-g i ts. Accuracy: better than ± 0.1%Relative harmonic content: Measuring BP: 20 Hz – 20 kHz.R esidual distortion: 0.005%Third-octave analyser: IEC 1260, Class IIInput voltage: -95 – +20 dBu balanced or 14 µV at 7. 7 5VDisplay: Graphic LCD, 60 x 100 pixelsDimensions and weight: 1 63 x 86 x 42 mm, 300 g with bat-t e r i es
MEASUREMENTS AND TESTS
tage on the analyser is + 20 dBu, or
7.75 V, on its balanced input, and half
that (+ 14 dBu, or 3.8 V) on its pho-
no plug (RCA). A mixing console ca n
generate + 28 dBu, so you have to
add an external 10 or 20 dB volume
equalizer if you want to assess the
console’s maximum ca p a c i t y. Th e
tool is made for use in the field, i.e.,
for practical testing on devices that
aren’t neces sarily working at high
p e rformance. Moreover, the ML 1 ’ s
input impedance is lower than that
of a standard measuring tool, so don’t
be surprised if you get readings that
differ by a few tenths of a dB—the
r esult of a non-null source impe-
dance. The digital display is somewhat
misleading in that it highlights dif-
f e r e n c es in level to a greater extent
than the needle on an analogue de-
vice would do. It may display a dif-
ference of a few percentage points
even though no difference can be
heard—something to keep in mind
at all times! Once you’ve chosen a
function, the analyser’s myriad au-
tomated controls allow you to keep
both hands free for your tinkering
and, if you’re low on light, to illumi-
nate the screen. The MR1 genera-
tor and the ML1 analyser comple-
ment each other perf e c t l y, despite a
difference in frequency at the low
end of the spectrum where the ge-
nerator doesn’t conform to the ISO
distribution for reasons of synthes i s
and quartz. The generator’s output
impedance is 200 E on the phono
plug as well as on the XLR in ba-
lanced mode, and 100 in unbalan-
ced mode. The maximum output vol-
tage is 6 dBu when the impedance
load is high and + 3.6 dBu on 60 0
W—the value you get on the balan-
ced output. You should avoid using
the balanced output in unbalanced
mode with a link between 3 and 2;
otherwise you may multiply the har-
monic distortion rate by a factor of
ten! This harmonic distortion rate,
measured with the ML1, is approxi-
mately 0.02% on almost the entire
band; it climbs to 0.080% at 10 kHz.
Here, you measure the S/N ratio plus
noise. We like the third-octave ana-
l y s e r, which has a number of filters
( c u r v es) so straight as to make an
analogue filter designer blanch (the
curve was plotted from a certa i n
number of points that begin to clus-
ter as you approach the horizonta l —
it wasn’t drawn with a ruler!).
The dynamic range of the display is
100 dB, while that of the measure-
m e n ts is 114 dB. By using the zoom
you can detect very low levels wi-
thout saturating the filter. It’s also
possible to get a general idea of a
background noise spectrum when a
signal is present…it’s up to you to
decipher it. The actual background
noise on the millivoltmetre is 60 µV
or - 82 dBu open input; this changes
to 9 µV or - 99 dBu closed input on
600 E. If you want to work with the
unbalanced input, you’ll want to short -
circuit terminals 1 and 3 on the XL R
connector; this will give you a dozen
or so microvolts of background noi-
se instead of 95. The ML1 input ca n
take a top voltage of + 20.8 dBu in
balanced mode and – 6 in unbalan-
ced mode, both on the XLR connec-
tor and on the phono. Th ese volta g es
c o r r espond to 8.4 and 4.8 V res p e c-
t i v e l y. The input impedance is 18.9
kE on the phono plug, 19.5 kE on
the two XLR terminals in unbalan-
ced mode and 39 kE in balanced
mode. If you measure the sources
with a high output impedance, you
may get readings that differ from
those of your millivoltmetre. Don’t
blame the millivoltmetre—the expla-
nation may lie with the ML 1 .
Whenever you measure a physica l
size, you disturb it. This is a golden
rule that you should always remem-
ber—it may help explain certain ano-
m a l i es! We’ve included an illustra-
tion of some waveforms taken from
the generator output. We traced the
c u r v es for the internal filters, weigh-
ting and high-pass. You’ll also find
the curves for some filters on the
t h i r d - o c tave analyser for a 52 dB
4 4 4 // MEASURING INSTRUMENTS_ __Test Bench ...
14.The screen serves as a VU metreand peak metre. The scales can beadjusted. The maximum values arestored on the right; here, –4.9 and –2.7.
14
ACCURACY AND RESOLUTIONAccuracy provides a measure of how much confidence you can place in the result.It identifies the range of values in which the measured dimension falls. For example, areading of 1 V that is accurate to 1% indicates that the voltage is between 1.01 V and0.99 V. The resolution indicates the increment between two consecutive values. Forexample, a resolution of three digits corresponds to a three-digit reading of an object’s di-mension, but this reading cannot be very exact. A value expressed in dB with a resolutionto three digits indicates that the final digit may vary by plus or minus one unit. Forexample, 31.3 dBu may correspond to a voltage of between 31.2 and 31.4 dBu. There is noguarantee as to the true value of the final digit.Accuracy and resolution have cumulative effects… And by the way, do you really need tohave such accurate readings all the time???
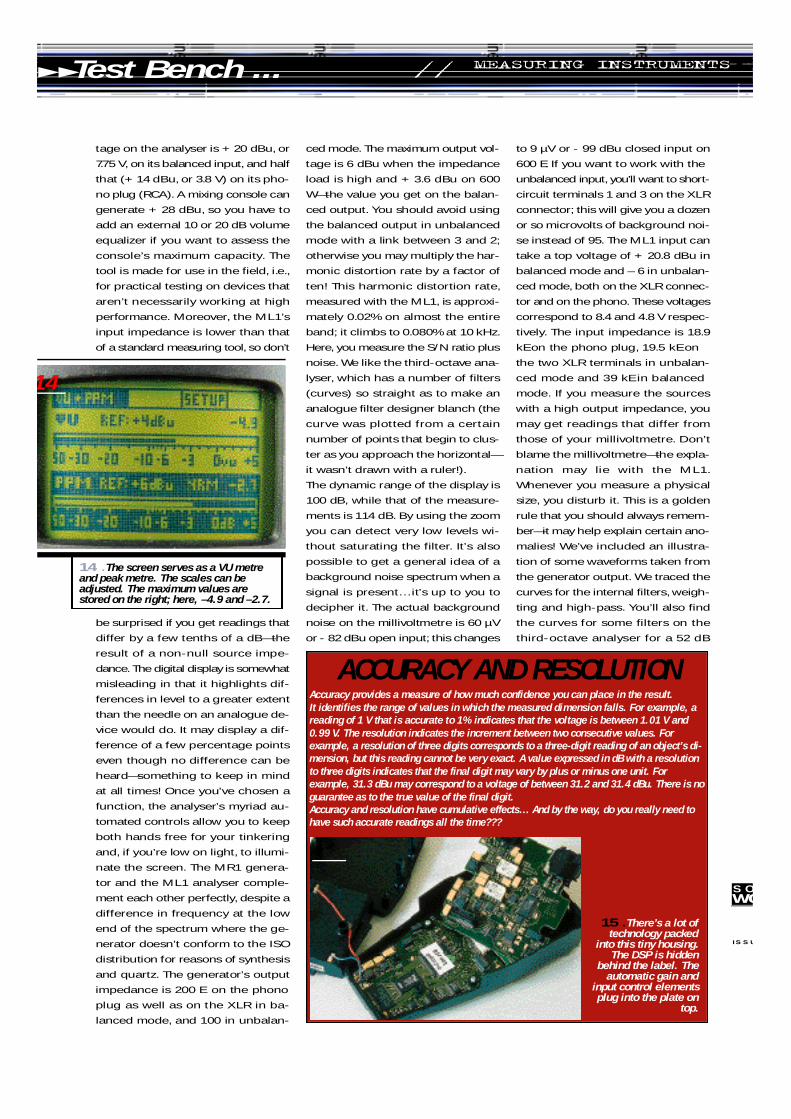
15.There’s a lot oftechnology packed
into this tiny housing.The DSP is hidden
behind the label. Theautomatic gain and
input control elementsplug into the plate on
top.
15
SOWOR
I S S U

4 4 4Test Bench ...
spectrum. Some of the filters are quite narrow, and
not all of the res p o n s es are the same, as you can see
on the ML1 display showing a sine input from the
MR1. All of these curves broadly meet the require-
m e n ts for Class II devices such as this one (per NTI).
Notice the very high dynamic for this analyser—it’s a
true investigative tool.
å Conclusions
To begin with, there’s the price. If you look around for
a generator with distortion equal to that of the MR 1 ,
you’ll find that it will cost you double the price, without
providing square waves or noise, and moreover it will
have to be plugged into the grid. As for the ML1 ana-
l y s e r, it costs less than a small distortion metre but pro-
v i d es more functions, especially adapted for use in au-
dio. The third-octave analyser is remarkable, the re-
corders are practical, the phase tester is uncommon-
ly simple. In terms of the quality/price ratio, on a sca-
le of one to five we’d give it at least a 10! On one of our
d e v i c es we discovered an unimportant power supply
defect that we hadn’t even suspected beforehand! Wi t h
the multiple display screens you can check several pa-
rameters at the same time without having to negotia-
te the menu.
Of course, we could complain about a number of things—
but can one really complain that a device doesn’t of-
fer a function for which it wasn’t designed? Absolutely
not. It has its limitations, such as a passband that stops
quickly at 20 kHz and a low-resolution screen (the set-
tings are recorded in tenths of a dB, but each screen
element ta k es about 3 dB, less if you change the sca-
le). The important thing is to know its limitations and
to keep them in mind while you use the device. Take ca r e
n o n e t h e l ess if you’re not in the habit of using equipment
like this—as we said before, it’s possible to make it tell
you just about anything! If from time to time you want
to display the distortion, as you could do on a labora-
tory distortion metre, just ask for the spectrum—that
p r o v i d es another way of displaying the phenomenon.
Don’t wait—order one now…
Etienne Lémery
NTI AG
T E L . : +423 239 6060FA X : +423 239 6089
*Distortion plus noise:Distortion measurement techniques include background noi-se and elements that arise from distortion (harmonics). Thetechnique consists of eliminating the fundamental with a high-ly selective filter, and then measuring what remains. The back-ground noise originates in noise generated by the device it-self. This noise is distributed all along the measured spectrum,sometimes with spikes at frequencies connected to that of themains. High-level distortion measurements do not reflect noi-se to any notable degree; by contrast, background noise be-comes more significant as the audio signal level drops.
SONOWORLD
I S S U E 1 8