Contentchimie.ucv.ro/departament/documente/anale-nr2-2017.pdf · Alain Fruchier- Ecole Nationale...
92
Volume XLIV, no. 2 2017
Transcript of Contentchimie.ucv.ro/departament/documente/anale-nr2-2017.pdf · Alain Fruchier- Ecole Nationale...

Volume XLIV, no. 2
2017

Editor in Chief
Co-Editors
Issue Editor
Editorial Board
Véronique Barragan-Montero - Université de Montpellier, France
Jean-Louis Montero - Université de Montpellier, France
Alain Fruchier- Ecole Nationale Supérieure de Chimie de Montpellier, France
Michel Schlegel – Commissariat a l'Energie Atomique (CEA)
Michael Descostes - Commissariat a l'Energie Atomique (CEA)
Ilea Petru - Babeș-Bolyai University, Cluj-Napoca
Anca Cojocaru - Politehnica University of Bucharest
Oana Stănaşel - University of Oradea
Cristina Băbeanu - University of Craiova
Aurora Reiss - University of Craiova
Mihaela Mureşeanu - University of Craiova
Simona Sbârna - University of Craiova
Bogdan Tutunaru - University of Craiova
Aurelian Dobriţescu - University of Craiova
Georgeta Ciobanu - University of Craiova
Anca Moanţă - University of Craiova
Cătălina Ionescu - University of Craiova
Andreea Simionescu - University of Craiova
Contact
Phone: +40 251 597048
Fax: +40 251 597048
Web page: http://chimie.ucv.ro/departament/
e-mail: [email protected]
Cezar Spînu University of Craiova
Cristian Tigae University of Craiova
Paul Chiriță University of Craiova
Bogdan Tutunaru University of Craiova

1
Content
Research articles
Use of NMR patterns in establishing the C- or O-alkylated structure
in derivatives of protected mannose
Cătălina Ionescu, Alain Fruchier, Georgeta Ciobanu, Anca Moanță,
Véronique Barragan-Montero 2
Does the oxidation state impact chromium toxicity in wheat
seedlings?
Georgeta Ciobanu, Cătălina Ionescu, Aurora Reiss 12
Azoethers and azoesters with antimicrobial activity
Anca Moanță, Cătălina Ionescu, Simona Iordache 24
Investigating the coordination manner of a heterocyclic thioamide
to Pt(II)
by EHT interpretation of the electronic spectra for both free and
oordinated organic ligand
Liana Simona Sbîrnã, Sebastian Sbîrnã, Anișoara Oubraham 36
Total phenolic content and antioxidant activity in leaves of six Salix
genotypes
Cristina Băbeanu, Ana Maria Dodocioiu 48
Thermal Analysis of some Binuclear Bioactive Complexes Derived
from an Aromatic Dialdehyde and L-Tryptophan
Florina Ciolan, Anca Gănescu 58
Natural sources used to obtain edible films
Mihaela Gabriela Dumitru 65
The oxidative dissolution of iron monosulfide (FeS): A Cyclic
Voltammetry study
Mădălina Duinea, Maria Manea, Ana Sandu, Bianca Ghejan,
Mihaela Petcu, Paul Chiriță 75
Synthesis and description of three square-planar d8 complex
compounds involving charge-transfer systems
Liana Simona Sbîrnă, Clementina Moldovan 82

2
Use of NMR patterns in establishing the C- or O-alkylated
structure in derivatives of protected mannose
Research article
Cătălina Ionescu1,*, Alain Fruchier2, Georgeta Ciobanu1, Anca Moanță1,
Véronique Barragan-Montero3
1University of Craiova, Faculty of Sciences, Department of Chemistry, Calea Bucuresti, 107i,
Craiova, Romania 2UMR CNRS 5253—ENSCM, 8 rue de l’École Normale, 34296 Montpellier cedex 5, France 3Faculté des Sciences, CC 750, Faculté d'odontologie, Laboratoire de Bioingénierie et
Nanosciences, 545 Avenue du Professeur Jean-Louis Viala, 34193 Montpellier cedex 5, France
*E-mail: [email protected]; [email protected]
Received: 24.11.2017 / Accepted: 13.12.2017 / Published: 22.12.2017
Abstract
Ambident nucleophiles can lead to isomers, therefore, it is important to know which of
the centres has reacted. The anion of bis(2,2,2-trifluoroethyl) malonate (TFEM) can
react either at oxygen, either at the methylene carbon atom. In a previous study, we
have presented two alkylation reactions of protected mannose with TFEM via the
Mitsunobu reaction at the anomeric and at the C6 position of the carbohydrate, leading
to O-alkylated products or to mixtures of C- and O-alkylated products. In the present
paper, the 1H NMR patterns that allowed us the assign the chemical structures of the
obtained products at the C6 position are detailed.
Keywords: ambident nucleophile, bis(2,2,2-trifluoroethyl) malonate, mannose, NMR
Annals of the University of Craiova
The Chemistry Series
Volume XLIV, No. 2 (2017) 2-11 homepage: c himie .ucv.ro/ anale/

3
1. INTRODUCTION
Ambident nucleophiles are nucleophiles that can react at two
different atoms in their structure, due to resonance stabilization of the
negative charge over two atoms. The most well-known examples of
ambident nucleophiles are enolates [1, 2] that can lead, through
alkylation, either to C-alkylated (if the negative charge is localized at C),
either to O-alkylated (if the negative charge is localized at O)
compounds, or to mixtures of C and O-alkylated products (Scheme 1).
Scheme 1. Acetone enolate reactivity: (A) Resonance structures of
acetone enolate; (B) C and O-alkylation of acetone enolate.
Other ambident nucleophiles exist, one of them being the anion of
bis(2,2,2-trifluoroethyl) malonate (TFEM). In previous studies [3-5], we
have used this double ester as reagent in the Mitsunobu reaction [6, 7]
with appropriately protected mannose, having either the anomeric, or
the C6 positions free for coupling. The results showed that, when
applied to the anomeric position, only O-alkylated compounds have
been identified, while at the C6 position, a mixture of C- and O-
alkylated compounds has been obtained [4]. Many competitive
alkylation reactions (e.g. N/O, N/S, C/O) under Mitsunobu conditions
have been reported in literature, leading to sole reaction products or to
mixtures of compounds [7-13]. In the mentioned papers, we have
previously presented the structures and spectral data of the obtained
products, with an emphasis on reaction mechanisms and possible
explanations of the processes that lead to our results. In this study, we

4
are exposing the NMR data that allowed us to assign the C or O-
alkylated structure to our products.
Because the Mitsunobu reaction of TFEM applied to the C6
position of protected mannose lead to both C- and O-alkylated products,
we will use this reaction as case study. The structures of the two
reaction products have been analysed using mass spectrometry and
NMR spectroscopy. As the two products are isomers, mass spectrometry
cannot easily assist in distinguishing between the two possible
structures. In our study, differences have been noticed using NMR
analyses: 1H NMR and 13C NMR. Other papers also describe NMR
methods (HSQC/HMQC, HMBC, ROESY, and 13C shift predictions) to
differentiate between competitive alkylation products [14].
The reaction products detailed in this paper are obtained using
the reaction described in Scheme 2.
Scheme 2. Reaction of protected mannose, free at C6 position, with
TFEM, under Mitsunobu conditions [(a) the Z/E configuration has not
been determined]
2. MATERIALS AND METHODS
2.1. Materials
The products (2 and 3) detailed in this paper have been obtained
using the Mitsunobu reaction in conditions previously described [Error!
Bookmark not defined.]. Products purification and spectral
identification data of 2 and 3 are also contained in this publication.

5
2.2. Methods
Proton spectra have been recorded in CDCl3 solutions on a
Bruker DRX-400 spectrometer working at 400.13 MHz for 1H and 100.62
MHz for 13C. 1H-1H and 1H-13C correlation spectra were recorded with
the standard pulse sequences.
3. RESULTS AND DISCUSSION
Among the spectral NMR data of compounds 2 and 3, the
patterns described in Table 1 allowed us to distinguish between the C-
and O-alkylation products (2 and 3).
Table 1. Some NMR parameters of compounds 2 and 3 (chemical shifts
δ in ppm; coupling constants J in Hz) NMR
analyse
s
Characteristics C-alkylation (2) O-alkylation (3)
1H
H6a
and
H6b
δ AB part of ABXY system
(2.22 & 2.64)
AB part of ABX system
(4.48 & 4.58)
Multiplicity ddda(see coupling
constants on Figure 1)
ddb (2J6a-6b=11.4; 3J6a-
5=2.0; 3J6b-5=5.2)
H2’
δ 3.89 4.44
Multiplicity ddb (see coupling
constants on Figure 1) sc
H4’
and
H6’
AB parts of two ABX3
systems (4.52 & 4.55; 4.53
– accidental isochrony of
A and B)
AB parts of two ABX3
systems (4.39 & 4.45;
4.25 & 4.36)
3JH-F 3JH4'a-F5’ = 3JH4'b-F5’ = 3JH6'a-F7’ =
3JH6'b-F7’ = 8.3
3JH4'a-F5' = 8.7; 3JH4'b-F5' = 8.6; 3JH6'a-F7' = 7.9; 3JH6'b-F7' = 7.8
13C
C1’ δ 167.15d 163.51
C2’ δ 47.87 71.44
C3' δ 166.88d 167.78 a : double doublet of doublets; b : double doublet; c : singlet; d : values
may be interchanged

6
3.1. 1H NMR spectrum
3.1.1. Signal multiplicities of H6 and H2' in C-alkylation vs O-alkylation
products:
The two H6 protons form an ABXY system with H5 and H2’ in the
C-alkylation product (Figure 1), while they couple only with H5 in the
O-alkylation product (ABX system, Figure 2).
Figure 1. Signals of H6a and H6b for the C-alkylation product 2
Figure 2. Signals of H6a and H6b for the O-alkylation product 3

7
H2’ couples with the two H6 protons (double doublet) in the C-
alkylation product 2, as seen in Figure 3, while its signal is a singlet in
the O-alkylation product 3 (Figure 2).
Figure 3. Signal of H2’ for the C-alkylationproduct 2
The coupling between the two H6 and H2’ is clearly observed in
the 1H-1H correlation spectrum (Figure 4).
Figure 4. 1H-1H NMR spectrum of the C-alkylated compound 2. In the
detail box, the spots corresponding to the coupling between H6a and H6b
and H2’ are outlined

8
Other differences regarding the 1H NMR spectra of these two
compounds may be noticed:
- Oxygen proximity has a deshielding effect over the H6 protons in
the O-alkylation product 3, when compared to the C-alkylation
product 2.
- In product 3, H2' attached to a sp2 carbon is strongly shielded due
to the mesomeric effect of the two oxygen atoms on C1' which
creates a partial negative charge at C2’. The same shielding is seen
in the 13C NMR spectra, when compared to classical alkenes
chemical shifts [15].
- The coupling constant 2JH6a-H6b has a smaller value in the O-
alkylation product 3 compared to that found in the C-alkylation
product 2. This observation is in agreement with literature data
that states that the value of the geminal coupling constant in a
methylene group decreases with the electronegativity of a
neighboring heteroatom [16].
3.1.2. H4’ and H6’ in C-alkylation vs O-alkylation product:
Another interesting aspect is related to the signal of malonate
residue protons (ABX3 systems of CH2CF3 groups). In product 2, the four
3JH-F coupling constants of the two -CH2CF3 groups have the same value
8.3 Hz, like that found in TFEM, an ester itself. In product 3, the two
groups have different coupling constants (two of them being smaller
than 8 Hz and two larger) and therefore, a difference can be seen
between -CH2CF3 groups linked to an ester and to an ether group.
Moreover, these groups have different signal multiplicities (Table 1).
The example of the C-alkylation product will be given. In figure
5a, it can be seen that, although the two -CH2CF3 groups are
symmetrical, one of the groups appears as an ABX3 system, while the
protons of the second -CH2CF3 group are isochronous at 400 MHz
(appearing in the 1H NMR spectrum as an A2X3 system). In figure 5b, it
can be seen that, by irradiating the 19F atoms, the 1H-19F couplings
disappear, and the signals of the first group become a simple AB system
(indicated by rectangles, empty circles, full and empty stars), while the

9
signals of the second group become a singlet (indicated by full circles)
(Figure 5b).
3.2. 13C NMR spectrum
- C2’: A clear difference can be seen in the 13C NMR spectrum, as
in the O-alkylation product, C2’ is more deshielded, shifting from
around 50 ppm (compound 2, sp3 carbon), to 70 ppm in compound 3
(sp2 carbon). The shielding effect of oxygens next to the double bond has
already been commented (section 3.1.1.).
- C1’ and C3': In the C-alkylation product, the malonate residue is
symmetrical: both C1’ and C3’ are esters, and have similar chemical shifts
(around 167 ppm, see Table 1). In the O-alkylation product, it can be
noticed the fact that one ester group is present at 167.78 ppm, together
with a carbon atom with a lower chemical shift (163.51 ppm, C1’). This
atypical high shift for a sp2 C=C carbon is due to the mesomeric effect of
the two oxygen atoms on C1'.
Figure 5. (A) Region of H4’ and H6’ in 1H NMR spectrum of compound 2
(C-alkylation); (B) same spectrum as in (A) with 19F irradiation –
corresponding peaks in spectra (A) and (B) are indicated using specific
signs (see text)

10
4. CONCLUSION
Each time ambident nucleophiles are used, there is a great
interest in finding analyses tools able to distinguish between the
possible reaction products. This work has applications in establishing
the correct structure of other reaction products of TFEM or of C- or O-
alkylated mannose derivatives. For example, the data presented in Table
1 were a great support in analysing the structure of the 6 compounds
obtained when applying the Mitusnobu reaction with TFEM in the
anomeric position of mannose, when only O-alkylation products have
been obtained.
References
1. F. A. Carey, R. J. Sundberg, Alkylation of Nucleophilic Carbon. Enolates
and Enamines. In: Advanced Organic Chemistry. Springer, Boston, MA
(1990).
2. D. Seebach Angew. Chem. Int. Ed. 27 (1988) 1624.
3. C. Clavel, V. Barragan-Montero, J.-L. Montero, Tetrahedron Lett. 45
(2004) 7465.
4. C. Gurgui-Ionescu, L. Toupet, L. Utttaro, A. Fruchier, V. Barragan-
Montero Tetrahedron, 63 (2007) 9345.
5. C. Ionescu, A. Fruchier, A. Moanta, M. Chelarescu, Annals of the
University of Craiova, The Chemistry Series, XXXIX (2) (2010) 61.
6. O. Mitsunobu, M. Yamada, Bull. Chem. Soc. Jpn. 40 (1967) 2380.
7. For a review on Mitsunobu reaction, see: D. L. Hughes Org. Prep.
Proced. Int., 28 (1996) 127.
8. R. E. Hartung, M. C. Wall, S. Lebreton, M. Smrcina, M. Patek,
Heterocycles 94 (2017) 1305.
9. D. L. Comins; G. Jianhua Tetrahedron Lett. 35 (1994) 2819.
10. J. Wang, C. D. Gutsche Struct. Chem. 12 (2001) 267.
11. M. Wada, O. Mitsunobu Tetrahedron Lett. 13 (1972) 1279.
12. T. K. M. Shing, L.-H. Li, K. J. Narkunan Org. Chem. 62 (1997) 1617.
13. N. G. Ramesh, K. K. Balasubramanian, Tetrahedron 51 (1995) 255.

11
14. S. R. LaPlante, F. Bilodeau, N. Aubry, J. R. Gillard, J. O’Meara, R.
Coulombe, Bioorganic & Medicinal Chemistry Letters 23 (2013) 4663.
15. E. Pretsch, P. Bühlmann, M. Badertscher, Structure Determination of
Organic Compounds Springer-Verlag, Berlin Heidelberg, (2009).
16. H. Günther, NMR Spectroscopy, John Wiley & Sons, Chichester (1995).

12
Does the oxidation state impact chromium toxicity in wheat
seedlings?
Research article
Georgeta Ciobanu*, Cătălina Ionescu, Aurora Reiss
University of Craiova, Faculty of Sciences, Department of Chemistry, Calea Bucuresti, 107i,
Craiova, Romania
*e-mail: [email protected]
Received: 06.11.2017 / Accepted: 04.12.2017 / Published: 22.12.2017
Abstract
Dose-dependent growth inhibition was observed in wheat seedlings cultivated on
media contaminated with chromium as CrCl3 and K2Cr2O7 respectively, ranging from 1
mol L-1 to 500 mol L-1. Biometric data pointed out Cr2O72- as more effective than Cr3+,
with EC50 values of 0.15 mmol L-1 for root elongation inhibition and 0.23 mmol L-1 for
stem elongation inhibition. At low levels of chromium excess, where growth inhibition
didn’t occur, modulation of some biochemical indexes (e.g. peroxidase activity, lipid
peroxidation, glucose and anthocyanin content) was suggestive for the onset of
adaptive responses of wheat plants.
Keywords: chromium, wheat plants, growth inhibition, biochemical effects
Annals of the University of Craiova
The Chemistry Series
Volume XLIV, No. 2 (2017) 12-23 homepage: c himie .ucv.ro/ anale/

13
1. INTRODUCTION
Chromium (Cr), whose name of Greek origin is suggestive for the
intense colour of its compounds, is a metallic element with the atomic
number 24. Electronic configuration of elemental chromium is
[Ar]3d54s1; accordingly, in the periodic table of elements it is placed in
group 6 and period 4, among the transition metals. A wide range of
oxidation states are possible for chromium, the most stable being +3 and
+6. Chromium concentration in Earth’s crust is about 100 ppm, the
presence of its compounds in the environment being the result of rocks
erosion and volcanic activity, with background concentrations, for
example, lower than 500 mg kg−1 in soil and 0.5 mg kg−1 in vegetation 1.
Due to its properties, chromium has numerous practical uses. A
‘short list’ of these should contain: stainless steel obtaining and
electroplating, dye and pigments, synthetic ruby and laser technology,
wood preservation, leather tanning, refractory materials, and catalysts
2. Thus, it is not surprising the extent of chromium environmental
contamination due to anthropic activities, and the inherent risk that
poses to ecosystems and human health 3. Usually, Cr(III) is
considered non-toxic, while Cr(VI) is known as toxic and carcinogenic.
Hexavalent chromium is a powerful oxidant, and its reduction is safe
when occurs outside cells, as the final product, Cr3+, is less mobile, both
in the environment and the living organisms. Biological reduction of
Cr(VI) to Cr(III) is a potentially useful mechanism for Cr detoxification
and bioremediation of the contaminated sites. In this respect, some
bacterial activities are taken into account for environmental clean-up,
and also for the purpose of chromium detoxification in vivo 4, 5.
Despite the efforts, chromium chemistry in vivo is still far from
being clarified. The older idea about the essentiality of trivalent
chromium in mammals, with a role in carbohydrate and lipid
metabolism, was abandoned, as more recent findings do not support it
6, 7. There are still gaps in understanding chromium genotoxicity and
carcinogenicity 8-11. In cells, the redox activity of hexavalent
chromium lies at the heart of its toxicity. According to the current model
emerging from literature on Cr(VI) genotoxicity, chromate anions enter
the cell through the transporters of physiological anions (phosphate,

14
sulphate). When occurs within cells, besides depleting their antioxidants
(ascorbate, glutathione), hexavalent chromium reduction generates
reactive intermediates and oxidative stress. Moreover, once formed
inside the cell, ‘innocuous’ Cr3+, the final product, may become very
toxic by binding to macromolecules (nucleic acids, proteins) and
preventing them from properly functioning 12.
Studies on chromium interactions with plants are also focused on
topics like bioavailability, uptake, toxicity and detoxification 3, 13-15.
The present paper describes our findings on growth and certain
biochemical parameters in wheat seedlings cultivated on media with
excess chromium, ranging from 1 mol L-1 to 500 mol L-1, in two
experimental series: one with chromium (III) as CrCl3, and the other
with Cr(VI), as K2Cr2O7.
2. MATERIALS AND METHODS
2.1. Materials
All the solutions used in these experiments were prepared with
analytical grade reagents. Wheat caryopses (Triticum aestivum L, cv. PB-
1) were obtained from the Agricultural Research and Development
Station Simnic, Dolj.
2.2. Plant cultivation and heavy metal treatment
Germinated wheat caryopses were cultivated on nutrient
solutions solidified with agar 16, 17. In order to evaluate the effects of
chromium on wheat seedling growth, nutrient solutions were
supplemented, in separated experiments, with CrCl3 and K2Cr2O7,
respectively. For each of the abovementioned chromium salts, a series of
dilutions ranging from 1 mol L-1 to 500 mol L-1 were obtained within
the nutrient solutions, starting from 10 mmol L-1 stock solutions. Each
probe was ruled in triplicate, while 3 dishes without heavy metal excess
were kept as control.

15
2.3. Plant growth assay
Seven days-old wheat plants were harvested and growth
parameters (i.e. the length of the roots and stems) were registered.
Biometric data were used for the calculation of growth inhibition index
17 and further to infer EC50 values, the effective concentration that led
to 50 % inhibition of wheat plants growth.
2.4. Biochemical assays
Few indexes of metabolic and redox status were assayed in wheat
leaf extracts, prepared as we have previously described 17. We aimed
to find if any of the tested biochemical parameters were relevant for
chromium toxicity, and to compare the effects of Cr(III) and Cr(VI), at
concentration where no significant growth inhibition was observed.
Total peroxidase activity (EC 1.11.1.7) was measured using guaiacol as
reducing substrate 18, and the secondary lipid peroxidation products
were dosed by TBARS assay 19. The Bradford method was used for
total soluble protein evaluation 20, while glucose content of the leaves
was estimated by the glucose oxidase-peroxidase method 17. Ethanolic
extracts of leaf tissue were also prepared, and their absorption spectra in
the visible domain were registered. The absorbance values at pigment-
specific wavelengths were used to calculate chlorophylls and
carotenoids concentration 21. The pH differential method was used for
anthocyanin content assay 22. All the spectrophotometric
measurements were carried out with a Varian Cary 50 UV-VIS
spectrophotometer. Values of the abovementioned biochemical
parameters were expressed in adequate units, and reported per fresh
weight (i.e., g-1 FW). Data are averages of three measurements; standard
deviations did not exceed 10 %.

16
3. RESULTS AND DISCUSSION
3.1. Biometric parameters of wheat plants
The observed inhibition of wheat seedling elongation at the
highest tested concentration of Cr3+ (500 mol L-1) was about 25 %
compared to control plants, both at root and stem level (Figure 1a). By
contrast, a marked growth inhibition was noticed at the same
concentration of Cr2O72- in the growth medium, the respective wheat
seedlings having up to 92 % shorter roots and 67 % shorter stems,
compared to the unexposed plants (control; Figure 1b).
Figure 1. Growth parameters of wheat plants exposed to: a-Cr3+ b-Cr2O72-
Table 1. EC50 values for
the inhibitory effect of
Cr3+ and Cr2O72- on wheat
plants growth
EC50/mmol L-1
root stem
Cr3+ 1.22 1.39
Cr2O72- 0.15 0.23 Figure 2. Comparison of the EC50 values of
the tested metal ions for wheat growth
inhibition

17
Shortly, the inhibitory effect of Cr3+ on wheat plant elongation
was almost equal at root and stem level, while the oxyanion Cr2O72- was
more toxic on roots (Table 1). Compared with our previous results on
Cu2+, Cd2+ and Zn2+ toxicity 17, these data showed that Cr3+ was almost
as toxic as Zn2+ while Cr2O72- was less toxic than Cu2+ on roots but more
toxic on shoots (figure 2). The observed effects are related to chromium
speciation. Cr3+ binds tight to the anionic components of plant cell wall,
its mobility and bioavailability being low. Supposed to entry cells by
diffusion or endocytosis, chromium (III) cations are rather restrained
outside the cell because of the selective permeability of plasma
membrane. As a result of its low bioavailability, trivalent chromium
exhibits low toxicity. By contrast, chromium (VI) oxyanions are not
trapped at cell wall level, are more mobile in plant and can cross the
plasma membrane through transport proteins. Greater mobility
compared to Cr3+ explains for the observed greater toxicity of Cr2O72-
both at root and stem level.
3.2. Antioxidant and metabolic indexes of wheat plants exposed to heavy metals
In the leaves of wheat plants unexposed to heavy metals,
peroxidase activity was of 2.41 U g-1 FW. Enzyme’s activity doubled when
plants grew on media with 1 and 5 mol L-1 Cr2O72- as well as at 1 mol
L-1 Cr3+, and a 1.6 times increase was observed at 5 mol L-1 Cr3+.
Peroxidase responses were almost similar, irrespective the oxidation
state or tested concentrations of exogenous chromium (Figure 3a). The
observed boost of antioxidant defence may suggest an increased
generation of hydrogen peroxide. Marked increase of peroxidase
activity were previously reported in the leaves of wheat plants exposed
to excess copper and cadmium 17, 23, and appears as a first line of
defence in plants intoxicated with heavy metals.
Lipid peroxidation. The leaves of wheat plants grown in the
absence of heavy metal contamination had a concentration of secondary
lipid peroxidation products (TBARS- thiobarbituric acid reactive
substances) of approximately 100 mol g-1 FW. Increased lipid
peroxidation was noticed in chromium exposed plants, compared to
control: with 10 % in Cr3+probes and 45 % in Cr2O72- probes, at both 1

18
and 5 mol L-1 (Figure 3b). These data suggested that Cr2O72- exposure is
associated with advanced lipid peroxidation that could occur because of
the redox activity of chromium in vivo. Among the metals whose
phytotoxic effects were assayed within our studies, chromium, as
Cr2O72, appeared as the main promoter of lipid peroxidation.
Figure 3. Biochemical parameters of wheat plants exposed to Cr3+ and
Cr2O72-: a – peroxidase activity, b – secondary lipid peroxidation
products (TBARS) c –glucose, and d – soluble proteins
Glucose concentration in the leaves of unstressed wheat plants was
of 34.69 mol g-1 FW. Dose dependent increases of glucose concentration
were observed in Cr3+ probes, with 1.8 and 2.5 times respectively at the
two tested concentrations. Increased glucose concentration were also
noticed in Cr2O72- exposed wheat seedlings, with 4 and respectively 3
times greater than leaf glucose content in control plants (Figure 3c).
19
Thus, glucose concentration appeared as the most susceptible parameter
when excess chromium was present in plant’s growth media. Our
previous data on heavy metal exposed wheat seedlings also noticed
increased glucose levels in copper and cadmium probes, but to a less
extent than in chromium ones 17.
Under the given experimental condition, the amount of total
soluble proteins in the leaves of wheat plants unexposed to chromium
salts was of 60 mg g-1 FW. Compared to control plants, protein content
in wheat seedlings grown on media with excess Cr3+ was less than 10 %
greater. In case of Cr2O72- exposure, 25 % increases of the same
parameter were observed at both tested concentrations (Figure 3d).
Thus, variations of the soluble proteins content appeared to depend
more on exogenous chromium speciation than on its concentration.
Metal speciation in vivo is a complex and difficult to evaluate issue that
may have an essential impact on its effects. Our previous results on
wheat seedlings exposed to similar doses of Cu2+, Cd2+ and Zn2+ revealed
minor increases of soluble protein content in the leaves 17. These
results are consistent with the importance of proteins as fundamental,
structural and functional constituents of the living tissues.
3.2. Leaf pigments in wheat plants exposed to heavy metals
Concentrations of the photosynthetic pigments in control wheat
plants were as it follows: 1.52 μmol g-1 FW total chlorophylls (comprising
1.12 μmol g-1 FW Chl a and 0.4 mol g-1 Chl b) and 0.40 mol g-1 total
carotenoids. Leaf pigments concentration in plants grown on media
contaminated with chromium salts decreased in certain experimental
probes compared to control (Figure 4, a-c). Chlorophyll a content was 20
% lower than control at both 1 and 5 mol L-1 Cr3+, as well as at 1 mol L-
1 Cr2O72-; no difference from control was observed at 5 mol L-1 Cr2O72-.
Chlorophyll b concentrations decreased with 15 % at both 1 and 5 mol L-
1 Cr3+; a 25 % decrease was observed at 1 mol L-1 Cr2O72-, while no
variation compared to control was noticed at 5 mol L-1 Cr2O72-.
Carotenoids content decreased with 15 % compared to control at the
lowest chromium concentrations tested, irrespective the metal

20
speciation; less than 10 % decrease was observed at 5 mol L-1 Cr3+, and
no difference at 5 mol L-1 Cr2O72-.
Figure 4. Leaf pigments in wheat plants exposed to Cr3+and Cr2O72-:
a – chlorophyll a, b – chlorophyll b, c – carotenoids, and d –
antocyanins
The calculated values of Chl a:Chl b ratio for the heavy metal
exposed plants within our experiments, as well as those of Car:Chl ratio,
were quite similar to the ones of control plants (Table 2). Taking into
account both these data and those we’ve previously presented referring
to Cu, Zn and Cd effects 17, one can conclude that although lower
quantities of photosynthetic pigments were dosed in the leaves of
certain heavy metal exposed wheat plants compared to control plants,
values of the abovementioned indexes didn’t significantly vary
compared to control. Chl a:Chl b and Car:Chl ratios are often used to
assess whether photosystem I or photosystem II are affected or not by
different stresses to which plants are exposed 24. According to this
assumption, we can conclude that the experimental conditions in our
study didn’t significantly affect the photosystems. Modulation of the

21
pigments’ content served the purpose of adaptation and efficient use of
the light absorbed by the photosystems.
Leaf anthocyanins concentration in untreated wheat plants was of
0.16 mol g-1 FW. Compared to control plants, anthocyanin content in
the leaves of chromium exposed plants registered no increase or low
increase at 1 mol L-1 Cr3+ and Cr2O72-, respectively. By contrast, about 50
% greater anthocyanin concentrations than in control plants were dosed
in leaves of the wheat plants exposed to 5 mol L-1 of both tested
chromium salts (Figure 4, d).
Table 2. Chl a: Chl b and Car: Chl ratios for wheat plants exposed to Cr3+
and Cr2O72-
Cr salt Chl a: Chl b Car: Chl
μmol L-1 control Cr(III) Cr(VI) control Cr(III) Cr(VI)
1 2.8 2.71 3.03 0.32 0.33 0.33
5 2.8 2.66 2.92 0.32 0.34 0.32
Comparing these data with those presented in the first part of our
study, 50 % or more increased anthocyanin content vs. control was
observed at 5 mol L-1 of the tested heavy metals within the growth
media, while no significant differences were noticed at 1 mol L-1 17.
Thus, it appears that increased anthocyanin content was mostly related
to concentration than to speciation of chromium, being otherwise a non-
specific response to heavy metal excess. Among the tested metals within
this study, cadmium resulted as the most efficient inductor of
anthocyanin accumulation in the leaves of young wheat plants.
4. CONCLUSIONS
Growth inhibition of wheat seedlings was the net outcome of
their exposure for 7 days to chromium salts, at concentrations up 500
mol L-1 in their growth media. EC50 values for the observed inhibitory
effect pointed out that Cr2O72- was more effective than Cr3+ in this
regard. Biochemical indexes of wheat seedlings, at chromium

22
concentrations where no growth inhibition was observed, are suggestive
for the onset of defense responses. Among these, the most prominent
were: increased peroxidase, to cope excess hydrogen peroxide, increased
glucose concentration for cellular respiration, osmoregulation and
signalling, and increased anthocyanins content, for free radical
scavenging and photoprotection.
References
1. J. Emsley, Nature's Building Blocks: An A-Z Guide to the Elements,
Oxford University Press, London (2001).
2. N. T. Joutey, H. Sayel, W. Bahafid, N. El Ghachtouli, Rev. Environ.
Contam. Toxicol., 233 (2015) 46.
3. H. Oliveira, J. Bot., (2012) doi:10.1155/2012/375843.
4. C. VitiC. V, E. Marchi, F. Decorosi, L. Giovannetti, FEMS Microbiol.
Rev., 38 (2014) 633.
5. S. Younan, G. Z. Sakita, T.R. Albuquerque, R. Keller, H. Bremer-
Neto, J. Sci. Food Agric., 96 (2016) 3977.
6. K. R. Di Bona, S. Love, N. R. Rhodes, et al., J. Biol. Inorg. Chem., 16
(2011) 381.
7. J. B. Vincent, Met. Ions Life Sci., 13 (2013) 171.
8. S. S. Wise, J. P. Wise, Sr., Mutat. Res., 733 (2012) 78.
9. K. P.Nickens, S. R. Patierno, S. Ceryak, Chem. Biol. Interact., 188 (2010)
276.
10. A. Zhitkovich, Chem. Res. Toxicol., 24 (2011) 1617.
11. Y. Wang, H. Su H, Y. Gu, X. Song, J. Zhao, Onco Targets Ther., 10
(2017) 4065.
12. C. M. Thompson, L. C. Haws, M. A. Harris, N. M. Gatto, D. M.
Proctor, Toxicol. Sci., 119 (2011) 20.
13. H. P. Singh, P. Mahajan, S. Kaur, D. R. Batish, R. K. Kohli, Environ.
Chem. Lett., 11 (2013) 229.
14. M. A. da Conceição Gomes, R. A. Hauser-Davis, M. S. Suzuki, A. P.
Vitória, Ecotoxicol. Environ. Saf., 140 (2017) 55.
15. M. Shahid, S. Shamshad, M. Rafiq, S. Khalid, I. Bibi, N. K. Niazi, C.
Dumat, M. I. Rashid, Chemosphere, 178 (2017) 513.
16. V. Page, U. Feller, Ann. Bot-London, 96 (2005) 425.

23
17. G. Ciobanu, C. Ionescu, M. Mateescu, Annals of the University of
Craiova, The Chemistry Series, Volume XLIV, No 1, (2017) 36.
18. H. U. Bergmeyer, Methods of Enzymatic Analysis 1, Academic Press,
New York (1974).
19. H. H. Draper, M Hadley, Methods Enzymol., 186 (1990) 421.
20. M. M. Bradford, Anal. Biochem., 72 (1976) 248.
21. K. Lichtenthaler, Methods Enzymol., 148 (1987) 350.
22. R. E. Wrolstad, R. W. Durst, J. Lee, Trends Food Sci. Tech., 16 (2005)
423.
23. G.Matei, C. Babeanu, M. Soare, O. F.Birzanu, Annals of the University
of Craiova-Agriculture, Montanology, Cadastre Series, 43 (2013) 211.
24. R. Tanaka, A. Tanaka, Biochim. Biophys Acta, 1807 (2011) 968.

24
Azoethers and azoesters with antimicrobial activity
An overview
Anca Moanță,*, Cătălina Ionescu, Simona Iordache
University of Craiova, Faculty of Sciences, Department of Chemistry, Calea Bucuresti, 107i,
Craiova, Romania *E-mail: [email protected]
Received: 20.10.2017 / Accepted: 28.11.2017 / Published: 22.12.2017
Abstract
Infectious diseases are caused by the presence of bacteria and fungi in living
organisms. Many drugs are used to combat them: sulfonamides, tetracyclines,
quinolones, polypeptides, penicillins, cephalosporins, cabapenems, aminoglycosides.
In recent years, many azoderivatives have been studied and have been shown to
exhibit antimibrobial activity. This paper provides a review regarding the
azomonoethers and the azoesthers with antibacterial or antifungal activity.
Keywords: azoderivatives, 4-(phenylazo)phenoxyacetic acids, azoethers, azoesters,
antimicrobial activity
Annals of the University of Craiova
The Chemistry Series
Volume XLIV, No. 2 (2017) 24-35 homepage: c himie .u cv.ro/ anale/

25
1. INTRODUCTION
Azoderivatives are organic compounds possessing an azo group.
They have the general formula R-N=N-R, where R is an aryl radical.
They have possible applications in fibres dyeing, biochemistry, biology,
medicine, analytical chemistry, but also as alimentary additives,
chromophores in non-linear optics and in the inhibition of carbon-steel
corrosion [1,2].
In recent years, many studies have been devoted to the synthesis
of azoderivatives possessing different types of bioactivities: antibacterial
[3,4], antifungal [5], anti-inflammatory [6,7] and antiviral activities [8].
Congo red exhibits ameliorative effects in models of neurodegenerative
disorders: Alzheimer’s, Parkinson’s, Huntington’s and prion diseases
[9].
In this review, four types of azoderivatives that have
antimicrobial activity: 4-(phenylazo)phenoxyacetic acids [10-12], 4-
phenyldiazenyl-4’-[(4-chlorobenzyl)oxy]biphenyls [13], 4-[(4-
chlorobenzyl)oxy]azobenzenes [14,15] and 4-(phenyldiazenyl)phenyl
benzenesulfonate [16] are presented.
1. 4-Phenylazophenoxyacetic acids
The 4-(phenylazo)phenoxyacetic acids contain an azo group, a
carboxyl group and two aromatic rings, substituted with various
substituents: chloro, bromo, methyl or allyl. They were prepared by the
condensation of sodium salts of corresponding substituted 4-phenylazo-
phenols with chloroacetic acid in alkaline medium, using Williamson
method (Scheme 1).
N N ONa + ClCH2COONa
R1R2
N N OCH2COOH
R1R2
1.HO-/H2O
2.HCl
R1=H, Cl, Br, allyl, CH3, R2=H, Cl, CH3 (see Table 1)
Scheme 1. Synthesis of the 4-(phenylazo)phenoxyacetic acids

26
Table1. Antimicrobial activities of 4-(phenylazo)phenoxyacetic acids
No. Compound Diameter of zone of inhibition in mm
S.
aureus
S.
pyogenes
E.
coli
P.
aeruginosa
P.
vulgaris
1 2-methyl-4-phenylazo-
phenoxyacetic acid
15 7 18 15 20
2 3-methyl-4-phenylazo-
phenoxyacetic acid
16 18 7 13 15
3 4-(2-methyl-phenylazo)-
phenoxyacetic acid
18 20 21 10 20
4 2,3-dimethyl-4-phenylazo-
phenoxyacetic acid
8 10 12 15 8
5 2,6-dimethyl-4-phenylazo-
phenoxyacetic acid
8 7 9 20 20
6 2-methyl-4-(4-methyl-phenylazo)-
phenoxyacetic acid
9 10 7 10 12
7 4-(4-chloro-phenylazo)-
phenoxyacetic acid
18 - 9 20 -
8 2,5-dichloro-4-(4-chloro-
phenylazo)-phenoxyacetic acid
22 20 - - -
9 2-chloro-4-phenylazo-
phenoxyacetic
12 - 7 15
10 2-bromo-4-phenylazo-
phenoxyacetic
16 - - - -
11 2-allyl-4-(4-chloro-4-phenylazo)-
phenoxyacetic
18 - - - -
These acids are colored powders. The color of compounds is also
confirmed by the UV-Vis spectra containing a low intensity R-band at
430-452 nm, due to the -N=N- chromophore. A middle intensity B-band
at 220-248 nm, consequently to the π electrons conjugation from the
aromatic rings and an intense absorption K-band at 344-362 nm, as the
result of the conjugated system Ar-N=N-Ar were also observed. Other
evidence to confirm the structure was obtained from the IR, 1H-NMR
and mass spectra. IR spectra show absorption bands specific to –COOH
(3473-3453 cm-1 and 1740-1680 cm-1), –N=N- (1600-1550 cm-1 and 1430-
1400 cm-1), Ar-O-CH2 (1276-1200 cm-1 and 1078-1000 cm
-1), and to the
aromatic rings (1600-1450 cm-1). The fragmentation observed in mass
spectra is achieved by the cleavage of the bond between the C of the
methylene group and C atoms of the carboxyl, the C-N bonds and the
O-CH2 bond. Three commun signals appear in the 1H NMR spectra of all

27
compounds: a singlet at δ=4.5-5.5 ppm (CH2 group), a singlet at δ=10.1-
11.1 ppm (COOH protons), a multiplet at δ=6.9-8.7 ppm (the aromatic
protons).
The 4-phenylazo-phenoxyacetic acids thus described were
subjected to antimicrobial activity screening against two gram-positive
bacteria (S. aureus and S. pyogenes), three gram-negative bacteria (P.
aeruginosa, P. vulgaris and E. coli) and one fungi species (C. albicans)
employing the disk diffusion technique (Table 1).
The best efficiency was exhibited by all compounds having a
methyl substituent. All tested compounds tested are inactive against C.
albicans species.
2. 4-phenyldiazenyl-4’-[(4-chlorobenzyl)oxy]biphenyls
4-phenyldiazenyl-4’-[(4-chlorobenzyl)oxy]biphenyls are
derivatives of biphenyl having two radicals in para positions: phenylazo
and (4-chlorobenzyl)oxy. They can be substituted by chlorine and
methyl groups. They are azomonoethers prepared using the
etherification of the corresponding sodium salts of substituted 4'-
phenyldiazenyl-biphenyl-4-ols with 1-chloro-4-(chloromethyl)benzene
in alkaline medium (Scheme 2) employing the Williamson method.
Scheme 2. Synthesis of the 4-phenyldiazenyl-4’-[(4-chlorobenzyl)oxy]
biphenyls

28
The structure of these compounds has been investigated on the
basis of UV-visible, IR, 1H NMR and mass spectra.
The electronic spectra, recorded in dioxan, exhibit a R-band due
to azo-group at 432-452 nm, a high intensity K-band due to the
conjugated system Ar-N=N-Ar at 338-344 nm and a high intensity B-
band due to the aromatic rings at 234-263 nm.
The infrared spectra confirm the presence of azo and ether groups
in the structure of the obtained compounds. The vibration frequency of
the N=N group appears at 1400-1413 cm-1. The proofs of the
etherification reaction between the hydroxyl group of azophenol and
the 1-chloro-4-(chloromethyl)benzene are:
-the absence in the IR spectra of the bands characteristic for the
hydroxyl group;
-the presence of absorption bands of the C-O-C newly formed
group; thus spectrum contains an intensive absorption band at 1260-
1280 cm−1 which can be assigned to the antisymmetrical valence
vibrations of the C-O-C group and a moderate absorption band due to
the symmetrical valence vibrations of the C-O-C group at 1013-1014 cm-
1.
The 1H NMR spectra of all compounds show that the signal of the
CH2 group appears like a singlet at values between δ = 5.0 - 5.5 ppm. The
aromatic protons from the four substituted benzene rings came into
resonance as a multiplet at δ = 7.2 - 7.7 ppm. For 4-(4-methyl-
phenyldiazenyl)-4'-[(4-chlorobenzyl)oxy]biphenyl an additional singlet
is present at δ = 2.2 ppm, corresponding to the methyl group protons.
The fragmentation pattern described in Scheme 3 for 4-
phenyldiazenyl-4'-[(4-chlorobenzyl)oxy]biphenyl, is characteristic for all
compounds:
N N O CH2 Cl-C18H13ON2
Cl CH2
m/z 398 m/z 125
Scheme 3. Fragmentation of 4-phenyldiazenyl-4'-[(4-chlorobenzyl)oxy]
biphenyl under electron impact ionization

29
Scheme 3 shows a major fragmentation of 4-phenyldiazenyl-4'-
[(4-chlorobenzyl)oxy]biphenyl in which the molecular ion peak at m/z
398 is abundant and the molecule tends to undergo a cleavage of the O-
CH2 bond to give the base peak at m/z 125.
The antibacterial activity of the investigated 4-phenyldiazenyl-4'-
[(4-chlorobenzyl)oxy]biphenyls was done by microdiscs paper diffusion
against three gram-positive bacteria (S. aureus, S. pyogenes, B. subtilis)
and four gram-negative bacteria (K. pneumonia, S. paratyphae, P. vulgaris
and E. coli). Chloramphenicol was used as standard drug.
Table 2. Antimicrobial activities of the 4-phenyldiazenyl-4’-[(4-
chlorobenzyl)oxy] biphenyls
No. Name of compound Diameter of zone of inhibition in mm / Relative percentage
of inhibition in %
S.
paratyphae
E.
coli
B.
subtilise
K.
pneumonia
P.
vulgaris
1 4-phenyldiazenyl-4'-[(4-
chlorobenzyl)oxy]biphenyl
21.66/
81.45
21.33/
50.55
23.33/
54.43
10/
12.75
24.66/
97.29
2 4-(4-methyl-
phenyldiazenyl)-4'-[(4-
chlorobenzyl)oxy]biphenyl
20/
69.44
24.66/
67.56
26/
75.11
11.33/
16.37
22.33/
72.79
3 4-(4-chloro-
phenyldiazenyl)-4'-[(4-
chlorobenzyl)oxy]biphenyl
22.33/
86.56
28/
87.11
24.33/
65.77
12/
18.36
18/
51.84
4 4-(2-chloro-
phenyldiazenyl)-4'-[(4-
chlorobenzyl)oxy]biphenyl
18.66/
60.45
30/
100
11.66/
85
11.66/
17.34
16.66/
44.40
5 4-(3,4-dichloro-
phenyldiazenyl)-4'-[(4-
chlorobenzyl)oxy]biphenyl
19.33/
64.87
25.33/
71.29
12.66/
83
12.66/
20.44
17/
46.24
6 Chloramphenicol 24 30 30 28 25
Results revealed that in general, all tested compounds possessed
good antibacterial activity against three gram-negative bacteria (S.
paratyphae, P. vulgaris and E. coli). The best efficiency at the tested
concentrations was exhibited by 4-(2-chloro-phenyldiazenyl)-4'-[(4-
chlorobenzyl)oxy]biphenyl against E. Coli and by 4-phenyldiazenyl-4'-
[(4-chlorobenzyl)oxy]biphenyl against P. vulgaris (Table 2). The
compounds exhibited moderate activity against K. pneumonia.
Interpretation of antibacterial screening data revealed that all the tested
30
compound showed good inhibition on the growth of B. subtilis (Table 2).
All tested 4-phenyldiazenyl-4'-[(4-chlorobenzyl)oxy]biphenyls are
inactive against S. pyogenes and S. aureus.
The results of antibacterial activity of the tested compounds were
compared with the standard drug for evaluating their relative
percentages of inhibition (Table 2). The maximum relative percentage of
inhibition was exhibited by 4-(2-chloro-phenyldiazenyl)-4'-[(4-
chlorobenzyl)oxy]biphenyl against E. coli (100 %), followed by 4-
phenyldiazenyl-4'-[(4-chlorobenzyl)oxy] biphenyls against P. vulgaris
(97.29 %).
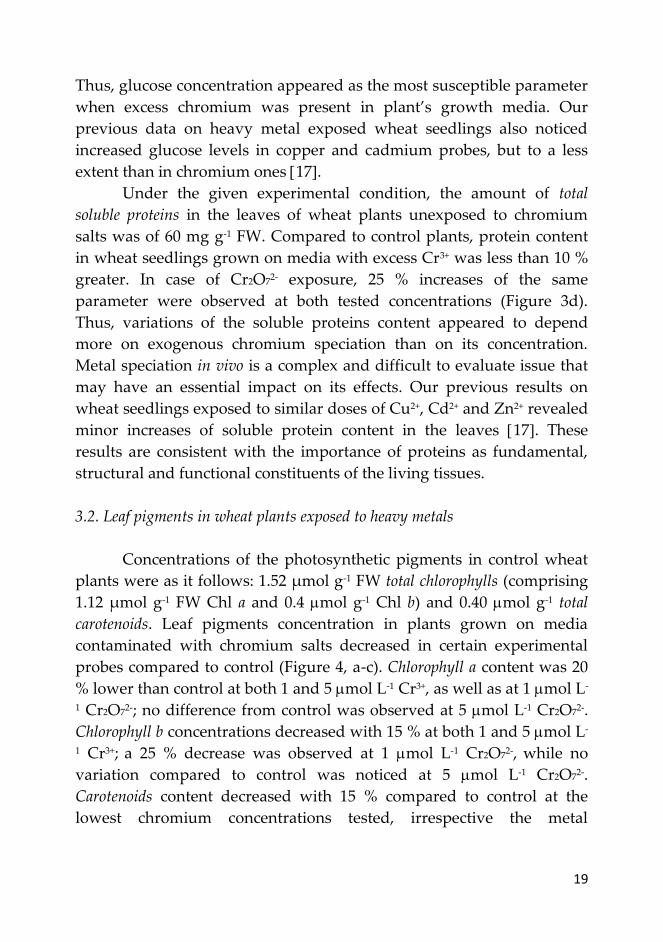
3. 4-[(4-chlorobenzyl)oxy]azobenzenes
4-[(4-Chlorobenzyl)oxy]azobenzenes are azomonoethers having
the general formula:
R1=H, Cl, CH3; R2=H, Cl; R3=H, CH3; R4=H, Cl, CH3; R5=H, CH3; R6=H, Cl,
CH3;
Scheme 4. Structure of 4-[(4-chlorobenzyl)oxy]azobenzenes
Ten azomonoethers were prepared by condensation of 4-
chloromethyl-chlorobenzene with various azophenols substituted by
chlorine and methyl groups. The Williamson method for the preparation
of ethers was used. This method has also been used to synthesize
azomonoethers, azobisethers, bisazobisethers and poliazoarylenethers
[1].
Their structure was assumed from the chemical reaction
equation. It was confirmed using spectral methods. In UV-Vis spectra,
various bands were observed: E bands at la 235-247 nm (π→π*
transitions), B bands at 247-250 nm (aromatic rings), K bands at 345-370
nm (conjugate system Ar-N=N-Ar) and R bands at 435-440 nm (azo
group). IR spectra show absobtion bands characteristic of the group of
N N O CH2 ClR1
R3
R2
R5
R6
R4

31
atoms in the molecule: C-H from CH3 groups at 2918-2906 cm-1, azo
group at 1430-1400 cm-1 and 1603-1567 cm-1, C-O-C group at 1200-1300
cm-1 and C-Cl at 818-812 cm-1. NMR 1H spectra contain two signals: one
multiplet at 6.1-7 ppm (aromatic protons) and un singlet at 3.6-4.3 ppm.
Azomonoethers containing a methyl group present also have a singlet at
1.1-1.8 ppm (-CH2-). Mass spectra provide additional evidence for the
structure of these azomonoethers. They were used to determine the
molecular weight.
The fragmentation pattern described in Scheme 5 for 4-[(4-
clorobenzil)oxi]-2'-cloro-azobenzen, is characteristic for all
azomonoethers:
Scheme 5. Fragmentation of 4-[(4-clorobenzil)oxi]-2'-cloro-azobenzen
under electron impact ionization
The O-CH2 bond is breaks and a base peak is formed at m/z 125
for all compounds.
Antimicrobial activity of azomonoethers was tested against S.
aureus, S. pyogenes, P. aeruginosa, P. vulgaris, E. coli and C. albicans using
the disk diffusion method. All bacteria are resistant to the presence of
test compounds. The growth of C. albicans is inhibited by four isomers.
Thus, the diameter of the inhibition zone is 20 mm, 15 mm, 12 mm and
18 mm for 4-[(4-chlorobenzyl)oxy]-2-methyl-4'-chloro-azobenzene, 4-[(4-
chlorobenzyl)oxy]-3-chloro-4'-methyl-azobenzene, 4[(4-
clorobenzyl)oxy]-3-methyl-4'-chloro-azobenzene and 4-[(4-
chlorobenzyl)oxy]-2-methyl-2'-chloro-azobenzene, respectively.
m/z 356
-C12H8ON2Cl.
Cl
ClCH2ONN
+.
m/z125
Cl CH2
+

32
4.4-(phenyldiazenyl)phenyl benzenesulfonate
4-(Phenyldiazenyl)phenyl benzenesulfonate (PPB) is an azoester
containing SO2 group and azo group. PPB was synthesized because:
a) It is know that there are a lot of compounds carrying SO2 groups and
having antimicrobial activity against S. aureus, E. coli, C. albicans and C.
parapsilosis [17-18].
b) A great number of azoderivatives are reported to show a
antimicrobial activity: 2-[(E)-2-(3-acetyl-4-hydroxyphenyl)1-
diazenyl]benzoic acid [19], 4-phenylazo-phenoxyacetic acids having
chloro or methyl substituents [10], 4-[(4-chlorobenzyl)oxy]azobenzenes
[14] and 4-phenyldiazenyl-4’-[(4-chlorobenzyl)oxy]biphenyls [13].
PPB was obtained by a coupling reaction between 4-
(phenyldiazenyl)phenol and benzenesulfonyl chloride in the presence of
pyridine [20]. The structure of the azo-ester is shown in Scheme 6.
N N OSO2
Scheme 6. Structure of PPB
The structure of the compound was demonstrated using:
-UV-Vis spectra in dioxane (λmax=321 nm, λmax=441 nm for azo group);
-FTIR spectra (C6H5-N=N-, -C-C-, -C=C-, C6H5-SO2-, C6H5-SO3-, C6H5-O-,
C6H5-);
-1H NMR (aromatic protons between 7.13 ppm and 7.91 ppm).
-mass spectra under electron impact (base peak at m/z 77, molecular
peak at m/z 338).
PPB was screened for its antimicrobial activity against two gram-
positive bacteria (S. aureus and S. pyogenes), three gram-negative bacteria
(P. aeruginosa, P. vulgaris and E. coli), and two fungi species (C. albicans
and A. niger). The antimicrobial inhibition zones (mm) were determined
using the disk diffusion method. Cloramfenicol was used as standard
drug (Figure 1) and methanol served as control.

33
Table 3. Antimicrobial activity of PPB
Name of
organisms
Mean zone of inhibition ± Standard
deviation (mm)
Relative percentage
inhibition
(%) PPB Cloramfenicol Methanol
Staphylococcus
aureus
18.33 ±
0.62
20 ± 1.58 0 83.99
Streptococcus
pyogenes
7.66 ±
0.94
21 ± 1.41 0 13.30
Pseudomonas
aeruginosa
12.33 ±
0.62
20 ± 0.70 0 38
Proteus vulgaris 10.33 ±
1.17
25 ± 2.16 0 17.07
Escherichia coli 19.66 ±
0.23
30 ± 0.70 0 42.94
Candida albicans 24 ±
0.20
26 ± 0.81 0 85.20
Aspergillus niger 18 ±
0.35
22 ± 0.70 0 66.94
Figure 1. Antimicrobial activity of PPB
As it can be seen from the Table 3, PPB showed antibacterial
activity against S. aureus and S. pyogenes with inhibition zones of 8 and

34
18 mm, respectively. The most potent activity was observed against S.
aureus. Similarly, PPB also showed high antibacterial activity against
gramnegative bacteria with inhibition zones between 12 and 20 mm. As
shown in Table 3, PPB showed antifungal activity against C. albicans,
with an inhibition zone of 24 mm. The tested compound also showed
antifungal activity against A. niger with an inhibition zone of 18 mm.
The results of the antimicrobial activity of PPB were compared
with those of cloramfenicol and they are gathered in Table 3. The
maximum relative percentage of inhibition was exhibited against C.
albicans (85.20 %) followed by S. aureus (83.99 %), A. niger (66.94 %), E.
coli (42.94 %), P. aeruginosa (38 %), P. vulgaris (17.07 %), and S. Pyogenes
(13.30 %), respectively.
CONCLUSIONS
Some azoderivatives have antimicrobial activity due to the
presence of the azo group. 4-Phenylazo-phenoxyacetic acids having
methyl substituent exhibit good antibacterial activity. The tested 4-
phenyldiazenyl-4’-[(4-chlorobenzyl)oxy]biphenyls showed antibacterial
activity. Four 4-[(4-chlorobenzyl)oxy]azobenzene isomers inhibit the
growth of C. albicans. PPB presents the highest antibacterial activity
against S. aureus.
References
1. S. Radu, C. Şarpe-Tudoran, A. Jianu, G. Rău, Rev. Roum. Chim., 43
(1998) 735.
2. A. Moanţă, B. Tutunaru, P. Rotaru, J. Therm. Anal. Calorim., 111
(2013) 1273.
3. E. Ispir, Dyes Pigm., 82 (2009) 13.
4. S. Alghool, H. F. Abd El-Halim, A. Dahshan, J. Mol. Struct., 983
(2010) 32.
5. H. Xu, X. Zeng, Bioorg. Med. Chem. Lett., 20 (2010) 4193.
6. Z. B. Zhao, H. X. Zheng, Y. G. Wei, J. Liu, Chinese Chem. Lett., 18
(2007) 639.

35
7. S. S. Dhaneshwar, M. Kandpal, G. Vadnerkar, B. Rathi, S. S. Kadam,
Eur. J. Med. Chem., 42 (2007) 885.
8. M. Tonelli, V. Boido, C. Canu, A. Sparatore, F. Sparatore, M. S.
Paneni, M. Fermeglia, S. Pricl, P. La Colla, L. Casula, C. Ibba, D.
Collu, R. Loddo, Bioorg. Med. Chem., 16 (2008) 8447.
9. P. Frid, S. V. Anisimov, N. Popovic, Brain Res Rev., 53 (2007) 135–60.
10. A. Moanţă, S. Radu, Rev. Roum. Chim., 54 (2009) 151.
11. A. Moanţă, S. Radu, Rev. Chim. (Bucharest), 59 (2008) 708.
12. S. Radu, M. Băniceru, A. Jianu, G. Rău, Rev. Roum. Chim., 46 (2001)
63.
13. A. Moanță, J. Chi. Chem. Soc., 59 (2014) 2275.
14. A. Moanţă, S. Radu, G. Rău, Rev. Chim. (Bucharest), 58 (2007) 229.
15. S. Radu, A. Moanţă, G. Rău, Rev. Chim. (Bucharest), 52 (2001) 619.
16. A. Moanţă, C. Ionescu, M. Dragoi, B. Tutunaru, P. Rotaru, J. Therm.
Anal. Calorim., 120 (2015) 1151.
17. S. M. Abdallah, H. A. Hefny, Turk J Chem., 35 (2011) 463.
18. D. S. Dogruer, S. Urlu, T. Onkol, B. Ozcelik B, M. F. Sahin, Turk. J.
Chem., 34 (2010) 57.
19. A. M. A. Hamil, M. M. El-ajaily, H. A. A. Bogdadi, Int. J. Pharm. Tech.
Res., 1 (2009) 1714.
20. E. Grandmougin, H. Freimann, Zur. J. Pr. Chem., 78 (1909) 384.

36
Investigating the coordination manner of a heterocyclic
thioamide to Pt(II) by EHT interpretation of the electronic
spectra for both free and coordinated organic ligand
Research article
Liana Simona Sbîrnã1*, Sebastian Sbîrnã2, Anișoara Oubraham3
1 University of Craiova, Faculty of Sciences, Department of Chemistry, Calea București, 107i,
Craiova, Romania 2Alro S. A., Strada Pitești, 116, Slatina, Romania 3 National R&D Institute for Cryogenics and Isotopic Technologies - ICIT Rm. Vâlcea, Romania *e-mail: [email protected]
Received: 17.11.2017 / Accepted: 14.12.2017 / Published: 22.12.2017
Abstract
The present paper reports the results of a quantum-mechanical study that consists in
interpreting the electronic spectra exhibited by a heterocyclic thioamide (namely 3-
thiobenzoylamino-dibenzofuran) and its complex compound formed with Pt(II) by
means of EHT (Extended Hückel Theory) calculation.
As a result of investigating the energies and EHT expressions of the molecular orbitals
in the frontier zone, we can decide which of the heteroatoms contained in the organic
molecule are the ones involved in the coordination and, therefore, which is the real
structural formula of the complex compound.
Keywords: heterocyclic thioamides, Pt(II) complex compounds, electronic spectra,
frontier molecular orbitals, EHT calculation
Annals of the University of Craiova
The Chemistry Series
Volume XLIV, No. 2 (2017) 36-47 homepage: c himie .ucv.ro/ anale/

37
1. INTRODUCTION
Particular attention has been payed lately to the branch of
coordinative chemistry involving the complex compounds formed by a
platinum ion with heterocycles that can act as ligands (therefore using
heteroatoms as electron donors [1-4]).
Such complex compounds have been synthesized and then
structurally investigated using elemental analysis, followed by regular
physical-chemical analyses (such as molar conductivity and magnetic
behavior measurements, mass spectrometry, infrared and electronic
spectroscopy [1-4]).
This paper deals with a complex compound formed by a d8
transition metal ion (divalent platinum) with a molecule (heterocyclic
thioamide) that can act as bidentate ligand, but it is not obvious which
pair of heteroatoms it involves in the coordination. Consequently, the
purpose of the present work is to establish, by quantum-mechanical
means, the actual coordination manner.
2. MATERIALS AND METHODS
2.1. Materials
Platinum dichloride 98 % (Sigma-Aldrich) was used to react with
double recrystallized 3-thiobenzoylamino-dibenzofuran. We also used
ethanol, diethyl ether and acetone, all these chemicals being of analytical
grade.
The elemental analysis was performed on a Perkin Elmer 2380
(USA) analyzer. The magnetic susceptibility of the complex was
investigated using a Holmarc Gouy's Method Apparatus, Model HO-
ED-EM-08 (India), whereas its electrical conductivity was measured on a
Radelkis OK-102/1 (Hungary) conductivity meter, for which the cell
constant is 0.9 cm-1.
Both electronic spectra were performed in 10-3 M acetone
solutions, with an Ocean Optics (UK) spectrophotometer.

38
The software that we have used to simulate the molecular
structures was HyperChem 8.0.10 program (trial version [5]).
2.2. Methods
The heterocyclic thioamide (3-thiobenzoylamino-dibenzofuran)
was obtained as described by Florea [6]. Then, its complex compound
with Pt(II) has been prepared following the method proposed by Jensen
and Nielsen [7].
An ethanolic solution (0.02 M) of the thioamide was added –
dropwise and continuously stirring – to an aqueous solution of
platinum dichloride (also 0.02 M) in a 1:1 ratio.
After gently stirring for one hour, the reaction vessel was left for
three more hours to settle at room temperature. Then, the product was
finally filtered off, washed with ethanol and diethyl ether and dried
under reduced pressure.
The isolated complex compound fine crystalline precipitate was
washed with diethyl ether and air dried.
3. RESULTS AND DISCUSSION
3.1. Preliminary statements
The elemental analysis has shown that the complex compound
contained (besides the metal ion) only one molecule of organic ligand
and two chloride ions.
This statement is sustained by the fact that it appears to be a non-
electrolyte and, moreover, a diamagnetic compound.
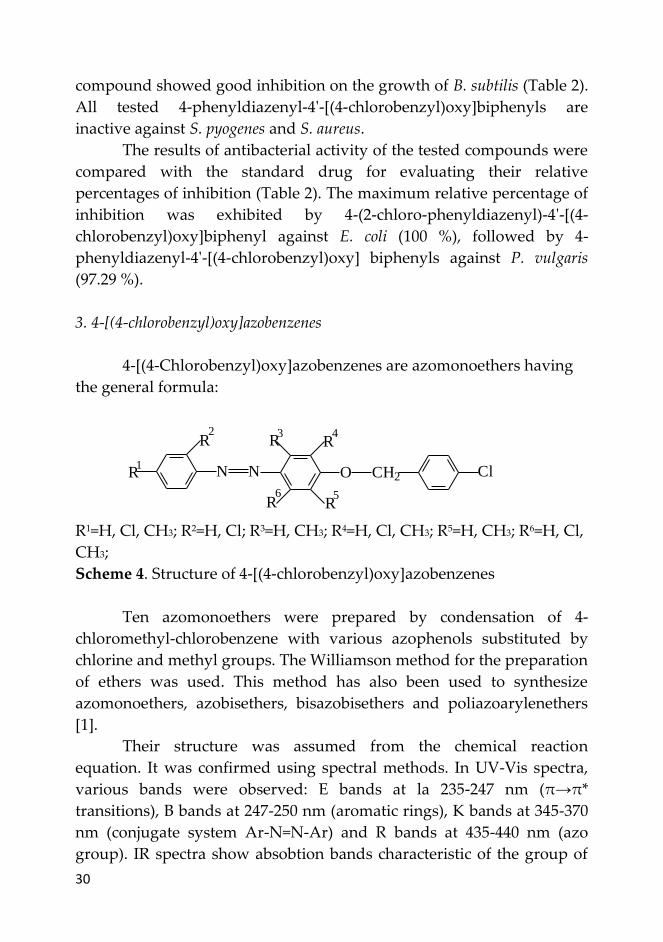
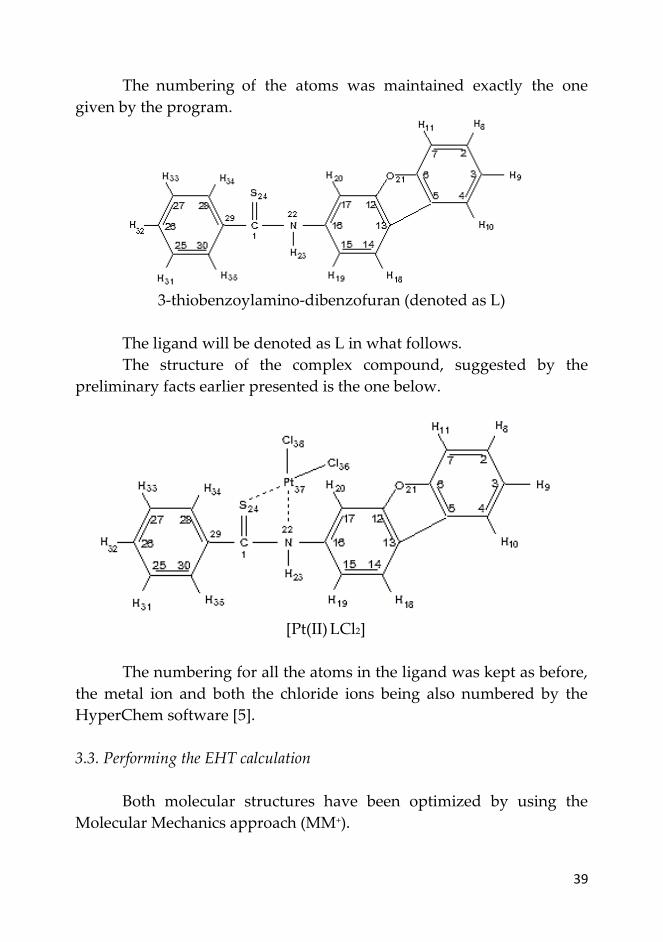
3.2. Structure of the ligand and complex compound
The structure of the free ligand is the one shown below. As we
have written before, the software that used to simulate it was
HyperChem 8.0.10 (trial version [5]).
39
The numbering of the atoms was maintained exactly the one
given by the program.
3-thiobenzoylamino-dibenzofuran (denoted as L)
The ligand will be denoted as L in what follows.
The structure of the complex compound, suggested by the
preliminary facts earlier presented is the one below.
[Pt(II) LCl2]
The numbering for all the atoms in the ligand was kept as before,
the metal ion and both the chloride ions being also numbered by the
HyperChem software [5].
3.3. Performing the EHT calculation
Both molecular structures have been optimized by using the
Molecular Mechanics approach (MM+).

40
In order to perform the EHT (Extended Hückel Theory)
intepretation, the cartesian coordinates of the atoms corresponding to
the bond lengths and angles obtained have been used as input data for
ICONC program [8], an improved version of Hoffmann's ICON which
was proposed by Calzaferri and Brände.
Within this software, the VSIP parameters were used, as
proposed by Gray [9].
The output data of ICONC are the mixing coefficients showing
the involvement of each atomic orbital (AO) in every molecular orbital
(MO).
The EHT calculation was performed without iteration upon
charge and configuration, as the EHT practice shows that the results
thus acquired are more reliable if the electronic transitions between MO
levels are compared with the spectral ones.
3.3. Frontier molecular orbital energy levels
The energy levels of the frontier molecular orbitals are indicated
by the Extended Hückel ICONC program.
Table 1. Frontier molecular orbital energy levels for the ligand, L
Molecular
orbital
Electron
occupation
Energy (eV)
Ψ43 0 -6.80183
Ψ 44 0 -7.19892
Ψ 45 0 -7.35523
Ψ 46 0 -7.52359
Ψ 47 0 -8.44770
Ψ 48 0 -10.01689
Ψ 49 2 -10.93975
Ψ 50 2 -11.40118
Ψ 51 2 -11.44855
Ψ 52 2 -11.91661

41
The energetic values are labeled below for the frontier molecular
orbitals of the free ligand (which are denoted by Ψ) and also for the ones
of the Pt(II) complex compound (which are denoted by Ψ’) – as seen
from tables 1 and 2.
Table 2. Frontier molecular orbital energy levels for [Pt(II) LCl2]
Molecular
orbital
Electron
occupation
Energy (eV)
Ψ’ 48 0 -6.83538
Ψ’ 49 0 -7.22834
Ψ’ 50 0 -7.26227
Ψ’ 54 0 -8.89248
Ψ’ 55 2 -9.50260
Ψ’ 56 2 -9.81242
Ψ’ 57 2 -9.82219
Ψ’ 58 2 -11.60287
Ψ’ 59 2 -11.99239
3.4. Frontier molecular orbital expressions
The expressions of the frontier molecular orbitals are obviously
not directly given by the Extended Hückel ICONC program, but we
could write them by using the mixing coefficients indicated as its output
data (keeping only the significant ones, i.e., the ones exceeding the value
0.1).
For the free ligand, the frontier molecular orbital expressions,
containing only the most significant mixing coefficients, are given
below:
Ψ 43 ≈ -0.3029C2(x)-0.2653C2(y)+0.1409C2(z)+0.4514C3(x)+0.3947C3(y)-
-0.2063C3(z)-0.2270C4(x)-0.1996C4(y)-0.1883C5(x)-0.1710C5(y)+
+0.4069C6(x)+0.3646C6(y)-0.1966C6(z)+0.1909C12(x)+0.1897C12(y)-
-0.2604O21(x)-0.2494O21(y)
Ψ 44 ≈ 0.5963C25(y)+0.2574C25(z)+0.3560C26(x)+0.1747C27(y)-0.3762C27(z)+
+0.1797C28(x)+0.4747C8(z)-0.1902C29(z)-0.4524C30(y)-0.1731C30(z)

42
Ψ 45 ≈ -0.2712S24(y)+0.2301S24(z)+0.3397C1(y)-0.3904C1(z)+0.1734C2(x)+
+0.1513C2(y)-0.2785C4(x)-0.2467C4(y)+0.1938C5(x)+0.1629C5(y)-
-0.2774C7(x)-0.2446C7(y)-0.2477N22(y)+0.1800N22(z)-0.1835C25(y)-
-0.1610C25(z)+0.1975C28(y)-0.1515C29(z)+0.2835C30(z)
Ψ 46 ≈ -0.1867C1(y)+0.2067C1(z)-0.2422C4(x)-0.2153C4(y).2425C7(x)-
-0.2086C7(y)-0.3337C12(x)-0.3373C12(y)+0.1535C12(z)+
+0.2125C14(x)+0.2974C14(y)-0.1855C14(z)+0.2617C17(x)+
+0.2764C17(y)
Ψ 47 ≈ -0.2040S24(y)+0.2216S24(z)+0.2031C1(y)-0.2756C1(z)-0.2149C2(x)-
-0.1871C2(y)+0.2167C4(x)+0.1870C4(y)-0.1795C5(x)+0.1553C7(x)-
-0.1816C13(x)-0.1885C13(y)+0.2884C14(x)+0,3857C14(y)-0.2438C14(z)-
-0.1980C16(x)-0.2738C16(y)+0.2845C17(x)+0.3327C17(y)
Ψ 48 ≈ 0.5406C26(x)-0.2417C26(y)-0.1748C27(y)+0.5655C27(z)-0.2350C29(y)-
-0.2029C29(z)+0.2263C30(y)+0.1848H31(s)+0.1960H32(s)+0.1766H33(s)+
+0.1760H34(s)
Ψ 49 ≈ 0.8308S24(x)-0.3231S24(y)
Ψ 50 ≈ 0.2356N22(x)+0.2585N22(y)+0.1920S24(x)-0.2595S24(y)+0.4967S24(z)+
+0.2004C13(x)-0.1952C15(y)+0.2486C26(x)-0.2525C27(z)+0.1787C29(x)+
+0.1621C29(z)+0.1852C30(y)
Ψ 51 ≈ -0.4113C26(x)+0.2162C26(y)+0.3563C27(z)-0.2494C29(x)-0.2619C29(z)-
-0.2874C30(y)
Ψ 52 ≈ 0.4860O21(x)+0.4581O21(y)-0.2165O21(z)+0.1891C3(x)+0.1547C3(y)-
-0.1925C7(x)-0.1797C7(y)-0.1744C13(x)+0.2282C15(y)-0.1506C17(x)-
-0.2284C17(y)
For the complex compound, the frontier molecular orbital
expressions, also containing only the most significant mixing
coefficients, are the following:
Ψ’48 ≈ 0.2577C2(y)+0.4103C3(y)+0.1937C3(x)-0.2207C4(y)-0.1469C5(y)+
+0.3829C6(y)-0.1810C6(x)-0.2097C12(x)+0.4411C12(y)-0.2773C14(y)+
+0.3600C15(y)-0.1456C16(y)-0.2686C17(y)+0.1714O21(x)-0.3613O21(y)
Ψ’49 ≈ 0.1886C3(x)-0.3997C3(y)-0.1818C4(x)+0.3828C4(y)+0.1959C6(x)-
-0.4151C6(y)-0.1672C7(x)+0.3526C7(y)-0.1730C12(x)+ 0.3638C12(y)+
+0.1537C14(x)-0.3182C14(y)-0.1639C15(x)+0.3312C15(y)+0.1502C17(x)-
-0.3193C17(y)
Ψ’50 ≈ 0.4958C30(x)+0.3090C30(y)-0.5282C25(x)-0.3393C25(y)+0.4419C27(x)+

43
+0.2829C27(y)-0.4759C28(x)-0.3089C28(y)
Ψ’54 ≈ -0.8364Ni37(xy)-0.2863Ni37(x2-y2)+0.2796Ni37(z2)+0.1721N22(y)+
+0.2021Cl36(y)+0.1819Cl38(y)
Ψ’55 ≈ -0.6748Ni37(x2-y2)-0.4288Ni37(xz)+0.2134Ni37(xy)-0.3301Ni37(xz)+
+0.2176S24(x)+0.1530S24(y)-0.2040C1(x)-0.1517Cl38(x)
Ψ’56 ≈ -0.6706Ni37(yz)-0.4268Ni37(xz)-0.2019Ni37(xy)-0.5523Ni37(z2)+
+0.1687S24(x)
Ψ’57 ≈ -0.5926Ni37(xz)-0.3225Ni37(yz)-0.2476S24(x)-0.1823S32(y)+
+0.3874C1(x)+0.2721C1(y)-0.2281C30(x)+0.2466C27(x)+0.1593C27(y)-
-0.2171C28(x)
Ψ’58 ≈ 0.7578S24(z)+0.2460S24(y)-0.3751Ni37(z2)-0.1970Ni37(yz)
Ψ’59 ≈ 0.6444O21(y)-0.3047O21(x)+0.1504O21(z)+0.2548C3(y)-0.2056C5(y)-
-0.2462C7(y)+0.1729C14(y)+0,1853C15(y)-0,2904C17(y)
Using these expressions, the assignment of the electronic
transitions for both the free and coordinated heterocyclic thioamide can
be made, with a good probability [10].
3.5. Assigning the electronic transitions of the free and coordinated ligand
The electronic spectra recorded for 3-thiobenzoylamino-
dibenzofuran (L)
and for its complex compound formed with Pt(II) – together with two
chloride ions – are shown in figures 1 and 2.
These spectra were compared with each other, taking into
account the expressions previously found through the quantum-
mechanical study which was earlier conducted.
The most probable assignment of the electronic transitions of the
free and coordinated ligand are presented in tables 3 and 4.
As a result of investigating the energies and the EHT expressions
of the molecular orbitals in the frontier zone, we could decide which of
the hetero-atoms contained in the organic molecule are the ones through
which the coordination is realized.
Therefore, we might be able to decide if the proposed structural
formula is the real one for the complex compound [10].

44
Fig
ure
1. T
he
elec
tro
nic
sp
ectr
um
of
the
lig
and
, L (
3-th
iob
enzo
yla
min
o-d
iben
zofu
ran
)

45
Fig
ure
2. T
he
elec
tro
nic
sp
ectr
um
of
the
com
ple
x c
om
po
un
d, [
Pt(
II) L
Cl2
]

46
Table 3. EHT assignment for the electronic transitions of the free organic
ligand
EHT
electroni
c
transition
calculated
wavelengt
h
(cm-1)
calculated
energy
(eV)
experiment
al
wavelength
(cm-1)
experiment
al
energy
(eV)
a Ψ49 → Ψ 47 20101 2.49205 18110 2.24398
b
Ψ 49 → Ψ
46
Ψ 49 → Ψ
45
Ψ 49 → Ψ
44
27555
28912
30173
3.41616
3.58452
3.74083
29110
3.60898
c Ψ 49 → Ψ
43
33376 4.13792 35708 4.42698
d Ψ 52 → Ψ
43
41256 5.11478 40250 4.99008
Table 4. EHT assignment for the electronic transitions of the coordinated
ligand
EHT
electroni
c
transition
calculated
wavelengt
h
(cm-1)
calculated
energy
(eV)
experiment
al
wavelength
(cm-1)
experiment
al
energy
(eV)
a - - - - -
b Ψ’58 → Ψ’50
Ψ’58 → Ψ’49
35011
35285
4.34060
4.37453 33846 4.19613
c Ψ’58 → Ψ’48 38452 4.76749 37020 4.58964
d Ψ’59 → Ψ’48 41596 5.15701 40255 4.99070
This assignment of the electronic transitions of the free and
coordinated ligand shows that the oxygen atom in the heterocycle has
nothing to do with the coordination, which therefore only involves the
other two heteroatoms present in the molecule of the ligand [10].

47
4. CONCLUSION
The electronic spectrum of the complex was compared to the one
of the free organic ligand, a quantum-mechanical study having been
then conducted with this particular purpose, by performing EHT
(Extended Hückel Theory) calculation. More specifically, this study
started by computationaly simulating the structures for both free and
coordinated organic ligand within the HyperChem 8.0.10 program, which
offers information about the energies of the molecular orbitals. Then, the
expressions of the molecular orbitals in the frontier zone were written
(by taking into account only the significant mixing coefficients), in order
to decide how to attribute the electronic transitions appearing in the two
spectra. By corroborating the differences and similarities between them,
we made the assumption that coordination involves indeed the nitrogen
and sulfur atoms from the thioamidic group of the ligand, so the
structural formula is right.
References
1. L. G. Golubyatnikova, R. A. Khisamutdinov, S. A. Grabovskii, N. N.
Kabal’nova, Yu. I. Murinov, Russian Journal of General Chemistry, 87/1
(2017) 117.
2. A. Gouranourimi, M. Ghassemzadeh, S. Bahemmat, B. Neumüller, R.
Tonner, Monatshefte für Chemie (Chemical Monthly) 146/1 (2015) 57.
3. S. J. Choi, J. Kuwabara, Y. Nishimura, T. Arai, T. Kanbara, CSJ Journals,
Chemical Letters, 41/1 (2012) 65.
4. S. S. Kandil, S. M. A. Katib, N. H. M. Yarkandi, Transition Metal
Chemistry, 32/6 (2007) 791.
5. https://en.freedownloadmanager.org/Windows-PC/HyperChem.html
6. S. Florea, Revue Roumaine de Chimie, 39 (1994) 1138.
7. K. A. Jensen, P. H. Nielsen, Acta Chemica Scandinavica, 20 (1966) 597.
8. G. Calzaferri, M. Brände, QCPE Buletin, 12 (1992) 73.
9. H. B. Gray, Electrons and Chemical Bonds, W. A. Benjamin Inc., New
York (1965).
10. L. S. Sbîrnă, S. Sbîrnă, C. I. Lepădatu, V. Mureșan, N. Mureșan,
Journal of Indian Chemical Society, 79/5 (2002) 409.

48
Total phenolic content and antioxidant activity in leaves of
six Salix genotypes
Research article
Cristina Băbeanu1, Ana Maria Dodocioiu2,*
1University of Craiova, Faculty of Sciences, Department of Chemistry, Calea Bucuresti, 107i,
Craiova, Romania 2 University of Craiova, Faculty of Horticulture, A.I. Cuza Street 13, Craiova, Romania
*E-mail: [email protected]
Received: 13.11.2017 / Accepted: 11.12.2017 / Published: 22.12.2017
Abstract
The Salix extracts are used in traditional medicine having important pharmacological
properties. Due to the fact that the beneficial effects are explained by the content in
many bioactive phytochemicals, the purpose of this paper is to evaluate in comparison
the total phenolic content, the flavonoids content and antioxidant activity in leaves of
six Salix clones in order to select the most valuable genotypes as source of natural
antioxidants.
The total phenolic content and the flavonoids content were determined by colorimetric
methods and the antioxidant activity was evaluated by DPPH radical and ABTS cation
radical scavenging assay. The obtained results show that all the studied genotypes
show a high total phenolic content and significant antioxidant activity and recommend
their use in new therapeutic drugs as new sources of phenolic compounds and natural
antioxidants.
Keywords: Salix sp., phenolic compounds, flavonoids, antioxidant activity
Annals of the University of Craiova
The Chemistry Series
Volume XLIV, No. 2 (2017) 48-57 homepage: c himie .ucv.ro/ anale/

49
1. INTRODUCTION
The Salix extract has a long history as a traditional remedy for the
treatment of fever, pain and inflammation, the beneficial effects being
associated with high salicylate content and salicylic acid precursors [1,
2]. These precursors are metabolized in the body to salicylic acid, a well-
known compound for its anti-inflammatory and analgesic properties
and its protective role in cardiovascular disease and some type of
cancers [3]. Other phytochemicals present in Salix extracts are: salicortin,
salicin, salicylic alcohol, cinnamic acid derivatives, myricetin,
kaempferol, quercetin, rutin, luteolin and condensed tannins [4, 5].
Only the concentration in salicylates and salicylic alcohol
derivatives does not explain alone the therapeutic potential of Salix
extract and many papers suggest that other polyphenolic compounds
are responsible for biological activity and clinical effects [6].
Phenolic compounds have anti-inflammatory, anti-artherogenic,
anti-microbial and anti-carcinogenic properties [7, 8]. These natural
compounds have been found to be strong antioxidants against free
radicals and other reactive oxygen species.
The purpose of this study is to evaluate the antioxidant activity
and content in total phenolic compounds and total flavonoids content in
leaves of six Salix genotypes grown in the climatic conditions of South
West Romania, with high temperature and lack of precipitation.
2. MATERIALS AND METHODS
2.1. Materials
The used methanol for the extraction was from Sigma-Aldrich
(Germany). Gallic acid, DPPH 1,1-diphenyl-2-picrylhydrazyl, ABTS 2,2'-
azino-bis(3-ethylbenzothiazoline-6-sulphonic acid), Trolox 6-hydroxy-
2,5,7,8-tetramethylchroman-2-carboxylic acid were obtained from
Sigma-Aldrich and Quercetin was purchased from Carl Roth. Folin-
Ciocalteu reagent was obtained from Merck (Germany). All the other
used chemicals were of analytical grade.

50
The biological material analyzed consisted of six genotypes of
Salix, three Romanians: Cozia, 1077, Robisal and 3 Swedish: Tora, Jorr
and Olof from a plantation in the Radovan area (N 44˚10’05” E
23˚36’13”) founded by Faculty of Agriculture, University of Craiova [9].
The content in total phenolic compounds, the content of total flavonoid
compounds and the anti-oxidant activity were determined in
methanolic extract.
2.2. Method
For the determination of total phenolic content, total flavonoid
content and antioxidant activity samples were extracted with 80 %
aqueous methanol (1:20 w/v) by sonicating for 60 min in a bath sonicator
at 24 °C. The resulting slurries were centrifuged at 4000 g for 5 min and
the supernatants were collected.
The total phenolics content was determined colorimetric at 765 nm
by the Folin Ciocalteu reagent method [10] with some modifications
[11]. Gallic acid was used to construct standard curve and the results
were expressed as mg GAE g-1 f.w.
Total flavonoids content was determined by colorimetric method
[11]. 0.5 mL of the sample extract (diluted 1:10 with methanol) was
added to 0.6 mL of 5 % sodium nitrite (NaNO2) and the mixture was left
for 6 min. 0.5 mL of 10 % Al(NO3)3 was added, shaken and left to stand
for 6 min. Finally, 3.0 mL of the 4.3 % NaOH was added. The mixture
was shaken and the absorbance was read at 500 nm after 15 min
incubation at room temperature. The total flavonoid concentration was
calculated from quercetin calibration curve and expressed as mg
quercetin equivalents per gram fresh weight (mg QE g-1 fw.)
DPPH (2,2-diphenyl-1-picrylhydrazyl) radical scavenging assay: The
capacity of extracts to reduce the radical 2,2-diphenyl-1-picrylhydrazyl
was assessed colorimetric [11] with some modifications. 3 mL of 0.075
mM DPPH methanolic solution was mixed with 50 μL extract (diluted
1:10 with methanol) and vortexed thoroughly. The absorbance of the
mixtures was measured at 517 nm after 30 min. A blank reagent was
used to study stability of DPPH over the test time. The percentage of

51
DPPH radical scavenging activity of extracts was evaluated according to
the formula:
% scavenging = 100)(
0
10
A
AAA s (1)
where A0 is the absorbance of DPPH alone, A1 is the absorbance of
DPPH + extract and AS is the absorbance of the extract only.
Trolox (T) and ascorbic acid (AsA) were used as standards. The
standards calibration curves were plotted as a function of the percentage
of DPPH radical scavenging activity. The results were expressed as
μmol Trolox equivalents per gram (μmol TE g-1 f.w.) and μmol ascorbic
acid equivalents per gram (μmol AsA g-1 fw) respectively.
ABTS 2,2'-azino-bis(3-ethylbenzothiazoline-6-sulphonic acid) radical
cation scavenging activity: The ABTS radical cation scavenging activity of
the plant extract was measured colorimetric [12]. ABTS was dissolved in
water to a 7 mmol L-1 concentration. ABTS radical cation was produced
by reacting ABTS stock solution with 2.45 mmol L-1 potassium persulfate
and allowing the mixture to stand in the dark at room temperature for
12 - 16 h before use. The ABTS radical cation solution was diluted with
methanol to an absorbance of 0.70 at 734 nm. 50 μL extract (diluted 1:10
with methanol) of the sample was mixed with 2.95 mL of diluted ABTS
radical cation solution. After reaction at room temperature for 6 min, the
absorbance at 734 nm was measured. Trolox (T) and ascorbic acid (AsA)
were used as standards. The standards calibration curves were plotted
as a function of the percentage of ABTS radical cation scavenging
activity calculated using equation 1. The results were expressed as μmol
Trolox equivalents per gram (μmol TE g-1 fw) and μmol ascorbic acid
equivalents per gram (μmol AsA g-1 fw) respectively. All determinations
were performed in triplicate, and all results were calculated as mean.

52
3. RESULTS AND DISCUSSION
3.1. Total phenolic content and total flavonoids content
The results obtained for total phenolic content vary with the
investigated genotype (figure 1) and ranged from 18.968 mg GAE g-1
f.w. (Robisal) to 32.4 mg GAE g-1 f.w. (Tora) in the order: Tora> Olof>
Jorr> Cozia> 1077> Robisal. It is found that in Swedish clones the content
in total phenolic content is higher than that obtained for the Romanian
clones.
The results of the total flavonoids content for the investigated
clones varies between 9.44 mg QE g-1 (Robisal) and 17.94 mg QE g-1
(Olof) as follows: Olof > Jorr> Cozia> Tora> 1077> Robisal (Figure 1).
Flavonoids compounds represent a higher percentage related to total
phenolic content and varied between 46.17 % (Tora) and 66.34 % (Jorr)
genotype.
Figure 1. Total phenolic content (TPC) and total flavonoids content
(TFC) in leaves of investigated Salix genotypes
Numerous papers present the content of phenolic compounds in
various organs of Salix plants [13, 14]. Identification and quantification
in water leaves extract of the individual phenols by HPLC showed that
myricetin and catechin were the most abundant flavonols while the

53
major flavones were luteolin and apigenin and their derivatives [15].
Other phenolic compounds identified are gallic acid, p-coumaric acid,
vanillin and caffeic acid and flavonoids: epigallocatechin gallate, rutin,
kaempferol and quercetin [13, 16].
Focusing interest on content in phenolic compounds is due to the
fact that they possess antioxidant properties [17] which can play an
important role in scavenging free radicals, quenching singlet oxygen, or
decomposing peroxides and which can explain their health protecting
activity [18]
3.2. Antioxidant activity
Antioxidant activity can be determined by various methods that
differ in terms of their assay principles and experimental conditions. In
this work antioxidant activity of leaves extract was evaluated by two
methods: DPPH (2,2-diphenyl-1-picrylhydrazyl) radical and ABTS (2,2'-
azino-bis- (3-ethylbenzothiazoline-6-sulfonic acid) cation radical
scavenging assay, which are the most commonly accepted. The results
were calculated using Trolox (6-hydroxy-2,5,7,8-tetramethylchroman-2-
carboxylic acid) and ascorbic acid standards.
The results obtained for antioxidant activity vary with the
investigated Salix genotype (Figure 2 and Figure 3).
All Salix extracts exhibited strong DPPH radical scavenging
activity. The values of DPPH radical scavenging activity ranged from
141.75 μmol TE g-1 (respectively 101.99 μmol AsA g-1) for 1077 genotype
to 364.33 μmol TE g-1 (respectively 249.85 μmol AsA g-1) for Cozia
genotype and decreased as follows: Cozia > Tora > Olof> Jorr > Robisal >
1077.
The studied extracts were also measured and compared for their
free radical scavenging activities against ABTS radical cation. Results
are presented in figure 2 and figure 3. All results showed significant
ABTS radical cation scavenging activity.

54
Figure 2. DPPH radical and ABTS
radical cation scavenging activities
calculated with ascorbic acid
standard
Figure 3. DPPH radical and ABTS
radical cation scavenging
activities calculated with Trolox
standard
The values of ABTS radical cation scavenging activity for samples
ranged from 150.16 μmol TE g-1 (respectively 143.8 μmol AsA g-1) for
Robisal genotype to 283.73 μmol TE g-1 (respectively 278.8 μmol AsA g-1)
for Tora genotype and decreased as follows: Tora >Cozia > Olof> Jorr
>1077 > Robisal.
The results obtained by ABTS method differ from the results of
the DPPH assay. The different results from two methods might be due
to different reaction kinetics between phenol and DPPH radical as well
as ABTS radical cation over a similar range of concentrations.
Radical scavenging activities are very important due to the role of
free radicals in biological systems. These free radicals in excess damage
various biomolecules, such as DNA, proteins, lipids and carbohydrates
causing many degenerative diseases [19, 20]. The role of antioxidants is
to scavenge and inhibit the reactions of free radicals and protect the cell
against oxidative damage.
The beneficial effects of Salix extracts proven in numerous clinical
studies are explained due to significant antioxidant activity and high
content of phenolic and flavonoid compounds. In a study that
determines antioxidant activity in bark, catkins and leaves extracted into
solvents of increasing polarity it is showed that the highest antioxidant
activity was observed in the ethanolic extract of bark followed by the

55
aqueous leaf extract [13]. The Salix leaves also have a high enzymatic
antioxidant activity plays a key role in the scavenging and regulation of
the level of reactive oxygen species [21, 22].
A strong positive correlation has been observed between the
ABTS radical cation scavenging activity and total phenols content
(r=0.93) and between the ABTS radical cation scavenging activity and
total flavonoids content (r=0.78). This is explained by the fact that the
studied compounds, phenols and flavonoids, are powerful antioxidants
due to their ability to scavenge free radicals. A similar relationship
(r=0.77) was also obtained between total phenol content and total
flavonoids content.
Research has reported that there is no significant correlation
between salicin and antioxidant activity in different organs of the plant
[6, 13]. Commercial salicin as well as acetyl salicylic acid did not show
any free radical scavenging activity which also indicates once more that
the antioxidant activity of willow leaf extracts is due to phenolic
compounds.
4. CONCLUSIONS
The analyzed biochemical indices show a dependency with the
investigated genotypes and the obtained results recommend all
analyzed genotypes as having high phenolic content and significant
antioxidant activity.
The Swedish clones show the highest content in phenolic
compounds and flavonoid compounds while the highest antioxidant
activity is recorded for Cozia and Tora genotypes.
Strong positive correlations have been observed when ABTS
radical cation scavenging activity were compared with total phenolics
compounds content and total flavonoids content indicating that these
compounds are responsible for the antioxidant activity.
This study recommends the use of investigated willow clones as
new sources of phenols and natural antioxidants for new therapeutic
drugs.

56
References
1. T. Hedner, B. Everts, Clin Rheumatol., 17 (1998) 17.
2. R. R. Chhetree, G. K. Dash, S. Mondal, R. Parhi, Int. J. Drug Dev. Res., 2
(2010) 799
3. J. G. Mahdi, A. J. Mahdi, A. J. Mahdi, I. D. Bwen, Cell Prolif., 39 (2006)
147.
4. L. Poblocka-Olech, A. M. Van Nederkassel, Y. Van der Heyden, M.
Krauze-Baranowska, D. Glod, T. Baczek, J Sep Sci., 30 (2007) 2958.
5. H. Hussain, A. Badawy, A. Elshazly, A. Elsayed, K. Krohn, M. Riaz, B.
Schulz, Rec. Nat. Prod., 5 (2011) 133.
6. A. Nahrstedt, M. Schmidt, R. Jaggi, J. Metz, M. Khayyal, Wien Med
Wochenschr., 157 (2007) 348.
7. A. Michalak, Polish J. Of Environ. Stud., 15 (2006) 523.
8. J. H. Yoon, S.J. Baek, Yonsei Med J., 46 (2005) 585.
9. M. Soare, O. Păniță, C. Sălceanu, Annals of the University of Craiova-
Agriculture, Montanology, Cadastre Series, XLV (2015) 300.
10. V. L. Singleton, J.A. Rossi, Am. J. Enol. Vitic., 16 (1965) 144.
11. R. Soare, C. Babeanu, D. Bonea and O. Panita, Scientific Papers-Series
A, Agronomy, 58 (2015) 307.
12. A. Paunescu, A. M. Dodocioiu, C. Babeanu, D. G. Buzatu, Nano, Bio
And Green – Technologies for a sustainable future Conference Proceedings,
SGEM 2016, Book Series: International Multidisciplinary Scientific
GeoConference-SGEM, Vol I (2016) 437.
13. S. Enayat, S, Banerjee, Food Chemistry, 116 (2009) 23. O
14. F. F. Tavakoli, F. Rahmani, R. Heidari, Current Nutrition & Food
Science, 12 (2016) 241.
15. T. Nyman, R. Julkunen-Tiitto, Phytochemistry, 66 (2005) 2836.
16. X. Li, Z. Liu, X. Zhang, L. Wang, Y. Zheng, C. Yuan, G. Sun,
Molecules, 13 (2008) 1530.
17. G. Ciobanu, S. Neamtu, Annals of the University of Craiova, The
Chemistry Series, XLII (1) (2013) 43.
18. R.J. Nijveldt, E. van Nood, D. E. C. van Hoorn, P. G. Boelens, K. van
Norren, P. A. M. van Leeuwen, American Journal of Clinical Nutrition,
74 (2001) 418.
19. I. S. Young, J.V. Woodside, J. Clin. Pathol., 54 (2001) 176.

57
20. B. Halliwell, Lancet, 355 (2000) 1179.
21. C. Babeanu, A.M. Dodocioiu, Annals of the University of Craiova-
Agriculture, Montanology, Cadastre Series, XLVII (2) (2017) 20.
22. C. Babeanu, M. Soare, M. Corneanu, M. Dragoi, International
Multidisciplinary Scientific GeoConference Surveying Geology and Mining
Ecology Management, SGEM, 17(61) (2017) 665.

58
Thermal Analysis of some Binuclear Bioactive Complexes
Derived from an Aromatic Dialdehyde and L-Tryptophan
Research article
Florina Ciolan*, Anca Gănescu
University of Craiova, Faculty of Sciences, Department of Chemistry, Calea Bucuresti, 107i,
Craiova, Romania
*E-mail: [email protected]
Received: 04.10.2017 / Accepted: 06.11.2017 / Published: 22.12.2017
Abstract
The binuclear complex compounds of Ni(II), Co(II), Cu(II) and Mn(II) derived from
2,2’-(propane-1,3-diyldioxy)dibenzaldehyde and L-tryptophan were studied by
thermal analysis. Thermogravimetric analysis results were in good agreement with the
proposed composition of the complexes.
Keywords: dialdehyde, aminoacid Schiff base, binuclear bioactive complexes, thermal
analysis
1. INTRODUCTION
Aminoacid Schiff bases and their first-row transition metal
complexes were reported to exhibit biological activity [1].
The template synthesis and the characterization by elemental
analyses, molar conductivity, IR and electronic spectra, magnetic
susceptibility measurements of the binuclear complexes of Ni(II), Co(II),
Annals of the University of Craiova
The Chemistry Series
Volume XLIV, No. 2 (2017) 58-64 homepage: c himie .ucv.ro/ anale/

59
Cu(II) and Mn(II) derived from the aromatic dialdehyde, 2,2’-(propane-
1,3-diyldioxy) dibenzaldehyde (named also 1,3-bis(2′-formylphenyl)-1,3-
dioxapropane), and L-tryptophan, were presented in a previous study
[2]. The results of antimicrobial tests [2] indicated that the Cu(II)
complex was the most active of these compounds.
The aim of the present study was to confirm, by
thermogravimetric analysis results, the chemical structures proposed for
these binuclear complexes.
2. MATERIALS AND METHODS
The binuclear complexes of Ni(II), Co(II), Cu(II) and Mn(II)
derived from 2,2’-(propane-1,3-diyldioxy)dibenzaldehyde and L-
tryptophan were prepared according to a procedure described in a
previous study, by template condensation of the aromatic dialdehyde,
L-tryptophan and metal acetate in methanolic medium [2]. All the
complexes were obtained by template synthesis since any attempt to
isolate the free Schiff base ligand was unsuccessful, because it is easily
hydrolysed in contact with water.
These ones were denoted as follows: [Cu2L(AcO)2(H2O)4] (1),
[Ni2L(AcO)2(H2O)4] (2), [Co2L(AcO)2(H2O)4] (3), [Mn2L(AcO)2(H2O)4] (4),
where L=(C39H34N4O6)2-.
The thermal analysis measurements (TG, DTG and DTA) of the
metal (II) complexes were carried using a horizontal “Diamond”
Differential/ Thermogravimetric Analyzer from Perkin Elmer
Instruments in dynamic nitrogen atmosphere (150 mL min-1), in the 20-
800 °C temperature range, with the heating rate of 10 ˚C min-1.
3. RESULTS AND DISCUSSIONS
The spectroscopic data (IR and UV-Vis electronic spectra), as well
as elemental analyses, molar conductivity measurements and magnetic
susceptibility determinations, presented in a previous study [2], support
the proposed general structures of the studied compounds (Figure 1).

60
Figure 1. Proposed general structures of metal complexes derived from
2,2’-(propane-1,3-diyldioxy)dibenzaldehyde and L-tryptophan; M =
Cu(II), Ni(II), Co(II) or Mn(II)
Thermal analysis of metal complexes is used to obtain information
about their physical properties and thermal stability, as well as for the
nature of the intermediates and final decomposition products [3-11].
In the temperature range 50-150 ˚C, the TG curves (Figure 2 (a))
of the complexes indicate a small mass loss (about 3-4 %), which can be
attributed to the elimination of physically adsorbed water. This process
is accompanied by a weak endothermic effect.

61
Figure 2. Thermal curves for metal complexes of Cu(II) – (1), Ni(II) – (2),
Co(II) – (3) and Mn(II) – (4); (a) TG curves, (b) DTA curves, (c) DTG
curves
The decomposition of all complexes started at 150˚C and was
completed at about 450-500 ˚C.
The TG and DTG curves (Figure 2 (a), (c)) of the complexes
decomposition indicate that the complexes (1) and (3) decompose in
three steps, while the complexes (2) and (4) decompose in two steps and
the final residual weight corresponds to the metal oxide.
Table 1 shows the thermogravimetric analysis results of the metal
complexes decomposition.

62
Table 1. Thermogravimetric analysis data of the metal complexes
Complex Temperature range,
˚C
Mass loss, % Lost fragment Residue, %
exp. (calcd.) exp. (calcd.)
(1) 150-220 7.10 4H2O 2CuO
(7.41) 17.26
220-341 30.10 2CH3COO,
fragments of L
(16.37)
341-500 45.54 fragments of L
(2) 150-265 7.20 4H2O 2NiO
(7.48) 15.23
265-500 77.57 2CH3COO, (15.53)
(76.92) fragments of L
(3) 150-250 7.20 4H2O 2CoO
(7.48) 16.80
250-360 27.36 2CH3COO,
fragments of L
(15.57)
360-450 48.64 fragments of L
(4) 150-245 7.15 4H2O 2MnO2
(7.54) 21.64
245-450 71.21 2CH3COO, (18.21)
(74.18) fragments of L
The first step of decomposition for each metal complex, with a
mass loss of about 7 %, could account for the loss of coordinated water
[12, 13]. This decomposition step is accompanied by a exothermic effect
(DTA curves- Figure 2 (b)) and this thermal behavior proves that the
four water molecules are coordinated to the central metal ions [12]. Note
that the removal of coordination water takes place to a lower
temperature for complex (1) compared with all other complexes,
indicating a weaker chemical bond.
The second step of decomposition for the complexes (2) and (4)
may corresponds to the loss of two coordinated CH3COO groups [14]
and of the organic part of these complexes (fragments of L), leaving
corresponding metal oxide as residue (Table 1). This final step of
decomposition is strongly exothermic.
For the complexes (1) and (3), the removal of two coordinated
CH3COO groups and of the organic part (fragments of L) takes place in

63
two slightly differentiated steps, as shown in Table 1. These last steps
were also accompanied by a strong exothermic effect. In this case, the
final residue is the corresponding metal oxide, too.
The thermogravimetric analysis results confirm the proposed
general structures for the studied binuclear complexes (Figure 1).
4. CONCLUSIONS
In this study, the binuclear bioactive complexes of Ni(II), Co(II),
Cu(II) and Mn(II) derived from 2,2’-(propane-1,3-
diyldioxy)dibenzaldehyde and L-tryptophan, obtained by template
synthesis and characterized by various physico-chemical methods in a
previous study, were studied by thermal analysis. Thermogravimetric
analysis results are in good agreement with the proposed composition
of the compounds and confirm the binuclear formulation of the
[M2L(AcO)2(H2O)4] type complexes, where M= Co(II), Ni(II), Cu(II) or
Mn(II) and L= (C39H34N4O6)2-.
References
1. S. Kumar, D. N. Dhar, P. N. Saxena, Journal of Scientific & Industrial
Research 68 (2009) 181.
2. F. Ciolan, L. Patron, L. Marutescu, M. C. Chifiriuc, Farmacia 63(1)
(2015) 86.
3. M. Badea, A. Emandi, D. Marinescu, E. Cristurean, R. Olar, A.
Brăileanu, P. Budrugeac, E. Segal, J. Therm. Anal. Cal. 72 (2003) 525.
4. R. Olar, M. Badea, D. Marinescu, V. Lazar, C. Chifiriuc, J. Therm. Anal.
Cal. 97 (2009) 721.
5. M. Badea, R. Olar, D. Marinescu, E. Segal, A. Rotaru, J. Therm. Anal.
Cal. 88 (2007) 317.
6. R. Olar, M. Badea, N. Stănică, E. Cristurean, D. Marinescu, J. Therm.
Anal. Cal. 82 (2005) 417.
7. A. Kropidłowska, A. Rotaru, M. Strankowski, B. Becker, E. Segal, J.
Therm. Anal. Cal. 91 (2008) 903.

64
8. A. Rotaru, A. Kropidłowska, C. Constantinescu, N. Scărişoreanu, M.
Dumitru, M. Strankowski, P. Rotaru, V. Ion, C. Vasiliu, B. Becker, M.
Dinescu, Appl. Surf. Sci. 255 (2009) 6786.
9. A. Rotaru, C. Constantinescu, A. Mandruleanu, P. Rotaru, A.
Moldovan, K. Gyoryova, M. Dinescu, V. Balek, Thermochim. Acta 498
(2010) 81.
10. M. Tătucu, P. Rotaru, I. Rău, C. Spînu, A. Kriza, J. Therm. Anal. Cal.
100 (2010) 1107.
11. P. Rotaru, R. Scorei, A. Hărăbor, M. Dumitru, Thermochim. Acta 506
(2010) 8.
12. B. Singh, P. C. Maurya, B. V. Agarwal, A. K. Dey, J. Indian Chem. Soc.
59 (1982) 29.
13. M. V. Patil, S. P. Malve, J. Indian Chem. Soc. 81 (2004) 683.
14. M. Sönmez, M. Şekerci, J. Serb. Chem. Soc. 72 (2007) 259.

65
Natural sources used to obtain edible films
Research articles
Mihaela Gabriela Dumitru
University of Craiova, Faculty of Sciences, Department of Chimistry, Calea Bucuresti, 107i,
Craiova, Romania
E-mail: [email protected]
Received: 25.10.2017 / Accepted: 28.11.2017 / Published: 22.12.2017
Abstract
One of the more fashionable trends consists of the development of innovative
biopolymers obtained from agricultural commodities and/or of food-waste products.
The use of biopolymers in multiple food packaging applications has emerged as an
alternative regarding their film-forming properties to produce edible films as an
environmentally-friendly technology. Edible coatings can be made from a variety of
polysaccharides. The objective of this work was to extract inulin from the bulbs of
onions for use in obtaining edible polymers.
Keywords: Inulin, edible polymers
1. INTRODUCTION
Edible films are defined as a thin layer of material which can be
consumed and provides a barrier to moisture, oxygen and solute
movement for the food. The material can be a complete food coating or
can be disposed as a continuous layer between food components [1, 2].
Annals of the University of Craiova
The Chemistry Series
Volume XLIV, No. 2 (2017) 65-74 homepage: c himie .ucv.ro/ anale/

66
Edible films can be formed as food coatings and free-standing films, and
have the potential to be used with food as gas aroma barrier [2, 3].
Edible films and coatings have received considerable attention in recent
years because of their advantages over synthetic films. The main
advantage of edible films over traditional synthetics is that they can be
consumed with the packaged products.
These films can be produced from a variety of products, such as
polysaccharides, proteins, lipids and resins, with or without the
addition of other components (e.g. plasticizers and surfactants), Figure 1
summarizes a general scheme for the classification of edible films [4-6].
Figure 1. Sources of natural biopolymers

67
Chitin is probably the most abundant polysaccharide of nature
after cellulose. It is also one of the most abundant biopolymer on the
earth. It is found in fungi but principally among the arthropods (crabs
and insects). Chitin (Figure 2) is closely related to cellulose. Here the
alcoholic OH group on carbon atom 2 of β-D-glucose units is replaced
by an N-acetylamino group. It is, thus, a linear polymer of N-acetyl-D-
glucosamine units joined together by β-1, 4-glucosidic linkages. Chitin’s
pronounced stability is based on the hydrogen bonding of the N-acetyl
side chains [7] Figure 2.
Figure 2. Molecular structure of Chitin
Pectin is a polysaccharide mixture with a complicated structure
containing at least 65 % of galacturonic acid (GalA). Three structural
elements are involved in the make-up of a pectin molecule: a
homogalacturonan consisting of (1 → 4) linked α-D-GalA, a
galacturonan with differently arranged side chains (building blocks:
apiose, fucose, arabinose, xylose), and a rhamnogalacturonan with a
backbone consisting of the disaccharide units [→ 4)-α-D-GalA-(1 → 2)-
α-L-Rha-(1 →] and with its rhamnose residues linked by arabinan and
galactan chains [8], Figure 3.
Figure 3. Molecular structure of Pectin

68
Pullulan is a polysaccharide polymer consisting of maltotriose
units, also known as α-1,4- α-1,6-glucan'. Three glucose units in
maltotriose are connected by an α-1,4 glycosidic bond, whereas
consecutive maltotriose units are connected to each other by an α-1,6
glycosidic bond [9], Figure 4.
Figure 4. Molecular structure of Pullulan
Agar is a heterogenous complex mixture of related
polysaccharides having the same backbone chain structure. The main
components of the chain are β-D-galactopyranose and 3,6-anhydro-α-L-
galactopyranose, which alternate through 1→4 and 1→3 linkages [8],
Figure 5.
Figure 5. Molecular structure of Agar
Inulin is a polysaccharide, similar to starch, and exists as a white
powder with neutral taste. Chemically, it is a linear biopolymer of D-
fructose units connected by b (2,1) glycosidic linkages, and terminated
with one D-glucose molecule linked to the fructose chain by an a (2,1)
bond [10] , Figure 6.

69
Figure 6. Molecular structure of Inulin
Table 1. The inulin content in vegetables, fruits and cereals
Source Edible parts Inulin content,
% of fresh
weight
Onion
Jerusalem
artichoke
Chicory
Leek
Garlic
Artichoke
Banana
Rye
Barley
Dandelion
Burdock
Camas
Murnong
Yacon
Salsify
Bulb
Tuber
Root
Bulb
Bulb
Leaves-
heart
Fruit
Cereal
Cereal
Leaves
Root
Bulb
Root
Root
Root
2-6
14-19
15-20
3-10
0.3-0.7
9-16
3-10
0.3-0.7
0.5-1.5
12-15
3.5-4.0
12-22
8-13
3-19
4-11

70
Inulin is present in roots and rhizomes of a number of regularly
consumed vegetables, fruits, and cereals, including leek, onion, garlic,
wheat, chicory [11,12] and in a wide range of bacterial species [12-15],
Table 1.
2. MATERIALS AND METHODS
2.1. Materials
Collection of Samples
The bulb onion were collected from a local market of Craiova,
România.
Reagents and Chemicals
All analytical grade solvents, chemicals and acids used in the
present study were obtained from different sources. The different
reagents and chemicals used were: calcium hydroxide, oxalic acid,
ethanol, acetone, hydrochloric acid, resorcinol.
2.2. Method
Extraction of inulin from onion
Samples of onion were washed with tap water to remove dust
and other unwanted materials and grounded in a vertical blender Braun
MR 404 Plus. In a reactor with a capacity of 2 L were introduced 800 mL
distilled water and onion bulbs 400 g (ratio 2 : 1). The mixture was
heated at 80 °C and permanently stirred for 3 h [16]. A Ca(OH)2 solution
was added until pH 8.0, and the mixture was left at room temperature
for 1 h. The precipitated residue was filtered. The filtrate was
neutralized (at t° = 60-65 °C) with oxalic acid to pH 7.0, a small amount
of activated carbon was added, and the mixture was then stirred and
filtered. The filtrate was left to cool down at 2-5 °C for 24 h. The
precipitated amorphous mass was filtered through a Büchner funnel
and rinsed twice with 95 % ethanol and once with acetone. It was dried
at 40 °C [16].

71
Figure 7. A flow chart of the inulin extraction process
Spectrophotometric method for determination of inulin:
2.0 cm3 of aqueous solution of inulin were mixed with 2.0 cm3 of
10 % HCl and heated for 10 min in a boiling water bath. 0.5 cm3 of
Selivanov’s reagent (0.5 % solution of resorcinol in 20 % HCl) was added
and further heated for 1 min. Absorption was measured at 520 nm. To
plot a standard straight line (Figure 8), fructose and a
spectrophotometer Carion -50 were used.
Figure 8. Fructose calibration curve

72
Solubility
The solubility of inulin was determined as follows: at 25 °C inulin
was added slowly in 10 mL of water under stirring until complete
dissolution and saturation. The solubility is expressed as the mass of
inulin dissolved in one liter of distilled water [16].
Kinematic viscosity
A Ubbelohde type capillary viscometer with a 0.53-mm-diameter
capillary was used.
The kinematic viscosity, was calculated according to the formula:
υ = k · t
where: k is the viscometer constant; t - the time (seconds) it takes for the
liquid to pass through the two calibrated marks.
3. RESULTS AND DISCUSSION
After the process of extraction and measurement of inulin we found
that onion contains 6 % inulin. The result is in concordance with other
literature data [17, 18].
The solubility of the polymer film represents the dissolved dry matter
content after a 24 hours immersion in water at 25 °C. The water solubility of
the film is one of the major problems of polysaccharides films and it is
determined through various methods: sorption and water activity, solubility,
moisture content, permeability etc. The film solubility in water can also
provide an insight about the behavior of a film in aqueous media, a measure of
its resistance to water, and thus about the hydrophily of the related material.
The moisture content is the parameter related to the total void volume
occupied by water molecules in the film microstructure network. It is also an
important factor when determining the film biodegradability when they are
used as packaging materials. Sometimes, it is desired a high solubility in water.
This is when the film or coating is consumed as food. The water solubility
value of film was established to be 74 g L-1 [19].
The viscosity of the polymers influences the process of forming the
polymer film, its strength and drying time. The viscosity obtained for inulin
extracted from the onion was 1.3 mm2 s-1.

73
4. CONCLUSION
Food packaging, an important discipline in the area of food
technology, concerns preservation and protection of all types of foods
and their raw materials from oxidative and microbial spoilage. Edible
films and coatings are thin layers of edible materials applied on food
products that can play an important role on their preservation,
distribution and marketing. These are produced from edible
biopolymers and food-grade additives. Film-forming biopolymers can
be proteins, polysaccharides or lipids. Onion is an important source for
obtaining inulin required to use as a natural biopolymers.
References
1. S. Guilbert, Food packaging and preservation, Mathlouthi, M. Ed.,
London (1986).
2. T. Bourtoom, Int. Food Res. J., (2008) 237.
3. J. J. Kester, O. R. Fennema, Food Technol., 40(12) (1986) 47.
4. R. N. Tharanathan, Trends Food Sci. Tech., 14(3) (2003) 71.
5. T. Mehdizadeh, T. Hossein, M. Seyed, R. Razavi, R. Abdol, Veterinary
Research Forum, 3 (3) (2012) 167.
6. M. G. Dumitru, A. Ganescu, I. Dabuleanu, Mater. Plast., Vol. 53 No.3,
(2016) 414.
7. http://www.cuchd.in
8. H. D. Belitz, W. Grosch, P. Schierble, Food chemistry, 4 th revised and
extended Ed. Springer-Verlag Berlin (2009).
9. B. H. A. Rehm, Microbial production of biopolymers and polymers
precursors, Ed., Caister Academic Press., Norfolk (2009).
10. L. Yang Q. S. He, K. Corscadden, C. C. Udenigwe, Biotechnol. Rep., 5
(2015) 77.
11. M. B. Roberfroid, Crit. Rev. Food Sci. Nutr., 33 (1993) 103.
12. F. Miremad, N. P. Shah, Int. Food Res. J., 19(4) (2012) 1337.
13. I. Vijn, S. Smeekens, Plant Physiol., 120 (1999) 351.
14. J. Van Loo, P. Coussement, L. DeLeenheer, H. Hoebregs & G. Smits,
CRC Crit. Rev. Food Sci. Nutr., 35 (1995) 525.

74
15. P. Denev, N. Delchev, G. Dobrev, Iv. Panchev, N. Kirchev, Food Sci.,
3 (2010) 48.
16. M. G. Dumitru, C. Teisanu, O. Gȋngu, 4th International Conference:
Advanced in Engineering & Management (ADEM), 17-18
Noiembrie, Turnu -Severin 2016. Conference book of abstracts. Ed.
Universitaria Craiova, (2016) 13.
17. M. Sherif Abed, H. A. Abdelmoneim, N. Anwar, N. Sobia, A. Al-
Farga, M. Bakry, Int. J. Agric. Res, 5(1) (1996) 2319.
18. L. De Leenheer, Production and use of inulin: industrial reality with a
promising future, H. van Bekkum, H. Röper, F. Voragen Ed., New
York (1996).
19. M. G. Dumitru, A. Gănescu, I. Dăbuleanu, Mater. Plast.,53(3) (2016)
414.

75
The oxidative dissolution of iron monosulfide (FeS): A
Cyclic Voltammetry study
Research article
Mădălina Duinea 1,2*, Maria Manea1, Ana Sandu1, Bianca Ghejan1, Mihaela
Petcu1, Paul Chiriță1
1University of Craiova, Department of Chemistry, Calea Bucuresti 107I, A.I. Cuza, Romania 2,,Dunarea de Jos” University of Galați, Department of Chemistry, Physics and Environment,
Domneasca Street 47, 800008- Galați, Romania *E-mail: [email protected]
Received: 30.10.2017 / Accepted: 28.11.2017 / Published: 22.12.2017
Abstract
The oxidative dissolution of FeS leads to serious environmental problems, the most
important being the acid mine drainage. Hence, the oxidative dissolution of FeS in
acidic solutions (pH 2.15) and at a temperature of 27 oC was studied by Cyclic
Voltammetry. It was found that at positive potentials both Fe2+ and S2- are oxidized,
while at negative potentials the oxidized sulfur is reduced to S2-. The addition of
glycine to the reaction system produced a narrow passivation plateau at
approximately -0.3 V. The initial and reacted surfaces were analyzed by optical
microscopy. The reacted surface reveals the presence of Fe(III) oxyhydroxides.
Keywords: FeS, Oxidative dissolution, Cyclic Voltammetry, Optical microscopy.
Annals of the University of Craiova
The Chemistry Series
Volume XLIV, No. 2 (2017) 75-81 homepage: c himie .ucv.ro/ anale/

76
1. INTRODUCTION
The mining industry has an important contribution to the
economic development of many countries from around the world.
Unfortunately, it produces serious environmental problems, the most
harmful being the acid mine drainage (AMD) [1-5]. AMD is
characterized by low pH (1-4), high electrical conductivity, extremely
high concentrations of Fe3+ and SO42-, and the presence of other elements
toxic or potentially toxic to the environment (Cu, Zn, Al, Hg, As, Pb, Cd,
Co, Cr, Ni) [3-5].
Iron monosulfide phases are known to be the most reactive iron
sulfides. Their reactivity is one of factors which contribute to the
production of AMD. It was experimentally demonstrated that the
presence of some organic compounds in the reaction system leads to the
decrease of the iron sulfides oxidative dissolution and implicitly the
diminution of the intensity of this phenomenon [2, 5-7].
The aim of this study is the investigation of FeS oxidative
dissolution in acidic solutions (pH 2.15) of 0, 0.02 or 0.04 mM glycine, at
a temperature of 27 oC. The behavior of FeS was characterized by Cyclic
Voltammetry and optical microscopy.
2. MATERIALS AND METHODS
The electrochemical experiments were carried out with the
electrochemical workstation Zahner Zennium connected to a classic
electrochemical cell with three electrodes, filled with experimental
solutions of glycine (0, 0.02 or 0.04 mM) at pH 2.15 and a temperature of
27 oC. The data were recorded with the specialized Thales program. The
working electrode was made with the Buehler Isomet equipment from
synthetic FeS. Its exposed surface was 1 cm2.
The electrode has polished with SiC grinding paper (600 to 1200),
washed with acetone and ultrasonicated for 10 minutes in ethyl alcohol.
At the end of the experiments the surface of electrodes was washed with
distilled water, dried and then examined with an optical microscope

77
(KRUSS, A.Kruss Optronic, Germany) using two different lenses (40x
and 100x).
3. RESULTS AND DISCUSSION
3.1. Cyclic Voltammetry
The Cyclic Voltammograms of the FeS electrode in the absence
and, respectively, the presence of glycine ([glycine] = 0.02 or 0.04 mM)
are shown in Figure 1. Experiments of the Cyclic Voltammetry were
carried out on the potential interval from -1 V to 1V with a scan rate of
100 mV s-1. Analyzing Figure 1 it can be observed that the Cyclic
Voltammograms are very simple. Practically, the rate of the oxidation
and respectively reduction processes linearly vary with the applied
potential. At positive potentials both iron (Fe2+) and sulfur (S2-) from FeS
are oxidized, while at negative potentials the oxidized sulfur species are
reduced to S2-. In the presence of 0.02 mM glycine the anodic current
densities increase whereas the extreme cathodic current densities
decrease when are reported at the current densities of FeS electrode in
the absence of glycine or in the presence of 0.04 mM glycine.
-1.0 -0.5 0.0 0.5 1.0
-0.002
0.000
0.002
0.004
0.006
[C2H
5O
2N] / mM
0.00
0.02
0.04
I /
A
E / V
Figure 1. Cyclic Voltammograms of FeS electrode in the absence and,
respectively, the presence of glycine ([glycine] = 0.02 or 0.04 mM) at pH
2.15 and 27 °C

78
3.2. Optical microscopy
The surface of FeS electrode was analyzed with an optical
microscope. For this purpose, two different lenses were used in order to
observe the modifications that appeared after the electrochemical
experiments.
Figure 2. Initial surface of FeS (40x)
In Figure 2 is shown the initial surface of the electrode. The traces
of polishing (visible in Figure 2) disappeared after the experiment
performed in the absence of glycine, and small colored areas appeared
(Figure 3). These areas can be associated with the appearance of the
oxidation products (most probable Fe(III) oxyhydroxides) [7].
(a) (b)
Figure 3. FeS electrode surface after the electrochemical experiments in
the absence of glycine analyzed with the lenses 40x (a) and 100x (b)

79
The electrode surface after the experiments carried out in the
presence of glycine (0.02 or 0.04 mM) was also analyzed. The obtained
images are shown in Figure 4 ([glycine]=0.02 mM) and, respectively,
Figure 5 ([glycine]=0.04 mM).
(a) (b)
Figure 4. FeS electrode surface after the electrochemical experiments in
glycine solution of 0.02 mM analyzed with the lenses 40x (a) and 100x
(b)
(a) (b)
Figure 5. FeS electrode surface after the electrochemical experiments in
glycine solution of 0.04 mM analyzed with the lenses 40x (a) and 100x
(b)
As in the case of the experiment carried out in the absence of
glycine, the polishing traces present on the initial surface of the
electrode disappeared. The resulted surface is corroded and reveals

80
smaller amounts of oxidation products than the surface presented in
Figure 3. The obtained microscope images are in good concordance with
the results of Cyclic Voltammetry.
4. CONCLUSIONS
The oxidative dissolution of FeS in acidic solutions (pH 2.15) and
at a temperature of 27 oC was studied by Cyclic Voltammetry. At
positive potentials both Fe2+ and S2- are oxidized, while at negative
potentials the oxidized sulfur species are reduced to S2-. The presence of
0.02 mM glycine produces the increase of the anodic current densities
and the decrease of the extreme cathodic current densities relative to the
current densities determined in the absence of glycine or in the presence
of 0.04 mM glycine. The initial and reacted surfaces were analyzed with
an optical microscope. From the analysis of reacted surfaces, it was
observed the presence of Fe(III) oxyhydroxides.
Acknowledgements
This work was supported by a grant of the Romanian National Authority for
Scientific Research, CNDI– UEFISCDI, project number 51/2012.
References
1. V. Oros, Biotehnologii de preparare a substantelor minerale utile.
Biotehnologia metalelor. Editura Universitatii de Nord Baia Mare,
(1999).
2. P. Chiriță, C. A. Constantin, C. E. Badica, M. I. Duinea, L. M. Birsa, E.
Matei, I. Baltog, Mater. Chem. Phys., 157 (2015) 101.
3. P. Acai, E. Sorrenti, T. Gorner, M. Polakovic, M. Kongolo, P. de
Donato, Colloids Surf. Physicochem. Eng. Asp., 337 (2009) 39.
4. M. F. Cai, Z. Dang, Y. W. Chen, N. Belzile, Chemosphere., 61 (2005)
659.

81
5. M. Simon, F. Martin, I. Ortiz, I. Garcia, J. Fernandez, E. Fernandez, C.
Dorronsoro, J. Aguilar, Sci. Total Environ., 279 (2001) 63.
6. C. A. Constantin, P. Chiriță, C. E. Badica, L. M. Birsa, E. Matei, I.
Baltog, M. L. Schlegel, Book of abstracts. 23nd Annual V.M. Goldschmidt
Conference Florence, (2013) 911.
7. C. E. Badica, M. I. Duinea, L. M. Birsa, M. A. Baibarac, E. Matei, P.
Chiriță, Book of abstracts. 24nd Annual V.M. Goldschmidt Conference
Sacramento, (2014) 95.

82
Synthesis and description of three square-planar d8 complex
compounds involving charge-transfer systems
Research article
Liana Simona Sbîrnă1*, Clementina Moldovan2
1University of Craiova, Faculty of Sciences, Department of Chemistry, Calea București, 107i,
Craiova, Romania 2University of Petroșani, Faculty of Mining, Department of Management, Environmental
Engineering and Geology, Strada Universității, 20, Petroșani, Romania *e-mail: [email protected]
Received: 29.11.2017 / Accepted: 18.12.2017 / Published: 22.12.2017
Abstract
The paper presents the synthesis and the characterization of three charge-transfer
complex compounds of the [M-S2N2] type, formed by d8 transition metal ions – namely
Ni(II), Pd(II) and Pt(II) – with a bidentate ligand of the naphthoquinone series.
The structural study of these three complex compounds was conducted by using
elemental analysis, polarographic measurements, magnetic susceptibility and electric
conductivity investigations, together with the results obtained from the IR and UV-Vis
spectra.
Keywords: bidentate ligands, naphthoquinone derivatives, d8 metal ions, square-planar
complex compounds, charge-transfer systems
Annals of the University of Craiova
The Chemistry Series
Volume XLIV, No. 2 (2017) 82-90 homepage: c himie .ucv.ro/ anale/

83
1. INTRODUCTION
Various references report data regarding different complex
compounds formed by transition metal ions with ligands having
conjugated double bonds, i.e., systems of delocalized electrons in their
molecules [1-4].
These combinations are square-planar, no matter the oxidation
state of the metal ion.
The special interest provoked by these complexes is due, among
others, to the fact that the complex compounds readily participate in
reversible charge-transfer reactions:
[M-X2Y2]2- ⇄ [M-X2Y2]- ⇄ [M-X2Y2]0 ⇄ [M -X2Y2]+ ⇄ [M -X2Y2]2+
where X = Y = S; X = Y = O; X = Y = N; X = O, Y = S; X = O, Y = N; X = S, Y
= N (the latter being the case hereby studied).
Within this work we have used a naphthoquinonic derivative as
bidentate ligand: 2-thio-3-nicotinamido-1,4-naphthoquinone (which will
be denoted as LH in what follows).
2. MATERIALS AND METHODS
2.1. Materials
The main chemicals that we have used were: NiCl2 ⋅ 6H2O (Merck,
a.p.), aqueous solution (0.02M); PdCl2 (BDH, a.p.), aqueous solution
(0,02M); K2[PtCl4] (BDH, a.p.); (0.02M); 2-thio-3-nicotinamido-1,4-
naphthoquinone (double recrystallized), dimethylformamidic solution
(0.02M). We also used tetrabutylammonium perchlorate, ethanol,
diethyl ether, DMF and acetone, all these chemicals being of analytical
purity as well.
The elemental analysis was performed on a Perkin Elmer 2380
(USA) instrument. The magnetic susceptibilities of these three complex
compounds were investigated with a Holmarc Gouy's Method
Apparatus, Model HO-ED-EM-08 (India), whereas their electrical
conductivities were measured on a Radelkis OK-102/1 (Hungary)
conductivity meter with a cell constant of 0,9 cm-1, in 10-4 M DMF

84
solutions, at 23 °C. The polarograms were recorded with a Model 7-77-
4/b Orion KTS polarograph, measuring the half-wave potentials at room
temperature, using a calomel reference electrode together with a
dropping mercury measuring electrode and a 10-1 M solution of
tetrabutylammonium perchlorate as supporting electrolyte; the
solutions of the complexes were all 10-3 M. The IR spectra were recorded
on a Perkin Elmer FT-1600 Hewlett Packard analyzer, in anhydous KBr
pellets, whereas the electronic spectra were realised by using an Ocean
Optics (UK) spectrophotometer, in 10-3 M acetone solutions.
2.2. Methods
The preparation of the heterocyclic ligand (2-thio-3-
nicotinamido-1,4-naphthoquinone, denoted as LH in what follows) was
presented elsewhere [5].
The complex compounds formed by Ni(II), Pd(II) and Pt(II) with
it have been prepared by following the classical procedure described by
Jensen and Nielsen [6].
More precisely, the nickel compound has been obtained by
adding DMF solution of ligand to aqueous solution of nikel dichloride
in a 2:1 molar ratio. After settling for an hour, the formed precipitate has
been filtered on a G4 porosity glass filter, washed with absolute ethanol,
then with diethyl ether and finally dried under reduced pressure. The
other two complexes were prepared using similar methods.
3. RESULTS AND DISCUSSION
3.1. Preliminary statements
All the complexes are air-stable, having the melting points higher
than that of the ligand (their values are presented in Table 1, among other
properties and together with the results of the elemental analysis).

85
Table 1. Properties and results of the elemental analysis
[ML2] Mol
wt.
calcd
m.p.
(°C)
Molar
conductivity
(W-1cm2 mol-1)
Magnetic
susceptibility
(BM)
Elemental analysis (%)
Calcd
.
Foun
d
[NiL2] 676.71 123 2.98 0 Ni 8.68 9.02
C 56.75 56.89
S 9.46 9.22
N 8.28 8.07
H 2.66 2.84
[PdL2] 724.4 158 1.44 0 Pd 14.69 14.75
C 53.01 53.32
S 8.83 8.49
N 7.73 7.27
H 2.48 2.85
[PtL2] 813.09 169 2.88 0 Pt 22.99 22.65
C 47.22 47.56
S 7.87 7.67
N 6.89 6.59
H 2.21 2.43
3.2. Appearance and solubility
The nickel complex is a microcrystalline stable red powder
exhibiting low solubility in common organic and inorganic solvents. The
other two are also microcrystalline stable powder with low solubility in
usual organic and inorganic solvents, only the color being different
(orange for the palladium compound and yellowish for the platinum
one).
3.3. Polarografic measurements and interpretation
The study regarding these three complex compounds was
completed with polarografic determinations. There are three
polarographic half-wave potentials in the polarograms of all studied
compounds. This fact proves the existence, in solution, of several

86
reduced species. It also shows that the reduction of the neutral and
monoanionic species takes place at the dropping mercury electrode:
[M - N2S2]0 ⇄ [M - N2S2] - ⇄ [M - N2S2]2-
The other observed waves are due to the reduction of the ligands. The
data gathered in assembly with these complexes demonstrate that, apart
from representing a chrge-transfer system, each of the evidenced species
can also be chemically obtained, because the half-wave potentials range
between +0.95 V and -0.95 V, which is a region where oxidizing or
reducing agents do not disintegrate the complex compound.
3.4. Assumed structural formula for the complex compounds and explanation
The structure of the free ligand is the one shown below.
2-thio-3-nicotinamido-1,4-naphthoquinone (denoted as LH)
The elemental analysis has shown that the complex compounds
contain (besides the metal ion) two molecules of organic ligand. This
statement is sustained by the spectral analysis, as proved in what
follows.
Subsequently, the structure of the complex compound, suggested
by the preliminary facts earlier presented, seems to be the one below:
[M(II) L2], where M = Ni / Pd / Pt

87
The reason for the notation LH becomes clear in this point of
discussion, observing that one hydrogen atom of the bidentate ligand
was lost as a consequence of complexation.
A confirmation about the type of the atoms involved in the
coordination and the nature of chemical bonds (proving that this
assumption is correct) was achieved based on the infrared spectra and
electronic spectra performed for the free ligand and the three complex
compounds. The wavenumbers thus obtained for all the compounds
discussed here are labeled in Table 2.
Table 2. IR spectral data for the ligand and complexes (ṽ are expressed
in cm-1)
Comp. ṽNH ṽCO ṽCN
coupl
.
C-C
ṽCN
coupl
. NH2
ṽCS ṽske
C=C
ṽCH
plan
e
def.
ṽNH ṽCS
LH 3482 i
3370 i
1670
i
1580 i 1356 i 1210
i
1150
m
1005
w
755
vi
670
m
[NiL2] 3410 w
3304 w
1672
i
1585
m
1355
m
1258
w
1145
m
1006
w
758
vi
678
w
[PdL2] 3415 sh
3308 w
1675
i
1590
w
1358
m
1265
sh
1148
m
1008
w
760
vi
675
sh
[PtL2] 3412 w
3306 sh
1673
i
1585
sh
1360
m
1253
w
1143
m
1007
w
756
i
673
sh
vi = very intense; i = intense; m = medium; w = weak; sh = shoulder.
The infrared spectra show important changes between 3500 cm-1
and 3000 cm-1, a region including characteristic vibrations of the -NH2
group. This shows that the nitrogen atoms are directly involved in the
coordination process. Moreover, the intense bands in the 1600-1300 cm-1
range (ṽC-N, coupling C-C and ṽC-N, coupling NH2), appear in the complex
compounds at slightly modified wavenumbers and with diminished
intensities.
An argument that supports the participation of the sulfur atom to
the coordination is the change of the intense band at 1210 cm-1, wich
expresses an important alteration of the C=S bond during the

88
coordination (in the complex compounds it suffers, indeed, an
important decreament in intensity). Another argument is the
modification occurring in the 680-630 cm-1 band, generaly assigned to
the C=S vibration, which is moved, in the complexes, also appearing
with a much lower intensity.
Finally, in order to establish the real coordination geommetry of
these complex compounds, a spectral analyses in the UV-Vis range was
performed. Although the symmetry point group is not D4h, but D2h, the
bands observed in the electronic absorption spectra of the studied
complexes might be assigned according to the classical paths followed
by Gray and Ballhausen [7] and Vanquickenborne [8].
Table 3. UV-Vis spectral data for the complexes (ṽ are expressed in cm-1)
[ML2] ṽ ε
[NiL2]
20513 0.75
29151 0.34
32712 0.25
37236 0.57
[PdL2]
16817 0.53
21342 0.48
30623 0.25
[PtL2]
21682 0.38
26323 0.42
30348 0.23
The correspondence between the bands in the prepared
complexes and the bands described for the typical complexes of the type
[MX2Y2] leads to the assumption that all these new compounds have the
same square-planar geometry. The D4h - D2h correlation assignment of
the bands was reported elsewhere [9].
In the nickel complex, the first absorption band is assigned to an
electron transfer localized on the sulfur atom to the transition metal ion
and the second one is assigned to an electron transfer localized on the
nitrogen atom. These transitions are shift toward higher wavenumbers
for the coordinated ligands, just as a consequence of the coordination.
The shifts are caused by the mixing of the antibonding orbitals with d-

89
metal orbitals, as well as to the decreament in energy that occurs or the
electron lone pairs after coordination. The last two bands are due to
transitions between molecular orbitals practically localized on the
oxygen atoms of naphthoquinone.
By comparing the spectra of the complex compounds with the
one of the free organic ligand, it shows that the first two bands are
shifted, while the last two ones are unshifted, meaning that the oxigen
atoms have nothing to do with the coordination, which is realised by
means of the sulfur and nitrogen atoms of the two identical ligand
molecules [9]. Similar interpretation might be conducted for the
palladium and platinum complexes.
4. CONCLUSION
As a conclusion to all the data gathetred and then interpretated,
one can state that the proposed structural formula is the real one for the
complex compound of nickel, and then, similarely, for the other two
complex compounds. The correlation of the elemental chemical analyses
with the results of the physico-chemical determinations suggest that the
complexes described in this paper are all of the type [M-N2S2], where M
= Ni(II), Pd(II), Pt(II). This formulation is supported by the IR spectral
analyses, which confirm that 2-thio-3-nicotinamido-1,4-naphthoquinone
act as bidentate ligands having both nitrogen and sulfur as donor atoms.
Finally, the electronic spectra of the studied complexes lead to the
conclusion that they are square-planar. Polarography data prove their
involvement in the electron-transfer processes.
The reason for the notation LH becomes clear in this point of
discussion, observing that one hydrogen atom of the bidentate ligand
was lost as a consequence of complexation.

90
References
1. N. Li, F. L. Zeng, Y. Wang, D. Z. Qu, Chinese Journal of Polymer Science
(2017) https://doi.org/10.1007/s10118-018-2014-1.
2. D. Chen, D. Wang, Z. Xiao, H. Wang, K. Yang, Bioprocess and
Biosystems Engineering (2017) https://doi.org/10.1007/s00449-017-1879-
7.
3. B. Dúzs, I. Szalai, Reaction Kinetics, Mechanisms and Catalysis (2017)
https://doi.org/10.1007/s11144-017-1329-1.
4. M. F. Budyka, T. N. Gavrishova, O. D. Laukhina, Russian Chemical
Bulletin 44 (1995) 1656. https://doi.org/10.1007/BF01151286.
5. N. Mureșan, L. S. Sbîrnă, S. Sbîrnă, V. Mureșan, C. I. Lepădatu, J. Ind.
Chem. Soc., 79(5) (2002) 412.
6. K. A. Jensen, P. H. Nielsen, Acta Chemica Scandinavica, 20 (1966) 597.
7. H. P. Gray, C. J. Ballhausen, J. American Chem. Soc., 85 (1963) 260.
8. L. G. Vanquickenborne, Inorg. Chem., 20 (1981) 796.
9. V. Mureșan, L. S. Sbîrnă, S. Sbîrnă, C. I. Lepădatu, N. Mureșan, Acta
Chimica Slovenica, 49(3) (2002) 447.