
EUROCONTROL · ACC Area Control Centre ... (FLOS) chosen for this exercise utilised single rather...
56
EUROPEAN ORGANISATION FOR THE SAFETY OF AIR NAVIGATION Project SIM-F-E1 Issued: September 1999 The information contained in this document is the property of the EUROCONTROL Agency and no part should be reproduced in any form without the Agency’s permission. The views expressed herein do not necessarily reflect the official views or policy of the Agency. EUROCONTROL
Transcript of EUROCONTROL · ACC Area Control Centre ... (FLOS) chosen for this exercise utilised single rather...

EUROPEAN ORGANISATIONFOR THE SAFETY OF AIR NAVIGATION
%52/#/.42/,�%80%2)-%.4!,�#%.42%
2!-3�3)-5,!4)/.
/&�7!23!7�&)2
%%#�.OTE�.O�������
Project SIM-F-E1
Issued: September 1999
The information contained in this document is the property of the EUROCONTROL Agency and no part should be reproduced inany form without the Agency’s permission.
The views expressed herein do not necessarily reflect the official views or policy of the Agency.
EUROCONTROL

2%0/24�$/#5-%.4!4)/.�0!'%
2EFERENCE�
EEC Note No. �����3ECURITY�#LASSIFICATION�
Unclassified
/RIGINATOR�
EEC - OPS
(Operational Services)
/RIGINATOR��#ORPORATE�!UTHOR�.AME�,OCATION�
EUROCONTROL Experimental CentreB.P.15F - 91222 Brétigny-sur-Orge CEDEXFRANCETelephone : +33 (0)1 69 88 75 00
3PONSOR�
EUROCONTROL Support To States(STS) DEI2
3PONSOR��#ONTRACT�!UTHORITY�.AME�,OCATION�
EUROCONTROL AgencyRue de la Fusée, 96B -1130 BRUXELLESTelephone : +32 2 729 9011
4)4,%�
2!-3�3)-5,!4)/.
OF
7!23!7�&)2
!UTHOR
F. Dowling$ATE
09/990AGES
32#HARTS
264ABLES
1!PPENDIX
32EFERENCES
-
%!4#()0�4ASK
3PECIFICATION
0ROJECT
SIM-F-E1
4ASK�.O��3PONSOR 0ERIOD
1998 to 1999
$ISTRIBUTION�3TATEMENT�
(a) Controlled by: Head of OPS(b) Special Limitations: None(c) Copy to NTIS: YES / NO
$ESCRIPTORS��KEYWORDS��F28; Fast time simulation; Warsaw FIR; EUROCONTROL Re0rganised ATCMathematical Simulator; Traffic Sample; ATC tasks; Superimposed sectorisation; Workload; Simulatedorganisations.
!BSTRACT��The F28 simulation conducted for Warsaw FIR, examined the effects on controller workload byreplacing the TMA with a CCF-East and a CCF-West. It also examined the effects of the introduction ofsuperimposed sectorisation to the en-route sectors and the introduction of RVSM levels to Warsaw FIR.

This document has been collated by mechanical means. Should there be missing pages, please report to:
EUROCONTROL Experimental CentrePublications Office
B.P. 1591222 - BRETIGNY-SUR-ORGE CEDEX
France

5$06�6LPXODWLRQ�RI�:DUVDZ�),5
1
�� ,1752'8&7,21 �
�� 2%-(&7,9(6 �
�� 0(7+2'2/2*< �
�� 6,08/$7,21�'$7$�'(6&5,37,216 �
��� 75$)),&�6$03/(�35(3$5$7,21���(1+$1&(0(17 �
��� 5960�0(7+2'2/2*< �
��� &$3$&,7<�$1$/<6,6 �
��� $7&�7$6.�63(&,),&$7,216 ��
��� $,5&5$)7�3(5)250$1&(�'$7$ ��
��� 6(&725�0$11,1*�$55$1*(0(176 ��
�� 25*$1,6$7,216 ��
��� 5()(5(1&(�25*$1,6$7,21�$ ��
��� 352326('�25*$1,6$7,21�% ��
��� 352326('�25*$1,6$7,21�& ��
��� 352326('�25*$1,6$7,21�' ��
��� 352326('�25*$1,6$7,21�( ��
�� 5(68/76�$1'�&203$5$7,9(�$1$/<6,6 ��
��� 5()(5(1&(�25*$1,6$7,21�$ ��6.1.1 Traffic Distribution per Sector 156.1.2 Distribution of Working Times 166.1.3 Tactical and Planning Controller Workload 176.1.4 Planning Controller Workload (2005) 186.1.5 Tactical Controller Workload (2005) 18
��� 352326('�25*$1,6$7,21�% ��6.2.1 Tactical Controller Workload / Org B versus Org A 20
��� 352326('�25*$1,6$7,21�& ��6.3.1 Planning Controller Workloads 216.3.2 Tactical Controller Workloads 226.3.3 Tactical Controller Workloads / Org B versus Org C 23
��� 352326('�25*$1,6$7,21�' ��6.4.1 Tactical Controller Workloads 246.4.2 Tactical Controller Workloads / Org C versus Org D 25
��� 352326('�25*$1,6$7,21�( ��6.5.1 Tactical Controller Workload (RVSM versus Non RVSM) 266.5.2 Sector Capacities 276.5.3 Sector Capacity Results – Individual Sectors 27
�� &21&/86,216�$1'�5(&200(1'$7,216 ��

5$06�6LPXODWLRQ�RI�:DUVDZ�),5
2
���������������� �
ACC Area Control CentreATC Air Traffic ControlATCO Air Traffic Control OfficerCFMU Central Flow Management UnitCVSM Conventional Vertical Separation Minimum / MinimaEEC EUROCONTROL Experimental CentreFIR Flight Information RegionFL Flight LevelFLOS Flight Level Orientation SchemeHLT Heavy Load ThresholdICAO International Civil Aviation OrganisationOPS Operational Services, Centre of Expertise EECPATA Polish Air Traffic AgencyPC Planning ControllerR/T Radio TelephonyRAMS Re-Organised ATC Mathematical SimulatorRVSM Reduced Vertical Separation Minimum / MinimaTC Tactical ControllerTMA Terminal Control Area

5$06�6LPXODWLRQ�RI�:DUVDZ�),5
3
������
In the framework of the provision of assistance by EUROCONTROL to the Polish ATC HarmonisationWork programme (PATCHWORK), the Polish Air Traffic Agency (PATA) requested that the OPSCentre of Expertise at the EUROCONTROL Experimental Centre (EEC) in Brétigny-sur-Orge, France,conduct a Fast-Time Simulation study for Warsaw FIR. The purpose of the study was to analyse theimpact of the implementation of new sectorisation in Warsaw FIR, and to assess the impact oncontroller workloads of the introduction of RVSM levels in Warsaw FIR, interfacing with non RVSMareas to the east. The study was undertaken using the EUROCONTROL Reorganised ATCMathematical Simulator (RAMS).
The prime function of RAMS, which is the latest ATC simulation tool under development at theEUROCONTROL Experimental Centre in Brétigny, is the measurement of workload valuesassociated with either existing or proposed ATC systems or airspace / manning organisations underevaluation. The RAMS system can also be used in the implementation of planning, organisational,high level and in-depth studies of a wide range of ATC concepts, including 4-dimensional flightprofiles. The design includes sophisticated conflict detection / resolution mechanisms, modern userinterfaces and a data preparation environment.
The Fast-Time Simulation study commenced in June 1998. A number of meetings were held duringthe execution of the simulation between representatives of PATA and the EUROCONTROL studyteam in order to outline the simulation methodology, define traffic samples, verify input data, agreeexercises to be conducted and to review the interim results obtained.
The final results were presented by the Project Manager, Frank Dowling in Warsaw on 22 and 23 ofApril 1999.
This report presents the results of the study, together with analysis thereof and comment whereappropriate.
$&.12:/('*(0(176
The members of the EUROCONTROL study team wish to express their appreciation for theassistance afforded them by the Polish Air Traffic Agency (PATA) during the course of the simulation,and especially to Mr. Andzrej Bolimowski, whose expertise and support were invaluable.

5$06�6LPXODWLRQ�RI�:DUVDZ�),5
4
��� � ��������
Taking into consideration the proposed increases in traffic for the Warsaw FIR, PATA wished toexamine a number of proposed sectorisation possibilities. To this end, the effects of the proposedchanges, in terms of controller workload, new sectorisation options, forecast traffic levels andReduced Vertical Separation Minima (RVSM) are considered. This report describes the objectives,working organisations and parameters used in the study, together with an analysis of the resultsobtained and of the conclusions drawn.
��� ���������
The objectives of the study were:-
To assess the effect on controller workload by introducing a new TMA (CCF)
To assess the impact on controller workload by introducing superimposed sectorisation to en-routesectors
To evaluate the effects, in terms of controller workload, of the introduction of RVSM levels in WarsawFIR, interfacing with non RVSM areas to the east
To assess sector capacities
To examine the effects on controller workload by closing blocks of airways due to military activity
To analyse scenarios to be fed into the Real-Time simulation for PATA
��� �����������
The methodology used entails the development and evaluation of a reference organisation based onoperational parameters in use in Warsaw FIR at the start time of the study in order to both validatethe EUROCONTROL RAMS simulator tool and to establish a baseline against which the resultsobtained when modelling other organisations may be measured.
The facility to make such comparisons frequently enables the immediate identification of the most /least promising of the proposed organisations. Where weaknesses are identified the appropriateremedial solutions are often obvious. Where this is not the case, the findings generally precipitatesupplementary studies that lead to an overall improvement in the results that can be achieved underthe proposed organisation.
��� ��������� ��������������� �
���� 75$)),&�6$03/(�35(3$5$7,21���(1+$1&(0(17
In order to enable a realistic replication of existing operations within Warsaw FIR, PATA supplied a 24hour traffic sample consisting of all civil traffic recorded as having operated under the control ofWarsaw FIR on Friday 8 August 1997. This traffic sample contained 709 flights. The working groupagreed to simulate a 13 hour period from the traffic sample, from 0600 to 1900. The traffic sample forthe simulated period contained 558 flights. All routes were checked for track accuracy and all aircraftprofiles for entry, cruise and exit level compliance.

5$06�6LPXODWLRQ�RI�:DUVDZ�),5
5
Studies of the traffic affected by the closure of the military blocks of airways determined that thenumber of aircraft was sufficiently low as not to be of operational significance in terms of its impactupon the outcome of the study and would not reflect the operational problems caused by this militaryactivity. The working committee therefore decided to remove the objective examining the effects oncontroller workload by closing these blocks of airways.
The existing traffic sample was increased to 2005 levels in conjunction with PATA. Percentagefigures were supplied by PATA for the traffic increases forecast for Poland up to and including 2005.Enhancement of the traffic sample was effected by the EUROCONTROL Experimental Centre atBrétigny using the cloning facilities of RAMS. En-route traffic was increased by 40% from 1997 to2005 and international arrivals / departures for Warsaw Airport by 65%. The 24 hour traffic sampleincreased from 709 flights to 1000 flights and from 558 flights, in the 13 hour simulated period, to 782flights.
The table below shows how the 24 hour traffic sample was increased to 2005 levels.
)OLJKW�&DWHJRULHV ���� ��,QFUHDVH ����
OVERFLTS 420 40% 588
DOM DEPS EPWA 24 40% 34
DOM ARRS EPWA 25 40% 35
INTL DEPS EPWA 79 65% 130
INTL ARRS EPWA 80 65% 132
DOM INTL DEPS 34 _ 34
DOM INTL ARRS 36 _ 36
DOM DEPS/ARRS 11 _ 11
TOTAL 709 1000
7DEOH��
���� 5960�0(7+2'2/2*<
RVSM is an International Civil Aviation Organisation (ICAO) approved concept designed to permit thereduction of vertical separation from that of Conventional Separation Minima (CVSM) figure of 2000feet in respect of aircraft operating between Flight Levels (FL) 290 and 410 inclusive, to 1000 feet. Anaircraft may only benefit from the reduced vertical separation criteria afforded by RVSM if it is RVSMapproved.
The Flight Level Orientation Scheme (FLOS) chosen for this exercise utilised single rather than dualalternate flight levels. In the case of the single alternate flight level FLOS selected, the upper verticallimit for use of the CVSM figure 1000 feet, which is conventionally set at FL290, was raised to FL410.Hemispherical level conventions were retained, with even flight levels being allocated to westboundflights and odd flight levels to eastbound flights. However, and as can be seen by reference to Fig. 1,choice of the single alternate flight level system determined that FL310, FL350 and FL390 becameeastbound flight levels.

5$06�6LPXODWLRQ�RI�:DUVDZ�),5
6
The conventions to be applied in revising the flight levels of selected aircraft in the 2005 trafficsample to ensure ready integration at the newly available RVSM flight levels were presented to andagreed by the PATA working group. Bi-directional routes were only considered as no uni-directionalroutes existed.
)LJXUH��
Figure 1 above illustrates the RVSM / CVSM flight level distribution pattern using a Flight LevelOrientation Scheme (FLOS) arrangement based upon a single alternate flight level as used in theRVSM exercise.
%L�'LUHFWLRQDO�5RXWHV
The allocation of RVSM flight levels to aircraft operating on bi-directional routes precipitated arequirement for certain aircraft in the traffic sample at FL310, FL350 and FL390 consequent upontheir change in direction of flight to eastbound / westbound.
�������� !��"#"�$
)/����)/����
)/����)/����
)/����)/����
)/����)/����
)/����)/����
)/����)/����)/����
)/����)/����)/����
)/����)/����
)/����)/����)/����
)/����)/����
)/����)/����)/����
)/����)/����
)/����)/����)/����
)/����)/����)/����
59605960 &RQYHQWLRQDO�960
)/�������)/
)/����)/����)/�������)/
)/����)/����)/�������)/)/)/�������

5$06�6LPXODWLRQ�RI�:DUVDZ�),5
7
%L�'LUHFWLRQDO�5RXWHV�:HVWERXQG
)LJXUH��
Figure 2 above illustrates the methodology used for the allocation of RVSM levels to westboundaircraft. The following procedures were adopted :-
Aircraft operating at FL290 were maintained at that level
50% of aircraft operating at FL310, selected at random, were re-allocated RVSM FL300
50% of aircraft operating at FL310, selected at random, were re-allocated RVSM FL320
50% of aircraft operating at FL350, selected at random, were re-allocated RVSM FL340
50% of aircraft operating at FL350, selected at random, were re-allocated RVSM FL360
50% of aircraft operating at FL390, selected at random, were re-allocated RVSM FL380
50% of aircraft operating at FL390, selected at random, were re-allocated RVSM FL400
However, these changes in flight levels could not take place until aircraft had entered Warsaw FIR asthey were entering from a non RVSM area. Therefore the Tactical Controller (TC) in the sectorinterfacing with the non RVSM area had to “move’ the aircraft to RVSM levels.
���%&!"$�'�"$!(%&)*+
)/����
)/����
)/����
&960 5960
)/����
)/����

5$06�6LPXODWLRQ�RI�:DUVDZ�),5
8
%L�'LUHFWLRQDO�5RXWHV�(DVWERXQG
)LJXUH��
Figure 3 above illustrates the methodology used for the allocation of RVSM flight levels to eastboundaircraft.
In allocating RVSM flight levels to eastbound aircraft, 50% of those operating at each of the threeCVSM flight levels of FL330, FL370 and FL410 were, by random selection, re-allocated the RVSMflight levels of FL310, FL350 and FL390 respectively.
In actual operations the density of traffic at or above RVSM FL350 is likely to be somewhat lower thanthat resulting from the re-allocation procedure adopted here, the higher concentrations beingexpected in the FL320 – FL360 band. With studies in respect of Flight Level Band Occupancy still inprogress it was felt that the method adopted for RVSM flight level allocation in the study wasappropriate.
These aircraft now entered the simulated area at RVSM flight levels. However, because they had toexit the simulated area into non RVSM areas the TC had to ”move” the aircraft back to their originallevels before exiting at the eastern boundary.
���� &$3$&,7<�$1$/<6,6
The capacity estimation technique used in RAMS is based upon the theory that ATC Capacity can bedefined as the maximum number of flights that can enter a particular control area within a specifiedperiod, while still permitting an acceptable level of controller workload. This controller workload levelis known as the Heavy Load Threshold (HLT).
The following technique is applied in respect of each sector simulated :-
Simulate a sufficiently large traffic sample for the area of interest in order to permit the generation of asuitable number of distinct traffic / workload relationships.
���%&!"$�'�,$!(%&)*+
)/����
)/����
)/����
)/����
)/����
&960 5960
���

5$06�6LPXODWLRQ�RI�:DUVDZ�),5
9
)LJXUH��
Make an average assessment for the three main levels of controller workload (Moderate, Heavy andSevere), with the provision that ultra high and ultra low values are excluded so that there are nodistortion effects, and that the width of each loading band is sufficiently great to allow for variance dueto conflict load effects.
)LJXUH��
Identify a formula to suit the relationship between traffic loading and controller workload.

5$06�6LPXODWLRQ�RI�:DUVDZ�),5
10
)LJXUH��
Apply this formula to estimate the average traffic loading that would represent the defined HeavyLoad Threshold (HLT).
1RWH��
The use of workload estimates from a model based simulation assumes that the model is calibratedsufficiently well to give reasonable assessment of workload and that the defined HLT is suitable forthat calibration.
1RWH��
It is stressed that PATA is solely responsible for the issue of Declared Capacity Values in respect ofits sectors. In consequence, and under no circumstances should the values presented and / orconsidered in this document be construed as Declared Capacity Values.
���� $7&�7$6.�63(&,),&$7,216
The specification and definition of the ATC tasks used in this study were developed by both the PATAand EUROCONTROL EEC / OPS working group members. Comprehensive details may be found atAPPENDIX 1 to this report.
���� $,5&5$)7�3(5)250$1&(�'$7$
The RAMS simulator recognises in excess of 250 aircraft types and these are grouped into differentcategories for performance purposes. Detailed data on climb, cruise and descent speeds, rate ofclimb and descent in each level band and maximum and minimum acceptable flight levels for eachcategory of aircraft are available. The RAMS simulator can also distinguish between long, mediumand short range flights.
The aircraft performance data used to construct the actual and requested profiles for each aircraftwithin the simulated airspace are derived from studies of actual performance, airline operating
5$06�6LPXODWLRQ�RI�:DUVDZ�),5
11
practices and particular characteristics observed by experienced controllers during previoussimulations, or in the field.
Detailed information on the performance data utilised in this simulation is held by the OPS Centre ofExpertise at the EUROCONTROL Experimental Centre in Brétigny-sur-Orge, France.
���� 6(&725�0$11,1*�$55$1*(0(176
Two ATCO positions were simulated in all sectors, those of Tactical Controller (TC) and PlanningController (PC), except in the TMA sector in the reference organisation and in CCF-East and CCF-West sectors in subsequent organisations, where only one ATCO position was simulated, that ofTactical Controller (TC).
-�� ��� ������ �
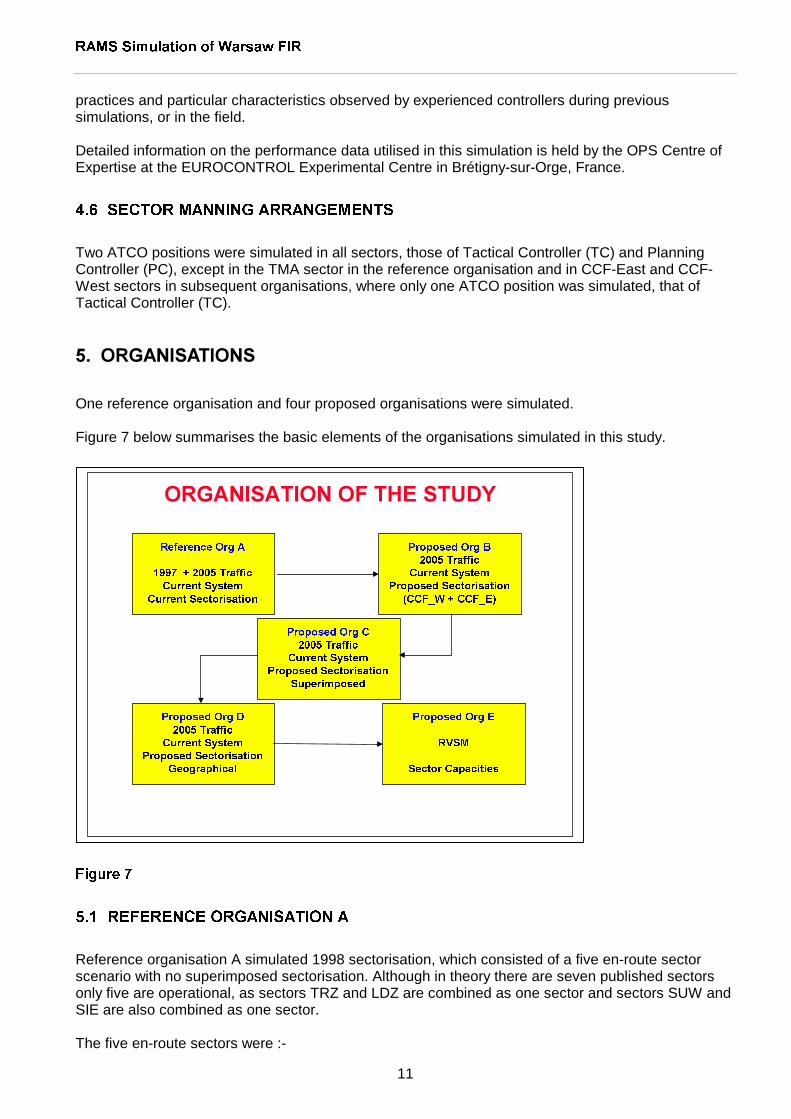
One reference organisation and four proposed organisations were simulated.
Figure 7 below summarises the basic elements of the organisations simulated in this study.
)LJXUH��
���� 5()(5(1&(�25*$1,6$7,21�$
Reference organisation A simulated 1998 sectorisation, which consisted of a five en-route sectorscenario with no superimposed sectorisation. Although in theory there are seven published sectorsonly five are operational, as sectors TRZ and LDZ are combined as one sector and sectors SUW andSIE are also combined as one sector.
The five en-route sectors were :-
��� ������ �������������
5HIHUHQFH�2UJ�$
�������������7UDIILF&XUUHQW�6\VWHP
&XUUHQW�6HFWRULVDWLRQ
3URSRVHG�2UJ�%�����7UDIILF
&XUUHQW�6\VWHP3URSRVHG�6HFWRULVDWLRQ
�&&)B:���&&)B(�
3URSRVHG�2UJ�&�����7UDIILF
&XUUHQW�6\VWHP3URSRVHG�6HFWRULVDWLRQ
6XSHULPSRVHG
3URSRVHG�2UJ�'�����7UDIILF
&XUUHQW�6\VWHP3URSRVHG�6HFWRULVDWLRQ
*HRJUDSKLFDO
3URSRVHG�2UJ�(
5960
6HFWRU�&DSDFLWLHV

5$06�6LPXODWLRQ�RI�:DUVDZ�),5
12
GRUDREJEDTRZ / LDZSUW / SIE
The TMA with an upper limit of FL245 was also simulated.
A total of two exercises were conducted for reference organisation A. These were designed toexamine the effects of a traffic increase to 2005 levels on sectorisation and workpractices at the starttime of the study.
Details of the parameters used in each of the exercises under reference organisation A are listedhereunder.
([HUFLVH�5HI$����& simulated the sectorisation in Warsaw FIR at the start time of the study using thetraffic sample from August 1997.
([HUFLVH�5HI$����& simulated the same sectorisation as in exercise Ref.97/C above but with the2005 forecast traffic levels.
���� 352326('�25*$1,6$7,21�%
One exercise, ([HUFLVH�3UR%����&, was conducted for proposed organisation B. This exercise, usingthe forecast traffic levels for 2005, was designed to examine the effects on controller workloadssimulating the same en-route sector configuration as the reference organisation but with theintroduction of a CCF-East and a CCF-West to replace the TMA.
���� 352326('�25*$1,6$7,21�&
Proposed organisation C examined the introduction of superimposed sectorisation to four of the fiveen-route sectors, creating a vertical split at FL265. It maintained the CCF-East and CCF-West sectorsalready tested in proposed organisation B. Forecast traffic levels for 2005 were used for thisorganisation.
One exercise, ([HUFLVH�3UR&����&, was simulated in this organisation. The sectorisation simulatedwas a configuration of nine en-route sectors and a CCF-East and CCF-West.
The nine en-route sectors were :-
GRU UPPER FL265 / UNLGRU LOWER GND / FL265DRE UPPER FL265 / UNLDRE LOWER GND / FL265JED UPPER FL265 / UNLJED LOWER GND / FL265TRZ/LDZ UPPER FL265 / UNLTRZ/LDZ LOWER GND / FL265SUW/SIE GND / UNL

5$06�6LPXODWLRQ�RI�:DUVDZ�),5
13
���� 352326('�25*$1,6$7,21�'
Proposed organisation D simulated the same configuration as proposed organisation C but with twoexceptions. ([HUFLVH�3UR'����& treated sectors SUW and SIE as separate sectors with nosuperimposed sectorisation, and new lateral dimensions were introduced to the GRU and DREsectors with the northern boundary of DRE being extended north eastwards to include Airway B45.
The ten en-route sectors for this exercise were :-
GRU UPPER FL265 / UNLGRU LOWER GND / FL265DRE UPPER FL265 / UNLDRE LOWER GND / FL265JED UPPER FL265 / UNLJED LOWER GND / FL265TRZ/LDZ UPPER FL265 / UNLTRZ/LDZ LOWER GND / FL265SUW GND / UNLSIE GND / UNL
���� 352326('�25*$1,6$7,21�(
Proposed organisation E assessed the sector capacities for 1999 sectorisation in Warsaw FIR andalso examined the effects of RVSM levels being introduced to Warsaw FIR.
Two exercises were simulated in this organisation. ([HUFLVH�3UR(����& used the proposedorganisation B scenario to examine the effects on controller workload by introducing RVSM levels toWarsaw FIR interfacing with non RVSM areas to the east.
Exercise 3UR(����&DS used the 1999 sector configuration in Warsaw FIR as in referenceorganisation A to assess the sector capacities for each sector. Forecast traffic levels for 2005 wereused in this exercise.

5$06�6LPXODWLRQ�RI�:DUVDZ�),5
14
.�� �������� �������������� ������
���� 5()(5(1&(�25*$1,6$7,21�$
The objectives of the study were :-
To assess the effect on controller workload by introducing a new TMA (CCF)
To assess the impact on controller workload by introducing superimposed sectorisation to en-routesectors
To evaluate the effects, in terms of controller workload, of the introduction of RVSM levels in WarsawFIR, interfacing with non RVSM areas to the east
To assess sector capacities
To analyse scenarios to be fed into the Real-Time simulation for PATA
The purpose of reference organisation A was to both validate the RAMS simulator tool and toestablish a baseline against which the results obtained when modelling other organisations could bemeasured.
Using the traffic sample from 1997 and forecast traffic levels for 2005, and the sectorisationconfigurations in operation in Warsaw FIR at the start time of the study, a total of two exercises weresimulated. These were designed to examine the effects on controller workload of the proposedincrease in traffic levels from 1997 to 2005, without any sector configuration modifications.
Analysis of the results obtained from the exercises conducted under reference organisation Aconcentrated on controller workload criteria. However, associated determining factors such as TrafficDistribution per Sector and Distribution of Working Times in respect of each of the defined ATC taskcategories were also considered.

5$06�6LPXODWLRQ�RI�:DUVDZ�),5
15
������ 7UDIILF�'LVWULEXWLRQ�SHU�6HFWRU
)LJXUH��
Figure 8 above depicts the traffic distribution per sector recorded in Warsaw FIR in respect of each ofthe two exercises simulated in reference organisation A using 1997 traffic levels, forecast traffic levelsfor 2005 and the sectorisation configurations in operation in Warsaw FIR at the date of the start timeof the study.
Chart columns depicted in red indicate traffic distribution per sector levels recorded with respect tothe 1997 traffic sample.
Chart columns depicted in green indicate traffic distribution per sector levels recorded with respect toforecast traffic levels of 2005.
The biggest increase of traffic per sector, with the increase from 1997 to 2005 levels, wasexperienced by sector SUW/SIE. Sectors TRZ and TMA also had a significant increase of traffic.
228
311
213
282
218
293
262
377
166
260240
341
0
50
100
150
200
250
300
350
400
1XPEHU�RI�)OLJKWV
DRE GRU JED SUW TMA TRZ
6HFWRUV
7UDIILF�'LVWULEXWLRQ�SHU�6HFWRU
TOTAL NUMBER OF FLIGHTS 1997 TOTAL NUMBER OF FLIGHTS 2005

5$06�6LPXODWLRQ�RI�:DUVDZ�),5
16
������ 'LVWULEXWLRQ�RI�:RUNLQJ�7LPHV
)LJXUH��
Figure 9 above depicts the distribution of working times, in minutes, for the period simulated, 06.00 to19.00. The columns represent the recordings derived for each of the sectors simulated in referenceorganisation A with 1997 traffic levels. Each column is, in turn, appropriately segmented and colour-coded to highlight the readings obtained in respect of each of the ATC task categories evaluated.
Figure 9 shows that the highest readings recorded were those in respect of Radar Tasks, followed byRoutine R/T Tasks, Flight Data Management and Co-ordination Tasks respectively. The onlyexception to this was the working times recorded in the TMA, where Routine R/T Tasks recordedwere higher than Radar Tasks recorded.
0.00
50.00
100.00
150.00
200.00
250.00
300.00
DRE GRU JED SUW TMA TRZ
'LVWULEXWLRQ�RI�$7&�:RUNORDG�SHU�6HFWRU([SUHVVHG�LQ�0LQXWHV���������������
FLT DATA
CO-ORD
C/SEARCH
RADAR
R/T
5$06�6LPXODWLRQ�RI�:DUVDZ�),5
17
������ �7DFWLFDO�DQG�3ODQQLQJ�&RQWUROOHU�:RUNORDG
)LJXUH���
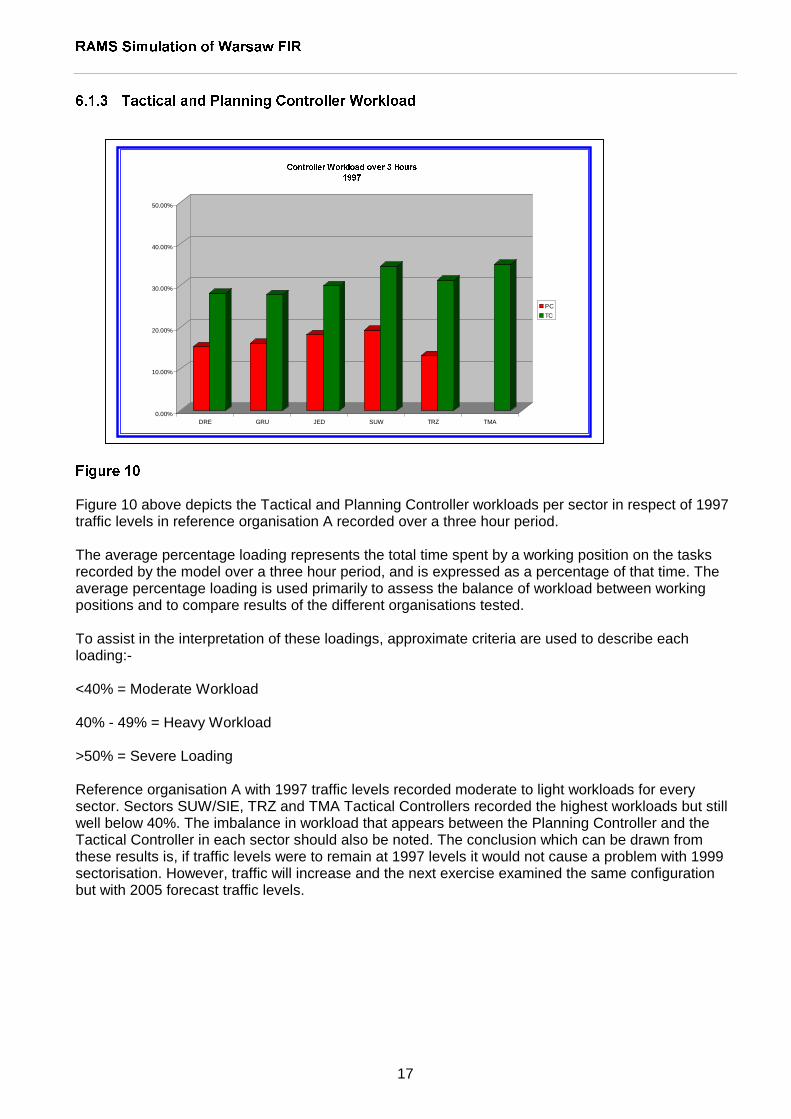
Figure 10 above depicts the Tactical and Planning Controller workloads per sector in respect of 1997traffic levels in reference organisation A recorded over a three hour period.
The average percentage loading represents the total time spent by a working position on the tasksrecorded by the model over a three hour period, and is expressed as a percentage of that time. Theaverage percentage loading is used primarily to assess the balance of workload between workingpositions and to compare results of the different organisations tested.
To assist in the interpretation of these loadings, approximate criteria are used to describe eachloading:-
<40% = Moderate Workload
40% - 49% = Heavy Workload
>50% = Severe Loading
Reference organisation A with 1997 traffic levels recorded moderate to light workloads for everysector. Sectors SUW/SIE, TRZ and TMA Tactical Controllers recorded the highest workloads but stillwell below 40%. The imbalance in workload that appears between the Planning Controller and theTactical Controller in each sector should also be noted. The conclusion which can be drawn fromthese results is, if traffic levels were to remain at 1997 levels it would not cause a problem with 1999sectorisation. However, traffic will increase and the next exercise examined the same configurationbut with 2005 forecast traffic levels.
0.00%
10.00%
20.00%
30.00%
40.00%
50.00%
DRE GRU JED SUW TRZ TMA
&RQWUROOHU�:RUNORDG�RYHU���+RXUV����
PC
TC

5$06�6LPXODWLRQ�RI�:DUVDZ�),5
18
������ 3ODQQLQJ�&RQWUROOHU�:RUNORDG�������
)LJXUH���
Figure 11 above depicts the Planning Controller workloads per sector in respect of 2005 traffic levelsin reference organisation A recorded over a three hour period.
Planning Controller workload was a moderate level in all sectors. This suggests that future demands,at least in so far as they have been assessed at present, are unlikely to pose handling difficulties onthe PC positions. The PC workload was also well balanced from sector to sector.
������ 7DFWLFDO�&RQWUROOHU�:RUNORDG�������
)LJXUH���
Figure 12 above depicts the Tactical Controller workload per sector in respect of 2005 forecast trafficlevels, as recorded for exercise RefA.05/C.
There was a considerable increase in the workloads recorded for the TCs with the forecast trafficlevels of 2005. Tactical Controllers in DRE, GRU, and JED recorded Heavy Workloads over the three
0.00%
10.00%
20.00%
30.00%
40.00%
50.00%
PC-DRE PC-GRU PC-JED PC-SUW PC-TRZ
3ODQQLQJ�&RQWUROOHU�:RUNORDGRYHU���+RXUV�����
0.00%
10.00%
20.00%
30.00%
40.00%
50.00%
60.00%
70.00%
TC-DRE TC-GRU TC-JED TC-SUW TC-TMA TC-TRZ
7DFWLFDO�&RQWUROOHU�:RUNORDGRYHU���+RXUV�����

5$06�6LPXODWLRQ�RI�:DUVDZ�),5
19
hour period and TCs in SUW, TRZ and TMA recorded Severe Workloads. In Particular the TC in theTMA recorded almost 70% workload over the three hour period which is critically high.
Urgent remedial procedures, whether operational or organisational, will be required if these forecasttraffic levels of 2005 are to be safely and efficiently accommodated.

5$06�6LPXODWLRQ�RI�:DUVDZ�),5
20
���� 352326('�25*$1,6$7,21�%
The first objective of the study was :-
To assess the effect on controller workload by introducing a new TMA (CCF).
The assessment of any new airspace organisation is effected by comparing the results producedtherefrom with those obtained when simulating the baseline reference organisation.
One exercise was simulated under proposed organisation B, using forecast traffic levels for 2005.The exercise was designed to evaluate the introduction of a CCF-East and a CCF-West to replacethe original TMA which already recorded critically high workloads in the reference organisation.
The vertical dimensions of the CCF extended from FL105 to FL285. Geographically the two CCFswere contained within a circle of a 75 mile radius from ‘OKE’. East and West were divided by a linerunning from north/west to south/east where airway UR23 between GRU and PNO remained in CCF-East.
������ 7DFWLFDO�&RQWUROOHU�:RUNORDG���2UJ�%�YHUVXV�2UJ�$
)LJXUH���
Figure 13 above compares the workloads recorded for the TCs in reference organisation A andproposed organisation B.
Columns depicted in red represent values recorded in respect of reference organisation A.
Columns depicted in green represent values recorded in respect of proposed organisation B.
As the only organisational change introduced in proposed organisation B was replacing the TMA withCCF-East and CCF-West, little or no difference exists between the workloads recorded for the TCs inthe en-route sectors in reference organisation A and proposed organisation B.
However, the severe workloads recorded for the TC in the TMA in reference organisation A weresignificantly reduced by the introduction of the CCF-East and the CCF-West in proposed organisationB, bringing the workloads back to an acceptable level of Moderate.
0.00%
10.00%
20.00%
30.00%
40.00%
50.00%
60.00%
70.00%
TC-DRE TC-GRU TC-JED TC-SUW TC-TRZ TC-TMA TC-CCF_W TC-CCF_E
7DFWLFDO�&RQWUROOHU�:RUNORDGVRYHU���+RXUV�2UJ�$���2UJ�%
ORG A
ORG B

5$06�6LPXODWLRQ�RI�:DUVDZ�),5
21
Clearly the replacement of the TMA by the CCF-East and the CCF-West would address the criticalsituation which would exist with forecast traffic levels of 2005.
���� 352326('�25*$1,6$7,21�&
The second objective of the study was :-
To assess the impact on controller workload by introducing superimposed sectorisation to en-routesectors.
One exercise was initially simulated in proposed organisation C. This exercise was designed toevaluate the impact on controller workload by introducing superimposd sectorisation to the en-routesectors. FL265 was agreed as the level for the vertical split in the en-route sectors to ensure that alldomestic traffic operating in the Warsaw FIR would remain in the lower sectors.
Superimposed sectorisation was introduced to sectors GRU, DRE, TRZ and JED. Sector SUW/SIEremained as one sector with no superimposed sectorisation.
������ 3ODQQLQJ�&RQWUROOHU�:RUNORDGV
)LJXUH���
Figure 14 above compares the workloads recorded for the PCs in the upper and lower sectors ofproposed organisation C.
Columns depicted in red represent values recorded in respect of workload for the PCs in the lowersectors.
Columns depicted in green represent values recorded in respect of workload for the PCs in the uppersectors.The column depicted in blue represents the value recorded for the PC in the SUW/SIE sector whichhad no superimposed sectorisation.
Large imbalances were shown between the workloads recorded for the PCs in the upper sectors andthe workloads recorded for the PCs in the lower sectors. However, the overall percentages of
0.00%
10.00%
20.00%
30.00%
40.00%
50.00%
DRE GRU JED SUW TRZ
3ODQQLQJ�&RQWUROOHU�:RUNORDGRYHU���+RXUV
PC LOWER
PC UPPER

5$06�6LPXODWLRQ�RI�:DUVDZ�),5
22
workload recorded were very low. The workloads recorded in the lower sectors were extremely lowindicating that FL265 was an inappropriate level for the vertical split.
������ 7DFWLFDO�&RQWUROOHU�:RUNORDGV
)LJXUH���
Figure 15 above compares the workloads recorded for the TCs in the upper sectors and the TCs inthe lower sectors of proposed organisation C.
Columns depicted in red represent values recorded in respect of workload for the TCs in the lowersectors.
Columns depicted in green represent values recorded in respect of workload recorded for TCs in theupper sectors.
The column depicted in blue represents the value recorded for the TC in the SUW/SIE sector whichhad no superimposed sectorisation.
Huge imbalances were evident between the workloads recorded for the TCs in the upper sectors andthe TCs in the lower sectors. The TCs in the upper sectors continued to record Heavy Workloadswhile the TCs in the lower sectors recorded extremely low workloads.
The superimposd sectorisation with the vertical split at FL265 had no impact on the controllerworkload as it failed to reduce the workload recorded for the TCs.
0.00%
10.00%
20.00%
30.00%
40.00%
50.00%
60.00%
70.00%
DRE GRU JED SUW TRZ
7DFWLFDO�&RQWUROOHU�:RUNORDGRYHU���KRXUV
TC LOWER
TC UPPER

5$06�6LPXODWLRQ�RI�:DUVDZ�),5
23
������ 7DFWLFDO�&RQWUROOHU�:RUNORDGV���2UJ�%�YHUVXV�2UJ�&
)LJXUH���
Figure 16 above compares the workloads recorded for the TCs in Proposed Organisation B with nosuperimposed sectorisation and workloads recorded for the TCs in the upper sectors only in proposedorganisation C.
Columns depicted in red indicate the values recorded in respect of workload for the TCs in proposedorganisation B.
Columns depicted in green indicate the values recorded in respect of workload for the TCs in theupper sectors of proposed organisation C.
Each sector had a slight decrease in workload with the introduction of superimposed sectorisation butnothing of any significance. TCs without superimposed sectorisation in proposed organisation Brecorded Heavy Workloads while TCs in the upper sectors with the superimposed sectorisation inproposed organisation C also recorded Heavy Workloads.
Clearly FL265 was an inappropriate level for the vertical split to have any impact on controllerworkload. Because of these results two additional exercises were run at the end of the simulationstudy to examine superimposed sectorisation with vertical splits at higher levels FL320 and FL340.FL340 proved to be the better option of the two additional options simulated. Both the TCs in thelower and upper sectors with the vertical split at FL340 recorded Moderate Workloads.
Throughout proposed organisations B and C, sectors SUW and SIE were treated as one sector withno superimposed sectorisation. With forecast traffic levels for 2005, sector SUW/SIE recorded SevereWorkloads for the TC.
0.00%
10.00%
20.00%
30.00%
40.00%
50.00%
60.00%
70.00%
TC-DRE TC-GRU TC-JED TC-SUW TC-TRZ
7DFWLFDO�&RQWUROOHU�:RUNORDGRYHU���+RXUV�2UJ�%���2UJ�&
ORG B
ORG C

5$06�6LPXODWLRQ�RI�:DUVDZ�),5
24
���� 352326('�25*$1,6$7,21�'
Proposed organisation D was simulated to examine the effects of extending the northern boundary ofsector DRE to include Airway B45, thus reducing the geographical size of sector GRU. Both sectorshad superimposed sectorisation as proposed organisation C. Sectors SUW and SIE were treated asseparate sectors in this organisation with no superimposed sectorisation.
Sectors TRZ and JED were treated as proposed organisation C, with superimposed sectorisation.
������ 7DFWLFDO�&RQWUROOHU�:RUNORDGV
)LJXUH���
Figure 17 above depicts the average three hour loadings measured in respect of the TCs in exerciseProD.05/C
The main results for this exercise are for sectors SUW and SIE. Sector SIE recorded ModerateWorkloads for the TC while sector SUW recorded Heavy Workloads. The easiest way to analysethese results is to compare the results from proposed organisation C to the results of the sectorswhich changed in proposed organisation D.
0.00%
10.00%
20.00%
30.00%
40.00%
50.00%
60.00%
70.00%
TC-DRE TC-GRU TC-JED TC-TRZ TC-SIE TC-SUW
7DFWLFDO�&RQWUROOHU�:RUNORDGRYHU���+RXUV
LOWER
UPPER

5$06�6LPXODWLRQ�RI�:DUVDZ�),5
25
������ 7DFWLFDO�&RQWUROOHU�:RUNORDGV���2UJ�&�YHUVXV�2UJ�'
)LJXUH���
Figure 18 above depicts the workloads recorded for sectors DRE UPPER and GRU UPPER inproposed organisation C and the workloads recorded for the same sectors with the geographicalchange to the sector boundary in proposed organisation D. It also depicts the workloads recorded forsector SUW/SIE in proposed organisation C and the workloads recorded in proposed organisation Dwhen this sector was treated as two separate sectors.
The extension of the northern boundary of sector DRE to include Airway B45 had no effect on theworkloads recorded for the TCs in DRE or GRU. Sector DRE UPPER recorded Heavy Workloadswhile sector GRU UPPER recorded Moderate Workloads in both organisations.
Treating sectors SUW and SIE as separate sectors had more of an impact. In proposed organisationorganisation C, sectro SUW/SIE recorded Severe Workloads. However, when treated as separatesectors in proposed organisation D, sector SIE recorded Low to Moderate Workloads for the TC whilesector SUW recorded a Heavy Workload for the TC.
���� 352326('�25*$1,6$7,21�(
Proposed organisation E simulated two exercises. ([HUFLVH�3UR(����& to examine the effects of theintroduction of RVSM levels in Warsaw FIR and H[HUFLVH�3UR(����&DS to determine the sectorcapacity of all sectors in Warsaw FIR 1999.
0.00%
10.00%
20.00%
30.00%
40.00%
50.00%
60.00%
70.00%
TC-DREUPR TC-GRUUPR TC-SUW TC-SIE TC-SUW
7DFWLFDO�&RQWUROOHU�:RUNORDG�RYHU���+RXUV2UJ�&���2UJ�'
ORG C
ORG D

5$06�6LPXODWLRQ�RI�:DUVDZ�),5
26
������ 7DFWLFDO�&RQWUROOHU�:RUNORDG��5960�YHUVXV�1RQ�5960�
)LJXUH���
Figure 19 above depicts the Tactical Controller workload three hour average values recorded inrespect of Warsaw FIR at year 2005 traffic levels with and without RVSM.
Chart columns depicted in red represent Tactical Controller workloads recorded without RVSM.
Chart columns depicted in green represent Tactical Controller workloads recorded with RVSMimplemented.
With respect to the effects of the implementation, or not, of RVSM, figure 19 fails to provide auniformly conclusive pattern of results in terms of controller workload values recorded across thespectrum of sectors examined. While sectors TRZ and JED show little variance in the valuesrecorded with, or without, the implementation of RVSM, sectors DRE and GRU produce more tangibledifferences, with workload being reduced with the implementation of RVSM.
On the other hand, sector SUW recorded a marked difference in controller workload with theimplementation of RVSM. The introduction of RVSM caused an increase in controller workload insector SUW. In order to simulate RVSM interfacing with non RVSM to the east, level restrictions hadto be imposed on the traffic. As a result the task to “arrange” the traffic at the appropriate levels wasforced on the TC in sector SUW, which was the sector interfacing with the eastern boundary. Thisexplains the increase in workload recorded for the TC in this sector.
0.00%
10.00%
20.00%
30.00%
40.00%
50.00%
60.00%
70.00%
TC-DRE TC-GRU TC-JED TC-SUW TC-TRZ
7&�:RUNORDG�RYHU���+RXUV5960���1RQ5960
NON RVSM
RVSM

5$06�6LPXODWLRQ�RI�:DUVDZ�),5
27
������ 6HFWRU�&DSDFLWLHV
Exercise ProE.05/Cap simulated the sectorisation in use in Warsaw FIR at the start time of the studyto determine the sector capacities in order to provide data to the CFMU.
)LJXUH���
Figure 20 above depicts a result table in respect of the capacity assessments conducted for all of thesectors examined.
Capacity assessment graphs with respect to the results obtained from examination of the individualsectors are contained in the following pages.
������ 6HFWRU�&DSDFLW\�5HVXOWV�±�,QGLYLGXDO�6HFWRUV
)LJXUH���
Figure 21 above shows the graph resulting from the Sector Capacity Assessment conducted underexercise ProE.05/Cap, with respect to sector DRE.
'5(
��
*58
��
75=
��
68:
��
70$
��
-('
��
6HFWRU�&DSDFLW\�$VVHVVPHQW6HFWRU�'5(
0
10
20
30
40
50
60
70
80
90
100
0 5 10 15 20 25 30 35 40 45 50 55 60 65 70 75 80 85 90 95 100
1XPEHU�RI�)OLJKWV
3HUFHQWDJH�:RUNORDG
HLT
43

5$06�6LPXODWLRQ�RI�:DUVDZ�),5
28
)LJXUH���
Figure 22 above shows the graph resulting from the Sector Capacity Assessment conducted underexercise ProE.05/Cap, with respect to sector GRU.
)LJXUH���
Figure 23 above shows the graph resulting from the Sector Capacity Assessment conducted underexercise ProE.05/Cap, with respect to sector JED.
6HFWRU�&DSDFLW\�$VVHVVPHQW6HFWRU�*58
0
10
20
30
40
50
60
70
80
90
100
0 5 10 15 20 25 30 35 40 45 50 55 60 65 70 75 80 85 90 95 100
1XPEHU�RI�)OLJKWV
3HUFHQWDJH�:RUNORDG
43
6HFWRU�&DSDFLW\�$VVHVVPHQW�&DSDFLW\-('
-10
0
10
20
30
40
50
60
70
80
90
100
0 5 10 15 20 25 30 35 40 45 50 55 60 65 70 75 80 85 90 95 100
1XPEHU�RI�)OLJKWV
3HUFHQWDJH�:RUNORDG
45

5$06�6LPXODWLRQ�RI�:DUVDZ�),5
29
)LJXUH���
Figure 24 above shows the graph resulting from the Sector Capacity Assessment conducted underexercise ProE.05/Cap, with respect to sector TRZ.
)LJXUH���
Figure 25 above shows the graph resulting from the Sector Capacity Assessment conducted underexercise ProE.05/Cap, with respect to sector TMA.
6HFWRU�&DSDFLW\�$VVHVVPHQW6HFWRU�75=
0
10
20
30
40
50
60
70
80
90
100
0 5 10 15 20 25 30 35 40 45 50 55 60 65 70 75 80 85 90 95 100
1XPEHU�RI�)OLJKWV
3HUFHQWDJH�:RUNORDG
HLT
38
6HFWRU�&DSDFLW\�$VVHVVPHQW6HFWRU�70$
0
10
20
30
40
50
60
70
80
90
100
0 5 10 15 20 25 30 35 40 45 50
1XPEHU�RI�)OLJKWV
3HUFHQWDJH�:RUNORDG
23

5$06�6LPXODWLRQ�RI�:DUVDZ�),5
30
)LJXUH���
Figure 26 above shows the graph resulting from the Sector Capacity Assessment conducted underexercise ProE.05/Cap, with respect to sector SUW.
6HFWRU�&DSDFLW\�$VVHVVPHQW6HFWRU�68:
0
10
20
30
40
50
60
70
80
90
100
0 5 10 15 20 25 30 35 40 45 50 55 60 65 70 75 80 85 90 95 100
1XPEHU�RI�)OLJKWV
3HUFHQWDJH�:RUNORDG
47

5$06�6LPXODWLRQ�RI�:DUVDZ�),5
31
/�� �� ������ ��� �������� ����� �
The objectives of the study were:
Assess the effect on controller workload by introducing a new TMA (CCF)
Assess the impact on controller workload by introducing superimposed sectorisation to en-routesectors
Assess the impact of the introduction of RVSM in Warsaw FIR
Assess sector capacities
The reference organisation evaluated the air traffic control procedures and sectorisation in WarsawFIR at the start time of the study (June 1998) with a 1997 traffic sample. With this scenario resultsshowed that all TCs recorded moderate workloads.
However, when this same scenario was simulated with 2005 traffic levels all en-route TCs recordedheavy workloads with the TC in the TMA recording very severe levels of workload. This problem inthe TMA, which the 2005 traffic identified, will need to be addressed if critical safety issues are to beavoided.
Organisation B addressed the problem in the TMA identified by organisation A by introducing twoapproach sectors CCF West and CCF East. This resulted in a sizeable reduction in controllerworkload with the Tactical Controller in CCF East recording moderate workloads and in the CCF Westrecording moderate to heavy workloads.
The heavy workloads identified by organisation A for the TCs in the en-route sectors was addressedby organisation C when superimposed sectorisation was introduced to the en-route sectors with avertical split at FL 265. FL 265 was chosen as the vertical split to ensure that domestic traffic in theWarsaw FIR would not penetrate the upper sectors. However this vertical split had no impact on thecontroller workload. Very low workloads were recorded for the TC in the lower sectors and heavyworkloads recorded in the upper sectors. In fact there was no significant reduction in workloadrecorded for the TC in organisation B (where there was no superimposed sectorisation) and thatrecorded for the TC in the upper sectors in organisation C.
This clearly identified FL 265 as being an inappropriate level for the split in superimposedsectorisation. As a result additional exercises were run with vertical splits at FL 320 and FL 340. FL340 proved to be the better option of the two additional exercises resulting in an even balance inworkload between the TC in the upper and lower sectors, both recording moderate workloads.
In all the organisations A, B and C simulated with 2005 traffic, sector SUW and SIE were treated asone sector with no superimposed sectorisation. This sector recorded heavy to severe workloads forthe TC. In organisation D sectors SUW and SIE were treated as separate sectors. The TC in sectorSIE recorded moderate workloads and the TC in sector SUW recorded heavy workloads.
In addition, the northern boundary of sector DRE was extended northwards to include airway B45.This had no impact on the controller workloads for DRE or GRU.
The introduction of RVSM above FL 290 had very little impact on the controller workloads except insector SUW where a significant increase in workload was recorded for the TC resulting in severeworkloads. In order to simulate RVSM interfacing with non RVSM areas to the east restrictions had tobe imposed on the traffic in the traffic sample to return to CVSM levels for eastbound traffic and go toRVSM levels for westbound traffic near the eastern boundary of the Warsaw FIR. As a result the taskto “arrange“ the traffic at the appropriate levels was forced on the TC in sector SUW. In reality the

5$06�6LPXODWLRQ�RI�:DUVDZ�),5
32
introduction of a transition area encompassing possibly more than sector SUW would help to alleviatethis problem.
Another recommendation which should be considered is the introduction of uni-directional routes.This could help to arrange the traffic into eastbound or westbound flows on particular routes whichcould reduce the number of opposite direction conflicts created by re-arranging traffic to RVSM levelsor CVSM levels.
It must be stressed that all the results presented in this document were measured for the peak threehour period per controller per sector over the simulated period (06.00 – 19.00) and were based on thecurrent practices and procedures in use in the Warsaw ACC. The RAMS tool can never reflect thereal day to day tasks of an air traffic controller. However it can clearly identify where problems may ordo exist. The main conclusions for this simulation are that the TMA as it exists today should bemodified to a similar configuration simulated in organisation B, CCF West and CCF East.
If superimposed sectorisation is to be introduced in the future, a vertical split at FL340 should beconsidered. The traffic situation in the future may not warrant superimposed sectorisation for the en-route sectors all of the time but perhaps periods during the day could be identified when this shouldbe introduced. To alleviate the problems in sector SUW procedures could be drawn to avoid trafficrouting from or to the CCF East via RUDKA, TOSPO and USTIL working TC SUW.
Finally, with regards to the Capacity Assessments determined in this study there are some points thatshould be highlighted.
In fast-time model simulations the measurement of workload is derived from the mathematicalcalculation of the total working times recorded for each ATC task category (Flight data management,Co-ordinations, Conflict search, Routine R/T, Radar). The standard execution times for these taskscannot be dynamically altered during the course of a simulation exercise.
In reality however, at times of severe workload for the tactical controller, the execution times of manyof these tasks are accelerated. In fact some tasks relating to flight data management and routine R/Tcommunications are often not executed. In addition, the planning controller may assist the tacticalcontroller by handling the internal and external co-ordination tasks normally attributed to the tacticalcontroller.
Another important element not considered in these simulations is what we call random systemeffects, that is the effect of system failures and non-standard operations covering aircraft alerts andemergencies, and also the effect of weather on operations. These effects can have a significantimpact on the work, and hence the capacity of the sector.
However, sector capacity figures declared to the CFMU must always be based on normal operatingconditions. When random effect situations exist the correct operating procedure is to call on theCFMU for an adjustment to the protection required.

���������
��� ��������������������������������
������������ �!� ��"�#�
�������$������#��������

!���!�#���������%��&��� ��������
The specification and definition of tasks in the RAMS simulator is inherent to the tool’ssimulation event philosophy. The RAMS simulator is, in effect, an ATC event generator thatreports its discreet events or triggers, thereby enabling the modeller to program a unique setof activities, including user defined sets of ATC tasks and ATC participants as required, toperform a simulation project. The ATC participants are those ATCO positions described forthe sector manning arrangements.
ATC task sets are grouped by category. The main categories used in the Warsaw FIR studywere as follows :-
Flight Data Management
Co-ordination – within both the simulated ATCU and with other concerned ATCUs
Conflict Search – to formulate ATC clearances
Routine R/T Communications
Radar – to represent radar activities such as conflict detection and resolution.
All ATC tasks are activated by a pre-defined trigger. The trigger (e.g. ATC sector pierce) isthe event that initiates / ensures the recording of a specific ATC task.
Each ATC task is allocated a weighting. The weighting concerned is an arbitary unit valueassigned to the task’s actor when triggered by a simulation event. Examples of unit valueswould be – time in seconds, in the case of a controller workload study, or units of cost, in acost benefit study.
The time specified is the average time spent on the task by an experienced and fully trainedcontroller, ignoring the extreme situations which could favourably or unfavourably affect thestandard execution time.
The weighting allocated is not intended to represent the actual duration of the task, but theamount of time the controller is considered to be totally committed to the task, to theexclusion of all other tasks.
In certain cases a task may involve more than one control position, and different weightingsmay be allocated to each.
Different weightings may be allocated to the same task occurring in different sectors.
A time offset can be applied to each task. The time offset, defined in seconds, affords themodeller the flexibility to record a task before or after a specified trigger.
Where one trigger instigates multiple activities, these can be specified to occur at differenttimes.
All tasks are related to an object. An object is defined as the place or position where the taskis recorded. This may be defined either globally for all control centres or more specifically inrespect of a particular control centre, sector, airport, navigational aid etc.

The dynamic conditions of all tasks can be fine tuned to afford the highest degree of flexibilityto the ATC task specification.
The specification and definition of all ATC tasks used in the study were developed by theWarsaw ACC and the EUROCONTROL EEC / OPS working group members.
���� ���� ��� ��������'������
ATC tasks are allocated to controller positions in accordance with the sectorisation manningand distribution of duties specified for each sector simulated. The RAMS simulator cantherefor calculate both the actual workload, and the percentage loading on each position.Results can be obtained for either the entire simulation period or for specified peak periods,as required.
Note: The analysis presented in this report is based upon three hour peak periods identifiedwithin the 13 hour simulation runs conducted for each exercise.
In general, the values used in the interpretation of controller loadings are :-
Peak Hour Percentage Loading, andAverage Percentage Loading.
0EAK�(OUR�0ERCENTAGE�,OADING represents the total time spent by a working position on thetasks recorded by the RAMS simulator during the busiest 60 minute period for that positionand is expressed as a percentage of that 60 minutes. The actual time of the peak hour variesfrom one position to another. Peak hour percentage loading is used to assess the workloadproblems on individual working positions.
!VERAGE�0ERCENTAGE�,OADING represents the total time spent by a working position on thetasks recorded by the RAMS simulator for the duration of the simulation exercise (or partthereof, in excess of one hour) and is expressed as a percentage of that time. A peak threehour duration is normally selected when simulation exercises exceed 12 hours. Averagepercentage loading is used primarily to assess the balance of workload between workingpositions, especially in sectors in the same area of airspace being simulated. It may also beused to compare results obtained from different organisations.
In order to assist in the interpretation of these loadings approximate criteria are used todescribe each level as follows :-
Severe peak hour in excess of 70%Heavy peak loading in excess of 55%Severe average loading (3 hour duration) in excess of 50%Heavy average loading (3 hour duration) in excess of 40%

#//2$).!4)/.�4!3+3
4ASK�.AME $ESCRIPTION 0OSITION�AND�%XECUTION�4IME
CoOrd300G Transmit telephone estimate in PC 22 Secs TC 0 SecsSector GRU to Malmo ACC
CoOrd300G1 Transmit telephone estimate in PC 22 Secs TC 0 SecsSector GRU to Kaliningrad ACC
CoOrd300S Transmit telephone estimate in PC 22 Secs TC 0 SecsSector SUW/SIE to Kaliningrad ACC,Vilnius ACC, Minsk ACC and L’viv ACC
CoOrd300J Transmit telephone estimate in PC 22 Secs TC 0 SecsSector JED to L’viv ACC
CoOrd301G Transmit telephone estimate in PC 17 Secs TC 0 SecsSector GRU to Berlin ACC
CoOrd301D Transmit telephone estimate in PC 17 Secs TC 0 SecsSector DRE to Berlin ACC
CoOrd301T Transmit telephone estimate in PC 17 Secs TC 0 SecsSector TRZ to Berlin ACC
CoOrd301T1 Transmit telephone estimate in PC 17 Secs TC 0 SecsSector TRZ to Praha ACC
CoOrd302 Transmit telephone estimate in PC 20 Secs TC 0 SecsSector JED to Bratislava ACC
CoOrd303 Transmit estimate in all Sectors PC 10 Secs TC 0 Secsto CCF-East and CCF-West
CoOrd304E Receive clearance request in CCF_E PC 0 Secs TC 5 Secsfor departures from EPWA
CoOrd304W Receive clearance request in CCF_W PC 0 Secs TC 5 Secsfor departures from EPWA
CoOrd305 Receive clearance request in all Sectors PC 20 Secs TC 0 Secsfor departures from Domestic airports
CoOrd306 Transmit estimate in all Sectors PC 22 Secs TC 0 Secsto Domestic airports
CoOrd307W Transmit coordination request in PC 0 Secs TC 6 SecsCCF_W to CCF_E
CoOrd307E Receive coordination request in PC 0 Secs TC 6 SecsCCF_E from CCF_W

&,)'(4�$!4!�-!.!'%-%.4�4!3+3
4ASK�.AME $ESCRIPTION 0OSITION�AND�%XECUTION�4IME
FD200W Receive overflight strips in CCF_W PC 0 Secs TC 5 SecsFD200E Receive overflight strips in CCF_E PC 0 Secs TC 5 SecsFD200D Receive overflight strips in Sector DRE PC 5 Secs TC 0 SecsFD200G Receive overflight strips in Sector GRU PC 5 Secs TC 0 SecsFD200S Receive overflight strips in Sector SUW/SIE PC 5 Secs TC 0 SecsFD200J Receive overflight strips in Sector JED PC 5 Secs TC 0 SecsFD200T Receive overflight strips in Sector TRZ PC 5 Secs TC 0 SecsFD201W Receive arrival flight strips in CCF_W PC 0 Secs TC 4 SecsFD201E Receive arrival flight strips in CCF_E PC 0 Secs TC 4 SecsFD201D Receive arrival flight strips in Sector DRE PC 6 Secs TC 0 SecsFD201G Receive arrival flight strips in Sector GRU PC 6 Secs TC 0 SecsFD201S Receive arrival flight strips in Sector SUW/SIE PC 6 Secs TC 0 SecsFD201J Receive arrival flight strips in Sector JED PC 6 Secs TC 0 SecsFD201T Receive arrival flight strips in Sector TRZ PC 6 Secs TC 0 SecsFD202W Receive departure flight strips in CCF_W PC 0 Secs TC 4 SecsFD202E Receive departure flight strips in CCF_E PC 0 Secs TC 4 SecsFD202D Receive departure flight strips in Sector DRE PC 6 Secs TC 0 SecsFD202G Receive departure flight strips in Sector GRU PC 6 Secs TC 0 SecsFD202S Receive departure flight strips in Sector SUW/SIE PC 6 Secs TC 0 SecsFD202J Receive departure flight strips in Sector JED PC 6 Secs TC 0 SecsFD202T Receive departure flight strips in Sector TRZ PC 6 Secs TC 0 SecsFD203W Remove overflight strips in CCF_W PC 0 Secs TC 6 SecsFD203E Remove overflight strips in CCF_E PC 0 Secs TC 6 SecsFD203D Remove overflight strips in Sector DRE PC 6 Secs TC 0 SecsFD203G Remove overflight strips in Sector GRU PC 6 Secs TC 0 SecsFD203S Remove overflight strips in Sector SUW/SIE PC 6 Secs TC 0 SecsFD203J Remove overflight strips in Sector JED PC 6 Secs TC 0 SecsFD203T Remove overflight strips in Sector TRZ PC 6 Secs TC 0 SecsFD204W Remove departure flight strips in CCF_W PC 0 Secs TC 2 SecsFD204E Remove departure flight strips in CCF_E PC 0 Secs TC 2 SecsFD204D Remove departure flight strips in Sector DRE PC 3 Secs TC 0 SecsFD204G Remove departure flight strips in Sector GRU PC 3 Secs TC 0 SecsFD204S Remove departure flight strips in Sector SUW/SIE PC 3 Secs TC 0 SecsFD204J Remove departure flight strips in Sector JED PC 3 Secs TC 0 SecsFD204T Remove departure flight strips in Sector TRZ PC 3 Secs TC 0 SecsFD205W Remove arrival flight strips in CCF_W PC 0 Secs TC 2 SecsFD205E Remove arrival flight strips in CCF_E PC 0 Secs TC 2 SecsFD205D Remove arrival flight strips in Sector DRE PC 3 Secs TC 0 SecsFD205G Remove arrival flight strips in Sector GRU PC 3 Secs TC 0 SecsFD205S Remove arrival flight strips in Sector SUW/SIE PC 3 Secs TC 0 SecsFD205J Remove arrival flight strips in Sector JED PC 3 Secs TC 0 SecsFD205T Remove arrival flight strips in Sector TRZ PC 3 Secs TC 0 Secs

2/54).%�2�4�#/--5.)#!4)/.3
4ASK�.AME $ESCRIPTION 0OSITION�AND�%XECUTION�4IME
R/T100 First call from an aircraft entering a sector from PC 0 Secs TC 8 Secsanother ACC, excluding Praha/Bratislava
R/T101 First call from an aircraft entering a sector from PC 0 Secs TC 6 SecsPraha and Bratislava ACCs
R/T102D First call from an aircraft entering sector DRE PC 0 Secs TC 4 Secsfrom another sector
R/T102G First call from an aircraft entering sector GRU PC 0 Secs TC 4 Secsfrom another sector
R/T102J First call from an aircraft entering sector JED PC 0 Secs TC 4 Secsfrom another sector
R/T102S First call from an aircraft entering sector SUW/SIE PC 0 Secs TC 4 Secsfrom another sector
R/T102T First call from an aircraft entering sector TRZ PC 0 Secs TC 4 Secsfrom another sector
R/T103W First call from an aircraft entering CCF_W PC 0 Secs TC 19 Secsfrom another sector
R/T103E First call from an aircraft entering CCF_E PC 0 Secs TC 19 Secsfrom another sector
R/T104 First call from an aircraft in all sectors departing PC 0 Secs TC 6 Secsfrom an aerodrome
R/T105 Last message to an aircraft leaving a sector PC 0 Secs TC 6 Secsfor another sector
R/T106 Last message to an aircraft leaving a sector PC 0 Secs TC 6 Secsfor another Centre
R/T107 Traffic sequencing instructions (vectoring, speed PC 0 Secs TC 40 Secsrestrictions, traffic information etc.) to aircraftentering CCF-E and CCF_W for approachto EPWA
R/T108 Transmission of new flight level clearance PC 4 Secs TC 6 Secs
2!$!2�4!3+3
4ASK�.AME $ESCRIPTION 0OSITION�AND�%XECUTION�4IME
RD400 Radar surveillance in all sectors PC 0 Secs TC 20 SecsRD401 Resolution of tactical radar conflicts PC 0 Secs TC 78 SecsRD402 Operation of "mouse" for inter - sector radar PC 0 Secs TC 11 Secs
handovers, excluding sector DRE

#/.&,)#4�3%!2#(�4!3+3
4ASK�.AME $ESCRIPTION 0OSITION�AND�%XECUTION�4IME
CoSrch500D Conflict search by a Planning Controller in DRE to PC 3 Secs TC 0 Secsestablish a sector planning clearance
CoSrch500G Conflict search by a Planning Controller in GRU to PC 3 Secs TC 0 Secsestablish a sector planning clearance
CoSrch500S Conflict search by a Planning Controller in PC 3 Secs TC 0 SecsSUW/SIE to establish a sector planning clearance
CoSrch500J Conflict search by a Planning Controller in JED to PC 3 Secs TC 0 Secsestablish a sector planning clearance
CoSrch500T Conflict search by a Planning Controller in TRZ to PC 3 Secs TC 0 Secsestablish a sector planning clearance
Co Srch501 Conflict search by a Tactical Controller in all PC 0 Secs TC 4 Secssectors to establish a sector planning clearance

���������
��� ��������������������������������
������������ �!� ��"�#�
��$%����#���&%��

2%&%2%.#%�/2'!.)3!4)/.�!
%XERCISE�2EF!����#
SECTOR TOTAL NUMBER TOTAL FLIGHT TIME AVERAGE FLIGHTNAME OF FLIGHTS IN MINUTES TIME
DRE 228 3931.43 17.24GRU 213 4864.47 22.84JED 218 4007.67 18.38SUW 262 4694.3 17.92TMA 166 2273.75 13.7TRZ 240 4593.77 19.14TOTAL 1327 24365.39 109.22
SECTOR ATC TASK CATEGORY SECTOR
NAME C/SEARCH CO-ORD FLT DATA R/T RADAR TOTAL
DRE 26.72 34.62 39.50 45.47 99.73 246.00GRU 25.08 31.97 38.45 40.93 101.50 237.90JED 25.43 51.12 38.42 40.60 97.20 252.80SUW 30.67 42.43 46.28 51.67 119.60 290.70TMA 11.07 7.37 17.02 103.70 82.80 221.90TRZ 28.00 21.20 40.62 43.93 109.20 243.00TOTAL 146.97 188.71 220.29 326.30 610.03 1492.30
CONTROLLER HIGHEST PERCENTAGE LOADING IN ANY PERIODOF
WORKING POSITION 1 HOUR 3 HOURS
PC - DRE 18.78% 15.30%PC - GRU 18.06% 16.11%PC - JED 21.22% 18.12%PC - SUW 22.03% 19.27%PC - TRZ 15.19% 13.14%TC - DRE 34.61% 28.11%TC - GRU 35.86% 27.71%TC - JED 34.19% 29.86%TC - SUW 38.11% 34.52%TC - TMA 44.00% 34.98%TC - TRZ 39.11% 31.20%

%XERCISE�2EF!����#
SECTOR TOTAL NUMBER TOTAL FLIGHT TIME AVERAGE FLIGHTNAME OF FLIGHTS IN MINUTES TIME
DRE 311 5285.05 16.99GRU 282 6373.33 22.6JED 293 5514.55 18.82SUW 377 6731.17 17.85TMA 260 3504.48 13.48TRZ 341 6542.27 19.19TOTAL 1864 33950.85 108.93
SECTOR ATC TASK CATEGORY SECTOR
NAME C/ SEARCH CO-ORD FLT DATA R/T RADAR TOTAL
DRE 36.52 45.03 53.72 64.57 151.10 351.00GRU 33.13 39.77 50.77 56.57 151.10 331.40JED 34.18 66.82 51.22 57.67 152.00 361.90SUW 44.08 61.20 66.18 76.57 187.90 436.00TMA 17.33 11.45 26.27 168.30 189.50 412.90TRZ 39.90 31.45 57.20 67.13 191.50 387.20TOTAL 205.14 255.72 305.36 490.81 1023.10 2280.40
CONTROLLER HIGHEST PERCENTAGE LOADING IN ANY PERIOD OFWORKING POSITION 1 HOUR 3 HOURS
PC-DRE 25.64% 21.58%PC-GRU 23.58% 20.92%PC-JED 27.44% 23.44%PC-SUW 34.97% 29.44%PC-TMA 0.92% 0.46%PC-TRZ 20.53% 18.66%TC-DRE 51.83% 44.41%TC-GRU 49.67% 43.53%TC-JED 53.58% 46.19%TC-SUW 60.17% 54.56%TC-TMA 81.36% 67.99%TC-TRZ 69.89% 52.85%

%XERCISE�0RO"����#
SECTOR TOTAL NUMBER TOTAL FLIGHT TIME AVERAGE FLIGHTNAME OF FLIGHTS IN MINUTES TIME
CCF_E 133 1480.22 11.13CCF_W 149 1354.73 9.09DRE 313 5320.2 17GRU 281 6263.55 22.29JED 299 5503.9 18.41SUW 338 5848.5 17.3TRZ 338 5930.17 17.54TOTAL 1851 31701.27 112.76
SECTOR ATC TASK CATEGORY SECTOR
NAME C/ SEARCH CO-ORD FLT DATA R/T RADAR TOTAL
CCF_E 9.00 7.30 14.40 82.87 57.93 171.50CCF_W 9.93 7.30 15.55 87.85 82.30 202.90DRE 36.63 45.93 53.88 65.60 156.70 358.70GRU 33.02 39.53 50.62 56.57 156.70 336.40JED 35.00 70.45 52.32 60.20 168.60 386.60SUW 39.53 57.00 60.43 69.17 173.00 399.10TRZ 39.55 24.50 70.57 66.83 213.30 414.70TOTAL 202.66 252.01 317.77 489.09 1008.53 2269.90
CONTROLLER HIGHEST PERCENTAGE LOADING IN ANY PERIOD OFWORKING POSITION 1 HOUR 3 HOURS
PC-DRE 26.78% 22.33%PC-GRU 22.72% 20.33%PC-JED 28.86% 24.40%PC-SUW 34.14% 28.54%PC-TRZ 23.61% 19.40%TC-CCF_E 35.78% 28.73%TC-CCF_W 44.17% 36.31%TC-DRE 54.78% 47.63%TC-GRU 48.78% 43.53%TC-JED 52.33% 47.71%TC-SUW 58.50% 53.56%TC-TRZ 60.61% 51.21%

%XERCISE�0RO"���2�#
CONTROLLER HIGHEST PERCENTAGE LOADING IN ANY PERIOD OFWORKING POSITION 1 HOUR 3 HOURS
PC-DRE 26.56% 22.04%PC-GRU 22.44% 20.22%PC-JED 29.08% 24.44%PC-SUW 34.72% 29.26%PC-TRZ 23.33% 19.60%TC-CCF_E 34.31% 28.21%TC-CCF_W 45.11% 37.45%TC-DRE 45.44% 40.63%TC-GRU 45.00% 39.20%TC-JED 58.42% 50.37%TC-SUW 75.14% 68.28%TC-TRZ 68.75% 52.14%

%XERCISE�0RO#����#
SECTOR TOTAL NUMBER TOTAL FLIGHT TIME AVERAGE FLIGHT NAME OF FLIGHTS IN MINUTES TIME
CCF_E 134 1468.75 10.96 CCF_W 149 1360.22 9.13 DRELWR 71 1581.53 22.28 DREUPR 255 3736.92 14.65 GRULWR 48 1206.97 25.15 GRUUPR 243 5056.58 20.81 JEDLWR 75 1457.77 19.44 JEDUPR 238 4061.65 17.07 SUW 339 5848.72 17.25 TRZLWR 80 1391.52 17.39 TRZUPR 270 4527.42 16.77TOTAL 1902 31698.05 190.9
SECTOR ATC TASK CATEGORY SECTORNAME C/ SEARCH CO-ORD FLT DATA R/T RADAR TOTAL
CCF_E 9.07 7.4 14.53 84.05 58.3 166CCF_W 9.93 7.4 15.55 87.95 83.6 204.4DRELWR 8.52 16.18 12.05 13.73 38.63 89.12DREUPR 29.75 29.75 44.27 54.3 124 282.1GRULWR 5.6 14.42 8.37 8.5 21.35 58.23GRUUPR 28.58 25.12 43.95 49.73 140.5 287.9JEDLWR 8.75 25.62 12.23 12.73 41.45 100.8JEDUPR 27.88 44.67 42.42 49.97 135.7 300.6SUW 39.65 57.17 60.58 69.33 173.5 400.2TRZLWR 9.33 8.63 12.88 13.3 36.62 80.77TRZUPR 31.5 15.87 45.87 55.6 183.6 332.5TOTAL 208.56 252.23 312.7 499.19 1037.25 2302.62

%XERCISE�0RO#����#
CONTROLLER HIGHEST PERCENTAGE LOADING IN ANY PERIOD OFWORKING POSITION 1 HOUR 3 HOURS
PC-DRELWR 10.08% 7.05%PC-DREUPR 21.97% 18.27%PC-GRULWR 9.97% 6.05%PC-GRUUPR 19.42% 16.18%PC-JEDLWR 12.50% 9.24%PC-JEDUPR 19.39% 17.37%PC-SUW 34.14% 28.54%PC-TRZLWR 7.75% 5.55%PC-TRZUPR 17.31% 13.54%TC-CCF_E 34.89% 28.91%TC-CCF_W 46.14% 37.15%TC-DRELWR 20.33% 14.07%TC-DREUPR 49.22% 42.00%TC-GRULWR 10.44% 7.82%TC-GRUUPR 46.33% 40.44%TC-JEDLWR 18.17% 13.45%TC-JEDUPR 47.69% 40.69%TC-SUW 58.50% 53.56%TC-TRZLWR 13.97% 10.15%TC-TRZUPR 56.06% 42.75%

%XERCISE�0RO$����#
SECTOR TOTAL NUMBER TOTAL FLIGHT TIME AVERAGE FLIGHTNAME OF FLIGHTS IN MINUTES TIME
CCF_E 134 1469.12 10.96CCF_W 149 1356.18 9.1DRELWR 82 1901.65 23.19DREUPR 256 4205.15 16.43GRULWR 34 886.83 26.08GRUUPR 218 4581.47 21.02JEDLWR 75 1457.77 19.44JEDUPR 238 4060.35 17.06SIE 200 3307.35 16.54SUW 286 2539.43 8.88TRZLWR 79 1368.5 17.32TRZUPR 270 4553.4 16.86TOTAL 2021 31687.2 202.88
SECTOR ATC TASK CATEGORY SECTORNAME C/ SEARCH CO-ORD FLT DATA R/T RADAR TOTAL
CCF_E 9.07 7.4 14.53 84.05 58.3 166CCF_W 9.93 7.4 15.55 87.95 83.6 204.4DRELWR 9.8 20.9 14.07 15.87 42.3 102.9DREUPR 29.98 33.9 44.63 55.83 127.3 291.6GRULWR 3.97 9.7 5.83 5.7 15.02 40.22GRUUPR 25.43 20.97 39 43.53 124.8 253.7JEDLWR 8.75 25.62 12.23 12.73 41.45 100.8JEDUPR 15.93 44.67 42.42 49.47 131.8 284.3SIE 23.33 3.07 35.87 35.7 116.9 214.9SUW 33.47 54.1 51.2 58.57 136.1 333.4TRZLWR 9.22 8.63 12.73 13.13 36.1 79.82TRZUPR 31.62 15.87 46.05 55.93 185.3 334.7TOTAL 210.5 252.23 334.11 518.46 1098.97 2406.74

%XERCISE�0RO$����#
CONTROLLER HIGHEST PERCENTAGE LOADING IN ANY PERIOD OFWORKING POSITION 1 HOUR 3 HOURS
PC-DRELWR 12.58% 9.33%PC-DREUPR 24.50% 19.49%PC-GRULWR 5.72% 3.50%PC-GRUUPR 18.14% 14.55%PC-JEDLWR 12.50% 9.24%PC-JEDUPR 17.31% 15.12%PC-SIE 14.14% 9.39%PC-SUW 31.11% 26.76%PC-TRZLWR 7.75% 5.55%PC-TRZUPR 17.31% 13.70%TC-CCF_E 34.89% 28.91%TC-CCF_W 46.14% 37.15%TC-DRELWR 20.39% 16.00%TC-DREUPR 51.22% 43.31%TC-GRULWR 8.22% 4.90%TC-GRUUPR 40.83% 36.53%TC-JEDLWR 18.17% 13.45%TC-JEDUPR 47.69% 40.69%TC-SIE 45.25% 30.99%TC-SUW 56.78% 46.43%TC-TRZLWR 13.97% 10.15%TC-TRZUPR 59.33% 42.75%

���������
��� ��������������������������������
������������ �!� ��"�#�
����

2%&%2%.#%�/2'!.)3!4)/.�!
Sectorisation at start time of study.
%$$"
%$$4
%0"#
%0"0
%0"9
%0#%
%0$%
%0'$
%0++
,+02
%0+/
%0+3
%0+4
%0,+
%0-"
%0-)
%0--
%0-/
%0/+
%00/
%007
%02!
%02:
%03#
%03+
%03.
%039
%072
%0:'
49ABKOL
ABLOXLEG
ALM
ARDAG
ARGAD
ATVEL
BABIK
BADNO
BAKLI
BALBA
BARNU
BAVOK
BESKO
BESTO
BILNA
BIRGA
BN
BODLA
BUGUM
CHO
CZE
DAR
DBV
DETNI
DIBED
DIBRI
DIRSO
DODAN
DODEK
DOLAT
DOXON
DRE
DW
EKTIL
ESIKA
FLD
FWE
GANPI
GARGO
GDA
GILAS
GILBO
GOLBO
GOMED
GORIG
GORTI
GOSLO
GOSOT
GOVEN
GP
KI
GRELA
GRU
GUNTA
H
HDO
HG
HLV
ZAB
INDIG
IVF
JAB
JED
JEL
KAL
REP
KALIT
KAROV
KEKED
KELOD
KESIX
KMI
KNA
KOBUS
KOLJA
KOLOB
KOPOP
KOSEL
KOSMO
KOZEN
KR
KRASI
KRASO
KRN
KRT
KRW
KSC
KUKOV
KULUV
KUZUK
LARMA
LDZ
LEGIO
LENOV
LIN
LISSU
LOBSU
LUBEN
LUGIR
LUMOKLUPAS
MAKOV
MARIA
MISKA
MIXAT
MOLIL
MRA
MYSKO
NEMPI
NINTA
NONSA
OBEGO
OKE
OKL
OKLAD
OKX
OL
OLKIN
OMAVA
ONUKA
ORPADKA
PENOR
PENOX
PEPEN
PNEWY
PNO
PODAN
POZ
PPD
PRAMA
PRASK
PT
RADUN
RAK
RAKIT
RASOG
REDFI
REGLI
RENKI
ROE
RUDKA
RZE
SA
SIE
SITNO
SKARY
SKAVI
SOTET
STENA
SUDOL
SUI
SUW
TARNO
TBV
TILAV
TIRIS
TISKO
TOF
TOSPO
TOXAR
TRB
TRT
TRZ
UMTOR
USTIL
VABER
VARPA
VAVEK
VEBEX
VI
VIZAN
VNO
VOLEV
WAGWAO
WAR
WOLOD
XIDNA
ZD
ZLA
/2'��!
Véro:28.05.99
�'25
���
�3)%�357
������
�$2%
���
�4-!
���
�42:�,$:
��
�*%$
��
5.,�
'.$
5.,�
'.$
�5.,
�'.$
����
�'.$
5.,�
'.$
5.,�
'.$

02/0/3%$�/2'!.)3!4)/.�"
Introduction of CCF-East and CCF-West
%$$"
%$$4
%0"#
%0"0
%0"9
%0#%
%0$%
%0'$
%0++
,+02
%0+/
%0+3
%0+4
%0,+
%0-"
%0-)
%0--
%0-/
%0/+
%00/
%007
%02!
%02:
%03#
%03+
%03.
%039
%072
%0:'
49ABKOL
ABLOXLEG
ALM
ARDAG
ARGAD
ATVEL
BABIK
BADNO
BAKLI
BALBA
BARNU
BAVOK
BESKO
BESTO
BILNA
BIRGA
BN
BODLA
BUGUM
CHO
CZE
DAR
DBV
DETNI
DIBED
DIBRI
DIRSO
DODAN
DODEK
DOLAT
DOXON
DRE
DW
EKTIL
ESIKA
FLD
FWE
GANPI
GARGO
GDA
GILAS
GILBO
GOLBO
GOMED
GORIG
GORTI
GOSLO
GOSOT
GOVEN
GP
KI
GRELA
GRU
GUNTA
H
HDO
HG
HLV
ZAB
INDIG
IVF
JAB
JED
JEL
KAL
REP
KALIT
KAROV
KEKED
KELOD
KESIX
KMI
KNA
KOBUS
KOLJA
KOLOB
KOPOP
KOSEL
KOSMO
KOZEN
KR
KRASI
KRASO
KRN
KRT
KRW
KSC
KUKOV
KULUV
KUZUK
LARMA
LDZ
LEGIO
LENOV
LIN
LISSU
LOBSU
LUBEN
LUGIR
LUMOKLUPAS
MAKOV
MARIA
MISKA
MIXAT
MOLIL
MRA
MYSKO
NEMPI
NINTA
NONSA
OBEGO
OKE
OKL
OKLAD
OKX
OL
OLKIN
OMAVA
ONUKA
ORPADKA
PENOR
PENOX
PEPEN
PNEWY
PNO
PODAN
POZ
PPD
PRAMA
PRASK
PT
RADUN
RAK
RAKIT
RASOG
REDFI
REGLI
RENKI
ROE
RUDKA
RZE
SA
SIE
SITNO
SKARY
SKAVI
SOTET
STENA
SUDOL
SUI
SUW
TARNO
TBV
TILAV
TIRIS
TISKO
TOF
TOSPO
TOXAR
TRB
TRT
TRZ
UMTOR
USTIL
VABER
VARPA
VAVEK
VEBEX
VI
VIZAN
VNO
VOLEV
WAGWAO
WAR
WOLOD
XIDNA
ZD
ZLA
/2'��"
Véro:28.05.99
�'25
���
�3)%�357
������
�$2%
���
�##&�%
���
�##&�7
���
�42:�,$:
��
�*%$
��
5.,�
'.$
5.,�
'.$
�5.,
�'.$
����
�'.$
����
�'.$
5.,�
'.$
5.,�
'.$

02/0/3%$�/2'!.)3!4)/.�#
Introduction of superimposed sectorisation.
%$$"
%$$4
%0"#
%0"0
%0"9
%0#%
%0$%
%0'$
%0++
,+02
%0+/
%0+3
%0+4
%0,+
%0-"
%0-)
%0--
%0-/
%0/+
%00/
%007
%02!
%02:
%03#
%03+
%03.
%039
%072
%0:'
49ABKOL
ABLOXLEG
ALM
ARDAG
ARGAD
ATVEL
BABIK
BADNO
BAKLI
BALBA
BARNU
BAVOK
BESKO
BESTO
BILNA
BIRGA
BN
BODLA
BUGUM
CHO
CZE
DAR
DBV
DETNI
DIBED
DIBRI
DIRSO
DODAN
DODEK
DOLAT
DOXON
DRE
DW
EKTIL
ESIKA
FLD
FWE
GANPI
GARGO
GDA
GILAS
GILBO
GOLBO
GOMED
GORIG
GORTI
GOSLO
GOSOT
GOVEN
GP
KI
GRELA
GRU
GUNTA
H
HDO
HG
HLV
ZAB
INDIG
IVF
JAB
JED
JEL
KAL
REP
KALIT
KAROV
KEKED
KELOD
KESIX
KMI
KNA
KOBUS
KOLJA
KOLOB
KOPOP
KOSEL
KOSMO
KOZEN
KR
KRASI
KRASO
KRN
KRT
KRW
KSC
KUKOV
KULUV
KUZUK
LARMA
LDZ
LEGIO
LENOV
LIN
LISSU
LOBSU
LUBEN
LUGIR
LUMOKLUPAS
MAKOV
MARIA
MISKA
MIXAT
MOLIL
MRA
MYSKO
NEMPI
NINTA
NONSA
OBEGO
OKE
OKL
OKLAD
OKX
OL
OLKIN
OMAVA
ONUKA
ORPADKA
PENOR
PENOX
PEPEN
PNEWY
PNO
PODAN
POZ
PPD
PRAMA
PRASK
PT
RADUN
RAK
RAKIT
RASOG
REDFI
REGLI
RENKI
ROE
RUDKA
RZE
SA
SIE
SITNO
SKARY
SKAVI
SOTET
STENA
SUDOL
SUI
SUW
TARNO
TBV
TILAV
TIRIS
TISKO
TOF
TOSPO
TOXAR
TRB
TRT
TRZ
UMTOR
USTIL
VABER
VARPA
VAVEK
VEBEX
VI
VIZAN
VNO
VOLEV
WAGWAO
WAR
WOLOD
XIDNA
ZD
ZLA
/2'��#
Véro:28.05.99
�'25�5
�'25�,
���
�3)%�357
������
�$2%�5
�$2%�,
���
�##&�%
���
�##&�7
���
�42:�,$:�5
�42:�,$:�,
��
�*%$�5
�*%$�,
��
5.,
�����
'.$
5.,�
'.$
�5.,
����
�'.$����
�'.$
����
�'.$
5.,
�����
'.$
5.,
�����
'.$

02/0/3%$�/2'!.)3!4)/.�$
Sector split for SUW and SIE and new geographical dimensions for DRE and GRU.
%$$"
%$$4
%0"#
%0"0
%0"9
%0#%
%0$%
%0'$
%0++
,+02
%0+/
%0+3
%0+4
%0,+
%0-"
%0-)
%0--
%0-/
%0/+
%00/
%007
%02!
%02:
%03#
%03+
%03.
%039
%072
%0:'
49ABKOL
ABLOXLEG
ALM
ARDAG
ARGAD
ATVEL
BABIK
BADNO
BAKLI
BALBA
BARNU
BAVOK
BESKO
BESTO
BILNA
BIRGA
BN
BODLA
BUGUM
CHO
CZE
DAR
DBV
DETNI
DIBED
DIBRI
DIRSO
DODAN
DODEK
DOLAT
DOXON
DRE
DW
EKTIL
ESIKA
FLD
FWE
GANPI
GARGO
GDA
GILAS
GILBO
GOLBO
GOMED
GORIG
GORTI
GOSLO
GOSOT
GOVEN
GP
KI
GRELA
GRU
GUNTA
H
HDO
HG
HLV
ZAB
INDIG
IVF
JAB
JED
JEL
KAL
REP
KALIT
KAROV
KEKED
KELOD
KESIX
KMI
KNA
KOBUS
KOLJA
KOLOB
KOPOP
KOSEL
KOSMO
KOZEN
KR
KRASI
KRASO
KRN
KRT
KRW
KSC
KUKOV
KULUV
KUZUK
LARMA
LDZ
LEGIO
LENOV
LIN
LISSU
LOBSU
LUBEN
LUGIR
LUMOKLUPAS
MAKOV
MARIA
MISKA
MIXAT
MOLIL
MRA
MYSKO
NEMPI
NINTA
NONSA
OBEGO
OKE
OKL
OKLAD
OKX
OL
OLKIN
OMAVA
ONUKA
ORPADKA
PENOR
PENOX
PEPEN
PNEWY
PNO
PODAN
POZ
PPD
PRAMA
PRASK
PT
RADUN
RAK
RAKIT
RASOG
REDFI
REGLI
RENKI
ROE
RUDKA
RZE
SA
SIE
SITNO
SKARY
SKAVI
SOTET
STENA
SUDOL
SUI
SUW
TARNO
TBV
TILAV
TIRIS
TISKO
TOF
TOSPO
TOXAR
TRB
TRT
TRZ
UMTOR
USTIL
VABER
VARPA
VAVEK
VEBEX
VI
VIZAN
VNO
VOLEV
WAGWAO
WAR
WOLOD
XIDNA
ZD
ZLA
/2'��$
Véro:28.05.99
�'25�5
�'25�,
���
�357
������
�3)%
������
�$2%�5
�$2%�,
���
�##&�%
���
�##&�7
���
�42:�,$:�5
�42:�,$:�,
��
�*%$�5
�*%$�,
��
5.,
�����
'.$
5.,�
'.$
5.,�
'.$
�5.,
����
�'.$����
�'.$
����
�'.$
5.,
�����
'.$
5.,
�����
'.$


