digitool.library.mcgill.cadigitool.library.mcgill.ca/thesisfile31063.pdf · • • • Abstract...
100
INFORMATION TO USERS This manuscript has been reproduced from the microfilm master. UMI films the text directly from the original or copy submitted. Thus, sorne thesis and dissertation copies are in typewriter face, while others may be trom any type of computer ponter. The quality of this reproduction is dependent upon the quality of the copy submitted. Broken or indistinct print, colored or poor quality illustrations and photographs, print bleedthrough, substandard margins, and improper alignment can adversely affect reproduction. ln the unlikely event that the author did not send UMI a complete manuscript and there are missing pages, these will be noted. Also, if unauthorized copyright material had to be removed, a note will indicate the deletion. Oversize materials (e.g., maps, drawings, charts) are reproduced by sectioning the original, beginning at the upper left·hand corner and continuing trom left to right in equal sections with small overtaps. ProQuest Information and Leaming 300 North Zeeb Road, Ann Arbor, MI 48106·1346 USA 800-521-0600
Transcript of digitool.library.mcgill.cadigitool.library.mcgill.ca/thesisfile31063.pdf · • • • Abstract...
INFORMATION TO USERS
This manuscript has been reproduced from the microfilm master. UMI films
the text directly from the original or copy submitted. Thus, sorne thesis and
dissertation copies are in typewriter face, while others may be trom any type of
computer ponter.
The quality of this reproduction is dependent upon the quality of the
copy submitted. Broken or indistinct print, colored or poor quality illustrations
and photographs, print bleedthrough, substandard margins, and improper
alignment can adversely affect reproduction.
ln the unlikely event that the author did not send UMI a complete manuscript
and there are missing pages, these will be noted. Also, if unauthorized
copyright material had to be removed, a note will indicate the deletion.
Oversize materials (e.g., maps, drawings, charts) are reproduced by
sectioning the original, beginning at the upper left·hand corner and continuing
trom left to right in equal sections with small overtaps.
ProQuest Information and Leaming300 North Zeeb Road, Ann Arbor, MI 48106·1346 USA
800-521-0600


~-.
•
•
Direct Initiation of Detonations with Multi-Step Reaction
Scheme
by
Roi Dick Ng
Department of Mechanical Engineering
McGill University
Montréal. Québec. Canada
A thesis submitted to the
Faculty of Graduate Studies and Research
in partial fulfillment of the requirements for the degree of
Master' s in Engineering
© Hoi DickNg
January 2001

1+1 National Ubraryof Canada
Acquisitions andBibliographie services
395 Welinglan StrNtQftawa ON K1A 0N4C8nadII
Bibliothèque nationaledu Canada
Acquisitions etservices bibliographiques
385.""W~0IIawa ON K1A 0N4CIMdB
The author bas granted a nooexclusive licence allowiDg theNational Library ofCanada toreproduce, loan, distnbute or sencopies of tbis thesis in microfonn,paper or electronic formats.
The author retains ownersbip of thecopyright in this thesis. Neitber thethesis nor substantial extracts from itMay he printed or otherwisereproduced without the author'spermission.
0-612-70245-6
Canadl
L'auteur a accordé une licence nonexclusive permettant à laBibliothèque nationale du Canada dereproduire, prêter, distribuer ouvendre des copies de cette thèse sousla forme de microfiche/film, dereproduction sur papier ou sur formatélectronique.
L'auteur conserve la propriété dudroit d'autem qui protège cette thèse.Ni la thèse ni des extraits substantielsde celle-ci ne doivent être imprimésou autrement reproduits sans sonautorisation.
•
•
•
Abstract
The problem of direct initiation of detonations has been investigated numerically
by using a more realistic chemical kinetics scheme. The chemical kinetics model is based
on a three-step chain-branching reaction consists sequentially of a chain-initiation and a
chain-branching step. followed by a temperature independent chain-termination. The
steady ZND structure using the 3-step chemical kinetics model is compared with that
based on the standard single-step Arrhenius rate model. The 3-step chemical kinetics
model is shown to permit an independent variation of the induction and reaction zone
length and a number of different steady-state detonation profiles cao be derived. An
unsteady computation has also been performed to determine whether the solution from
steady-state analysis cao be approached asymptotically from a transient development.
Oscillatory or even chaotic detonations are observed for high values of the ratio between
the induction and reaction zone length, which is a more adequate parameter to
characterize the stability of detonation waves. The transient results also show that the
present multi-step kinetics model provides a chemical switch-off mechanism that causes
detonation failure, which cannot be described by using a single-step Arrhenius rate law.
The three regimes of direct initiation have been numerically simulated for planar,
cylindrical and spherical geometries using the present 3-step chemical kinetics model.
The use of a more realistic reaction scheme allows a unique value for the critical
ini tiation energy to be defined. The numerical results demonstrate that detonation
instability plays an important raIe in the initiation process. The effect of curvature for
cylindrical and spherical geometries has been tound to enhance the instability of the
detonation waves and thus influences the initiation process.
Sorne general theories for direct initiation have been verified from the results of
the present numerical simulation using a more detailed chemical kinetics mode!. where a
definitive value of the critical energy was obtained. lt was found that these theories are
satisfactory only for stable detonation waves and 5tart ta break down for highly unstable
detonations because they are based on simple blast wave theory and do not include a
parameter to model the detonation instability. This study suggests that a stability
parameter, such as the ratio between the induction and reaction zone length, should be
considered in the future development of a more rigorous theory tor direct initiation.
ii

•
•
•
RésuméLe problème de l'initiation directe des détonations a été étudié numériquement en
utilisant un schéma de cinétique chimique plus réaliste. Ce schéma réactionnel est basé sur
une réaction "chain-branching~~à trois étapes, qui consiste, séquentiellement, en une étape
'"chain-initiation''' et une étape "'chain-branching", suivies d'une étape '''chain-termination''
indépendante de la température. La structure ZND stationnaire obtenue grâce à ce schéma
réactionnel à trois étapes est comparée avec celle basée sur une réaction de type Arrhenius
à une seule étape. Le schéma réactionnel à trois étapes permet une variation indépendante
des longueurs des zones d'induction et de réaction, et une multitude de profils
thermodynamiques stationnaires différents peuvent être obtenus. Des calculs
instationnaires peuvent aussi être réalisés pour déterminer si la solution du calcul
stationnaire peut être approchée asymptotiquement à partir d'un développement
instationnaire. Des détonations oscillatoires et même chaotiques sont observées pour des
valeurs élevées du rapport entre les longueurs d'induction et de réaction, qui représente un
paramètre plus adéquat pour caractériser la stabilité des ondes de détonation. Les résultats
instationnaires démontrent aussi que le présent schéma multi-réactionnel permet un
mécanisme d ~extinction de la détonation, ce qui ne peut être expliqué grâce à un schéma
réactionnel Arrhenius à une seule étape.
Les trois régimes dïnitiation directe ont été simulés numériquement pour des
géométries planaire, cylindrique et sphérique à partir du présent schéma mufti-réactionnel.
L'utilisation d'un schéma plus réaliste permet de déterminer une valeur unique de l'énergie
critique dïnitiation. A partir des simulations numériques~ il est démontré que [' instabilité
des détonations joue un rôle important dans le processus d'initiation. Il a été démontré que
reffet de courbure pour les géométries cylindrique et sphérique augmente lïnstabilité de
l'onde de détonation et influence donc le processus d'initiation.
Certaines théories générales de l'initiation des détonations ont été vérifiées à partir
des résultats de la présente simulation basée sur un schéma multi-réactionnel, où une
valeur bien détinie de l'énergie critique d'initiation est obtenue. Il appert que ces théories
sont satisfaisantes uniquement pour les détonations stables. Ces théories échouent pour les
détonations hautement instables, puisque qu'elles sont basées sur la théorie simple des
ondes de souffle, et n'incluent pas de paramètre pour décrire ['instabilité des détonations.
La présente étude suggère qu" un paramètre de stabilité, tel que le rapport entre la longueur
des zones d'induction et de réaction, pourrait être considéré dans le développement futur
d'une théorie plus rigoureuse pour l'initiation directe des détonations.
iii
•
•
•
Acknowledgments
1 would like to sincerely thank my supervisor, Prof. John H.S. Lee, for giving me
the opportunity to work with the McGill Shock Wave Physic Group (SWPG) and also for
his helpful hints. availability and guidance throughout my graduate studies. A special
thank to Dr. Jean-Philippe Dionne, who taught me so many things on the field of
detonation physics and helped me to translate the abstract into French. Many thanks are
also due to Dr. Randy Chue for his valuable advice and assistance and to Dr. Kiumars
Mazaheri for allowing me to use his detonation code. 1 am grateful to Prof. Andrew
Higgins for his comments and fruitful discussions on the preparation of the final version
of this thesis. The assistance from aIl members of the Shock Wave Physics Group is
gratefully acknowledged. [ also want to extend my full gratitude to nlY family, aIl my
friends. brothers and sisters in Enoch Fellowship of Montreal Chinese Alliance Church
for their support and encouragement. Finally, 1 would like to acknowledge the Natural
Sciences and Engineering Research Council of Canada (NSERC) for their financial
support.
IV

•
•
Table of Contents
Abstract Il
Résumé III
Acknowledgements IV
Table of Contents V
List of Figures........................................................................ vii
List of Tables XII
Nomenclature...................................................................... ... XIII
Chapter 1 Introduction .
Chapter 2 The Detonation Structure.... 5
2.1 Introduction.................................................................. 5
2.2 Analytical modeI 5
2.3 Steady ZND structure...................................................... 9
2.4 Transient computation.................................................. 15
2.4.1 Stable detonation with 6" <1 19
2.4.2 Unstable detonation with 6" ~ 1 22
2.4.3 Highly unstable detonation with 6> 1 25
2.4.4 Detonability limit 26
Chapter 3 Direct Initiation of Detonation............. . 29
3.1 Introduction.................................................................. 29
3.2 The three regimes of direct initiation..................................... 30
3.2.1 The subcritical regime .
3.2.2 The supercritical regime ..
30..,..,.>.>
•3.2.3 The critical regime 36
3.3 SWACER mechanism 40
3.4 The effect of instability on direct initiation.............................. 45
3.5 Other geometries 48
V

•
•
•
3.6 The critical initiation energy ,. 52
Chapter 4 General Theories for Direct Initiation . . . . . . . . . . . . . . . . . . . . . 54
4.1 Introduction............ 54
4.2 Dependence of critical energy on induction zone length 54
4.3 Invariance of the critical explosion length Re 57
4.4 Critical kemel radius Rs• for direct initiation................. 59
Chapter 5 Conclusion 62
References 64
Appendix 1 - ZND Detonation Structure , . . . . . . . . . 68
Appendix II - Numerical Methods 75
vi
• List of Figures
•
•
Figure 2.1
Figure 2.2
Figure 2.3
Figure 2.4
Figure 2.5
Figure 2.6
Figure 2.7
Figure 2.8
Figure 2.9
Figure 2.10
One-dimensional ZND detonation structure.
p - v diagram showing possible paths of integration.
Steady ZND detonation profiles: (a) pressure profile (b)
temperature profile for mixture with Q = 10. y = 1.2. El = 20.
En = 8 and TI = 3Tshock '
Steady ZND detonation profiles: (a) mass fraction of fuel
(solid Hne) and radicals (dashed line) (b) formation of product
for mixture with Q = 10. y = 1.2. El = 20. En = 8 and TI =
3 Tshock'
Heat release profile using Q = 10. y = 1.2. El = 20. En = 8 and
TI = 3Tshock for the three-step chemical kinetics mode!.
Heat release profiles for both the single-step and three-step
chemical kinetics models for Q = 10 and r= 1.2.
Shock pressure history for a stable detonation wave with TB =
O.80T~hock for the three-step chemical kinetics model.
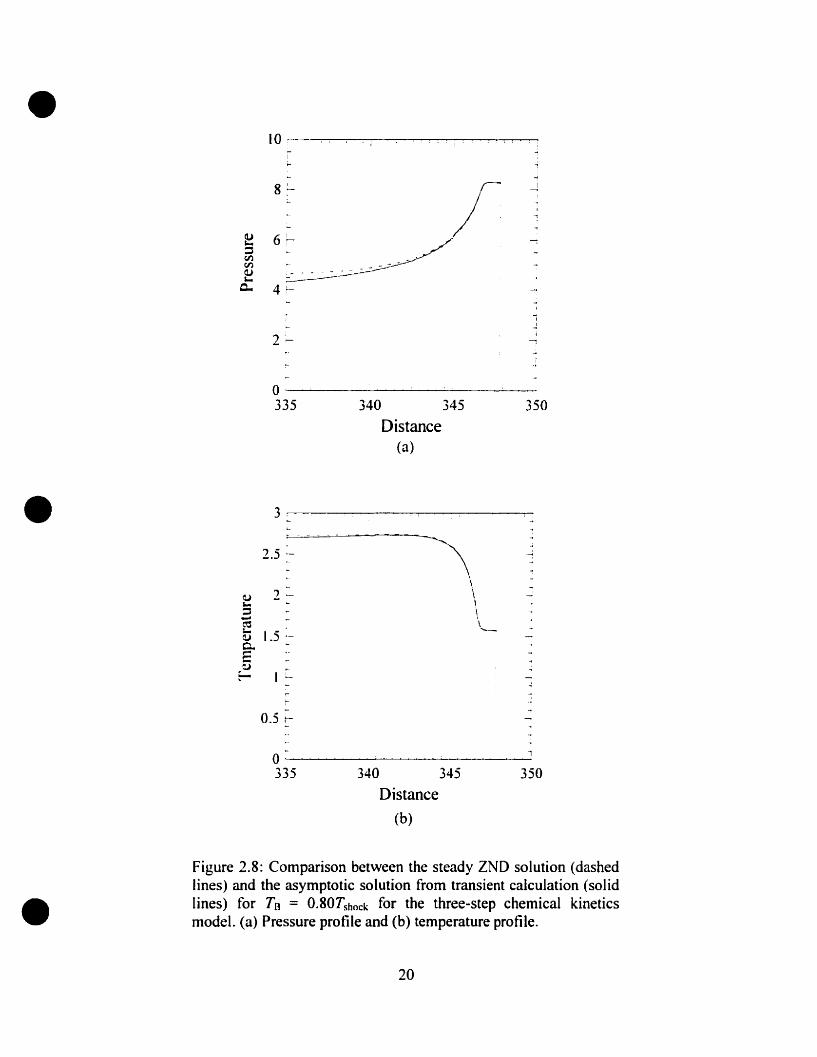
Comparison between the steady ZND solution (dashed lines)
and the asymptotic solution from transient calculation (solid
lines) for TB = O.80Ts':ock for the three-step chemical kinetics
model. (a) Pressure profile and (b) temperature profile.
Shock pressure history for a stable detonation wave uSlng
single-step chemical kinetics model with activation energy Ea
= 13.
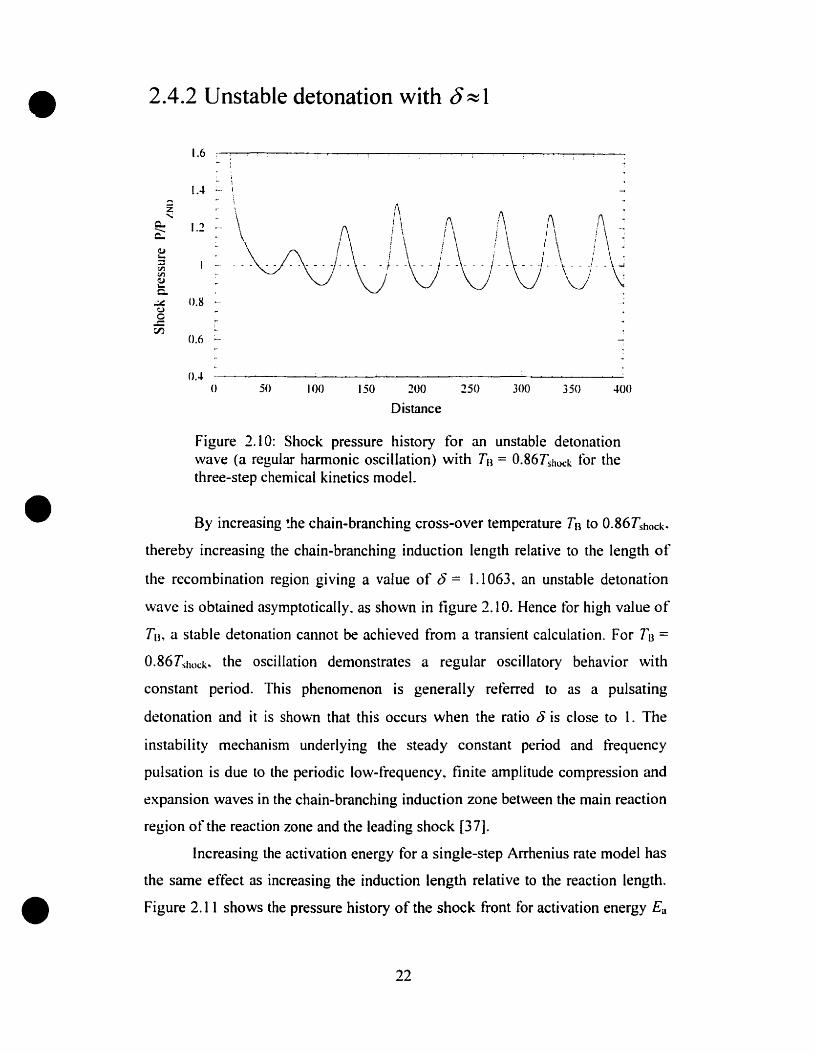
Shock pressure history for an unstable detonation wave (a
regular harmonic oscillation) with TB = O.86Tshock for the three
step chemical kinetics model.
VIl
•
•
•
Figure 2.11
Figure 2.12
Figure 2.13
Figure 2.14
Figure 2.15
Figure 2.16
Figure 3.1
Figure 3.2
Shock pressure history for an unstable detonation wave (a
regular harmonie oscillation) using single-step chemical
kinetics model with activation energy Ea = 15.
Shock pressure history for an unstable detonation wave (a
period-doubling bifurcation mode) with TB = O.88r~hock for the
three-step chemical kinetics model.
Shock pressure history for an unstable detonation wave (a
period-doubling bifurcation mode) using single-step chemical
kinetics model with activation energy Ea = 16.
Shock pressure history for an unstable detonation wave (a
chaotic oscillation mode) with TB = 0.89Tshock for the three-step
chemical kinetics mode!.
Shock pressure history for an unstable detonation wave (a
chaotic oscillation mode) using singIe-step chemical kinetics
luodel with activation energy Ea = 16.5.
Quenching of detonation wave: detonability limit with TB =
0.90r~hock tor the three-step chemical kinetics model.
Shock pressure history for the subcritical regime of initiation for
Q = 10, r= 1.2 and t5 = 0.5652 (The dashed lines represent the
non-reactive blast wave) with non-dimensional initiation energy
Es =342.
Temperature profiles at ditferent times for the subcritical regime
of initiation for Q = 10. y = 1.2 and ô = 0.5652 with non
dimensional initiation energy Es = 342.
Vlll
•
•
•
Figure 3.3
Figure 3.4
Figure 3.5
Figure 3.6
Figure 3.7
Figure 3.8
Figure 3.9
Detonation structure profiles showing the mass fraction of fuel
(solid fines) and radical (dashed lines) for the subcritical regime
of initiation for Q = 10, Y = 1.2 and 0 = 0.5652 with non
dimensional initiation energy Es = 342. The arrows indicate the
leading shock front.
Shock pressure history for the supercritical regime of initiation
tor Q = 10, Y = 1.2 and 0 = 0.5652 with non-dimensional
initiation energy Es = 670.
Temperature profiles at different limes for the supercrilicaI
regime of initiation for Q = 10, Y= 1.2 and 0 = 0.5652 with non
dimensional initiation energy Es = 670.
Detonation structure profiles showing the mass fraction of fuel
(solid lines) and radical (dashed Iines) for the supercriticaI
regime of initiation for Q = 10. y= 1.2 and 0= 0.5652 with non
dimensionaI initiation energy Es = 670. The arro\vs indicate the
leading shock front.
Shock pressure history for the criticaI regime of initiation for Q
== 10. r = 1.2 and 0 = 0.5652 with non-dimensionaI initiation
energy Es = 370.
Temperature profiles at different times for the critical regime of
initiation for Q = 10, r = 1.2 and 0 = 0.5652 with non
dimensional initiation energy Es = 370.
Detonation structure protiles showing the mass fraction of fuel
(solid lines) and radical (dashed lines) for the critical regime of
initiation for Q = 10, r = 1.2 and 0 == 0.5652 with non
dimensional initiation energy Es = 370. The arrows indicate the
leading shock front.
IX
Figure 3.14
Figure 3.15
Figure 3.10
Figure 3.13
Figure 3.11
Figure 3.12
Pressure profiles at different times tor the critical regime of
initiation for Q = 10. y == 1.2 and i5 = 0.5652 \Vith non
dimensional initiation energy Es = 370.
Heat release profile for equation 3.2.
(a) Pressure profiles and (b) x - 1 diagram for A1.SQurec = 1.
(a) Pressure profiles and (b) x - t diagram for Msonrec = 3.
(a) Pressure profiles and (b) x - / diagram for l\;/sonrce = 5.
Shock pressure history for the direct initiation of a stable
detonation with r5 = 0.5652 and different non-dimensional
initiation energies: Es'
= 342~ Es2 = 370 and EsJ =670.
Figure 3.16 Shock pressure history for the direct initiation of a highly
unstable detonation with r5 = 1.1989 and different non
dimensional initiation energies: Es' = 1370. Es2 = 1510 and EsJ =
1608.
Figure 3.17 Three regimes of initiation for Q = 10. y = 1.2 and i5 = 0.5652.
(a) Cylindrical geometry with non-dimensional initiation
energies: Es'
= 8.96xl0\ Es2 = 9.34xl0-t and EsJ = 1.18xl05 (b)
Spherical geometry with non-dimensional initiation energies: Es1
== 3.30xl07• Es2 == 4.74xl07 and EsJ = 9.06xl07
•
Figure 3.18 Direct initiation of unstable cylindrical detonation tor Q = 10. r= 1.2. i5 = 0.8975 with non-dimensional initiation energies: Es' ==
3.89xI05• Es'!. = 4.71xl05
• Es:. = 5.60x10⁵ and Es-t = 7.63xI05•
Figure 3.19 Shock pressure history for direct initiation using I-step kinetic
rate law for Q = 50. r = 1.2 and E;} = 24 for different initiation
energies: Es' = 3243~ Es'!. = 3285. Es:. = 3302. Es-t = 3361, Es5 =
3420. Esb = 3601 and Es7 =3724.
•
•
•x
•
•
•
Figure 4.1
Figure 4.2
Figure 4.3
Figure A.l
Figure A.2
Figure A.3
Figure A.4
Variation of critical initiation energy \vith ZND induction zone
length for (a) planarj = O. (b) cylindrical j = 1 and (c) sphericalj
= 2 geometries. The dashed lines show the Es·_AI-°I.
Invariance of explosion length for blast initiation for different
geometries.
Definition of critical radius Rs• from the numerical simulation of
direct initiation.
Update of the shock location.
Sh k fi k· t::. ·,,+1 ."oc ront trac 'lng lor /Sh = /Sh •
Shock front tracking for i~~;1 = i~'h + 1.
Adaptive mesh refinement.
xi
• List of Tahles
•
•
Table 2.1
Table 4.1
Table 4.2
The ratio i5 for different chain-branching cross-over temperatures
and equivalent activation energies Ea for Q = 10, y= 1.2. El = 20.
Es = 8 and TI = 3Tshod.·
Results of critical radius Rs• for direct initiation from the present
numerical simulations.
Experimental results of critical kemel radius for different
geometries.
xii

• Nomenclature
c0
e
Es
*Es
El
E[j
F
ffi
j
kl
k[j
• kc
Als
*i'vf~
p
Q,.r.:
Rn
Rs*Rs
T
•il
V
sound speed in the unburned mixture
total internai energy
source energy
critical initiation energy
activation energy of the initiation step
activation energy of the chain branching step
fuel species
mass fraction of fuel
specific enthalpy
geometric index (j=0, 1. 2 for planar. cylindrical and spherica1)
rate constant of the initiation step
rate constant of the chain branching step
rate constant of the chain termination step
shock Mach number
critical shock Mach number
pressure
total chemical heat release
distance coordinate
characteristic length scale
explosion length
shock radius
critical radius
temperature
time
characteristic time scale
particle velocity
specifie volume
xiii
• W1 reaction rate of the initiation step
WI] reaction rate of the chain branching step
Wc reaction rate of the chain termination step
y radical species
y mass fraction of radicals
Acronyms
Cl Chapman-louguet
DDT Deflagration to Detonation Transition
SWACER Shock Wave Amplification by Coherent Energy Release
VN Von Neumann
lND Zerdovich- Von Neumann- Doring
Greek
• a· blast wave constant1
.1( induction zone length
d R reaction zone length
i5 ratio between induction and reaction zone length
r ratio of specifie heats
À detonation cell size
P density
Po initial density
Subscripts
L left
R right
0 initial condition, unburnt mixture properties
• sh post-shock condition
xiv

•
•
•
Chapter 1
Introduction
There are two modes of combustion in general: detlagration and
detonation. Detonation is a supersonic combustion wave that propagates via auto
ignition from adiabatic shock compression in contrast with slow deflagration
whose propagation depends on heat diffusion and mass transport. GeneraUy, a
detonation can be tormed in two ways. One way involves the acceleration of a
flame. which eventually results in the transition to a detonation under appropriate
boundary conditions. This is usually referred to as deflagralion to detonation
lransition (DDT). Altematively, the other mode of initiation is when the
detonation is formed instantaneously from the asymptotic decay of the strong
blast wave generated by a rapid deposition of a large arncunt of energy into the
combustible mixture. This mode of initiation is usually referred to as direcl or
hlast initiation. This thesis foc uses mainly on the direct initiation of detonation.
ln the limit of an ideal instantaneous point source energy. the ignition
energy becomes the sole parameter that determines the possible outcome of the
initiation process. i.e., whether a detonation can be initiated or not. If. for given
experimental condition, a sufficiently large amount of energy is released by the
igniter, then the blast wave will decay asymptoticaUy to the Chapman-louguet (C
l) velocity of the combustible mixture. A self-sustained detonation is thus
successfully initiated. If the igniter energy is too low. the initiation of detonation
fails. In this case. the blast wave generated by the igniter will progressively
decouple from the reaction zone and eventually decays to a weak shock wave. A
critical threshold value for the initiation energy can be identified below which no
detonation can be formed. This minimum energy required to successfully initiate
a detonation is usually referred to as the crilical initialion energy.
•
•
•
Over the past tour decades. direct initiation of detonation has been a
subject of intense study. Since the pioneer work of Zel'dovich et al. [42].
significant advances have been made toward the understanding of direct initiation
phenomenon. Nurnerous studies were carried out which attempted to yield a
predictive theory for the critical initiation energy. In spite of aIl these efforts. a
quantitative theory capable of predicting the critical energy from tirst principles
based on thermo-chemical and chemical kinetics data of the mixture is still
lacking. Moreover. the weakest parts of previous theoretical and numerical
investigations on direct initiation is their sub-model tor chemical kinetics. Most of
these investigations are based on an idealized single-step Arrhenius rate law to
model the chemistry. Although the use of single-step Arrhenius kinetics model
simplifies the analysis and reveals sorne interesting global features of the
phenomenon. it does not describe the realistic reaction scheme of most explosive
mixtures. Hence. the results obtained are not even in qualitative agreement with
sorne experimental observations. For instance. in the numerical study by Mazaheri
[30]. it was demonstrated that a single-step Arrhenius rate law is not an adequate
chemical kinetics model for the problem of direct initiation due to the ditliculty in
defining a unique value of critical initiation energy. For single-step chemistry. a
system without losses will always react to completion. Hence initiation will
always occur after a sufficiently long time and a critical value of initiation energy
no longer exists. This often yields the non-physical result that initiation of
detonation can always be achieved via any arbitrary strength of shock wave.
Recent studies have revealed that detailed chemical kinetics steps are also
able to influence the initiation and propagation of the detonation wave. as weil as
the detonation structure. Dionne [13] studied the propagation of non-ideal
detonations arising from reaction steps involving a competition between
exothermic and endothermic reactions. Il was tound that the propagation of
detonation couId be different by using more than one single-step rate law. Dionne
reported that pathological detonations. i.e., detonations can travel at a velocity
tàster than the Chapman Jouguet value. are possible when there are more than
one-step kinetics present in the chemical model.
2
•
•
•
Dold & Kapila [15] have investigated the difference between shock
initiation of detonation based on an asymptotic analysis using a global one-step
model and a three-step chain-branching chemical model. They found that the
development of detonation behind an initiating shock wave is fundamentally
different when the chemistry is modeled using a radical chain-branching
mechanism from that of using a global one-step model. Their analyses show that a
one-step model is probably not adequate for the study of detonation initiation in
combustible mixtures, which are typically burned via a radical chain-branching
process.
More recently. Short & Quirk [36] have studied the non-linear stability of
a pulsating detonation using the same three-step chain-branching reaction model
as in the work of Dold & Kapila [15]. They showed that similar mechanisms for
the regular and iITegular modes of instability for both the three-step reaction
model and the standard one-step reaction mode!. However. the use of the three
step chain-branching reaction has a distinct advantage over the standard one-step
Arrhenius model because a well-defined detonability limit cao now be obtained.
In view of the different qualitative features obtained from these studies
where a more detailed chemical kinetics is used. it appears of interest to
investigate the direct initiation problem using again more realistic chemical
kinetics model. Therefore, the main objective of this thesis is to elucidate further
the direct initiation phenomenon and investigate the importance of the chemical
kinetics scheme used. The motivation for such an investigation is to contribute
toward the development of a rigorous theory of direct initiation.
The present investigation was caITied out via numerical simulations. A
number of numerical schemes are now available [7], which are capable of
reproducing many aspects of the highly transient and unstable events of the
initiation and propagation of gaseous detonation. Numerical simulations can
provide a lot of information. which is difficult to obtain from actual experiments.
Although a complex set of kinetics rate equations could in principle be solved
simultaneously with the reactive Euler equations within CUITent computational
capabilities. it suffices to use a simplified system of three-step reaction
3

•
•
•
mechanism to just reproduce the qualitative aspects of the initiation phenomenon
[27]. In the present study. the same three-step chain-branching reaction model as
in the work of Dold & Kapila [15] and Short & Quirk [36] is used to simulate the
direct initiation phenomenon. This model consists of a chain-initiation and a
chain-branching step. followed by a temperature independent chain-termination. ft
can represent a generic three-step chemical-kinetics description of a real ehain
branching reaetion.
The thesis is divided into five Chapters. In Chapter 2. the ehemical
kineties model and the goveming equations of the problem are tirst diseussed in
detail. To demonstrate the effeet of the kinetics rate model on detonation. the
steady lND structure using a 3-step chemical kinetics model is investigated and
comparison is made with the structure obtained from a single Arrhenius rate law.
A transient computation is also carried out to determine whether the solution from
the steady state analysis can be approaehed asymptotieally. The instability of
detonation waves observed from the fully unsteady computation and its
dependence on the chemical kinetics rate model are also discussed. The regimes
of direct initiation are then simulated numerically in Chapter 3 tor different
geometries of planar. cylindrical and spherical case. The effeet of detonation
instability and the eurvature effect on initiation are investigated. followed by a
discussion on the existence of a unique value of critical initiation energy with the
present 3-step chemical kinetics scheme. In Chapter 4. sorne general theories lor
direct initiation are verified through the present numerical results. Finally. the
thesis is ended by sorne concluding remarks in Chapter 5.
4
•
•
•
Chapter 2
The Detonation Structure
2.1 Introduction
Betore we investigate the dependence of the direct initiation process on
the details of the chemical kinetics model. it is worthwhile to first examine the
steady ZND detonation structure using different chemical kinetics models. We
shaH first consider the steady ZND structure using a 3-step chemical kinetics
model and compare the qualitative differences l'rom that based on the standard
single-step Arrhenius rate model used in most theoretical studies. An unsteady
analysis is also carried out to verify the existence of the steady-state detonation
l'rom an initial transient development and elucidate the nonlinear instability of the
one-dimensional detonation wave.
2.2 Analytical model
The dynamics of unsteady propagation of a one-dimensional detonation
can be described by the one-dimensional reactive Euler equations. Le.. a set of
hyperbolic partial diftèrential equations in space (in laboratory frame) and time
that express the conservation of mass. momentum and energy. They have the
following non-dimensional form:
ap + a(pu) + l (pu) =0al ar r
a(pu) +~ (pu:! +p)+ l (pu:! )= 0al ar r
a( ) a .--I!!!- + -[u(~ + p)]+ L[u{,œ + p)] = 0
al a,. r(2.1 )
5
•
•
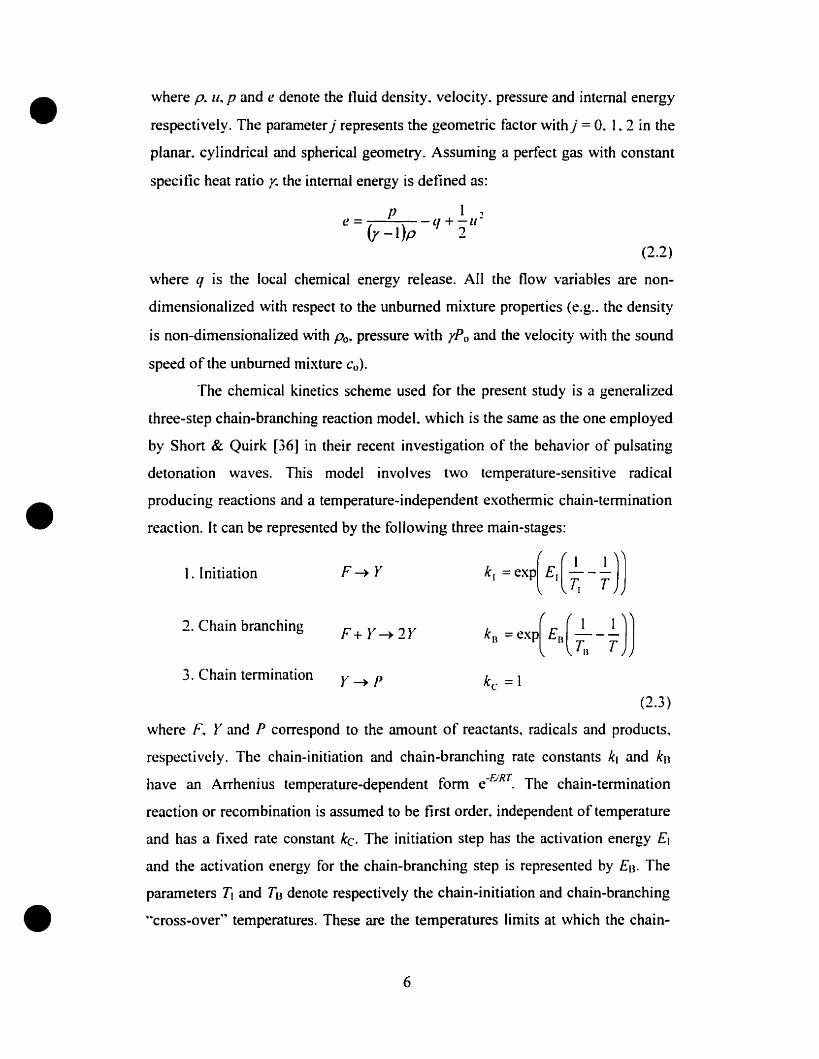
where p. u~ p and e denote the tluid density. velocity. pressure and internai energy
respectively. The parameter j represents the geometric factor withj = O. 1. 2 in the
planar. cylindrical and spherical geometry. Assuming a perfect gas with constant
specitic heat ratio y. the internai energy is detined as:
pl,e= -q+-u~
(y -l)p 2(2.2)
where Cf is the local chemical energy release. Ali the flow variables are noo
dimeosionalized with respect to the unbumed mixture properties (e.g.. the density
is non-dimensionalized with po~ pressure with yPo and the velocity with the sound
speed of the unbumed mixture co),
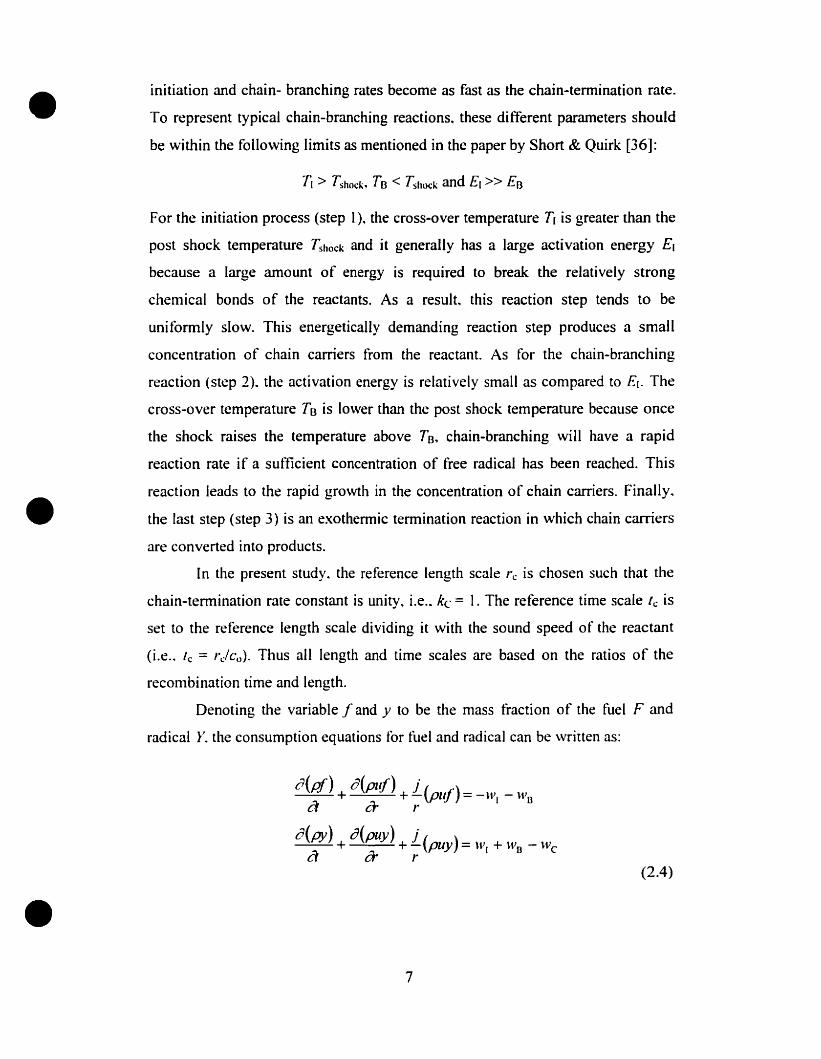
The chemical kinetics scheme used for the present study is a generalized
three-step chain-branching reaction modeL which is the same as the one employed
by Short & Quirk [36] in their recent investigation of the behavior of pulsating
detonation waves. This model involves two temperature-sensitive radical
producing reactions and a temperature-independent exothermic chain-termination
reaction. It can be represented by the following three main-stages:
1. Initiation
2. Chain branching
3. Chain termination
F+ Y~ 2Y
Y~P
k1 = exp( E.(;' -nJ
kR = exp( ERU., -nJ
•
(2.3)
where F~ Y and P correspond to the amount of reactants. radicals and products.
respectively. The chain-initiation and chain-branching rate constants k, and ku
have an Arrhenius temperature-dependent form e-EiRT. The chain-termination
reaction or recombination is assumed to be first order. independent of temperature
and has a fixed rate constant kc. The initiation step has the activation energy El
and the activation energy for the chain-branching step is represented by EB. The
parameters TI and TB denote respectively the chain-initiation and chain-branching
"cross-over'~ temperatures. These are the temperatures limits at which the chain-
6
•
•
•
initiation and chain- branching rates become as fast as the chain-termination rate.
T0 represent typical chain-branching reactions. these different parameters should
be within the following limits as mentioned in the paper by Short & Quirk [36]:
For the initiation proeess (step 1). the cross-over temperature TI is greater than the
post shock temperature Tshock and it generally has a large activation energy El
because a large amount of energy is required to break the relatively strong
chemical bonds 0 f the reactants. As a result. this reaction step tends to be
unitormly slow. This energetically demanding reaction step produces a small
concentration of chain carriers from the reactant. As for the chain-branching
reaction (step 2). the activation energy is relatively small as compared to El_ The
cross-over temperature TB is lower than the post shock temperature because once
the shoek raises the temperature above TB. chain-branching will have a rapid
reaction rate if a sufficient concentration of free radical has been reached. This
reaetion leads to the rapid growth in the concentration of chain carriers. Finally.
the last step (step 3) is an exothermie termination reaction in which chain camers
are converted into produets.
ln the present study. the referenee length seale rc is chosen such that the
chain-termination rate constant is unity. i.e.. kc = 1. The reference time scale le is
set to the reference length seale dividing it with the sound speed of the reactant
(i.e.. te = r,)co). Thus ail length and time seales are based on the ratios of the
recombination time and length.
Denoting the variable f and y to be the mass fraction of the fuel F and
radical Y. the consumption equations tor fuel and radical can be written as:
a(pf) + o(pl~l) + L(plIf) = -lt'l - lt'l)
a cr r
o(py) + o(puy) + L(nlJu) = W + li' - Wa à· r ""~J 1 n c
(2.4)
7

where:• Wc =y
•
•
(2.5)
The local chemical energy release cao be written as:
{,1 =0 - f .0 - ". (0 + 0 )_ _ J _ -c:ndo.
(2.6)
where Q is the total amount of energy released by the fuel and Q..:ndo. represents
the amount of endothermic energy absorbed by the initiation and chain-branching
reactions because energy is required to break the bond and dissociate the reactant
into free radicals. In the present study. Qcndo. is set to zero for simplicity without
loss of generality.
Using the above described chemical kinetics model. four parameters can
be adjusted. namely El, Eo. Tl and TB. These parameters can indeed control the
ratio of the chain-branching induction length to the length of the recombination
zone. It should he noted that it is possible to derive a numher of different steady
detonation profiles under the ordered limits allowed by the parameters. This
model has an advantage over the standard single-step rate law because it allows
the variation of the two important length scales of the reaction. namely the
induction and reaction zone length. Here. value of Q = 10. El = 20. Eo = 8. Tl =
3T'iIHld: and y= 1.2 are used throughout. unless specified otherwise.
8
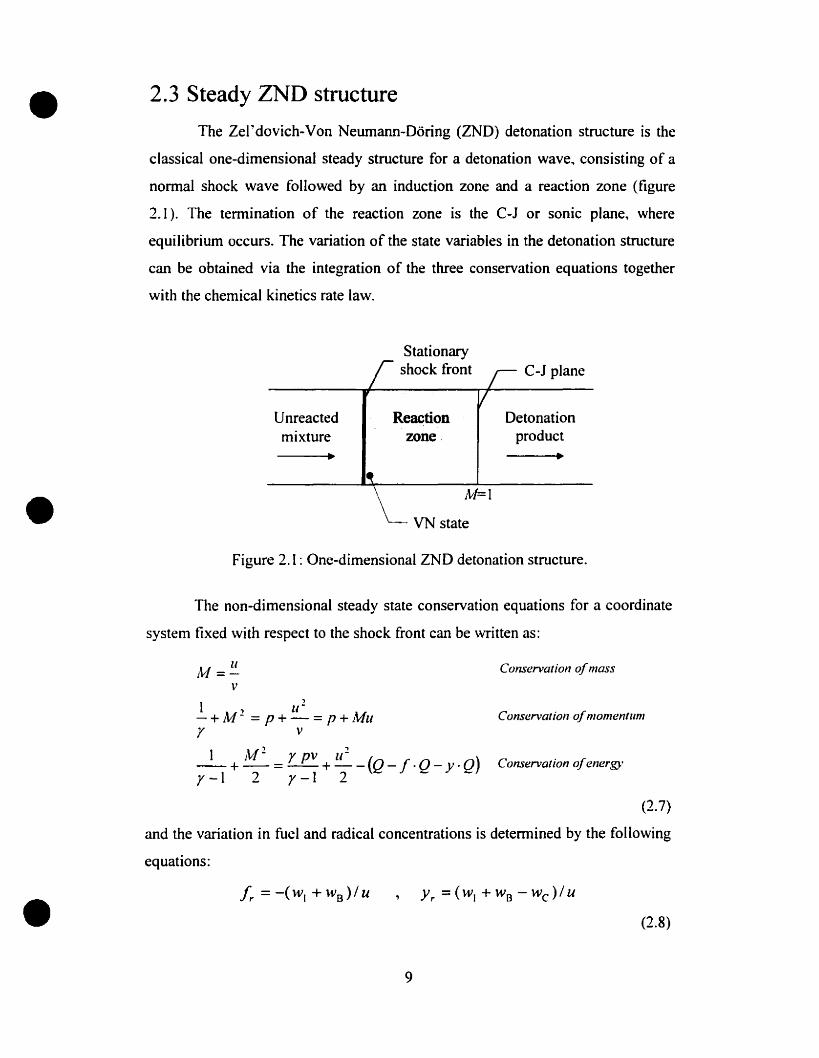
• 2.3 Steady ZND structure
The Zerdovich-Von Neumann-Doring (ZND) detonation structure is the
c1assical one-dimensional steady structure for a detonation wave., consisting of a
normal shock wave followed by an induction zone and a reaction zone (figure
2.1). The tennination of the reaction zone is the C-J or sonic plane, where
equilibrium occurs. The variation of the state variables in the detonation structure
can be obtained via the integration of the three conservation equations together
with the chemical kinetics rate law.
Stationaryshock front C-J plane
•Unreactedmixture
•
Reactionzone .
,\;f=1
VN state
Detonationproduct
•
Figure 2.1: One-dimensional ZND detonation structure.
The non-dimensional steady state conservation equations for a coordinate
system fixed with respect ta the shock front cao be written as:
l'v! = !!v
l ') li.'!-+M- =p+-=p+Muy v
1 J'vI.'! Y pv u 2( )-+-=-+-- O-I'O-y'O
y-I 2 y-l 2 - - -
Conservation ofmass
Conservation ofmomentum
Conservation ofenergy
(2.7)
•and the variation in fuel and radical concentrations is determined by the following
equations:
Yr =(wr +wB -wc)/u
(2.8)
9
•
•
•
where the subscript r denotes the derivative with respect to the distance r.
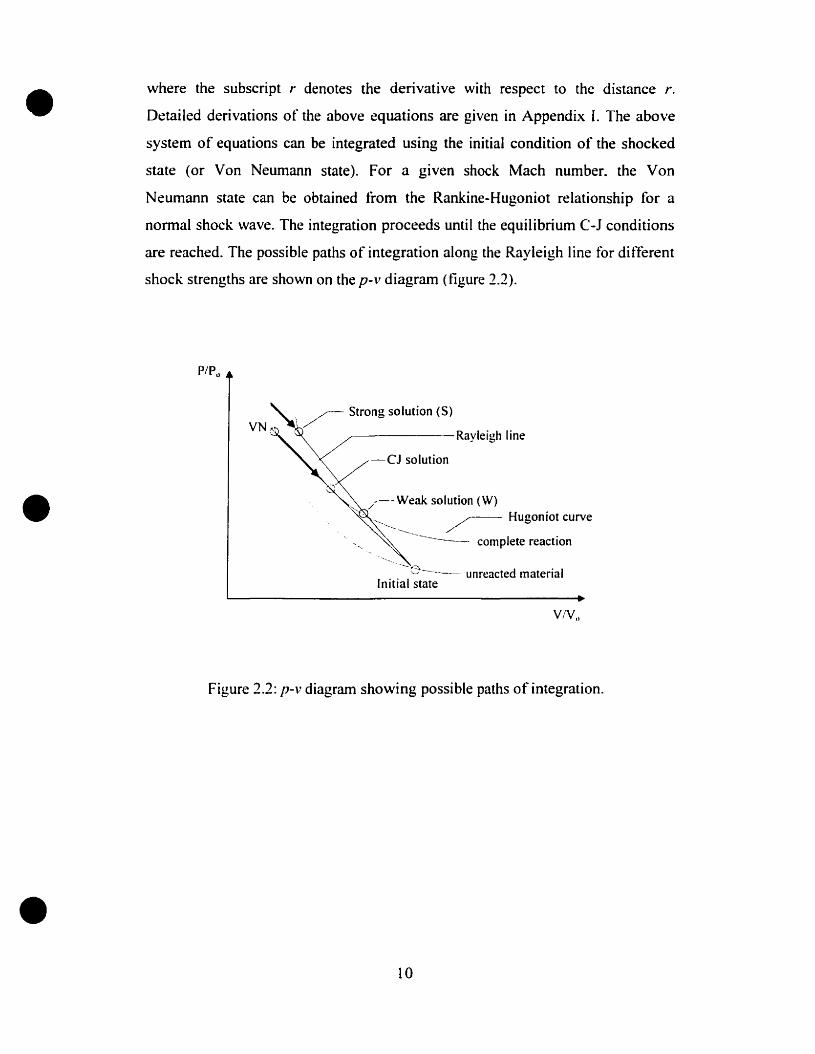
Detailed derivations of the above equations are given in Appendix 1. The above
system of equations can he integrated using the initial condition of the shocked
state (or Von Neumann state). For a given shock Mach number. the Von
Neumann state can be obtained from the Rankine-Hugoniot relationship for a
normal shock wave. The integration proceeds until the equilibrium C-J conditions
are reached. The possible paths of integration along the Rayleigh line for different
shock strengths are shown on the p-v diagram (ligure 2.2).
~CJ solution
,0" /-Weak solution (W) .
. . '-......~...... ~ Hugomot curve
. ',~ ---------- complete reaction
-~,~ .',--, ------ unreacted matenal
Initial state
Figure 2.2: p-v diagram showing possible paths of integration.
10

--Tb=O.88 Ts- Tb=O.84 Ts
- - - - - Tb=O.80 Ts
• 9
1
-8 0-
'--~
<IJ 7 -"""~CIlCIl :-<IJ ,...
""" 6Q.. :-
-5 --
40 2 4 6
Distance
(a)
8 10
•-- Tb=O.88 Ts
- Tb=0.84 Ts- - - - - Tb=O.8D Ts
2 4 6Distance
(h)
8 10
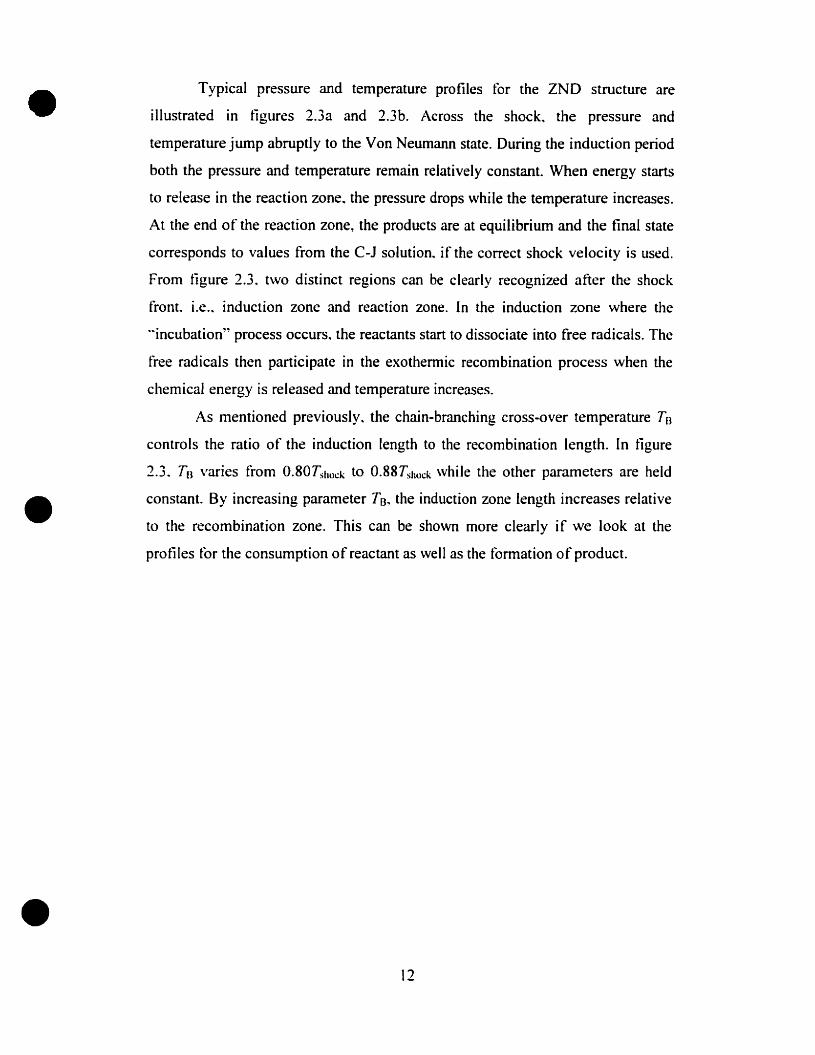
•Figure 2.3: Steady ZND detonation profiles: Ca) pressure protile(b) temperature profile for mixture with Q = 1O~ y = 1.2~ El = 20~
En = 8 and TI = 3Tshock.
Il
•
•
•
Typical pressure and temperature profiles for the ZND structure are
illustrated in figures 2.3a and 2.3b. Across the shock~ the pressure and
temperature jump abruptly to the Von Neumann state. During the induction period
both the pressure and temperature remain relatively constant. When energy starts
to release in the reaction zone~ the pressure drops white the temperature increases.
At the end of the reaction zone, the products are at equilibrium and the final state
corresponds to values from the C-J solution. if the correct shock velocity is used.
From figure 2.3. two distinct regions can be c1early recognized after the shock
front. i.e.~ induction zone and reaction zone. In the induction zone where the
"incubation" process occurs. the reactants start to dissociate into free radicals. The
free radicals then participate in the exothermic recombination process when the
chemical energy is released and temperature increases.
As mentioned previously. the chain-branching cross-over temperature Tu
contrais the ratio of the induction length to the recombination length. In figure
2.3. Tu varies from O.80T~hock to O.88Tshock while the other parameters are held
constant. By increasing parameter Tu, the induction zone length increases relative
to the recombination zone. This cao be shawn more c1early if we look at the
profiles tor the consumption of reactant as weil as the formation of product.
12
•
? 3 4
Distance
(a)
5 6
•~
---=--~~-~
"....~
" ~./'
,,/
1 .-
0.8 -c
.2Ü 0.6'~ros-
t.I..0.4 -
0.2 :-~
/ /
, /
, 1
, 11
, J
" /
-- Tb = 0.88 Ts- - Tb = 0.84 Ts
- - - - - Tb = 0.80 Ts
- 1
652 3 4Distance
(b)
o --:.....:"'/'""""'-----~-~.-~
o
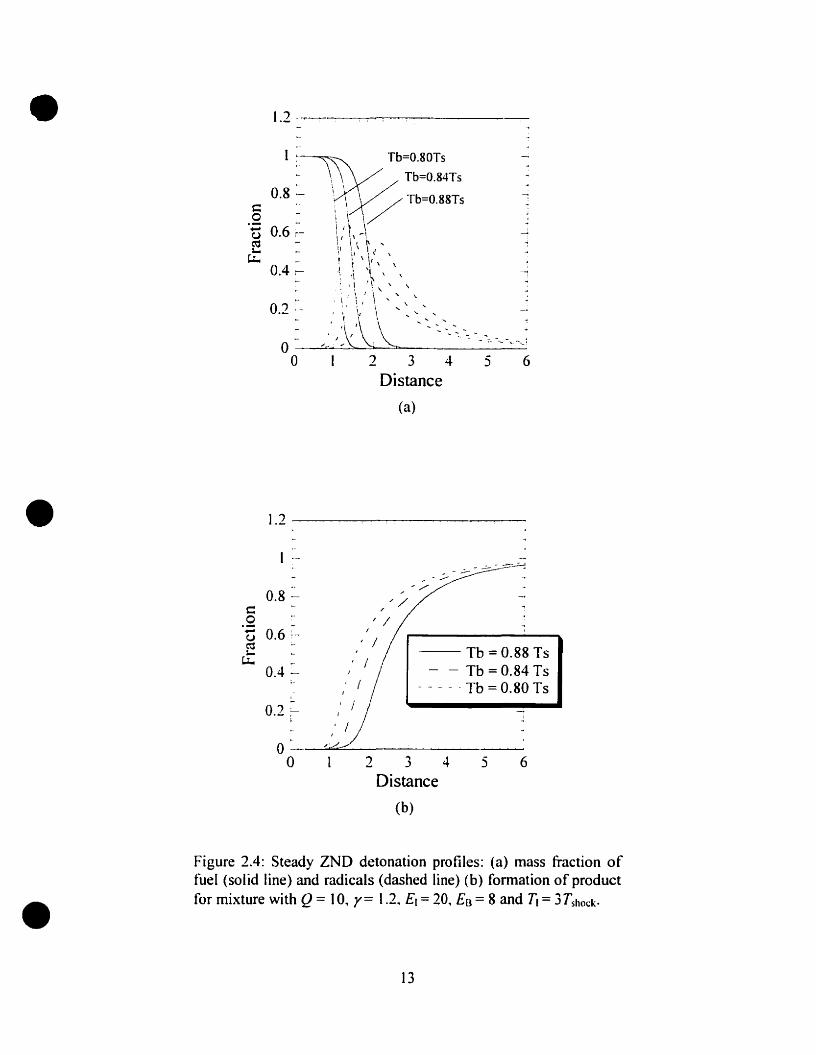
•Figure 2.4: Steady ZND detonation profiles: (a) mass fraction offuel (solid tine) and radicals (dashed tine) (b) formation ofproductfor mixture with Q = 10, y= 1.2, El = 20, Eu =8 and TI = 3Tshock•
13
•
•
•
Figure 2.4 shows the mass fraction of fuel. radical and product profiles in
the reaction zone behind the shock front. For a low value of TB = O.80Tshock~ the
chain-branching induction zone length is small and a significant build up of chain
radical concentration occurs rapidly. Since the chain-branching cross-over
temperature TB is the temperature at which the chain-branching rate is equal to
that of the chain-tennination. we see that for a low value of TB~ the chain
branching reaction rate is significantly greater than that of the recombination
reaction and a relatively longer recombination region is obtained betore the final
equilibrium is reached. However. for higher values of TB. the chain-branching
induction zone increases. resulting in a lower peak concentration of chain
radicals. For high values of TB, the rate of chain-branching reaction is lower. thus
allowing the chain-termination reaction to become etTective before ail the fuel is
depleted. Hence~ this restricts the build up in free radical concentration in the
reaction zone.
From the steady ZND analysis. it is shown that the present three-step
model allows us to vary the ratio between the induction zone length and reaction
zone length independently. This is one of the distinct advantages over the
standard one-step Arrhenius kinetics model. [n fact it is difficult to define an
induction zone length in the one-step Arrhenius rate model where both induction
and reaction length are governed by a global activation energy.
14

•
•
•
2.4 Transient computation
The steady state ZND detonation structure has been described in the
previous section. However. it is weil known that a steady ZND solution may be
unstable and the response of the steady-state solution to smaIl perturbations can
be obtained via an additional linear stability analysis as those carried out by Lee
& Stewart [24] and Sharpe [34]. Altematively. the stability of a steady-state
solution can be studied through an unsteady calculation from initial conditions.
where the transient behavior of the detonation is considered. Unsteady numerical
simulations of 1-0 detonations subject to the present 3-step kinetics model have
already been performed by Short & Quirk [36] to study the non-linear stability of
the structure of detonation waves. However. they first assumed a stable ZND
structure based on the steady-state solution using the C-1 criterion. and then
subjected this stable solution to a perturbation. [t is not c1ear that the stable ZND
protile for the present 3-step chemical kinetics model imposed by Short & Quirk
as a starting condition in their simulations can in fact be reached during the
transient development of the detonation wave from an arbitrary initiation
condition. It is thus important to first examine if the steady detonation using the
present 3-step chemical kinetics mode) can indeed be formed from arbitrary initial
conditions before actually focusing on the problem of direct initiation of
detonation. [n this section. an unsteady analysis of the transient development of a
1-D detonation initiated by a strong blast wave is carried out to determine the
existence of the steady detonation wave subject to the present 3-step chemical
kinetics mode!. [t is also possible to illustrate the detonation instability and its
dependence on the chemical kinetics model from the complete history of the
transient development of the detonation initiated by a strong blast wave.
The unsteady one-dimensional reactive Euler equations with the present
chemical kinetics scheme are solved numerically using an Eulerian detonation
code based on the piecewise parabolic method {PPM} of Colella & Woodward
[12]. which is a higher order extension of Godunov's method. together with a
conservative shock front tracking algorithm [9]. Due to the small length scale of
the present problem. it is important to properly retine the reaction zone.
15
•
•
•
Therefore. an adaptive mesh refinement is used [2]. The computation domain is
covered by an uniform coarse grid of 20 numerical cells per half-reaction zone
length. An extra fine grid is used, with a refinement ratio of 5. giving an effective
resolution of 100 cells per half-reaction zone length (i.e.. where half the chemical
energy of the reaction has been released) within the reaction zone of the
detonation. This high resolution ensures that each reaction step is weil resolved
(more than 25 cells were present within the zone of each reaction step). Ail
computations are performed \Vith a CFL number of 0.5. The detonation code was
initially developed by Mazaheri [30] and extended to a 3-step reaction mechanism
for the present study. Details of the numerical methods can be found in Appendix
IL
In previous studies using a single step Arrhenius rate law. the stability of
the detonation wave is usually characterized by the activation energy of the rate
[aw. As the activation energy increases beyond the value for the stability limit the
detonation front changes from smail harmonic oscillations to non-linear
pulsations and eventually to chaotic behavior when the activation energy is far
l'rom the stability limit value [23]. In facl. the activation energy is a parameter in
the single-step rate law that contrais the ratio between the induction and reaction
zone length, i.e..
5 = Ll fne/uction
Ll R .ecu.'llOIl
(2.9)
To understand more c1early the nonlinear pulsating instability of the detonation.
we should emphasize the importance of the ratio 8. To obtain this ratio cs. the
values of the induction zone and reaction zone length are determined from the
heat release curve as shawn in figure 2.5. The black dot corresponds to the
maximum heat release rate or the inflection point of the curve.
16
o :-<__>'Induction zone Icnglh
reaction zone length[ - -<--~,
1.2
a~ 0.2-
•
-0.2o 3 ~ 5
Distance
6 7 8
Figure 2.5: Heat release profile using Q = 10. y = 1.2, El = 20. EB =8 and TI = 3 Tshock for the 3-step chemicaI kinetics modeL
•For the 3-step chemical kinetics model, the ratio between the induction
zone and reaction zone length can be changed by varying the chain-branching
cross-over temperature TB. as sho\vn in Section 2.3. Table 2.1 shows the
corresponding value of the ratio 8 for different chain-branching cross-over
temperatures Tn. together with the equivalent activation energy for a single-step
rate law. The equivalent activation energy for the single-step Arrhenius rate law is
tound by matching the inflection point of the heat release curve with the one from
the present 3-step chemical kinetics model, such that bath chemical kinetics
models gives approximately the same ratio between the induction and reaction
zone length. as illustrated in figure 2.6. For comparison. the distance is re
normalized with the half-reaction zone length defined as the distance where half
the chemical heat has been released.
•17

• Chain-branch ing cross-over Ratio i5 Equivalent activationtemperature TB energy Ea
0.80 T'ihock 0.8975 -13
0.86 T'ihock 1.1063 -l5
0.88 Tshod. I.l624 -16
0.89 TShock 1.1989 -16.5
0.90 T'ihlld 1.2347 -17
Table 2.1: The ratio g for different chain-branching cross-overtemperatures and equivalent activation energies En for Q = 10. y =
1.2. El = 20. En = 8 and TI = 3 Tshock.
- - . - . I-step kinetic model-- 3-step kinetic model
1.2
1 .-~
.9ü 0.8 ~• ~
c..::(lJtI] 0.6 ~
~
~(lJ 1... 1ê=: 004 :- ,.~ '1...... , ,/
0.2 - 1.1
1,; 1
1
11
Cl or /() 3
Distance5 6
•
Figure 2.6: Heat release profiles for bath the single-step and threestep chemical kinetics models for Q = 10 and y= 1.2.
The results obtained from the numerical computations usmg the 3-step
chemical kinetics model are now investigated in detail and compared with those
obtained from the standard single-step rate law with different activation energies
Ea•
18
• 2.4.1 Stable detonation with 8 < 1
lA -
; /\1.2 :- \ f \
\ i
1 --\----I-----(t8 -- 00.6 --
CI 50 100 150 200
Distance
250 300
-1
350
•
•
Figure 2.7: Shock pressure history for a stable detonation wavewith TB = O.80fshock for the three-step chemical kinetics model.
Figure 2.7 shows the pressure history of the shock front for chain
branching cross-over temperature TB equal to O.80T'ihock for the 3-step kinetics
model. From the steady ZND structure. we know that for TB = O.80T'ihock. the
induction zone length is short compared to the recombination or reaction zone
length. The ratio cS is equal to 0.8975. At the early time. a small amplitude
oscillation is ohserved due to the initiation process. However. after a period of
time. the oscillation is damped out and the detonation wave eventually approaches
to a stable steady state solution. Comparison between the detonation profiles From
steady ZND calculation and transient calculation is given in figure 2.8. It shows
that both results are in good agreement. Here. we can see that for small ratio cS
([ess than 1). the steady detonation wave is stable to small perturbation and a
steady ZND solution cao be achieved asymptotically.
19
•ï;...
8~
3 ,----.,---~---,...---.------
350
\\\i\'--
340 345Distance
(a)
o------~'--------'---~"'---
335
2.5 ~
•
0.5 r-
350340 345
Distance
(b)
O~----~------'-----
335
•Figure 2.8: Comparison between the steady ZND solution (dashedlines) and the asymptotic solution from transient calculation (solidlines) for TB = 0.80Tshock for the three-step chemical kineticsmodel. (a) Pressure profile and (b) temperature profile.
20
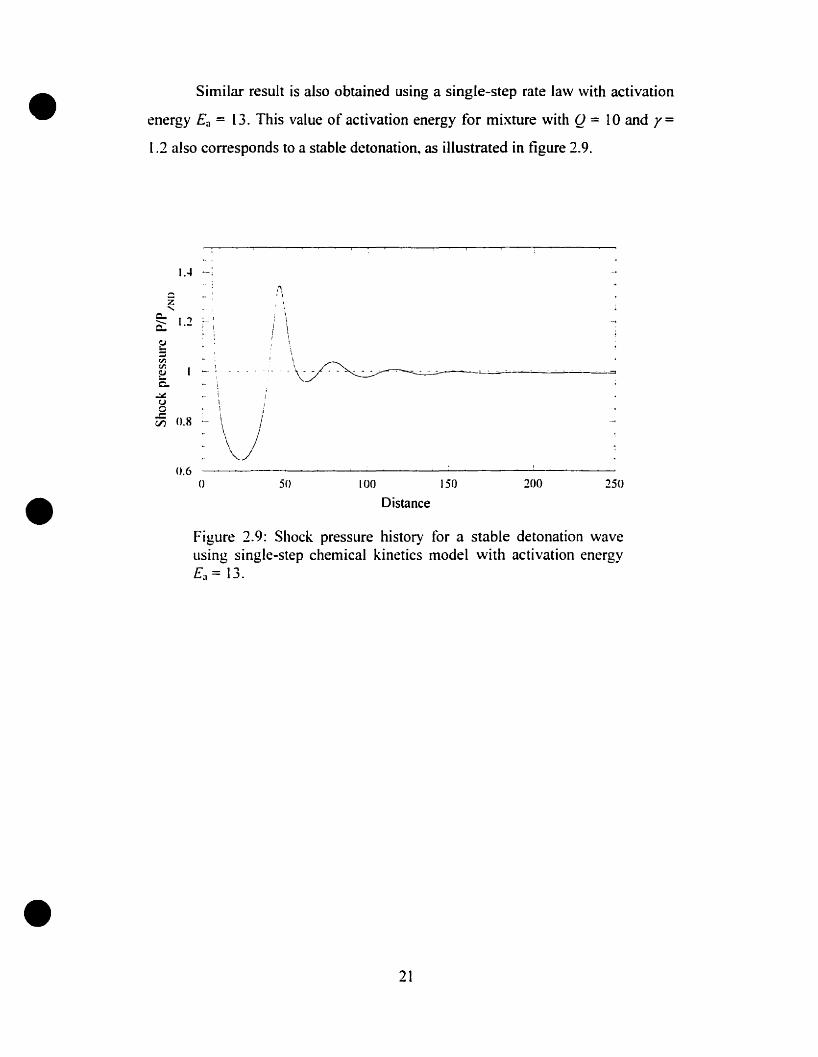
• Similar result is also obtained using a single-step rate law \Vith activation
energy Ea = 13. This value of activation energy for mixture with Q = 10 and y=
1.2 also corresponds to a stable detonation. as illustrated in figure 2.9.
z.....
c..Q:: 1.2 ~ 1
~C'lC'l
!Uë. - 1
~ i J
g \ J
;; 0.8 ~ \ j
V
•0.6
o 50 100 150
Distance200 250
•
Figure 2.9: Shock pressure history for a stable detonation waveusing single-step chemical kinetics model with activation energyEa = 13 .
21
• 2.4.2 Unstable detonation with <5~1
1.6 --
lA - 1
0.8
0.6 -
OAo 50 100 150 200 250
Distance
300 350 400
•
•
Figure 2.10: Shock pressure history for an unstable detonationwave (a regular harmonie oscillation) with TB = O.86Tshock tor thethree-step chemical kinetics model.
By increasing ~he chain-branching cross-over temperature TB to 0.86Tshock.
thereby increasing the chain-branching induction length relative to the length of
the recombination region giving a value of 5 = 1.1063. an unstable detonation
wave is obtained asymptotically. as shown in figure 2.10. Hence for high value of
TB. a stable detonation cannot be achieved l'rom a transient calculation. For TB =
0.86T-;huck. the oscillation demonstrates a regular oscillatory behavior with
constant period. This phenomenon is generally retèrred to as a pulsating
detonation and it is sho\\'TI that this occurs when the ratio 8 is close to 1. The
instability mechanism underlying the steady constant period and frequency
pulsation is due to the periodic low-trequency. finite amplitude compression and
expansion waves in the chain-branching induction zone between the main reaction
region of the reaction zone and the leading shock [37].
Increasing the activation energy for a single-step Arrhenius rate model has
the same effect as increasing the induction length relative to the reaction length.
Figure 2.11 shows the pressure history of the shock front for activation energy Ea
22
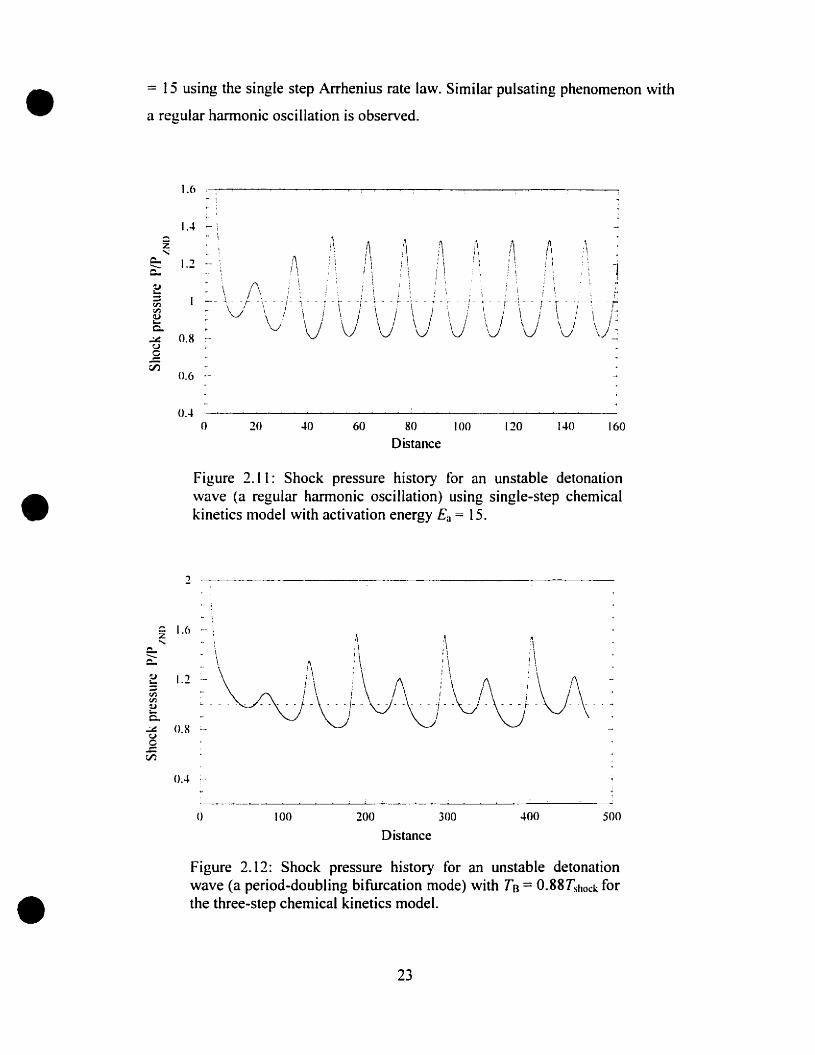
• = 15 using the single step Arrhenius rate law. Similar pulsating phenomenon with
a regular hannonic oscillation is observed.
0.6 .-
1.6- :
;
lA ~ i- \
1.2.-
:\
\ f\J ~
Figure 2.11: Shock pressure history for an unstable detonationwave (a regular harmonie oscillation) using single-step chemicalkinetics model with activation energy Ea = 15.•
004o 20 40 60 80 100
Distance120 140 160
,...z"c.-c.
- :
1.6 '--.
:, ;'\\;\:~• \ l ,\ ,\
1'" -- \\ !\ i \ f\ !\ /\ !\ ,~... ·AJ\j· ·V· .'(j~ .'0.V· \
0.8 .-
004 ~
o 100 200
Distance
300 400 500
•Figure 2.12: Shock pressure history for an unstable detonationwave (a period-doubling bifurcation mode) with TB = O.88T'ihock forthe three-step chemical kinetics model.
23
•
•
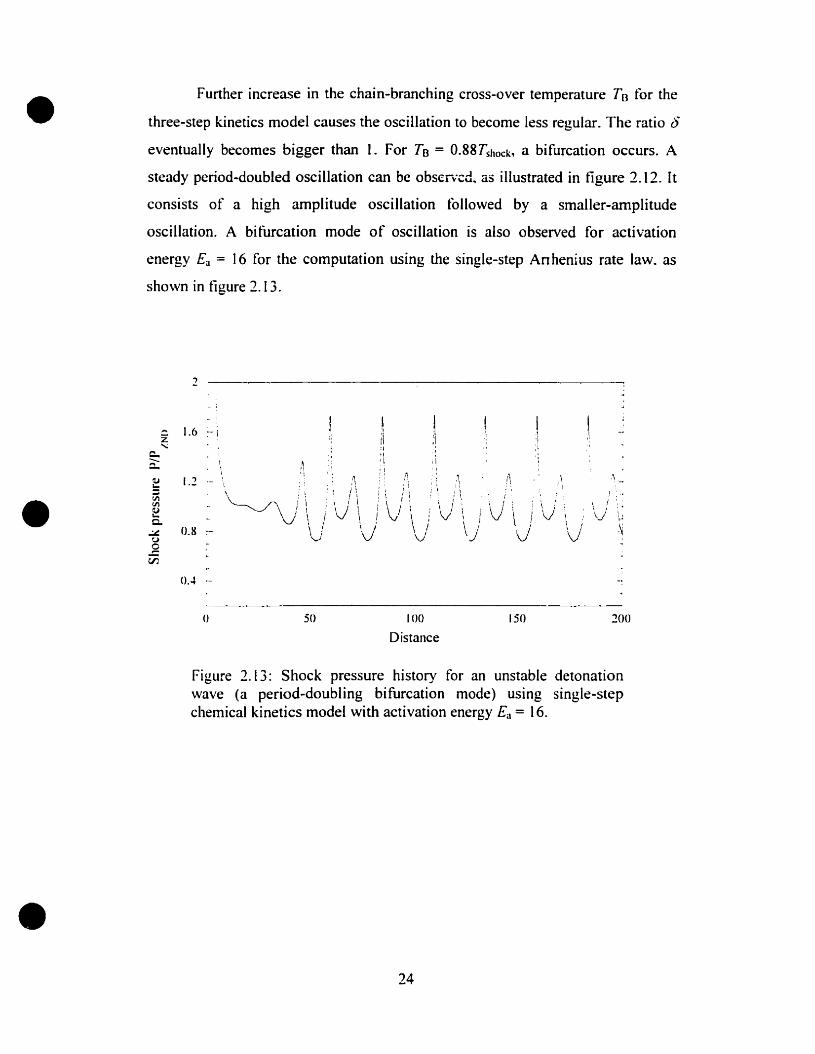
Further increase in the chain-branching cross-over temperature TB for the
three-step kinetics model causes the oscillation to become less regular. The ratio i5
eventually becomes bigger than 1. For TB = O.88Tshock, a bifurcation occurs. A
steady period-doubled oscillation can be obscn;cd. as illustrated in ligure 2.12. It
consists of a high amplitude oscillation tollowed by a smaller-amplitude
oscillation. A bitùrcation mode of oscillation is also observed for activation
energy Ea = 16 for the computation using the single-step Anhenius rate law. as
shown in tigure 2.13.
- 1
z-...;
c..-0...
1.2
0.8 ~-
o 50 100
Distance
150 200
•
Figure 2.13: Shock pressure history for an unstable detonationwave (a period-doubling bifurcation mode) using single-stepchemical kinetics model with activation energy Ea = 16.
24

• 2.4.3 Highly unstable detonation with 8>1
2.5
0.5 -
2\
= \\
oo 100 200
Distance
300 400 500
•
•
Figure 2.14: Shock pressure history for an unstable detonationwave (a chaotic oscillation mode) with Tf] = O.89Tshock for thethree-step chemical kinetics model.
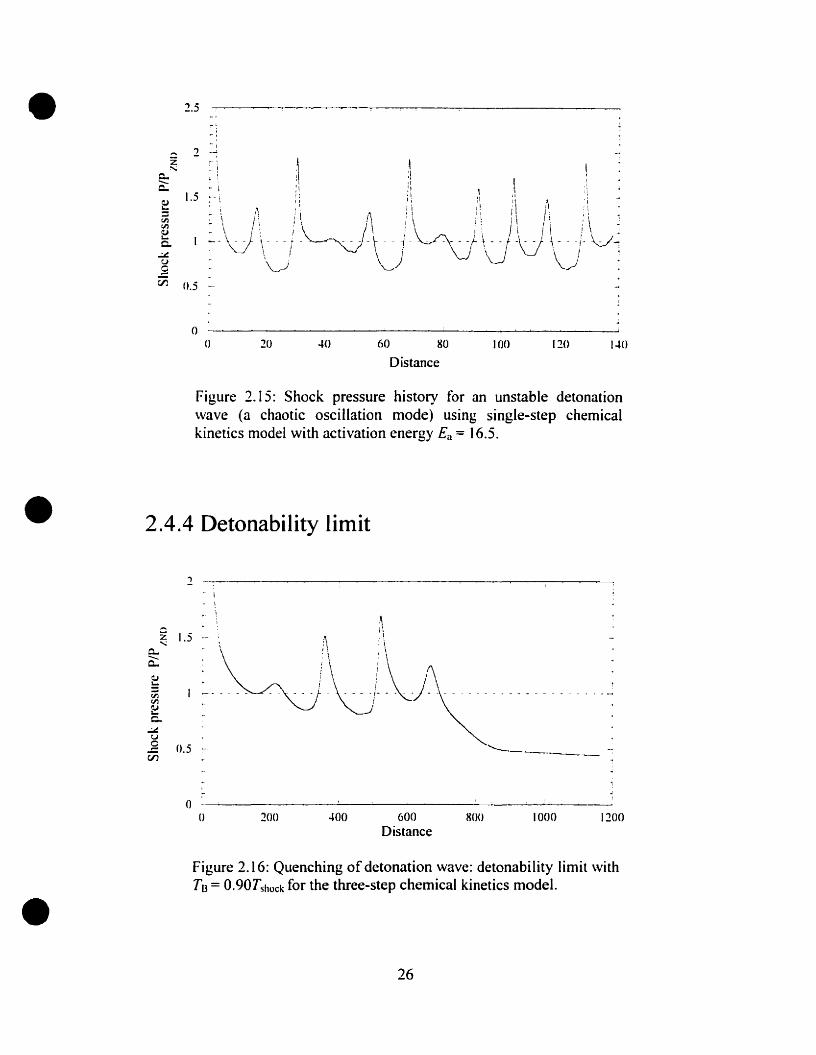
For a very large value of TB. a very long chain-branching induction zone
occurs which can significantly affect the propagation of detonation waves. A
highly non-steady behavior with a number of oscillations of different amplitudes
and periods is observed. as shown in figure 2.14. This result shows that no steady
solution can be obtained. The oscillation is chaotic and is generally called a multi
mode pulsating detonation. In this case. the instability mechanism is more
complex because a secondary detonation is formed behind the lead detonation
shock and thus leads to a shock-shock interaction. This accounts for the
observation of the highly irregular behavior. We can obtain the same phenomenon
by increasing the activation energy for the single step kinetics model to Ea = 16.5
(figure 2.15).
25
•z~
c..-c..
2.S
o.S -
o() 10 40 60 80
Distance100 120 140
•
Figure 2.15: Shock pressure history for an unstable detonationwave (a chaotic oscillation mode) using single-step chemicalkinetics model with activation energy Ea = 16.5.
2.4.4 Detonability limit
oo 200 400 600
Distance800 1000 1200
•Figure 2.16: Quenching of detonation wave: detonability Iimit withTo = O.9üTshock for the three-step chemical kinetics model .
26
•
•
•
[f TB continues to increase further. then at sorne value TB (i.e.. TB =
O.9üTshock giving a ratio 15= 1.2347), the detonation wave fails. This phenomenon
is demonstrated in figure 2.16. For sufficiently large TB. the reaction zone (where
the chemical energy is released) is at a distance far away From the shock front.
With a large amplitude fluctuation. the shock temperature will drop below the
chain-branching cross-over temperature TB. Toe rate constant for the chain
branching reaction is very small and has a profound eftèct on the rate of radical
production behind the shock. The chain-branching reaction can be considered to
be "switched off". Decoupling between the detonation shock and reaction zone
occurs. The energy released from the reaction zone cannot sustain the detonation
wave and eventually the detonation wave quenches.
For the numerical result using a single-step kinetics rate law. He & Lee
[23] found that the dynamic quenching phenornenon occurs only at very high
value of activation energy (far above Ea = 17 in this case). They argue that there
exists a dynamic limit of activation energy for which the detonation cannot
propagate via auto-ignition mechanism. However. Sharpe & Falle [35] recently
tound that even at high value of activation energy tor the one-step Arrhenius rate
law. the detonation wave still propagates as a series of explosion if one uses a
very retined numerical grid tor the computation. Therefore. tor single-step
chemistry. there is no clear definition for this detonation limit. Unlike a
detonation wave using a one-step Arrhenius chernical reaction. a clearer criterion
for the tàilure can now be established using the present three-step kinetics mode!.
Short & Quirk in their paper state that:
"Ifthe detona/ion shock tempera/lire drops /0 the chain-hranchinR cross
ove,. temperature T'J. the detonability limit occllrs. " [36]
[n the present study. the resulting solutions from transient initial developments are
very similar to those obtained from a non-linear stability analysis of the ZND
solution by Short & Quirk. Il is demonstrated that the pulsating behaviour found
for the present three-step reaction model is also similar to the pulsating detonation
27
•
•
•
instabilities found for the standard one-step reaction model [36]. The difference is
that the present kinetics model possesses a well-detined detonability limit. The
chemical switch-off mechanism found in this three-step reaction model that
causes the quenching to occur is not present for one-step Arrhenius reaction
kinetics.
From the present result using two difTerent chemical kinetics models. we
can suggest that the ratio between the induction zone and reaction zone length is
the main parameter (independent of the rate process)~ which characterizes the
stability of detonation wave. The significances of these two length seales on the
detonation stability have been tirst discussed by Short & Quirk [36] and also
experimentally observed by Borisov et al. [6]. ln the present study. we see that if
the value i5 is mueh smaller than l. where the reaction zone length is always larger
than the induction zone length. the detonation wave is stable. When the value 8
approaches to 1. the detonation wave starts to become weakly unstable. This
implies that as soon as the induction stage of the reaction becomes dominant the
wave becomes unstable to perturbation. Slightly above 1. regular oscillation of the
detonation front can be observed. If this ratio is mueh larger than 1. the shock
front oscillates in a chaotic manner and eventually detonability limit occurs due to
the high instability of the detonation.
Since this ratio offers a reasonable explanation of sorne marginal features
of detonations. thus in the tollo\ving chapter. this ratio will be used to characterize
the mixture for simplicity.
28
•
•
•
Chapter 3
Direct Initiation ofDetonation
3.1 Introduction
[n this Chapter~ the phenomenon of direct initiation is investigated for the
planar~ cylindrical and spherical geometries using a more realistic chemical
kinetic model than the single-step Arrhenius rate model used in almost aIl of the
previous investigations. We shaH adopt the ideal strong blast wave model as
initial condition in the present simulation ofdirect initiation phenomenon.
For ideal strong blast waves, the initial condition used in the numerical
simulations is given by the similarity solution for non-reacting blast wave of
Taylor and Sedov [33~ 38]. The subsequent decay of the blast, when chemical
reaction cornes into play. has to be described by the numerical integration of the
reactive Euler equations with the appropriate chemical rate law. The similarity
solution for non-reacting strong blast waves gives the following relationship
between the strength of the shock Ms, the shock radius Rs and the source energy
Es. i.e.~
(3.1)
where aj is a constant obtained from blast wave theory (ao = 2.257, al = 2.026,
a2 = 1.739), which is a function of the adiabatic exponent y. Po is the initial
pressure of the mixture and j is the geometric index, i.e.,} = 0, 1, 2 for the planar~
cylindrical and spherical geometries, respectively. Knowing the initial shock
strength and location, the initiation energy can be determined from this
relationship. Equation 3.1 will be used for aIl the following computations to
obtain the initiation energy for direct initiation.
29
• 3.2 The three regimes ofdirect initiation
From the experimental investigation of direct initiation of spherical
detonation of Bach et al. [3], we know that the initiation process can be c1assified
into three regimes, i.e., subcritical, supercritical and critical regimes according to
whether the source energy is less than, greater than, or equal ta a threshold value
corresponding to the critical energy. The three regimes of direct initiation are first
simulated for planar geometry and their mechanism is discussed in this section. A
mixture that corresponds to stable detonation is first investigated.
3.2.1 The subcritical regime
non-rcactivc blast wavc
Subcritical rcgirnc ofinilialion --:
2.51.... ,~
11
.- ~• ~ 1
2 -'Z 0- i,
~ ic... 1- ~c...
1.5~- \~
~
~rJl~~ 1 - -c..
..:...::u~
CFJ 0.5
00 10 40 60
Distance
80 100 120
•
Figure 3.1: Shock pressure history for the subcritical regime ofinitiation tor Q = 10. r = 1.2 and 8 = 0.5652 (The dashed linesrepresent the non-reactive blast wave) with non-dimensionalinitiation energy Es = 342.
Upon the sudden deposition of a large amount of energy in a gaseous
combustible mixture, a strong blast wave is fonned. During the early times of the
blast wave propagation, the shock pressure decreases rapidly as in a strong non-
30

• reactive blast wave since the blast energy dominates the decay process. As the
blast decays to larger distances, the chemical heat release starts to influence the
blast wave propagation (at about l'vIs < 1.5AtlcJ ). If the source energy is far below
the critical value, the chemical reaction zone \vill fail to couple to the shock front
and the blast continues to decay to sonic speed asymptotically. This initiation
phenomenon is retèrred to the subcritical regime of initiation where the source
energy is below the critical value. Figure 3.1 shows the shock pressure history for
the subcritical regime of initiation, together with that of a non-reactive blast wave
for comparison. In this case. the non-dimensional initiation energy Es (i.e.. Es!P0)
is equal to 342. As the blast wave continues to decay, the combustion front will
recede further from the shock front. The shock progressively decays to sonic
velocities. similar to the non-reactive blast wave propagation. while the
combustion zone propagates as a slow deflagration \vave.
: Reaction Iront
1
\ \ Shock Iront ..
i \ \ \
L~ \._\------'\-"w\~ •"'='=--
\2.5 .~
3 ----;-~-n"::'"--~---------~-------•
0.5o 10 20 30 40 50
Distance
Figure 3.2: Temperature profiles at different times t'Or thesubcritical regime of initiation for Q = 10, Y = 1.2 and 8 = 0.5652with non-dimensional initiation energy Es = 342.
•The decoupling between the reaction front and the leading shock can be
clearly observed from the temperature profiles. Figure 3.2 shows the temperature
profiles at different times during the blast decay. In the subcritical regime, two
31
•
•
sharp temperature rises can be seen in the profiles. The first abrupt rise in the
temperature is due to the adiabatic shock compression. A short plateau follows
where the temperature remains almost constant. This distance corresponds to the
induction zone length. i.e.. the region where the ""incubation" process takes place
and the reactants start to dissociate into free radicals. After the induction period.
the chemical energy release starts because the recombination process of radicals is
exothennic. Thus. a second rise in temperature occurs due to the rapid chemical
heat release. This second j ump in temperature can be defined as the reaction front.
[n the early times of blast wave propagation. the induction zone is extremely short
(almost not perceptible) due to the high temperatures. Thus. the two fronts are
coupled and can hardly be distinguished from each other. However. as the blast
decays to weaker strength. the shock temperature is lower and the induction time
increases. The shock and the reaction front then start to decouple as the induction
length increases.
1.2
5040JO
tr
1
:,1, ~ 1'1
,1
1 ".11 ,,
~
:'1 l,
1i'
" ~ L,,· ,r~ ..2010
i . ~l , 1l ' 11 j ~
i,.1 , •
't' _1'
1: . ~;;4o
1 ~
o
0.8
0.6
0..1 0-
0.2 ~
Distance
•Figure 3.3: Detonation structure profiles showing the mass fractionof fuel (solid lines) and radical (dashed Iines) for the subcriticalregime of initiation tor Q = 10. r= 1.2 and r5 = 0.5652 with nondimensional initiation energy Es = 342. The arrows indicate theleading shock front.
32
• The reason for the decoupling phenomenon can be explained by looking at
the protiles showing the mass fraction of fuel and radicals (figure 3.3). At the
early decay of the blast~ the chain-branching induction zone is small and there is a
significant buildup of chain radical concentration at the combustion front. As the
blast expands further. the rate of the chain-branching reaction decreases~ resulting
in a lower peak concentration of chain radicals. Once the temperature drops below
the chain-branching cross-over temperature TB~ the chain-branching reaction step
is essentially "switched off~ and no furthcr radical buildup can be observed in the
reaction zone. This leads to a significant increase in the induction zone length and
results in a decoupling of the combustion front and the leading shock.
3.2.2 The supercritical regime
•2
\\
1.8 \i
\1.6 ~
\
lA ~
1 1 --
1 - - - - - - - - - - - - - - _--:_-=-~-~--------------
0.8 .-
1201008060
Distance~o20
0.6 -~---~-------------~-----o
Figure 3.4: Shock pressure history for the supercritical regime ofinitiation for Q = 1O~ r= 1.2 and 8 = 0.5652 with non-dimensionalinitiation energy Es = 670.
•If the blast wave generated by the source is of sufficient duration. rapid
auto-ignition takes place behind the blast wave and the chemical reaction zone is
then intimately couple with the shock. The blast wave decays asymptotically to a
33

• self-sustained C-J detonation. The detonation front will continue to propagate
steadily at the C-J velocity thereafter. This corresponds to the so-called
supercritical regime of initiation. For this supercritical case. the initiation energy
deposited is above the critical value. the flow field simply consists ofa continuous
decaying blast wave to the C-J velocity of the mixture. The supercritical regime is
illustrated in ligure 3.4. which shows the pressure history of the shock front for
the supercriticai regime of initiation. This simulation for supercritical regime of
ini tiation is performed with a non-dimensional initiation energy Es = 670.
•0.5
() 10 20 30
Distance
~o 50
•
Figure 3.5: Temperature protiles at diffèrent times for thesupercritical regime of initiation for Q= 10. y = 1.2 and 8 = 0.5652with non-dimensional initiation energy Es = 670.
34

• 1.2 -
1 - Y Y Y r ~ r r y y ~1 r r1 1
1 i,i1
1
0.8 ~ 14C 1 1 ~ J.2 ~
~ 1 1
Ü 1 1 1j
~
~ .j, 'j i ,
c.:: 0.6 ~
'1" '1 :l ·1 1 ;'i '1 "
CIl 'i '1CIl '1~ '1 .~
"'1 ,1
1DA L- • 1 .1 -'1 ' 1 '1 , 1 : 1
1 : l 11
1 1
1 j , 11 1 1 1
,1 1
0.2 1 1 , 1 , 1 1 11 t 1 , ,
!, 1
1 1 11
,1
1 , 1, l .-0 cr - .',- ..... , "#0 r ...,.... ;"
0 10 20 30 40 50
Distance
•
•
Figure 3.6: Detonation structure profiles showing the mass fractionof fuel (solid lines) and radical (dashed lines) for the supercriticalregime of initiation tor Q = 10, ï' = 1.2 and 0 = 0.5652 with nondimensional initiation energy Es == 670. The arrows indicate theleading shock front.
Figure 3.5 shows the temperature profiles. From this figure. we note that
the temperature rise due to the heat release by combustion almost coincides with
the temperature rise due to shock front compression. This indicates that the
combustion front is intimately coupled to the shock front throughout. Also. from
the mass fraction of fuel and radicals profiles (tigure 3.6), we note that there is
always a significant amount of chain radicals in the reaction front.
35
• 3.2.3 The critical regime
14012010060 80
Distance~o20
~--------------~- - - - - - - - - - - - - -- - - - - - -
1.8 ::-
t
1.6 -Z~ lA ~
0..Q::~ 1.2 -~CIlCIl
~ 1 --c.
...:..::u 0.8 ~
~rJJ
0.6 -
nA0
•
•
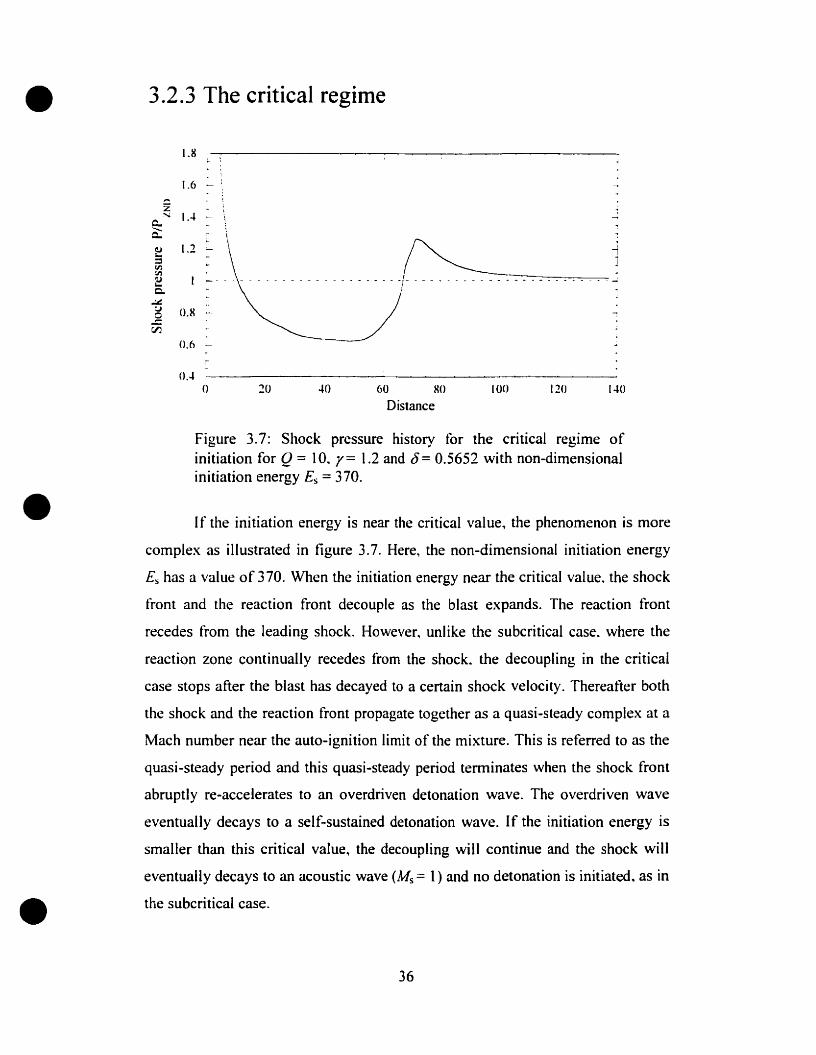
Figure 3.7: Shock pressure history for the critical regime ofinitiation for Q = 10. y= 1.2 and g= 0.5652 with non-dimensionalinitiation energy Es = 370.
If the initiation energy is near the critical value~ the phenomenon is more
complex as illustrated in figure 3.7. Here, the non-dimensional initiation energy
Es has a value of 370. When the initiation energy near the critical value. the shock
front and the reaction front decouple as the blast expands. The reaction front
recedes from the leading shock. However, unlike the subcritical case. where the
reaction zone continually recedes from the shock. the decoupling in the critical
case stops after the blast has decayed to a certain shock velocity. Thereafter both
the shock and the reaction front propagate together as a quasi-steady complex al a
Mach number near the auto-ignition limit of the mixture. This is referred to as the
quasi-steady period and this quasi-steady period tenninates when the shock front
abruptly re-accelerates to an overdriven detonation wave. The overdriven wave
eventually decays to a self-sustained detonation wave. If the initiation energy is
smaller than this critical value, the decoupling will continue and the shock will
eventually decays to an acoustic wave (lvls = 1) and no detonation is initiated, as in
the subcritical case.
36
• 3 \,2.5 '-
\ \:... \~ 1 \
.3 :2 ~
1 ,1 \
~
\
\'- 1 \~ i
ê" ~ 1 \,
\1.5 l l \ 11 \~ - 1 1 ~
f- ~ ~ L L. ~1 ~
0.50 10 20 30 .JO 50
Distance
3
• 2.5
~
5 :2c; \~
L~\ê" l \. l
~ 1.5 \ \... -'t- .~
0.560 70 80
Distance
90 100 110
•
Figure 3.8: Temperature profiles at different times for the criticalregime of initiation for Q = 10, r= 1.2 and c5 = 0.5652 with nondimensional initiation energy Es = 370.
37
• 1.2
1 0- ~ V Vr :1
1,
,- 0.8,
.2,•
ü of
ca ,~ 0.6 - ,V'l 'rV'l ,1ca~ OA ,1
t
'.,11
11,1
0.2 - 111 1
;,
0 1 j j .. .:..ë: -l' -0 10
~,
~ r y t V Vr r r- I f r-I 1r 1 /
11 !11
~
1! !
1 ","
1 '1,4 '. :i ,1 '/,1
:1 :1 1 l'1 1 '1 '1') ,'1 i 'i 1
, , of : j " '1 ' ,: t
' , 1 1 ' , 1 ,.' ~
1 ,1"il i, l'
1 il,
l, :'"
1
"
1 i'"
l,",i' l'
,;. i'
l' f i: ,-i' f l' i' f l' -' ! ,
i'J r- J.. - J~ - - /, , i" ./1-'
20 30 40 50Distance
1.2
i .,1 ~
'f , r r r yrf 'j ., -1 r
• i i.§ o.s ;- <1 . 1
oC ~ ~ 1,1
1
ü '\ i \ 1
'. '.'1 :ica '1 ,1 "
::: 0.6 - '/ '. '. ".1 ,1 1
'. '1 1'. iV'l , 1 .1 " :1V'l,
·1" "ca ' 1 , i~
1 11 1 "
OA :- , . ,1"
: 11 , , ' 1 : .1- 1 • 1
1, 1t 1
•1
1~ 1 1 1 , 1
~1 l'
,1 1
J 1
1: 1, ,
~,
0.2 ,- i' • 1 1 ,1 1 1 1
~ 1 1, ,1
1 .l,1 1 i
; ;," - ;,
~'1
~ . . [, 1 ," ~, -0 . - -[' 1- "' .- -, - - , - .., t'" .. ' 41 r
60 70 80 90 100 110
Distance
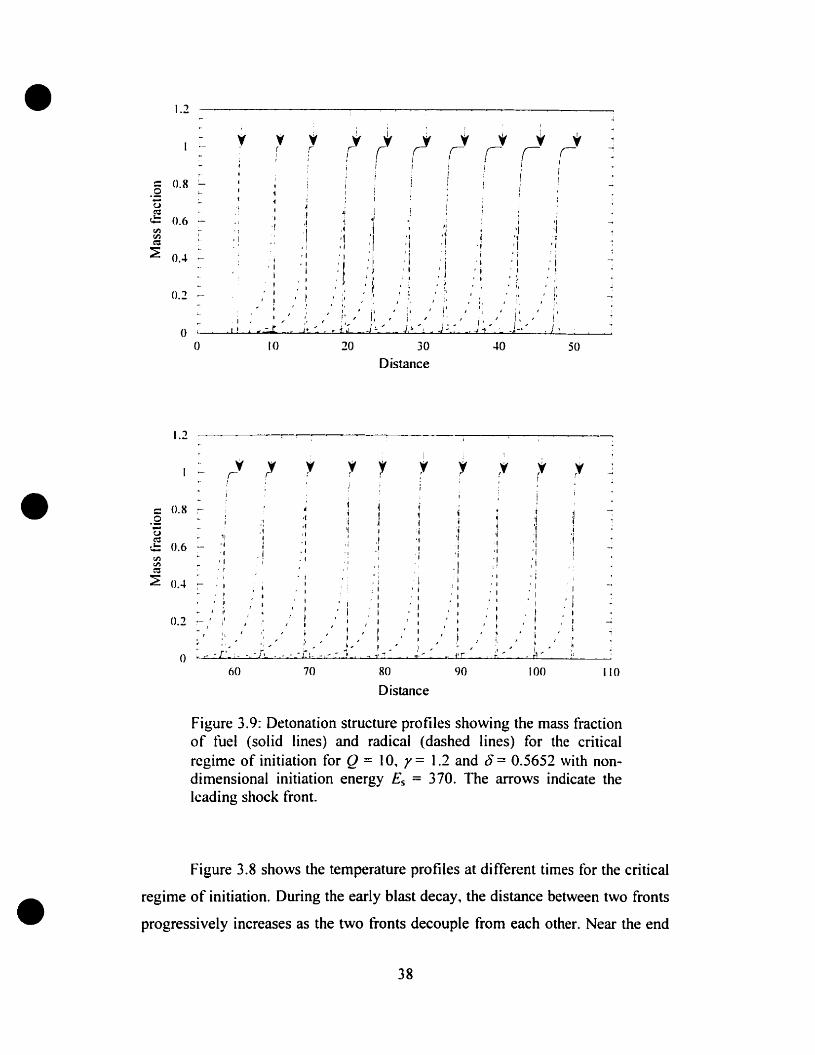
Figure 3.9: Detonation structure profiles showing the mass fractionof tùel (sol id lines) and radical (dashed lines) for the criticalregime of initiation for Q = 10, r = 1.2 and 8 = 0.5652 with nondimensional initiation energy Es = 370. The arrows indicate theleading shock front.
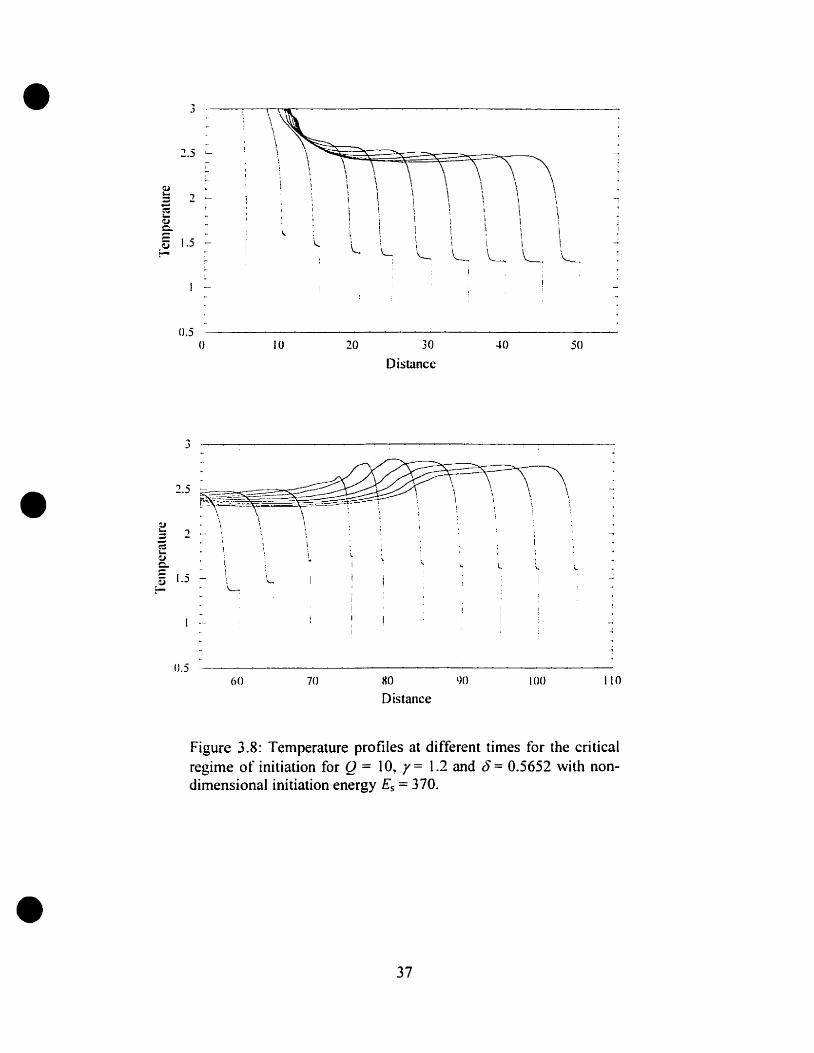
•Figure 3.8 shows the temperature profiles al different times for the critical
regime of initiation. During the early blast decay, the distance between two fronts
progressively increases as the two fronts decouple from each other. Near the end
38
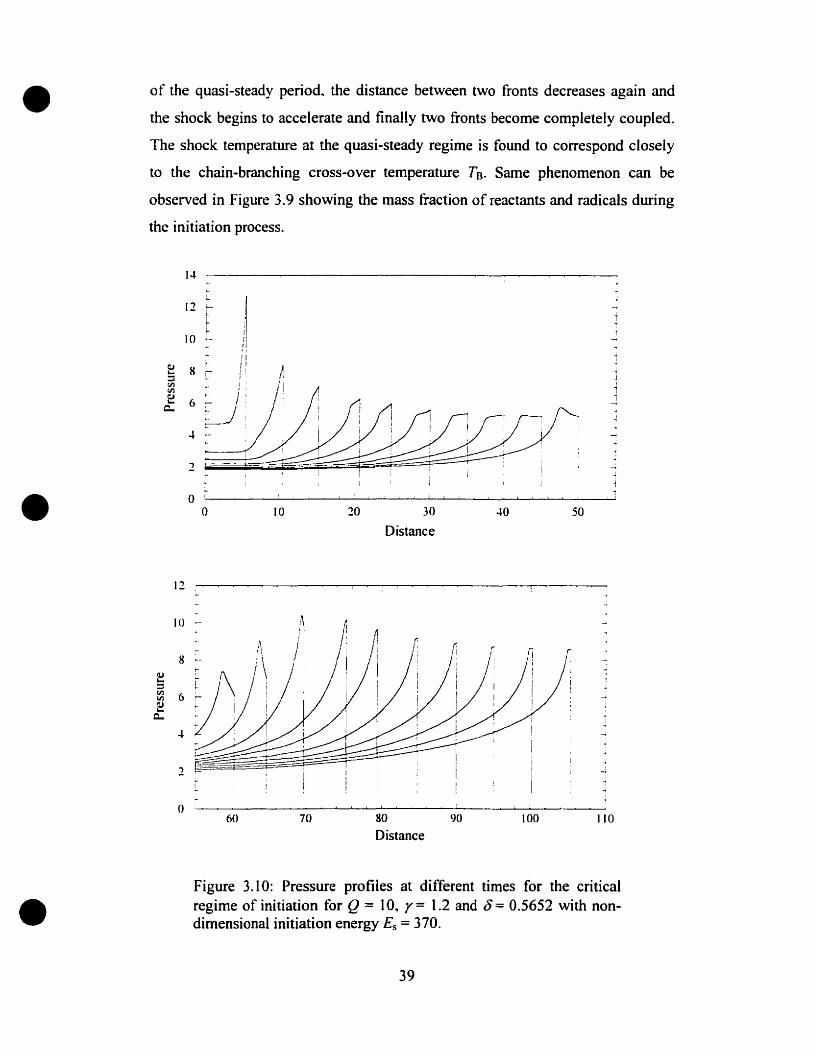
• of the quasi-steady period~ the distance between two fronts decreases again and
the shock begins to accelerate and finally two fronts become completely coupled.
The shock temperature at the quasi-steady regime is found to correspond closely
to the chain-branching cross-over temperature TB. Same phenomenon can he
observed in Figure 3.9 showing the mass fraction of reactants and radicals during
the initiation process.
14
12 ;.....~
tla r-
lU 8 11l- r::::l~
~~
~c.
"'4 --J
2 .---~- ....;
• 00 la 20 30 40 50
Distance
12
8lU1-::::l~ 6~
~1-
Q.,
-l
2
()60 70 80
Distance90 100
~1
Îl
110
•Figure 3.10: Pressure profiles at different times for the criticalregime of initiation for Q = 1O~ r = 1.2 and ô = 0.5652 with nondimensional initiation energy Es = 370.
39
•
•
•
To understand the re-acceleration process before the onset of detonation.
sorne observations can be made from the analysis of the pressure profiles. Figure
3.10 shows the pressure protiles for the critical regime of initiation. At the early
decay. the shock pressure and the pressure gradient at the shock are decreasing as
the shock moves forward. A pressure pulse begins to develop in the region
between the reaction front and the leading shock. As the reaction-shock complex
moves, this pressure pulse starts to amplify. This pressure pulse eventually
becomes the maximum pressure in the flow field. The distance between the
reaction front and the peak pressure decreases as the structure moves. As the
strength of the pressure pulse increases, the shock front accelerates because the
high pressure region begins to drive the shock front. The leading shock and the
reaction front eventually merge together to forro an overdriven detonation. The
mutual interaction of the pressure pulse and the chemical heat release results in
the rapid amplification of the pressure pulse and the onset of a detonation. This is
the essence of the mechanism of shock wave amplification by coherent energy
release (SWACER). tirst proposed by Lee [28]. The re-establishment of the front
in the critical regime of initiation is due to the generation and amplification of a
pressure pulse between the leading shock and combustion front. This process of
rapid shock amplification at the end of the quasi-steady period can be explained
by the fact that the chemical energy release in the reaction front is synchronized
with the propagation of the pressure pulse within the reaction-shock cornplex.
3.3 SWACER mechanism
It is important to investigate in more detail the mechanism of detonation
formation in the critical regime of initiation. During the quasi-steady phase of the
critical regime of initiation. the shock amplification at the end of the quasi-steady
period is due to synchronization of the chemical energy release with the
propagation of the pressure pulse generated within the reaction-shock complex.
This concept of shock wave amplitication by coherent energy release (SWACER)
mechanism was first proposed by Lee el al. [28] in the study of photo-chemical
40
• initiation of detonation. The shock wave amplification is basically a phenomenon
that involves the phase synchronization between pressure waves and heat release
of chemical reactions. To illustrate the idea of SWACER mechanism., consider the
example of a moving energy source in a tube. This theoretical model has been
tirst considered by Thibault et al. [28]. A planar energy source is assumed to
move at a constant velocity Vo depositing a total energy per unit mass Qo at a
rate w(t) such that the rate of energy release (i{X.,I) is given by:
(3.2)
where H is the step function (H(r)=O for r<D and H(r)=/ for r>O). The
function w(t) is chosen to have the following fonn:
This heat release l'unction is plotted in figure 3.11. r R is the time required
for w(t) to reach its peak value. Through this ignition process of moving ignition
source. the energy is released in a constant sequence corresponding to a constant
induction time. The induction time can be changed using different velocities of
the igniter. The development of shock wave due to this traveling energy source
was then computed l'rom the non-linear gas-dynamic equations. Details of this
theoretical model cao be l'ound in ref. [41 J.
IlrR
Figure 3.11: Heat release profile for equation 3.2.
•
•
01 (_/2
)w(t) = -~ exp --.,ri{ 2ri{
0.5
O·o 2 3
(3.3)
41
• 3
2.5 ~-
0.5o 6 8 10
Distance(a)
12 14 16
-- Maximum pressure- - Maximum volumetrie hem relcase rate
•12
2
./
6 8 10
Distance(b)
12 1~ 16
•
Figure 3.12: (a) Pressure protiles and (b) x-/ diagram for flvfsourcc = 1.
Results obtained for different energy source velocities Msourcc (= VJeo) are
now diseussed. Figure 3.12 shows the pressure profile and the trajeetories of the
point of the maximum volumetrie energy release rate (pif )ma" and the maximum
pressure point (p)ma" for the energy source moving at Msource = 1. From the x-(
diagram (figure 3.12b), we can observe that the early formation of the
42

• compression wave immediately runs away From the energy source. The pressure
protile shows that only a weak amplification of the pressure pulse can be
obtained.
12
la -Il
8 - ~ /:~ /i 1 1
Ui 6 -:Ileu....
c..4 -
2 j
~ 1'-
0() 20 -ta 60 80 100
Distance(a)• 30
~
25 -
20 >-
11)
E 15 >-
~
--Maximum pressure- - Maximum volumetrie heat rclease rate
o() 10 20 30 40 50
Distance(b)
60 70 80
Figure 3.13: (a) Pressure profiles and (b)x-t diagram for Msourcc = 3.
• On the other hand, pressure profiles (figure 3.13a) corresponded to the
case of Msourcc = 3 clearly reveal a strong shock wave amplification. From figure
43

• 3.13b showing the trajectories of (;xi' )ma:< and (p )ma.x' we can see more clearly the
interaction between the pressure wave and the energy release. At t - 10. a shock
wave is established and the shock raises the temperature. leading to a higher
volumetrie energy release rate. The reaction zone is then coupled with the
pressure pulse, resulting in a strong shock wave amplification. Indeed.. this energy
source velocity corresponds c10sely to the C-J value of the mixture. Thereafter,
the combustion front is always coupled with the compression wave.
3.5
• 0.5o
15
10 r
5 ~
10
1
'"\ \\ \\
\ \ -\\
\ \
~\
'-- "'-20 30 .JO 50
Distance(a)
-- Maximum pressure- Maximum volumetrie hem rclcasc rate
Figure 3.14: (a) Pressure profiles and (b) x-/ diagram for Msourcc = 5.•o
o la 20
Distance(b)
30 40 50
44

•
•
•
If the source energy moves even faster. i.e.. Alsourcc = 5. it remains ahead of
the compression wave as illustrated in the x-( diagram (figure 3.14b). As a result
no shock wave amplification can be seen in the pressure profiles as given in figure
3.14a. The compression wave broadens with lime as the source travels into the
undislurbed mixture. [n the limit where J\tfsourcc goes to infinite. il results in an
uniform deposition of energy, which corresponds to a constant volume explosion.
The above example shows how a proper synchronization of the pressure
pulse with the energy release can cause rapid amplification of the pressure pulse.
resulting in the onset of a detonation. The time sequence of chemical energy
release is such that it is coherent with the shock wave. thus adding strength ta the
shock wave as it propagates. When the pressure wave becomes strong enough to
cause vigorous chemical reaction. the mixture will detonate. Therefore. effective
shock wave amplification depends on whether or not a reacting flow-field
maintains the SWACER mechanisrn for a sufficiently long duration. Various
parameters. such as the induction time gradient. reactivity of gas mixture. or
geometry of flow-field. should govem the SWACER mechanism.
3.4 The effect of instability on direct initiation
The initiation process for stable detonation was studied in the previous
section. Similar calculations are presented here for unstable detonations. As
mentioned in Chapter 2, if the induction length is increased relative to the
recombination zone length. the detonation wave bccomes unstable. We have
introduced the ratio 8 as the main parameter controlling the stability of one
dimensional pulsating detonations. An interesting question that arises is whether
the instability of the detonation plays a raie in the initiation processes.
45

• 1.8
1.6
z lA ,-'"c..-c.. 1.2-
~='CI'!CI'I
~c.. 0.8
..xu52 0.6~
\
\
\\ ,
" .,..... .J
OA
0.2() 50 100 150 200 250
Distance
•
Figure 3.15: Shock pressure history for the direct initiation 0 f astable detonation with l5 =: 0.5652 and different non-dimensionalinitiation energies: Esl = 342. Es2 = 370 and Es3 = 670.
2
.~
.~
- .~
- ,;:- .~
,.\~ 1.5 ,- ,~c..
. 2
0.5o 100 200 300
Distance
..00 500 600
•Figure 3.16: Shock pressure history for the direct initiation of ahighly unstable detonation with l5 =: 1.1989 and different nondimensional initiation energies: Esl = 1370, Es2 = 1510 and Es3 =:
1608.
46
•
•
•
For comparison~ figures 3.15 and 3.16 show the pressure history of the
shock front for both stable and highly unstable detonation of planar geometry.
respectively. For the stable case with 6= 0.5652, the initiation process can be weil
described by the decay of the blast wave. The blast wave decays to a sub-CJ value
and re-accelerates back ta the C-J detonation after the quasi-steady period.
Therefore~ the critical initiation energy can he weil approximated from the blast
wave theory. The numerical result shows that sorne new phenomenon appears for
highly unstable detonation (J = 1.1989)~ where the tinal self-sustained detonation
propagates with a chaotic behavior. Instead the blast decaying continuously to the
sub-CJ value~ oscillation occurs during the initiation process. The detonation
instability cIearly influences the initiation process. For curve 1, the source energy
is far from the critical value and the reaction front and shock front are decoupled
throughout. The blast continues to decay to an acoustic wave. Curve 2
demonstrates how instability of the detonation front may induce sorne failure of
the detonation. After the first oscillation of the shock pressure, it is possible that
sorne unsteady event from the rear boundary of the reaction zone dorninates the
wave propagation and causes the quenching of the detonation wave. Therefore~ a
larger amount of initiation energy is expected to overcome aIl these instability
etfects of the detonation. The mechanism behind this initiation process for highly
unstable detonation is beyond the scope of this work.
From these results we can see that the detonation instability is also
important tor the initiation process. So tar. the instability effect has not been
explicitly considered in any of the current initiation models. These models are
mostly based on the blast wave theory and do not include a stability parameters in
their formulations .
47
•
•
•
3.5 Other geometries
What we have considered so far is the initiation for planar detonations. For
the planar case. the detonation wave is not subject to any curvature effect and
only unsteadiness of the flow behind the shock causes the decay of the wave. For
the cylindricaI and spherical detonation. curvature will be a factor in addition to
unsteadiness and we shaH investigate these combined effects on the initiation
process.
Curvature of a shock front induces an additionaI expansion of the gas
behind il. and this additionaI expansion causes cooling and can lead to quenching
of the reaction. When a fluid particle crosses a curved shock wave. it is tirst
compressed by the shock and its temperature is increased. Subsequently, the
compressed fluid particle expands volumetrically due to the radial. outward flow
behind the shock and this expansion wiU result in él decrease in the temperature.
This expansion can cause failure of the detonation if it is sufficiently rapid to
quench the chemical reactions. To illustrate the curvature effect. consider the
critical tube diameter phenomenon. When a detonation emerges abruptly from a
contined tube into an open space, the planar detonation diffracts into a curved
front. The wave fails if the curvature is excessive. Hence the tube diameter must
be above sorne critical value so that the wave curvature does not lead to failure.
48
• 1.6 ,\\
lA .- \\-
1
2
\
. \
" \
=-- - - - - -~. \ - - - - - - - - - - - - - - - --" \. , .." .... .J...
1.2 -
0.6 .-
....}
300250200150
Distance
10050
0..1 '---;_~'--- ---'- ----''------'-__~~---'----'-~~__--...l
o
(a)
lA ,-
\
\ 3
- - . '-,. - - . - - • - - - - - • -~-•• - • - - - • - - - .~• - - -c - - - - • .-:'L ." " - - .-. - - - - - ~I. 2 -------- .
\
\
\
\
t ,
~ '\. \
1.6
1
1.2 1
0.6 ~
0.8
•004
50 100 150 200 250
Distance
300 350 400
(b)
Figure 3.17: Three regimes of initiation for Q = 10. y= 1.2 and 8=0.5652. (a) Cylindrical feometry with non-dimensional initiationenergies: Es1 = 8.96x10 . Es2 = 9.34x10" and Es3 = 1.18x10⁵ (b)Spherical geometry with non-dimensional initiation energies: Es! =
3.30xI07• Es2 = 4.74xI07 and Es3 = 9.06xI07
.
• In the initiation of cylindrical and spherical detonation. the curvature
decreases as the blast expands. However during the initiation process. both
49
•
•
curvature and unsteadiness effect can cause failure of the diverging wave. Figure
3.17 shows the shock pressure history for the three regimes of initiation for
cylindricaI and sphericaI geometries. Since curvature can cause additional
quenching~ initiation of cylindrical waves require that the same critical strength of
blast to occur at a larger radius than the planar geometry. Similarly~ spherical
waves have even larger curvatures at the same radius. Hence, the same critical
value of the strength of the blast must be maintained to even larger radius than the
cylindrical geometry in order for successful initiation to be achieved.
The three regimes of initiation for stable detonation are qualitatively
similar for ail three geometries. The only difference is that for the planar
geometry a self-sustained detonation is formed doser to the source. Another
interesting result is that the detonation velocity is found to he sIightly lower than
the planar ZND solution. Since the curvature term goes like j/r in the conservation
equations (j = l, 2 for cylindrical and spherical geometries. respectively). then the
velocity is always unsteady and anly becomes Cl if the radius approach ta
infinity.
'" 1.2Z~
Q..-Q..
lU'-::::VlVl~'-0..
..:.::u~ 0.8 ,-
r;)
0.6(} 100 200
~lIv'r 1
1 i_,f , '.l ,'. , •
- - - . j.' '.. ' .\ '
\
\
"Î
'- -\
,\ '
300 400 500
Distance600 700
-.~
800
•Figure 3,18: Direct initiation of unstable cylindrical detanation foro = 10. y = 1.2~ t5 = 0.8975 with non-dimensional initiation;nergies: Est = 3.89xIOs~ Es2 = 4.71xlOs, EsJ = 5.60xIOs and Es4 =7.63xlOs.
50
•
•
•
Another interesting phenomenon for diverging wave is that curvature
enhances instability of the detonation wave. Figure 3.18 shows the numerical
results for a ratio 8 = 0.8975 for cylindrical geometry. Although this value of §
corresponds to a stable case tor planar detonation (see Chapter 2)~ but in the case
of cylindrical detonations, instability occurs when the radius of the front is small.
For the curved detonation front. the particle undergoes an expansion behind the
shock due to the curvature effect. This expansion due to curvature increases the
induction time and hence enhances the instability of the detonation wave. This is
even more significant for spherical detonation because of a higher curvature. The
\vave will become stable asymptotically when the radius approaches infinity.
51
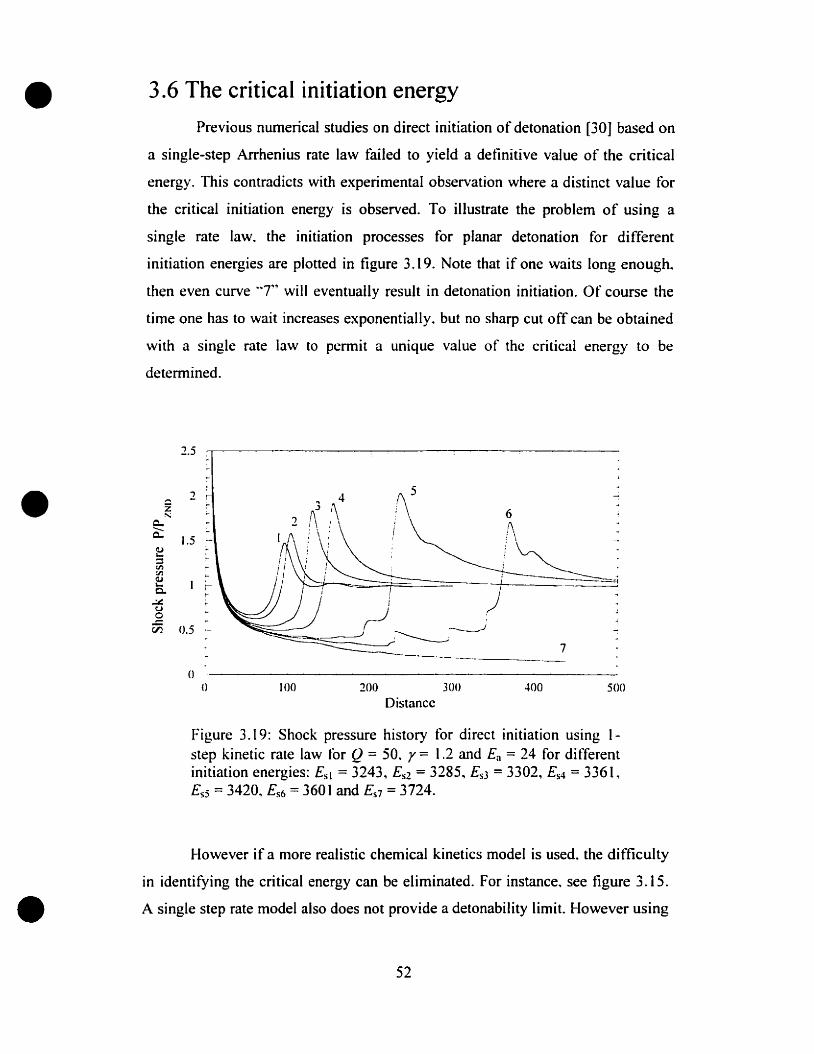
• 3.6 The critical initiation energy
Previous numerical studies on direct initiation of detonation [30] based on
a single-step Arrhenius rate law failed to yield a detinitive value of the critical
energy. This contradicts with experimentaI observation where a distinct value tor
the critical initiation energy is observed. To illustrate the problem of using a
single rate law. the initiation processes for planar detonation for different
initiation energies are plotted in figure 3.19. Note that if one waits long enough.
then even curve "7" will eventually result in detonation initiation. Of course the
time one has to wait increases exponentially, but no sharp cut off can be obtained
with a single rate law to permit a unique value of the critical energy to be
determined.
2.5
• 2 r-Z ;-~
Q.. ~
Q:1.5 -
~::enen~'- 1C. r-~U
9Vi 0.5 ~
0() 100 200
Distance300 400 500
•
Figure 3.19: Shock pressure history for direct initiation using 1step kinetic rate law for Q = 50. r= 1.2 and Ea = 24 for differentinitiation energies: Es1 = 3243, Es2 = 3285, Es3 = 3302, Es4 = 3361,Es5 =3420, Es6 = 3601 and Es7 = 3724.
However if a more realistic chemical kinetics model is used. the difficulty
in identifying the critical energy cao be eliminated. For instance. see ligure 3.15.
A single step rate model also does not provide a detonability limit. However using
52
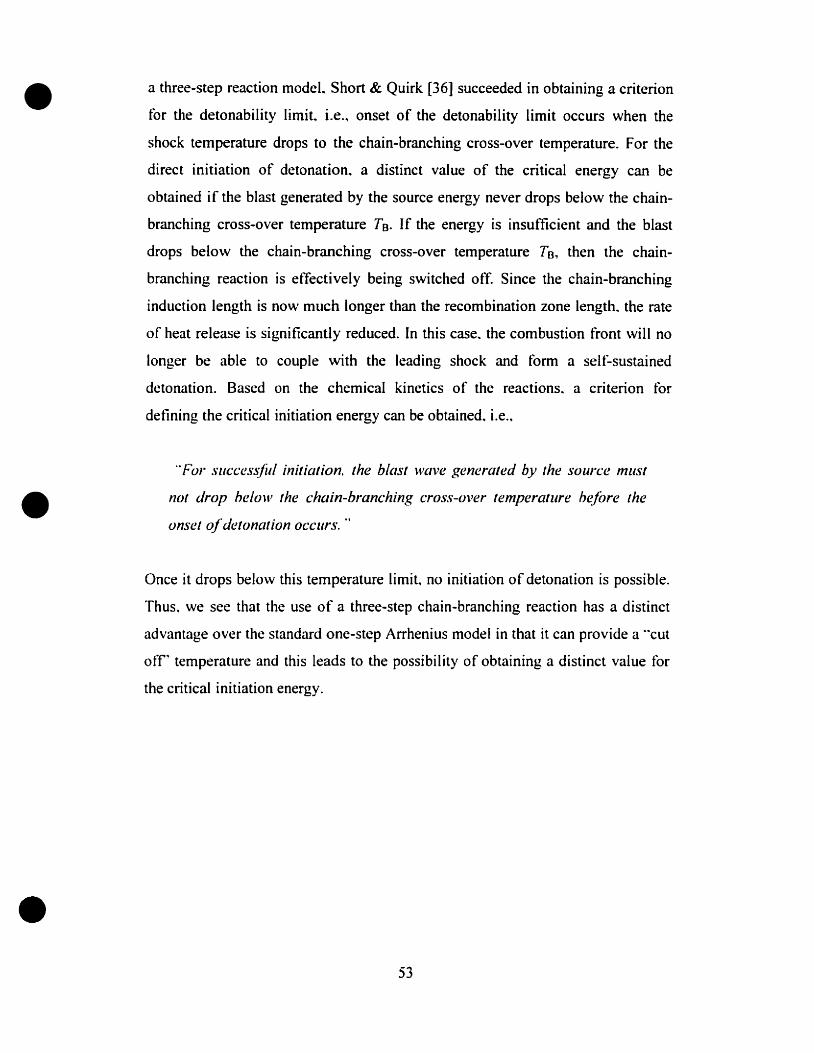
•
•
•
a three-step reaetion modeL Short & Quirk [36] sueeeeded in obtaining a eriterion
for the detonabiIity limit i.e.~ onset of the detonabiIity limit oeeurs when the
shoek temperature drops to the ehain-branehing eross-over temperature. For the
direct initiation of detonation~ a distinct value of the cnticaI energy can be
obtained if the blast generated by the source energy never drops below the chain
branching cross-over temperature TB. If the energy is insuffieient and the blast
drops below the chain-branching cross-over temperature Tfj~ then the chain
branching reaction is effectively being switched off. Since the chain-branching
induction length is now much longer than the recombination zone length. the rate
of heat release is signifieantly reduced. In this case. the combustion front will no
longer be able to couple with the leading shock and form a seU:'sustained
detonation. Based on the chemical kinetics of the reactions. a criterion tOI'
defining the criticaI initiation energy can be obtained. i.e..
·'For successjit! initiation. the blast wave generated by the source must
nol drop he/olt' the chllin-brllnching cross-over temperature hefore the
onset ofdetonation occurs. ..
Once it drops below this temperature limit. no initiation of detonation is possible.
Thus. we see that the use of a three-step chain-branching reaction has a distinct
advantage over the standard one-step Arrhenius model in that it can provide a "cut
off~ temperature and this leads to the possibility of obtaining a distinct value for
the critical initiation energy.
53

•
•
•
Chapter 4
General Theories for Direct Initiation
4.1 Introduction
ln the past two decades. severai theories have been developed to estimate
the critical initiation energy from a point source. Due to the non-uniqueness of the
critical energy when a single-step Arrhenius rate law is used. these theories for
direct initiation cannot be verified numerically from previous studies. Hence~ it
appears worthwhile to examine the validity of these theories from the results of
present numerical simulations, where a more realistic chemical model is used.
4.2 Dependence of critical energy on induction length
A criterion for direct initiation was first proposed by Zel'dovich el al.
[42]. For successful initiation. Zel'dovich stated that the blast radius should be on
the order of the induction zone thickness by the time shock strength has decayed
to the C-J value. From this argument, he demonstrated that the critical energy for
direct initiation of spherical detonation must be proportional to the cube of the
induction zone thickness, i.e.• Es· -LI). Later, Lee [26] extended the Zel'dovich' s
initiation criterion to other geometries in the form 0 f Es•-LI J+1• where j = O. L 2
for planar. cylindrical and spherical geometries, respectively. In the past forty
years. most of the initiation models involve aimost the same correlation between a
characteristic chemical length and the critical initiation energy as described by
Zel'dovich's model. Since ZeI'dovich's criterion forms the base ofmany ofthese
initiation models. thus it appears worthwhile to examine the validity of
leI'dovich's criterion for different geometries from the results of present
numerical simulations using a more detailed chemical kinetics model, where a
definitive value of the critical energy can be obtained.
54

•
•
•
The critical initiation energles for different geometries calculated by
numerical simulations are plotted versus the induction zone length of the steady
ZND detonation in figures 4.1. The corresponding induction zone length for
detonability limit (above which no detonation can be fonned) is also indicated in
these figures. From these figures, it is shown that the critical initiation energy
correlates weil with the induction zone length as predicted by Zel'dovich~s theory.
The linear, quadratic and cubic correlation between the critical initiation energy
and the ZND induction zone length for planar, cylindrical and spherical cases
appear to be valid, especially for the case of short induction zone length, where
the detonation is stable. For long induction zone length where the detonation is
unstable, other effects such as curvature and non-steady expansion begin to
influence the initiation process and the critical energy departs from the simple
blast wave scaling law where Zel'dovich's theory is based. For aIl three
geometries. it is observed that there is a small deviation from the Zel'dovich' s
criterion for long induction zone length. As mentioned previously. Zel'dovich's
criterion simply relates the critical initiation energy with a chemical length scale.
which does not include the effect of uilsteadiness. Therefore, it is not appropriate
to simply use the induction zone length for the very unsteady events in the
initiation process. Furthermore. this deviation is more significant in cylindrical
and spherical geometries because curvature appears to enhance the instability of
the wave. Nevertheless~ Zel'dovich's theory provides a mean to estimate the
correct order of magnitude of the critical initiation energy.
55
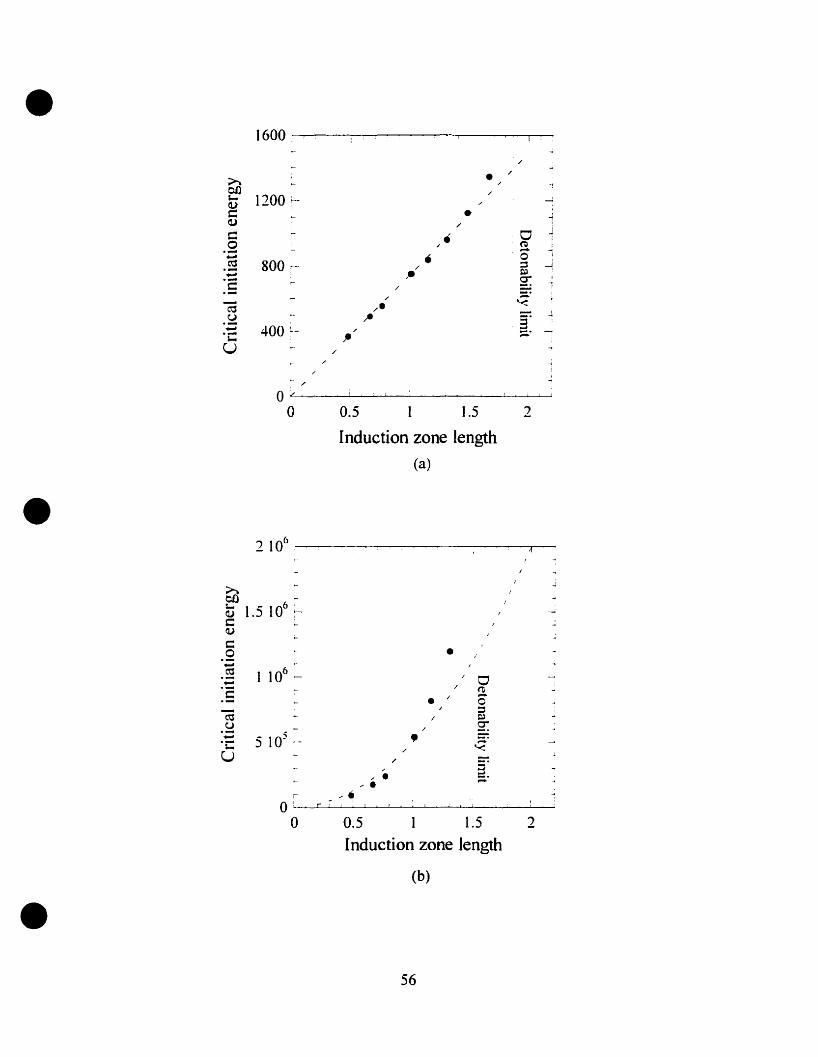
• 1600
/
• /
~on~ 1200 ~Q)c •Q) /
C • 0.9 ~.-.... , 0.;g 800 ~ / :3.... ~
Q:l1·2 ~ [.- :='.
;-
~ /. '<
.~ "..~:
-l
.... 400 ~ ;'~.t: ~
.-U /
;-
o/0 0.5 1 1.5 2
Induction zone length
(a)
• 2 106
~
~ 1.5 106~Q)
c ~
(J)
c.2 •....
106~~ 1 /.... 0
:5 ft
• Ô~ !.- ::s
Q:l
.~ - g:.... 5 lOS ~ •·C .-'<
U /
ê:,;
,; ..; . .-
0' .; ~
0 0.5 1 1.5 2Induction zone length
(b)
•56

Figure 4.1: Variation of eritieaI initiation energy with ZNDinduction zone length for (a) planar j = a (b) eylindrical j = 1 and(c) sphericalj == 2 geometries. The dashed lines show the Es·_iJl+ l
.
~ .-
•
.'•
•1
0.5 1 1.5 2
Induction zone length
(e)
• 1091~
'-
;>.. 8 10H f-en:-Q)s::Q)
s:: 6 108~.9
~ !~
:E4 10
8 =-s::
~.~....'C 2 lOs ~U
0 'a
•4.3 Invariance of the critical explosion length Ra
For direct initiation of detonation for different geometries. Lee [26] has
suggested that the critieal explosion length is independent of geometry.
•
The explosion length Ro represents a eharacteristie length of the source energy
specifie ta the geometry and is the only length seale associated with strong blast
decay. From the results of numerical simulations using the present 3-step
ehemical model for different geometries. it is also possible ta verify the critical
explosion length scaling law proposed by Lee. Ta do this. the critical explosion
lengths for direct initiation in planar, cylindrical and spherical detonation are
plotted in figure 4.2. From this figure. it is c1ear that the explosion length is
57
• essentially invariant for aIl the three geometries for the same mixture parameters.
Again. there is a small deviation for long induction zone length. As mentioned
previously, this is due to the faet that the detonation becomes highly unstable for
long induction zone length and the instability has a significant effect on the
initiation proeess.
1500 r- • Planar- • Cylindrical
:::Spherical •0::: •
~ "..c -Oh • ..c "~ 1000 :...c .-.. ." -'.9 .. ~
en~0 1-
~ - "(1)
500 ~J"- 1 •t':3
U ".• :E ."~ /.
U~
00 0.5 1 1.5 2
Induction zone length
Figure 4.2: Invariance of explosion length for blast initiation fordifferent geometries.
The invariance of the critical explosion length with geometry is quite
useful in practiee beeause we can predict the critical initiation energy for different
geometries if it is known for one geometry. For example with the critical value of
the explosion length known. then the eritieal initiation energy for different
geometries could be determined, i.e.,
•R = ESPherical = EcylindriCai
o Ecylindrical EplanOIr
58
(4.2)
•
•
•
Since the critical energy Es· is linked to the chernical length scale d of the
detonation. i.e.. Es· -.1 j+l. and frorn the explosion length invariance principle for
different geornetries. we could expect that the critical explosion length should also
scale with the chemical length of the detonation~ i.e., Ro-il ln the present
numerical study, the explosion length Rn under critical conditions is tound to be in
the order of Ro - 810.1.
Using the standard correlation between the cell size and induction length LI
of the torm À. -- 30.1 [39]~ the explosion length Ro under critical conditions can be
roughly correlated with the cell size. In the present study, we obtain that Ro is in
the order Ro -- 27À. which is close to sorne experirnental results (i.e.. Ro varies
from 17 - 24À. tor typical hydrocarbon-air -- Benedick et al. [5] and Rn -- 33À. in
the recent study by Radulescu et al. [32])
4.4 Critical kernel radius Rs* for direct initiation
The detonation kemel theory of Lee & Ramamurthi [29] states that there
exists a critical size of detonation kernel for direct initiation. The size of the
detonation kemel corresponds to the shock radi us Rs* at which the shock wave
has decayed to sorne critical Mach number !vIs* before it re-accelerates back to a
C-J detonation.
The appropriate choice of critical Mach number !vIs* should reflect the
critical shock strength below which any detonation would fail. The shock strength
prior to the onset of detonation, during the so-called quasi-steady period~ appears
to be an appropriate value for the critical Mach number A{.,*. Experirnentally, the
shock strength during the quasi-steady period is observed to be close to half the
Cl detonation speed. The half-Cl value is generally accepted for the critical Mach
nurnber !vf.'i* and is used in many initiation models [5]. However. this half-CJ
value is only a general estimate from experirnental observation and may disagree
for different explosive mixtures. The present study suggests that the choice of
critical Mach number should take into account the chemistry. [n the previous
59
• section. it is shown that if the blast wave generated by an initial point source
drops below the chain-branching cross-over temperature Ta, initiation of
detonation fails. Therefore. the shock temperature during the quasi-steady period
should be close to this chain-branching cross-over temperature Tu. Hence. the
shock strength to this temperature limit should be a more suitable choice of the
critical Mach number Ms *, which corresponds to the shock strength very near the
auto-ignition limit of a combustible mixture. Depending on the value of the chain
branching cross-over temperature Ta. the critical Mach number ranges from 0.5
0.9 l'vIC].
•
1.5
-< ~:- Critical radius Rs·
0.5a 50 100 150
Distance
200 250
•
Figure 4.3: Definition of criticaI radius Rs• from the numericalsimulation of direct initiation.
ln the present numerical results. the critical radius Rs• is defined as the
radius betore the re-acceleration of the shock to detonation at the critical
condition. as shown in figure 4.3. The value of critical radius Rs• for different
mixture from the present numerical simulations are given in Table 4.1 .
60
• Induction length .dl R;lanar/dl R;ylindricaJ / ~ 1 R:PhC:ricaJ / ~ 1
0.487 71.83 205.24 328.37
0.665 63.09 180.25 300.41
0.796 71.52 182.05 299.07
1.008 69.41 188.41 317.32
1.148 78.40 182.89
1.306 76.59 187.64
1.475 74.57
1.661 72.26
Table 4.1: Results of critical radius Rs• for direct initiation from thepresent numerical simulations.
•
Conventionally. the critical kemel Rs• at which the onset of detonation
occurs is usually correlated to the cell size of the mixture, which is the most
important dynamic parameter of gaseous detonation. Estimates of the critical
radius for initiation vary widely in the literature. Table 4.2 shows sorne
experimental results of critical radius for each geometry for typical hydrocarbon
combustible mixture:
R,*
Spherical
(vlindrical
Planar
:::: 10 -13 À. (Bull el al. [8])
:::: 4 -8 À (Radulescu el al. [32])
less than 3 À. (Benedick [4])
•
Table 4.2: Experimental results of critical kemel radius fordifferent geometries.
For qualitative comparison between the results of the 'present numerical
simulations, the standard correlation between the cell size and induction length d
of the forro À. - 30Ll is used once again. Using this correlation. we ohtain the
values of critical radius in term of cell size, i.e.. Rs• planar - 2.42, Rs•cylindrical ..... 611.
and Rs•sphcrical - 10À.. These results are in good agreement with the experimental
results shown in Table 4.2.
61

•
•
•
Chapter 5
Conclusion
The problem of direct initiation using a more realistic multi-step chemical
kinetics model has been investigated in the present thesis. A three-step chemical
kinetics scheme used for this study represents the simplest realistic mechanism
able to reproduce the essential dynamics of an actual chain-branching reaction.
Due to the different mechanism of a chain-branching chemical reaction over a
one-step global reaction, sorne differences between these two kinetics models are
observed for the initiation and propagation of detonation.
This study demonstrates that using a more realistic chernical kinetics
model could eliminate sorne of the difficulties in a single-step rate la\v and was
able to more realistically reproduce the qualitative aspects of the direct initiation.
Multi-step chemical kinetics model cao provide a chemical switch-off mechanism
that causes detonation failure to occur, which cannot be described by the one-step
Arrhenius rate mode!. This permits a unique value tor the eritical initiation energy
to be determined. A criterion for defining the critical initiation energy based on
the chemical kinetics can also be obtained, due to the faet that the blast wave
generated by the source must not decay below the chain-branching cross-over
temperature before the onset of detonation occurs. Below this temperature limit
chain-branching reactions become ineffeetive, resulting in a sudden decrease in
the global reaction rate and causing a quenehing of energy release and a failure to
initiate.
Due to the non-uniqueness of the critical energy when a single-step
Arrhenius rate law is used, most of the existing theories on direct initiation cannot
be verified numerically. In the present study where a more realistic chemical
model is used and a clear cut-off value of critieal energy cao be obtained, these
theories have been verified from the present numerieal simulations. The
62
•
•
•
numerical results show that the detonation instability plays an important raIe in
the initiation process. For a highly unstable mixture~ results deviate from those
obtained by prior theories for direct initiation. Since most of these existing
initiation models are based on the blast wave theory, they do not include a
parameter to model the detonation instability. This study suggests that the ratio i5
between the induction and reaction zone length may be a good parameter to be
include in the fonnulation of a theory for direct initiation to take into account for
the effect of detonation instability. Regardless of the chemical reaction
mechanism, this ratio 5 is shown to control the detonation propagation. In
addition, it is thought to govem the mechanism of the amplification process tor
initiation near the critical regime. A multi-step kinetics model is certainly required
to investigate in more detail the effect of this ratio t5 because it allows the
independent variation of the induction and reaction length scales. which cannot be
achieved by a single-step Arrhenius rate law. This permits us in future to perform
a parametric study of these two length scales numerically and contribute in the
development of a more vigorous theory for direct initiation.
ln conclusion. this thesis justifies that the single-step rate law should be
abandoned in favour of more detailed chemical kinetics model similar to the one
employed in the present study for a more comprehensive study of the direct
initiation of detonation.
63

•
•
•
References
1. Abouseif, G.E., and Toong, T.Y., Theory of unstable one-dimensional detonations.
Comblls/. Flame. 45: 67-94, (1982)
2. Berger, M.J., and ColeHa, P., Local adaptive mesh refinement for shock
hydrodynamics, J. Comput. Phys. 82: 64-84, (1989)
3. Bach. G.G., Knystautas, R., and Lee, J.H.S., Direct initiation of spherical detonations
in gaseous explosives, I211r Symposium (Int.) on Combust.. 21: 853-864. (1969)
4. Benedick. W.B., High-explosive initiation of methane-air detonations. Combusi.
Flame. 35: 87-91. (1979)
5. Benedick, W.B., Guirao, C., Knystautas. R.. and Lee. J.H.. Critical charge for the
direct initiation of detonation in gaseous fuel-air mixtures, Prog. As/ra. Aero.. 106:
181-202, (1985)
6. Borisov. A.A., Zamanskii, V.M., Lisyanskii, V.V., Heat evolution kinetics in high
temperature ignition of hydrocarbon/air or oxygen mixtures, Prog. Asiro. Aero.. 114:
124-139, (1987)
7. Bourlioux, A.. Nlimerieai Siudies of Unslable Detonations, PhD Thesis. Princeton
University, (1991)
8. Bull. D.C.. Elsworth. J.E., and Hooper, G., Initiation of spherical detonation ln
hydrocarbon/air mixtures. Acta Astro.. 5: 997-1008, (1978)
9. Chern. I.L., and ColelIa, P.. A conservative front tracking method for hyperbolic
conservation laws, Lawrence Livermore National Laboratories Report No. ueRL-
97200. (1987)
10. Chue. R.S .. High Speed Deflagration and its Transition ta Detonation. PhD Thesis,
McGilI University, Montréal, Canada, (1993)
11. Colella, P., Glimm's rnethod for gas dynamics, SIAM J. Sei. Slat. Comput., 3: 76-109,
(1982)
12. ColelIa, P.• and Woodward, P.R., The piecewise parabolic method (PPM) for gas
dynamical simulations, J. Comput. Phys. 54: 174-201, (1984)
64

•
•
•
13. Oionne~ J.-P., Numerical Study of the Propagation of Non-ideal Detonations. PhD
Thesis, McGill University, Montréal, Canada, (2000)
14. Oionne. J.-P., Ng. H.O.. Chue. R.S., and Lee, J.H.S.. Numerical study of pathological
detonations~ Proeeedings of the 17''' International Col/oquium on the Dynamics of
E-rplosions and Reactive Systems, Universitat Heidelberg, Gennany, (1999)
15. Oold, J.W.. and Kapil~ A.K., Comparison between shock initiations of detonation
using thermally-sensitive and chain-branching chemical models, Combust. Flame. 85:
185-194. (1991)
16. Eckett.. C.A.. Quirk. J.1.. and Shepherd. 1.E.. An analytical model tor direct initiation
of gaseous detonations. 2ri Symposium (Int.) on Shock Waves. (1997)
17. Eckett.. C.A., Quirk, 1.1., and Shepherd, J.E., The role of unsteadiness in direct
initiation of gaseous detonations, J Fluid Meeh., 421: 147-183, (2000)
18. Erpenbeck. 1.1., Stability of idealized one-reaction detonations, Phys. Fluids. 7: 684
696. (1964)
19. Fickett. W.. lacobson. 1.0.. and Schott. G.L.. Calculated pulsating one-dimensional
detonations with induction-zone kinetics. AIAA 1.. 10: 514-516. (1972)
20. Fickett. W.. and Wood. W.W.• Flow calculation for pulsating one-dimensional
detonations. Phys. Fluids, 9: 903-916, (1966)
21. He. L.. Theoretical determination of the critical conditions for direct initiation of
detonation in hydrogen-oxygen mixtures. Combus/. Flame, 104: 401-418. (1996)
22. He. L., and Clavin, P., On the direct initiation of gaseous detonation by an energy
source. .J FIl/id Meeh., 277: 227-248, (1994)
23. He. L. and Lee. 1.H.. The dynamic limit of one-dimensional detonations. Phys.
Fluids. 7: 1151-1158. (1995)
24. Lee, H.!.. and Stewart. O.S., Calculation of linear detonation instability: One
dimensional instability of plane detonation,.J FIl/id Mech., 216: 103-132, (1990)
25. Lee. 1.H.S., Dynamic parameters of gaseous detonations, Ann. Rev. FIl/id Meeh.. 16:
311-336, (1984)
26. Lee. 1.H.S.. Initiation of gaseous detonation, Ann. Rev. Phys. Chem., 28: 75-104.
(1977)
65
• 27. Lee~ J.H.S., and Higgins. A.J., Comments on criteria for direct initiation of
detonations, Phil. Trans. R. Soc. Lond A. 357: 3503-3521. (1999)
28. Lee.. J.H.S.. and Moen. I.a., The mechanism of transition from deflagration to
detonation in vapor cloud explosions. Prog. Energy Combusl. Sei.. 6: 359-389. (1980)
29. Lee. J.H.S.~ and Ramamurthi. K., On the concept of the critical size of a detonatoin
Kernel, Combllst. Flame, 27: 331-440, (1976)
30. Mazaherî. B.K.~ Alechanism of Onset of Detonation in Blast Initiation. PhD Thesis.
McGill University. Montréat Canada. (1997)
31. Oran. E.S.. and Boris. 1.P.. Nlimerical Simulation ofReactive Flo..,,', Elsevier Science
Publicating Co.. Ine.. (1987)
32. Radulescu. M.I.. Higgins. A.1., and Lee. 1.H.S.. On the explosion length invariance in
direct initiation of detonation. 281" Symposium (Int.) on Combust.. University of
Edinburgh. Scotland. (2000)
33. Sedov. L.I., Similarily and Dimensional lvlethods in A-Iechanics. 4lh ed.. Academic
Press. New York. (1959)
• 34. Sharpe. G.1.. Linear stability of idealized detonations. Proc. R. Soc. Lond. A. 453.
2603-2625. (1997)
35. Sharpe. G.1. and Falle, S.A.E.G., One-dimensional numerical simulations of idealized
detonations. Proc. R. Soc. Lond. A, 455: 1203-1214. (1999)
36. Short. M.. and Quirk. J.1.. On the nonlinear stability and detonability limit of a
detonation wave for a model three-step chain-branching reaction, J. FIl/id Mech.• 339:
89-119, (1997)
37. Short. M.. Kapila. A.K.. and Quirk. 1.1.. The chemical-gas dynamic mechanisms of
pulsating detonation wave instability. Phil. Trans. R. Soc. Lond. A. 357: 3621-3637.
(1999)
•
38. Taylor~ S.G.. The formation of blast wave by a very intense explosion~ 1- Theoretical
discussion. Proc. Roy. Soc. A. 201: 159-174. (1950)
39. Westbrook, C.K.. and Urtiew. P.A., Chemical kinetic prediction of critical parameters
in gaseous detonations. 19" Symposium (lnt.) on Combust.. 9: 615-623, (1982)
40. Westbrook~ C.K., Chemical kinetics of hydrocarbon oxidation in gaseous detonations.
Comhllst. Flame. 46: 191-210. (1982)
66

•
•
•
41. Yoshikawa~ N., Coherent Shock Wave Amplification in Photochemical Initiation of
Gllseous Detonation. PhD Thesis, McGill University. Montréa1~ Canada. (1980)
42. Zel'dovich. Va. B.. Kogarko. S.M.• and Simonov, N.N., An experimental
investigation of spherical detonation in gases, Soviet Physics-Technical Physics. 1:
1689-1713. (1957)
67
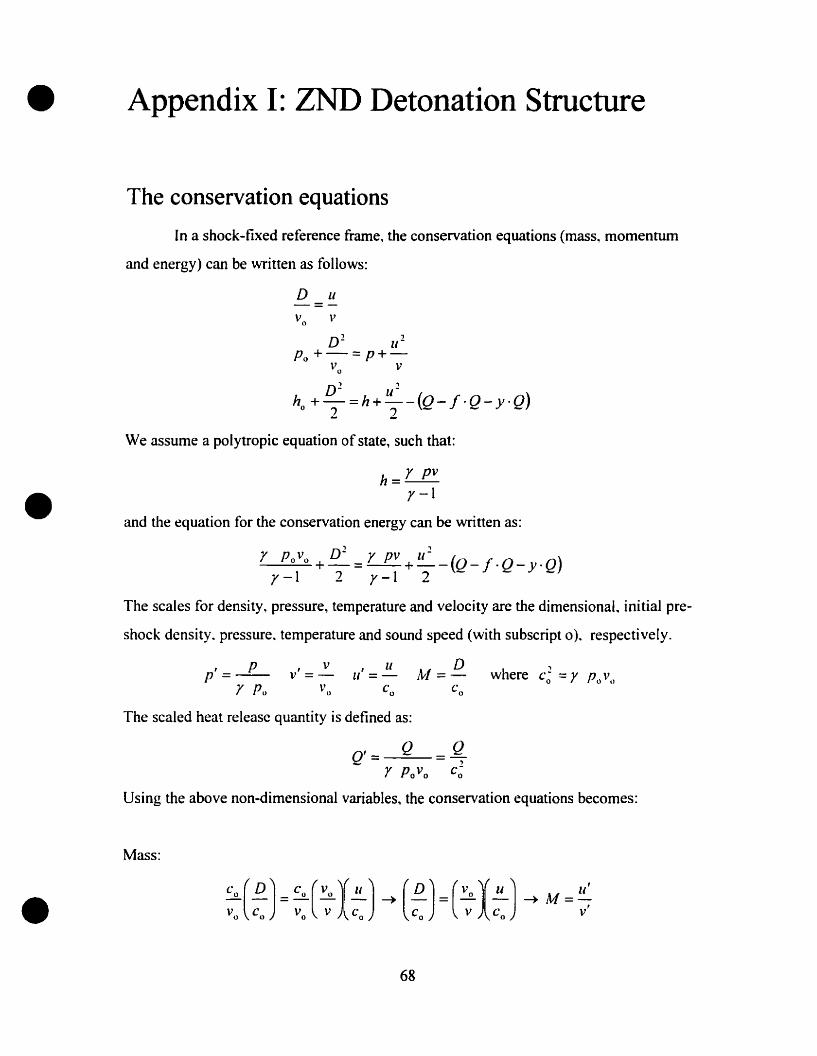
• Appendix 1: ZND Detonation Structure
The conservation equations
ln a shock-fixed reference frame, the conservation equations (mass, momentum
and energy) can be written as follows:
D LI-=-Vo V
Dl li:!
Po+-=P+-Vo v
Dl ).h +-=h+!!--(O-f·O-y.O)
o 2 2 - - -
•We assume a polytropic equation of state, such that:
h= Y pvy-l
and the equation for the conservation energy cao be written as:
The scales for density, pressure, temperature and velocity are the dimensional, initial pre
shock density. pressure. temperature and sound speed (with subscript 0), respectively.
, PP =--
y Po
, v , liV=- 1I=-
Vo Co
The scaled heat release quantity is defined as:
Q=
•
Using the above non-dimensional variables, the conservation equations becomes:
Mass:
68

•
•
•
Momentum:
Energy:
y p~v" +c; (~J' =y' ~ovo (LJ(~J+(; (~J2y 1 - Co Y 1 J'Po Vo - Co
(0 0 0 J- r Po Vo - - f· - - y. -
YPovo YPoVo YPoVo
1 "f- ') ",liY. - Y P v u - (0' . 0' 0')--+-=--+-- -J. -y.
y-I 2 y-I 2 - - -
ln summary, the conservation equations ir. non-dimensional form are:
u'At[= -
v'l ') U,2
- + 1\;/- =p' + - =p' + Alu'y v'
1 M 2 r p'v' url-+-= +--(Q,-/·Q'-Y'Q')y-I 2 y-I 2
69
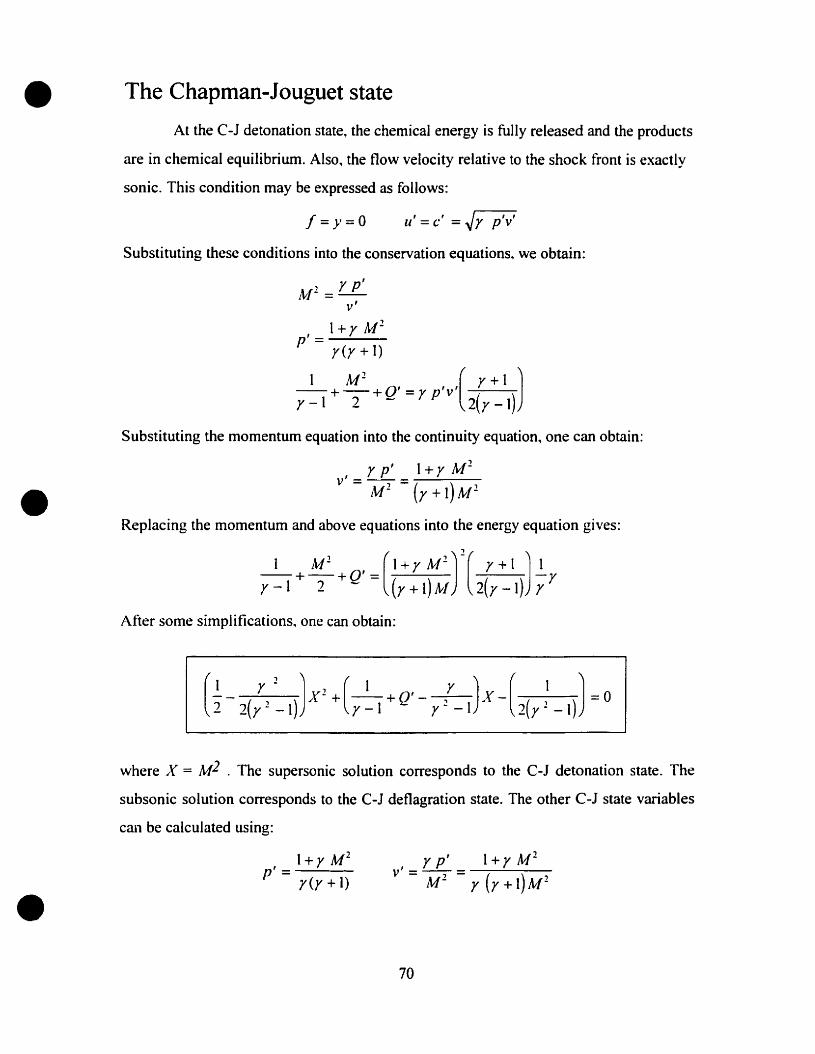
• The Chapman-Jouguet state
At the C-J detonation state, the chemical energy is fully released and the products
are in chemical equilibrium. Also, the flow velocity relative to the shock front is exactly
sonic. This condition may be expressed as follows:
f=y=O , , .J "lI=C: = ypv
•
Substituting these conditions into the conservation equations, we obtain:
I+y M 2
p'=-"'""----y(y + 1)
1 M2
( Y + 1 J--+--+0' =y p'v'y - 1 2 - 2(Y - 1)
Substituting the rnornentum equation into the continuity equation, one can obtain:
, y p' 1+ y M 2
v ----- M 2
- (y + 1) M 2
Replacing the rnornentum and above equations into the energy equation gives:
After sorne simplifications. one can obtain:
(1 y 2 J 1 ( 1 y) ( 1 J-- ....\'~ + --+Q'- X- =02 2(y2 -1) y-l y2 -1 2(y2 -1)
where X· = M2 . The supersonic solution corresponds to the C-J detonation state. The
subsonic solution corresponds to the C-J deflagration state. The other C-J state variables
can be calculated using:
•, 1+ y M 2
P = y(y + 1)
y p' 1+ y Mlv' - -- - -~---
- Ml - Y (y + 1) M 2
70
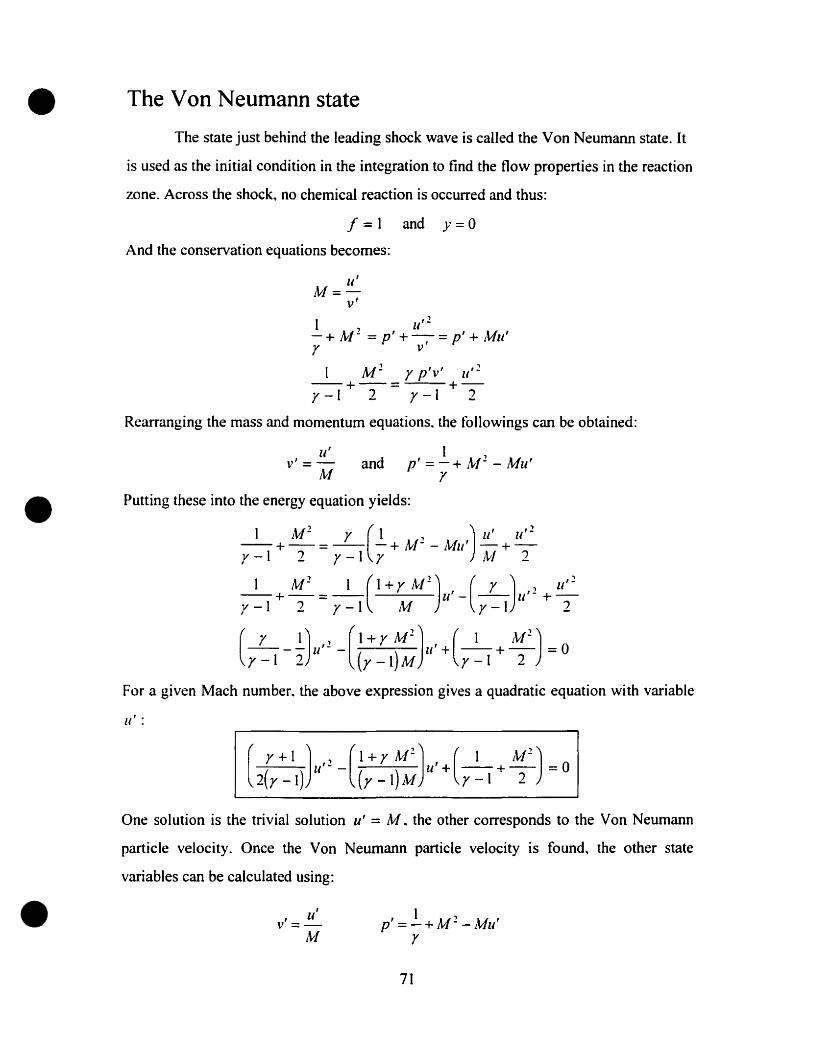
• The Von Neumann state
The state just behind the leading shock wave is called the Von Neumann state. It
is used as the initial condition in the integration to find the flow properties in the reaction
zone. Across the shock. no chemical reaction is occurred and thus:
f = 1 and y = 0
And the conservation equations becomes:
u'1\4=
v'1 ., U,2
-+ Atl- =:= p' +-= p' + 1.\1u'y v'
1 M 2 Y p'v' U,2
--+--= +-y-l 2 y-I 2
Rearranging the mass and momentum equations. the followings can be obtained:
Putting these ioto the energy equation yields:
1 1\;/2
Y (1 , ) li ' Il' 2--+--=-- -+ 1\;[- - A1u' -+-y-l 2 y-l Y j\;[ 2
1 M2
1 ( 1+ y NI:!) , ( y ) , 2 li' '2--+-=-- li - -- li +-y-l 2 y-l M y-l 2
(Y~I-i)u" -((;~I)~JlI'+(Y~1 + i~') =0
•u'
v'=-1\1
and1 ,
p' = - + lw- - Mu'y
For a given Mach number. the above expression gives a quadratic equation with variable
u' :
One solution is the trivial solution u' = M. the other corresponds to the Von Neumann
partic1e velocity. Once the Von Neumann particle velocity is found. the other state
variables can be calculated using:
• ,, li
V =-1\;1
, 1 ., ,p =-+M- -Mu
y
71
• Reaction zone properties
To compute the reaction zone structure of the detonation, consider the two
equations for the rate ofconsumption of fuel and radical:
df-=-w -wdt 1 B
These can be written as follows:
dy-= wi +wB-wdt C
"f dx--=-w -wd'r dt 1 8
where:
li
~~ ~ ~+~-~--=W +w -w ~ -=---.,;....-~-~
dr dl 1 B C dx li
•
•
and the variable x is the steady shock-attached distance coordinate system.
Given the initial condition which are the Von Neumann state, the above
differential equations may be integrated away from the shock at x ~ 0 50 as to determine
the complete structure of the steady detonation wave for x> o.
Numerical methods
The variation in the consumption progress variables is determined by 4lh order
Runge-Kutta method. The above differential equations have 2 dependent variablef and y:
df- = z(x,f,y)drdy- = g(x,f,y)d"f(xo ) = fo
Hereh andyo are the initial conditions of the problem. Using a step size of h, the value of
fandy can be found using:
72
• J.. = 10 + ~ (k1 + 2k, + 2k, + k. )
kl =h·z(xo'/o·yo)
h . kl IIk~ =h· z(xo + 2,10 + 2 ·Yo + 2)
h k, 1,k" =h·z(xo +-'/0 +-- ,Yo +-=-). 222
k~ =h·z(xo +h,J:1 +k3 ,yo +/3 )
Y, =Yo +~(/1 +2/, +2/, +/.)
II =h·g(xo'/o·yo)
h k 11, = h . g(x, + -, '0 + -'-, v +...!..)
- 1. 2· J ( 2· u 2
h k, /,/3 =h· g(xo +2,1:1 + i ·Yu + :2)/~ = h·g(xo +h.f., +k.".yo +1:,)
•
•
The mass fraction f and y are evaluated numerically using Runge-Kutta method and the
ather state variables are evaluated directly from the 3 conservation equations for each step
size h.
Consider again the 3 conservation equations:
u/J'vi =v/
1 , u/ l
- + A1- =p' + - = p' + i'vfU/y v'
1 J\;(1 Y p'V / li / 2
-+-= +--(O'-/.O'-y.O')y-l 2 y-l 2 - - -
From the continuity and momentum equation:
u' = J\;/v'
1 ,p' = - + A1- - lv/u'
y
Substitute these relations into the energy equation, one can obtain:
73
• Given the Mach number of the detonation wave. the above equation is a quadratic
equation in v' :
1 ( l'vI! y M! ) (1 Y M2
) ( 1 1\12
)v'- ---- +v --+-- - (Q'-j.Q'-y.Q')+--+- =02 y-I y-l y-I y-I 2
The other state variables can be computed using:
u' = At/v'
•
•
These equations are used to update the state variables inside the reaction zone for each
step size h. These values will be used for the next integration step of the rate equations.
74

• Appendix II: Numerical Methods
Fractional steps method
We are solving the reactive Euler equation in conservation fonn:
The solution of equation A2 serves as the initial condition for the system of ordinary
differential equations tor the geometrical source terms:
where U. F(U) , S, G denote the flow vector. the flux. the source term due to combustion
and geometry. respectively. J is the geometric index (J = O. 1. 2 for planar, cylindrical
and spherical geometries, respectively)
The system is solved by the use of a splitting scheme where the hydrodynanlics
transport and the chemical effects are taken into account separately in successive
fractional steps. BasicaIly, we divide the problem into several sub-problems. The
fractional step technique proceeds as follows. [n the tirst step, we solve the non-reactive
version of equation Alby setting aIl the source terms to zero:
•
u( +F(Ut =S-JG
U( + F(Ut =0
u( =-JG
(AI)
(A2)
(A3)
Finally, we use the solution of equation A3 as the initial condition to solve the equation
for the source term due to chemical reaction.
u( =S (A4)
•
The solution to equation A4 completes the solution at the new time level. A complete
second order accurate splitting scheme (Strang's splitting method) to integrate from ln to
(+1 is of the form:
where L~: denotes the finite difference approximation operator for the hyperbolic
equation A2. L~ and L~ are discrete operators for the ordinary equations A3 and A4 for
the geometric and chemical source term, respectively.
75
•
•
Hydrodynamic solver: PPM method
In the above numerical scheme. the hydrodynamic equation (equation. A2) is
solved using the piecewise parabolic method of ColeHa & Woodward [12]. which is a
higher-order extension of Godunov' s method. The flow variables U are updated using the
tollowing discrete eonservative fonn:
U"~I V" ti.t F F)1 = 1 - A..-r ( I~II 2 - 1-1/2
where A..-r = X H1 / 2 - X;-ll:! and ~{= ("~I - (". F is the flux at the interfaces between two
ceUs. To find the solution Vat a ne\v time level 1'+1. the interface fluxes Fi+ l /l and Fi-Ii:!
must be properly determined. The difference between different numerical schemes is to
how to obtain these fluxes. The above update formula is conservative no matter how we
define our numerieal flux F. It is therefore possible to create a multitude of conservation
methods simply by defining the inter-cell fluxes differently and using the above update
tormula. For Godunov method. instead of using sorne averaging between eeUs values. the
fluxes are computed fronl an exact solution of Riemann problem at the interface between
two adjacent cells. For PPM method. instead of using a constant value tor the dependent
variable at each cell as in the Godunov method, uses a parabolic interpolation in each cell
of the fonn:
V(.r:) = U,_1/2 + ç[JV, + V 6.,(1 - Ç)}
where.
•
!'J.U, =U'.1!2.1. - U'.112.R and (J•., =6[U, - ~(U'+II2.L + U'.112.R)]
We obtain V i+1I2.L and Ui+112.R by first using an interpolation scheme to calculate U(x) and
an approximation to the value of U at Xi+I/2, subject to the constraint that V;+//2 does not
tàll out of the range of values given by Vi and Ui+I/2. The interface value is calculated as:
where
8,U; = min{18U, [,21 ti.1+ 112 1,21 ~'-112 I)sign(8U;), if ~;+1I2· ~'-112 > 0
76

• (j,U, = 0 otherwise.
A V" V"U,+1/2 = 1+1 - , A Vif V",-112 = ,- 1-1
In smooth parts of the solution~ away fron1 extrema, the left and right states can be
obtained as:
so that the interpolation function V(.x) is continuous at the interface. In sorne cases~ the
interpolation function V(.r:) takes on values which are not between Ui+1I1.l and Ui+ 11l.R.
Therefore~ the value Ui+l1l.l and V i+l11.R are further modified such that U(.r:) is monotone
function on each cell (.r:j-1I2. X}+II])' The newexpressions for Vi+1I2.l and Ui+II!.R are thus
written as:
if (U,.R - U;' )(V;' - V,.L) ~ 0
l't" V U [V" 1 ] (U,.R - U,.L)2
( '.R- I.l) '-"2(V,.R+ V,.L) > 6
•U -..,V" -JU
'.L - -' f - f.R
U -..,U" -JU,.R - -', - '.l if
(V U)2,.R- '.L >(U -V )[U,,_.!-(U +V )]
6 'oR f.L , 2 'oR foL
Once we have these values Vi.l and Ui•R, the cell intertàce fluxes can be obtained by:
x [ 2]~+li2.L(Y)=U,.R --=) AV, -(1-:;-x)U6 .,
- -'
yX=-
Aç,
•
Once the left and right states at interface are known, the next step is to solve the Riemann
problem to obtain the value of tlow variables at intertàce. Details of the PPM method are
given in the papers by CoUeia & Woodward [12] and Mazaheri [30] .
77
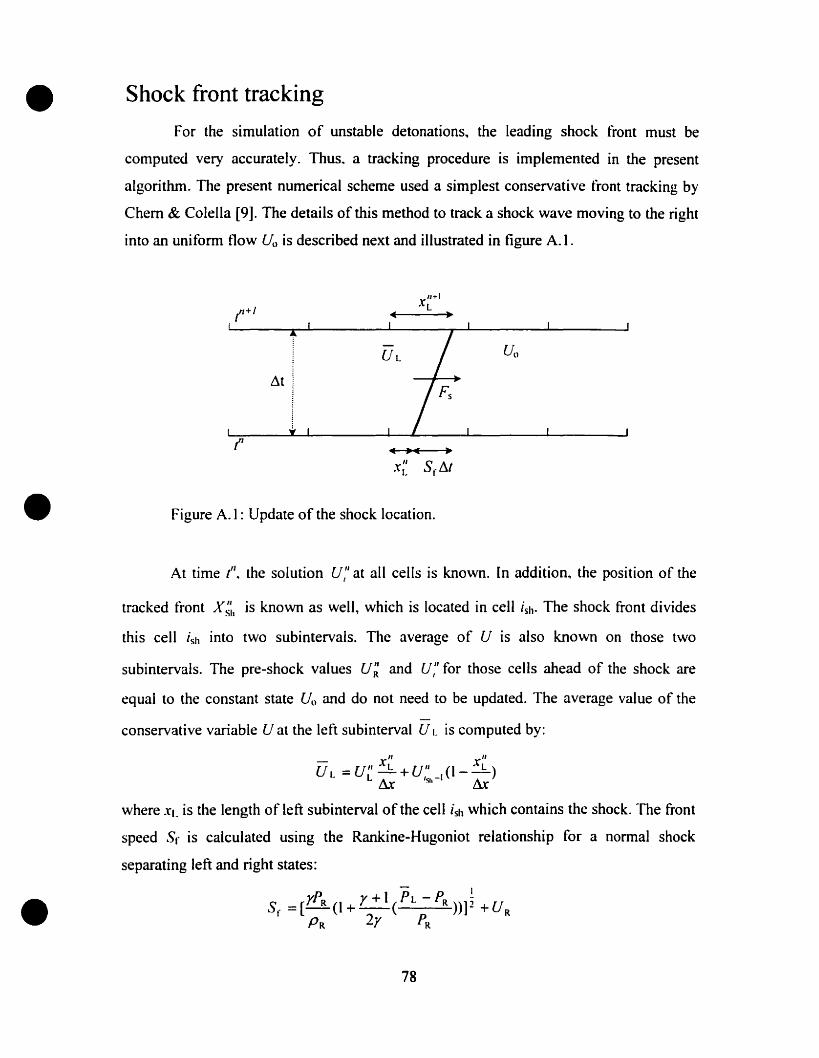
•
•
•
Shock front tracking
For the simulation of unstable detonations~ the leading shock front must be
computed very accurately. Thus~ a tracking procedure is implemented in the present
algorithm. The present numerical scheme used a simplest conservative front tracking by
Chem & ColelIa [9]. The details ofthis method to track a shock wave moving to the right
into an uniform flow Vo is described next and illustrated in figure A.t.
~t
Figure A.l: Update of the shock location.
At time l!l~ the solution V;' at aIl cells is known. In addition~ the position of the
tracked front X~~, is known as weIl, which is located in cell ish. The shock front divides
this cell ish into two subintervals. The average of V is also known on those two
subintervals. The pre-shock values V~ and U;' for those cells ahead of the shock are
equal to the constant state Uo and do not need to be updated. The average value of the
conservative variable U at the left subinterval ULis computed by:
where XL is the length of left subinterval of the cell ish \vhich contains the shock. The front
speed Sr is calculated using the Rankine-Hugoniot relationship for a normal shock
separating left and right states:
78

•
•
•
and the shock position is updated by:
11+1 /1 SX Sh = X Sh + rli/
The flux across the front is also computed by:
Fs = F(Uo ) - SrU"
The tlow behind the shock is updated. The PPM algorithm is applied in ail cells for i<ish.
However a special trealment is needed for the cell containing the shock front. There are
two possible cases and the conservative variable for this cell containing the shock can be
updated as follows.
C 1) ,"+1 ./1
ase /Sh = lSh
..-.v"-Llo
F· A ') Sh k Co k' c. '11+1 ·1119ure ._: oc lront trac mg lor /Sh = /Sh •
The conservative update of U for the left subinterval between l'and t+/ may be written
in this form:
1I+IU"+1 - "U" + A/(F. - F )XL L - XL L Ll 1 5
This is not a stable way to updating UL because ifx~+' is very small. the CFL condition
will be violated [7]. This is the major difficulty with front tracking procedures. To resolve
this problem~ Chem & Colella's method (flux redistribution near the front) suggested the
tollowing procedure:
1I+1U·"+1 = x"U" + A/(F. - F ) + 11+1U" _ II+IU"
XL L L L Ll 1 S XL L XL L
79
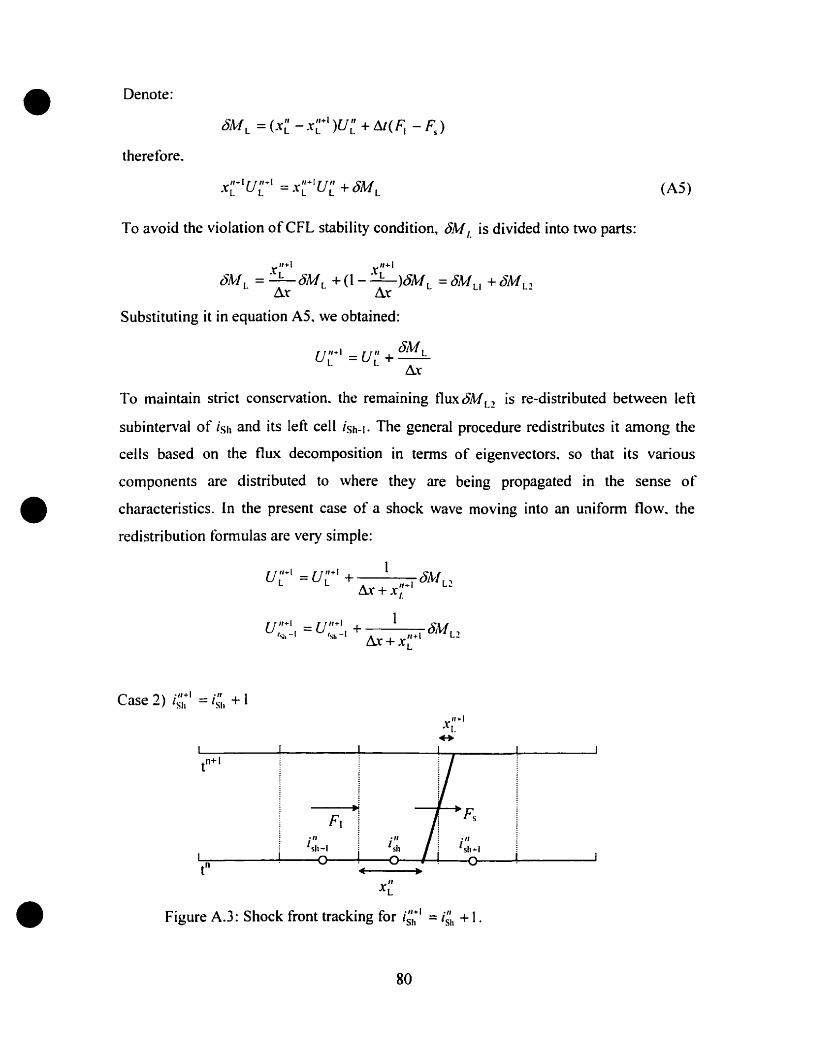
• Denote:
theretore~
1+[U"+1 = ... II+IU" + ~),IXL L .\. L L ViVI L
Ta avoid the violation ofCFL stability condition, t5JvI,. is divided into two parts:
11+[ r"+1()N! L == 5:- oJv!L + (l - .:....!::-)t5ML == c5M LI + âAt!L2
L\X L1;r
Substituting it in equation AS. we obtained:
lj "+[ _ U" &\1LL - L+
~X
(A5)
•
•
Ta maintain strict conservation~ the remaining flux 6ML:! is re-distributed between left
subinterval of ÎSh and its left cell iSh-l. The general procedure redistributes it among the
ceUs based on the flux decomposition in terms of eigenvectors~ so that its various
components are distributed to where they are bcing propagated in the sense of
characteristics. In the present case of a shock wave moving into an unifonn flow~ the
redistribution formulas are very simple:
V 'l+l == V,,+I + 1 -~'f'L L A _ 1/+ 1 Uiv. L2
LU + XI.
U "+1 == U"+I + 1 ~',I'Sh -1 'Sl,-I A. 11+1 ViVI L2
uX'+X L
C ')) ·11+1 ·11 1ase - /Sh == /Sh +
XIIL
Figure A.3: Shock front tracking for Î~;;I == i~;1 + 1.
80

•
•
•
This situation is slightly more complicated than case 1. First of aIl, the fraction of Lll
which is elapsed in the new cell containing the shock, called it r, is introduced as:
r lt+1
r =:..L.Sr
Then, the conservation equations will be applied in two steps in the shocked celi. Once
between l'and 1'+(.1/-r), and then between 1'+(.1/-r) and ('+/. The conservation law is
1· d &: b h Il -// d ·//+1app le Lor ot ce s /Sh an /Sh -
where. F =F(V L). Similar to case 1, we derive the following expressions:
II+IU"+I - ,,..1 V - .... "+1 V + r(F - F )XL L - XL L ." L l s
and denote DNILas:
then.
and finally the same method of redistribution of oNI'.l as in case 1:
U "... 1 =V"+1 + 1 "{1 L (j,v. L_"'• A. 11+1
uX+XL
V "+1 = V'I+I + 1 ~".{.... 1 U1V, L2'Slo 'Sil tl;r + xt
81
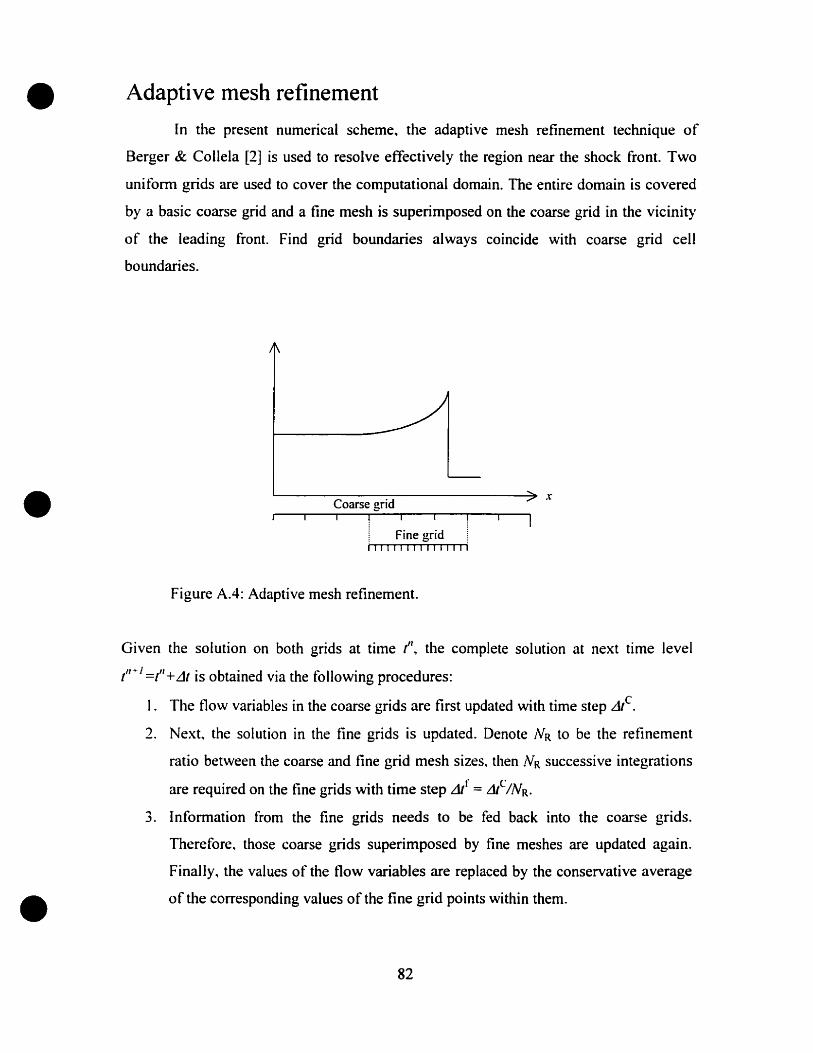
•
•
•
Adaptive mesh refinement
ln the present numerical scheme~ the adaptive mesh refinement technique of
Berger & Collela [2] is used to resolve effectively the region near the shock front. Two
uniform grids are used to coyer the computational domain. The entire domain is covered
by a basic coarse grid and a fine mesh is superimposed on the coarse grid in the vicinit)'
of the leading front. Find grid boundaries always coincide with coarse grid cell
boundaries.
'-----------------~xCoarse grid
Fine gridj 111 1 1 1 1 1 1 Il 11 1
Figure A.4: Adaptive mesh refinement.
Given the solution on both grids at time ln, the complete solution at next time level
11+/ " A· b· d . h &". II· d1 ;::::.1 +LJI IS 0 tame VIa t e LO oWlng proce ures:
1. The flow variables in the coarse grids are first updated with time step .dIe.
2. Next~ the solution in the fine grids is updated. Denote NR to be the refinement
ratio between the coarse and fine grid mesh sizes. then lVR successive integrations
are required on the fine grids with time step .dl = t1{INR•
3. Information from the fine grids needs to be fed back ioto the coarse grids.
Therefore. those coarse grids superimposed by fine meshes are updated again.
Finally, the values of the flow variables are replaced by the conservative average
of the corresponding values of the fine grid points within them.
82
•
•
•
4. The location of the shock front on the coarse grid is also replaced by its value on
the fine grid.
5. To preserve strict conservation. the solution at the left boundary of the fine grid is
corrected by the foliowing fonnula:
where F~ is the flux at the interface between the coarse and fine grids determined
previously in step 1. F~' is the flux at the same place calculated in step 2. and
U,:·~~I is the conservative variable on the first coarse cell at the left of the
interface between coarse and fine meshes [7. 30].
6. The position of the fine grid with respect to the coarse grid is finally updated te
account for the motion of the tracked shock. The fine grid is located such that the
tracked leading shock is always covered by the fine grid.
83