· A Three Dimensional Analysis of Gas Flow Distribution ... · Dr. Cross has also been active in...
48
· A Three Dimensional Analysis of Gas Flow Distribution . in the Drying Zone of a Pellet Induration Furnace •
Transcript of · A Three Dimensional Analysis of Gas Flow Distribution ... · Dr. Cross has also been active in...

· A Three Dimensional Analysis of Gas Flow Distribution
. in the Drying Zone of a Pellet Induration Furnace
•

I I I I I I I I I
I I I I
I II
A Three Dimensional Analysis of Gas Flow Distribution in the Drying Zone of a
Pellet Induration Furnace
by
David J. Englund Minnesota Department of Natural Resou~ces
Division of Minerals H~bbing, Minnesota
Prepared for the Iron Ore Cooperative Res~arch Gommi~tee June 23, 1993
This document is made available electronically by the Minnesota Legislative Reference Library as part of an ongoing digital archiving project. http://www.leg.state.mn.us/lrl/lrl.asp (Funding for document digitization was provided, in part, by a grant from the Minnesota Historical & Cultural Heritage Program.)

I I
• • • I
• I I ., I I
• I I I I
• I
TABLE OF CONTENTS
Summary . . • . . . . • . . . . . . . . . . . . . . l Introduc~ion . . . . . Why a CFO Study? • . • Eveleth Taconite Furnace
. ' 2 • 2
• • 3 Model Assumptions . • . . . • . . . . . . • • 4
20 Model .....•..• · · · · • • · /H~R2r8·~1995. • Comparison of 20 anct 30 Solutions . . • . . • •
• • 4 •. 5
• 1~~1L~:c·~:i·11,01.11~. , ~eoiito1t Discussion of 30 Simulations . . . . . • ,i::,p= .. ~~x'l~~r. ·~ ~'rm u. • 6 Pot~Grate Test Results • . . . OfflCE BUILDING • s
• • • rAU~, M~ 55f 55 : .: : , 8 Preheat Quench Tests • • • Fired Pellet Tests . . . . . . • . 9 20 Baf~le Simulations " Model Validation: ..•
. . . . . . . . . . . . . . . . . 10
. . . . . . . . . . . . . . . . . 10 Conclusions . . . . . . . . . .. . '· . 12 References . . . . . • . . . . . .• ~ 13
TABLES: Table 1. Table 2. Table 3. Table 4.
Pot-Grate Preheat Quench Test Results • . . • • ·• • Pot-Grate Fired Pellet Test Results . CFO Simulation - Mass Flow Results • . . Eveleth Taconite Furnace Temperature Survey •. • ••
FIGURES: Figure 1. Figure 2a .. Figure 2b. Figure 3 • Figure 4. Figure 5 .. Figure 6. Figure 7 G
Figure 8. Figure 9 .. Figure lOa . Figure lOb. Figure 11. Figure 12 .. Figure 13a.
Figure 13b.
Figure 13c ..
Figure 13d.
Figure 14. Figure 15. Figure 16. Figure 17. Figure 18. Figure 19, Figure 20a. Figure 20b. Figure 41.
CFO Problem Definition . . . • • . . . . Grate-Kiln Indurating System . . . . . . Eveleth Taconite Drying Zone . . . . . • 20 Grid Series . . . . . . . . . . . . . . . Gas Temperature Profile at Pellet Bed Surface . . Vertical Gas Temperature Profile . . . • . . Pressure Drop Across Bed . . . . . . . . . . . • Gas Temperature Profile at Inlet Center Lin~ Gas Temperature Profile at Bed Surface Pressure Profile at Bed Surface . . . . • . . . . Gas Temperature Contours - Windbox 4 Gas Temperature Contours - Windbox 4 • • • • • • Furnace Drying Zone - 6 Windboxes . . . . • . Gas Temperature Profile at Bed Surface . . . . . Gas Temperature - Bed Surface - Original Machine Design . . . . . . · . · · · · · · • · · · · Gas Temperature - Bed Surface - current Machine D es i gn . . . 9 • I) • • • • • • • • • • • • • 9i •
Gas Temperature - Bed Surface - Outlet Relocation Modification . . . . . • . . . . . . . . . . Gas Temperature - Bed Surf ace - Inlet/Outlet Relocation Modification . . . . . . . . . . . • • Predicted Gas Mass Flows - Four Simulation Cases Pot-Grate Test Temperature Profiles . • • • • . • Pot-Grate Magnetite Oxidation End of Preheat Zone Pot-Grate Compression Strength End of Preheat zon$ Pot-Grate Mini Tumble Strength End of ~reheat Zone Pot-Grate Fired Pellet Compression Strength . 20 Model Simulation Without Baffles ....•. 20 Model Simulation With Baffles . . . . • • • • Furnace Thermocouple Port Locations • ~ •
14· 14 15 16
17 18 19 20 21 22 23 24 25 26 27 28 29 30
31
32
33
34 35 36 37 38 39 40 41 42 43
I I I I I I
• I
• • • • • • • • • • •
A THREE DIMENSIONAL ANALYSIS OF GAS FLOW DISTRIBUTION IN TllE DRYJNG ZONE OF A :f~LLET INDURATION FURNACE
Minnesota · Depart~ent of .. ~atura1 Resoui;ces Division-Qf Mirierals
·· : , Hibbing,, . Minnesota.
SUMMARY: .,, ~
The reader sh6fild note that the model validation section at the end of this repott was written following the presentation of results at the ·Duluth AIME Mining Symposium on January '21, 1993. This repqrt has been revised to accommodate the validation discussion; however, mpdel validation is not yet considered complete and further testing will take 'place during the fall 1993.
A thr.ee/ dimensional computational fluid dynamics (CFO) model of a drying zone in an iron ore pellet grate-kiln induration system has been developed by the Minnesota Department of Natural Resources, Minerals Division. Siml.llation runs with the model have shown that minimal mixing of gases· occurs in cases where multiple gas streams enter - a zone at differing temperatures and that the resulting temperature disparities · appear responsible for significant variation in pellet physical strength and magnetite content developed in the preheat zone on the grate .
Pot-grate tests using simulation temperature profiles for which gas temperatures varied by as much as 350 deg c across the grate demonstrated that gas temperatures can significantly impact pellet properties. The results showed a 2 0% increase in magnetite content and a 50% decrease in compression strength in pellets at the bottom of the bed on the colder side of the grate by end of preheat. The simulation results have also shown this type of modeling to be useful in predicting fan flow rates and in-leakage effects on the grate .
Validation with plant operating conditions was tested on April 14, 1993, by inserting a thermocouple probe into eight sampling ports on the Eveleth furnace. This test confirmed the existence of temperature segregation within the zone, but with smaller gradients than predicted by the model (350 C predicted vs 75-160 c measured). The furnace survey indicated turbulence to be a significant factor and modifications to the model are in progress to account· for greater turbulence effects .
1

INTRODUCTION:·
The Mineral·s Division of the Minnesota ·Department of Natural Resources has initiated a CFO modeling research project as a member of the Iron Ore Cooperativ~ Research Commi-ttee (IOCRC). The IOCRC is a cooperative effort whose ·goal ''.is to' improve the operating efficiency of the Minnesota taconite mining industry. Ca>m,mittee representatives includ~ all sev~~ Minnesota taconite mining operations, the University of Minnesota, the U.S. Bureau of Mines, and three minerals benef iciation laboratories situated on the Mesabi Iron Range in northern Minnesota.
The state and .industry are exploring application of CFD modeling to heat transfer .. and gas flow conditions within the induration furriaces uied foi production of iron ore pellets. ~p~cifically, interest in CFO ~cideling was sparked by a desire to re-examine the "perfect mixing assumption" for gas flow, which is SQ frequently used to simpl~fy energy and gas flow balances in pellet induration systems. The results discussed in thi~ report do not support the perfect mixing assumption and, in fact, show that under certain conditions significant segregation o·f mass and energy flow can occur.
~h~ State of Minnesota purchased a CFO sof~ware package known as Easyflow from Adaptive-Research Corporation in Huntsville, Alabama, which interfaces with the PHOENICS CFD source codes. This package was upgraded with a version called CFD2000, which produced the; results discussed in this report. CFD2QOO has now been replaced with Phoenics 1.6.6 supported by Cham of North America Atlanta, Georgia. The simulation results presented were performed using a PC 486/50 with 32mb of ram.
CFD, computational fluid dynamics, is a family of computer codes which simulate fluid flow, heat transfer, chemical reaction, and related phenomena, from 'first principles in one, two, or three dimensional systems. These codes use a variety of numerical "' techniques for solution of linear and non-linear partial differential equations. A number of .publications are listed at the end of the paper for further reference . 1
•2
•3
•4
•5 Solution format
typically follows a path as shown in figure 1. 6
WHY A CFD STUDY?
Some mining companies in Minnesota have access to the INDSYS pellet induration simulator, developed by Dr. Mark Cross. In order to set up a simulation, the INDSYS program requires the user have extensive knowledge of gas flow, includirig leakages, throughout the furnace. INDSYS assumes perfect mixing of two or more gas streams entering a zone at different temperatures, when such conditions occur. Dr. Cross has also been active in CFD analysis for pellet induration systems, and is currently working on a separate program to interface with INDSYS for prediction of ~as flow ba~ed on pressures at specified nodes in the indurator. ·8•
9•10
II I I I I I I I I I I I
I I I I I I

• • • • • • • • • • II
• • • • II
• II
The· INDSYS user must estimate gas flow in the furnace from experience, from pot-grate data, or from plant air surveys. But how does the user simulate a condition for which no plant cfa,ta exists, or a condition where two gas streams enter a zone. at significantly different temperatures? How much mixing occurs? How do the flows distribute themselves within the. zone? It was. toward this end that the research program was directed, to see what a three dimensional gas flow analysis of a pellet induration furnace: would reveal. The grate machine operated by Eve·leth Taconite: . Mining. Company presented a perfect opportunity, where, w,ith:in:. the drying. zone, 780 deg c recoup gases. mix with 350 deg c preheat fan gases .
The goals for this CFD· evaluation are two-fold; first to demonstra~e how CFO analysis wil1- enhance understanding of gas; :flow i11 the -machine and, secondly, to demonstrate h:ow the CFD appli:"oach· ~llows plant operators to simulate different duct inlet and fan outlet configurations, possibly including u:s.e of deflecto,rs·. 0r
·baffles; within the furnace·. The results o.f these types. O;f CFD simulations enable the tNDSYS user to quantitatively detail gas flow.input required by INDSYS for simulation. By running IND:S:'iS, the impacts of the proposed configuration on fuel consumption and production rate can be determined, providing the necessary data for cost/benefit analysis .
EVELETH TACONITE FURNACE:
Eveleth Taconite Company participated by allowing access to plant data and machine specifications. Throughout the report reference will be made to the A side and the B sid~ of the drying zone. The A side is the side in which the lA preheat fan flow enters the zone in windboxes 1-3 and high temperature recoup gas enters in windboxes 5-6. While on the B side, the lB preheat fan flow enters in windboxes 3-5. Figure 2a shows a typical grate kiln indurating system, and figure 2b shows the detail of the 30 model grid . Originally, recoup gas also entered through an inlet in windbox 4; this inlet is currently closed .
The recoup inlet in windbox 4 was closed to correct a grate casting wear problem. The Eveleth machine experiences higher casting wear on the B side of the grate. In 1984 Eveleth personnel ran tests by inserting thermocouples in the pellet bed. The thermocouples were placed about 1 meter in from each side of the machine. The temperature profiles generated as the thermocouples travelled with the grate recorded higher gas temperatures on the A side in windboxes 4-6. The windbox 4 inlet was closed off to force recoup ~ir across to the opposite side of the grate from remaining inlets in windboxes 5 & 6. The simulations to be discussed will show that this desired effect is not achieved when the recoup inlet to! windbox 4 is closed.
A crude three dimensional CFD model was developed in late 1991~ It did reveal temperature segregation within the zone,. and the
3

simulation data qualitatively correlated with the 1984 plant data. The results encouraged continuation of the study, and the project moved forward under the sponsorship of the Iron Ore Cooperative Research .committee.
MODEL ASSUMPTIONS:
·rn these models pressures are· fixed at all inlets and outlets. Values are specified ~ased on plant operating data. Gas flow results from pressure differential in the system. The pressure drop across the bed is simulated as a resistance to flow using standard internal PHOENICS variables. Furnace walls are considerecl adiabatic. L~akages were incorporated above and below the bed on the pellet feed ~nd, above the bed at the drying zone/preheat zbne separation, and above and below the bed along both sides of the furnace. . The side leakages are based on the . geometry of side casting doorsr usinij a 1.2CM slit above and below the bed in each windbox. The end leakages are based on known furnace wall cle~ranc~s. ·The'models are single phase, that is, only physical and thermodynamic properties of the gas are t~ken into account. If necessary, two phase flow could ·be incorporated to detail heat transfer and chemical reactions occurring in the bed.
The bed is simulated by a region functioning as a neat sink with resistance to flow. The magnitude of the heat sink was determined from an INDSYS simulation; this term is normalized as heat loss per unit bed volume. For the simulations presented, enthalpy changes in the off gas due to evaporation of moisture from the pellet bed to the gas stream have not been taken into account. The heat sink term is based solely on net heat transferred to the pellet bed. Flow resistance was empir lly determined; future development can and should relate it to bed permeability.
Because of the extensive computation time required for three 1 analysis us a PC 486 (about 20-30 hours per
simulation) , initial development took place using a 20 model format 0 This format simulates flow in a cross sectional plane
windbox 4 when the recoup inlet is open.
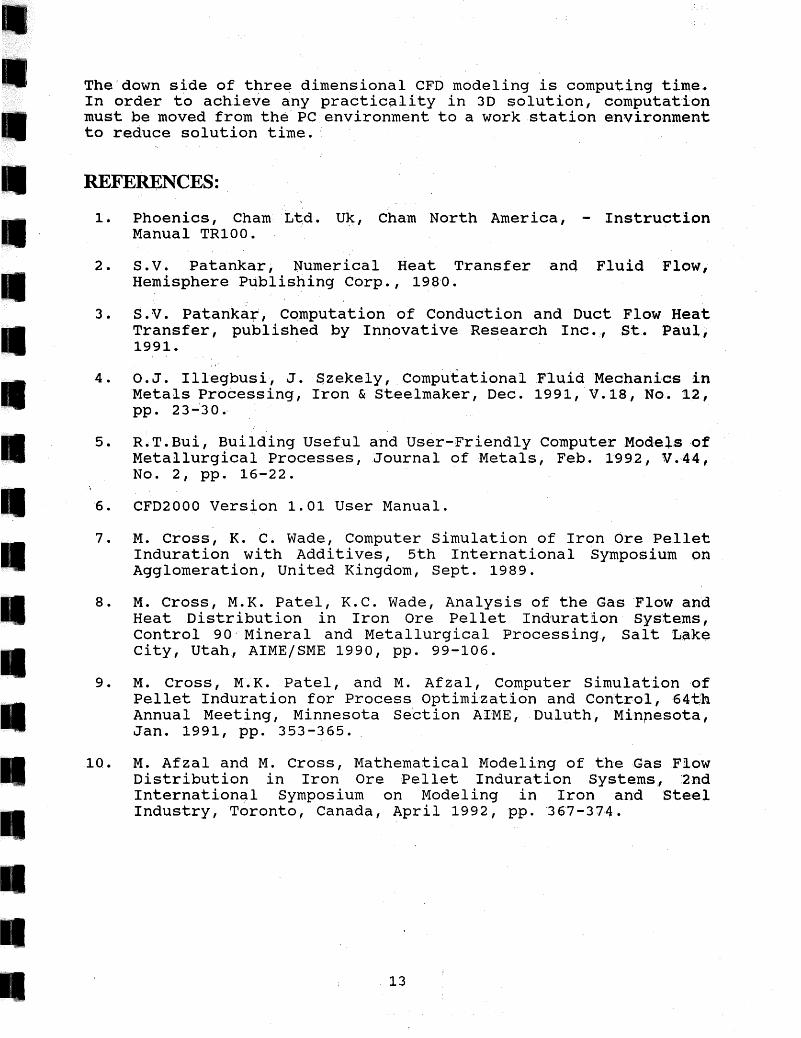
In CFD analysis the number of cells in the solution grid determine accuracy of the solutiono The trade off with increasing numbers of cells is computation time. With the 2D model a number of different cell densities within the computation grid were evaluated to determine grid size where the solution became grid independent. That is, where no further change in solution occurred with addition of more cells. Convergence was judged by following recommended software criteria.
For the 2D model, grids r~nged from 20x40 to 100xl20 (wxh) cells and respective computation times ranged from 8 minutes to 95
4
I I I I I I I I I I
I
I
I !I
I
I

• • • • • • • • • • • • • • • • • • •
minutes. The 30 model uses a 24x54x61 (wxhxl) grid in contrast. From the 20 work, the 80xl00 grid provided acceptable grid independence when judging total mass flow in the system. However, even the 20x40 grid provided very good qualitative representation of temperature profiles in the zone. The impact of grid size on mass flow in the system is shown in figure 3 •
Figure 4 compares the five grid sizes. using temperature profiles at the bed surface, one can see there is little difference between them, the largest differerices occu~ in region$ of steep gradient, such a·s the edges where in-leakages are present and in the temperature transition region between the two gas stream$. The effects of leakage penetrate as far as o. 4 meters in from the source for the coarse grid, by adding more cells the effects ~re discernable up to 0.2 meters in from the source .
Figure 5 shows the variation in temperature profile vertically from top to bottom of furnace; note how the number of cells in the bed
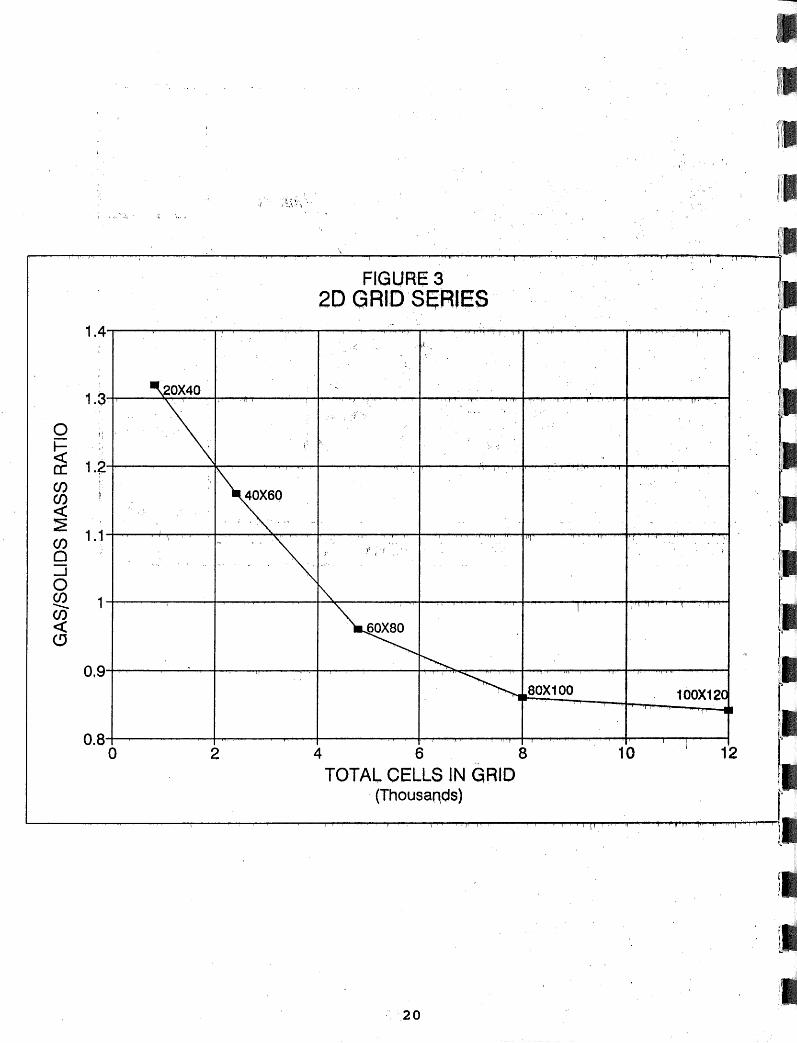
· region affect:"gas temperature upon exiting the bed. Comparing the 20x40 to the 100x120 grid, the off gas temperature below the bed drops by as much a$ 100 degrees c for the same bed conditions. Pressure profiles also differed mainly in magnitude as shown in figure 6 .
COMPARISON OF 2D AND 3D SOLUTIONS:
Comparing the 20 model output with the 30 model output under identical boundary conditions shows good correlation between the grid independent 20 model and the coarser, less well defined solutions of the 30 model.
Figure 7 compares gas temperature profiles along an imaginary centerline across the furnace from inlet face to inlet face. While the width of the temperature gradient differs between the models, both show the gradient between the gas streams very distinctly . The temperature profile across the windbox at the bed surface can be seen in figure 8. Here again the 30 model results differ slightly in magnitude and location, but nonetheless predict the gradient. The steep gradients on the edges are the result of simulated leakage entering through side casting doors. Note how the width of the temperature gradient decreased from approximately 1.5 meters to 0.3 meters, with the increased number of cells in the 20 model.
Figure 9 shows a similar comparison for pressure at the top of the bed moving across the machine. Again the curves are similar, differing about 250 pascal in magnitude.
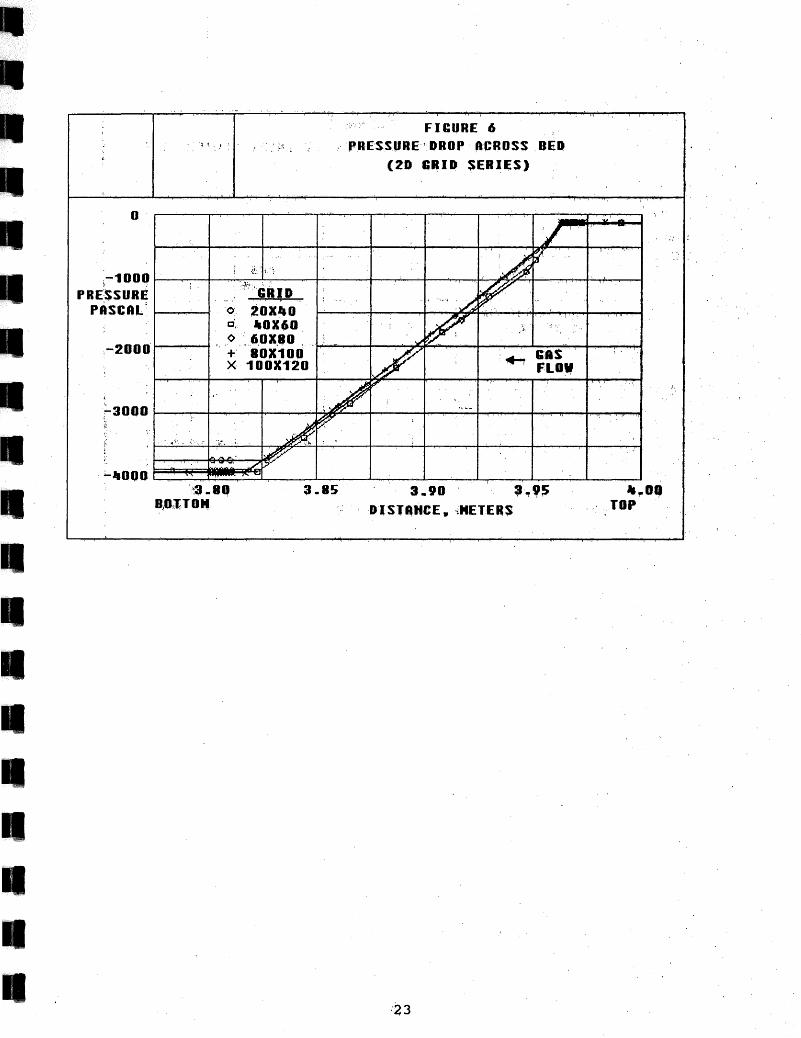
Figures lOa&b show predicted temperature contours for both the 20 and 30 models in cross section. Gas velocity vectors are shown in the 30 model cross section for reference. The vectors for the 20 model run are identical, but were not shown because they obscure the temperature contours.
5

At this point, convinced that while the 30 moae1 may not be giving precise absolute values, the results w~re cert~inly qualitatively acceptable. So three additional runs using the.24X54x61 grid were conducted.
DISCUSSION OF 3D SIMULATIONS:
The software post processor allows viewing of the results in two or three d.imensio.ns. Figure 11 pro:vides a thre'e dimensional ·isometric view sqow~ng _gas temperatures at the ·furnaqe walls. The confinement of high temperq.tqre recoup gas is obvious in thi~ view. Based on the 2D model ~tudies arid the 3b ~i~ulation of th~ original fl.l:rnace design·, it a'ppears that where inlets oppose each other, resulting flow conditions restrict movement of' gas across the grate. Such that in reaching the center of the grate, horizontal ~ovem~nt ce~ses and: flow continues only ve~tically dowri through the bed. · · ·
The four simulations are.described as follow:
Case O: The original machine design with all windbox inlets open; inlets from preheat fan lA in windboxes 1A,2A,3A, inlets from high temperature recoup gas coming from the cooler in windboxes 4A,SA,6A, and inle~s from preheat. fan lB in windboxes 3B, 4B, SB; waste gas 'fan 2A exhausting windboxes 1A,2A,3A,4A, and waste gas fan 2B exhausting windboxes 1B,2B,3B,4B.
Case 1: The current machine design with windbox 4 inlet from high temperature recoup flow closed (high temp recoup inlets in SA,6A). All preheat fan and waste gas fan inlets/outlets
·. remain unchanged.
Case 2: Relocation of waste gas 2B outlets from windboxes 3B, 4B to windboxes SB, 6B. Inlets from lA preheat fan in 1A,2A,3A, inlets from high temp recoup in win~boxes 4A,5A,6A, and inlets from lB preheat fan in windboxes 3B,4B,SB; waste gas fan 2A exhausting from windboxes lA, 2A, 3A, 4A and waste gas fan 2B exhausting from 1B,2B,SB,6B.
Case 3: outlet relocation as in Case 2, additionally the inlet from lB preheat fan in windbox SB was moved to windbox 2B. Inlets from lA preheat fan in windboxes 1A,2A,3A, inlets from high temp recoup in windboxes 4A,SA,6A, and inlets from lB preheat fan in windboxes 2B,3B,4B.
Predicted temperature profiles at the 6enter of' the grate, along the length of the zone, provide a convenient means for comparison of the four ~uns. The current furnace configuration shows minimal effect of recoup gas at the center of the grate. By opening the recoup inlet in windbox 4A, and by closing the lB preheat inlet to wiridbox SB, a substantial incre~se in temperature is achieved as
6
• • • • I
•• • • • • • • • • • • • •
I
I
II II'•• '!"<!'~-- '
I
recoup flow penetrates further into the machine. These effects are illustrated in figure 12.
Figures 13a-d provide a comparison of the four runs, showing gas temperature contours at the bed surface. Note the differences in temperature contours in windboxes 4-6 for the various cases. Note how the high temperature region at the pellet bed surface is reduced when the recoup inlet to windbox 4 is closed (Case o vs Case 1) and also note that while relocation of outlets opposite the recoup inlets in windboxes 5 & 6 help marginally (Case O vs Case 2) , it is not until the opposing flow from preheat fan lB in windb9x 5 is eliminated, that the B-side is significantly heated up (Case 3).
Figure 14 and table 3 show relative gas mass flow splits between preheat fans lA and lB, and recoup for the four simulations. From this study, Case 3 provides the best balance between the preheat fans and maximizes the recoup flow. Note how total flow to the zone remains ~~latively constant, while the component flows change relative to each other. For the original design (Case O), the current design (Case 1), and the outlet modification design (Case 2), the lA preheat fan flow is 15-20% greater than the lB preheat fan flow; only for the fully modified Cqse (Case 3) are the lA and lB fan flows balanced. The results also show that recoup flow was minimized by closing'windbox 4 inlet. Recoup flow was maximized by opening the windbox 4 inlet and eliminating the opposing flow from the lB preheat fan in windbox 5.
Assuming simulation results were correct, two questions were asked:
First, what impact on pellet quality and production rate does this temperature disparity have?
Second, if the affects on pellet quality are discernable from one side to the other, how could the machine be modified to yield a more uniform gas and temperature distribution across the machine?
To address the first question, three series of pot-grate tests were performed at the Midland Research Center located in Nashwauk, Minnesota. The objective was to quantify affect of drying zone temperature profile on greenball moisture evaporation, magnetite oxidation, and on fired pellet quality. Pot-grate tests provide a laboratory scale means for simulating induration furnace temperature profiles and gas flows on plant produced greenballs.
Addressing question two, simulation cases 2 & 3 were performed to test potential modifications and their impact and to evaluate the sensitivity of the software to predict changes in flow based on these modifications.
7

POT-GRATE TEST RESULTS:
National Steel Pellet Company located in Keewatin, Minnesota, provided the greenballs for the pot grate tests. Eveleth Taconite greenballs would have been used had the plant been operating at the time of the pot-grate testing. Tables 1 and 2 summarize the results of the test program.
The variable in the pot tests was temperature; all zone times and pressures were kept constant. The drying zone was broken into six sub-zones, for which temperatures were varied according to predicted profiles (see figure 15). All temperature profiles for preheat and firing zones were held constant, the only variation among the three series was the drying zone temperature profile. Drying and preheat quench tests were carried out in duplicate and the results averaged; nitrogen gas was used to quench the oxidation tests. As it turned out, drying was complete by the end of the zone for all three cycles tested and is not discussed further.
Two of the drying zone temperature profiles were taken from the Aside of the zone, one from the original design simulation (Case 0) with windbox 4 open (cycle C), and one from the current machine design simulation (Case 1) with windbox 4 closed (cycle A). The third series drying zone temperature profile came from the B-side, and represents both original and current design simulations as they yielded nearly identical profiles on this side (cycle B). The profiles exist at one meter in from each side of the furnace in the CFD simulations.
PREHEAT QUENCH TESTS:
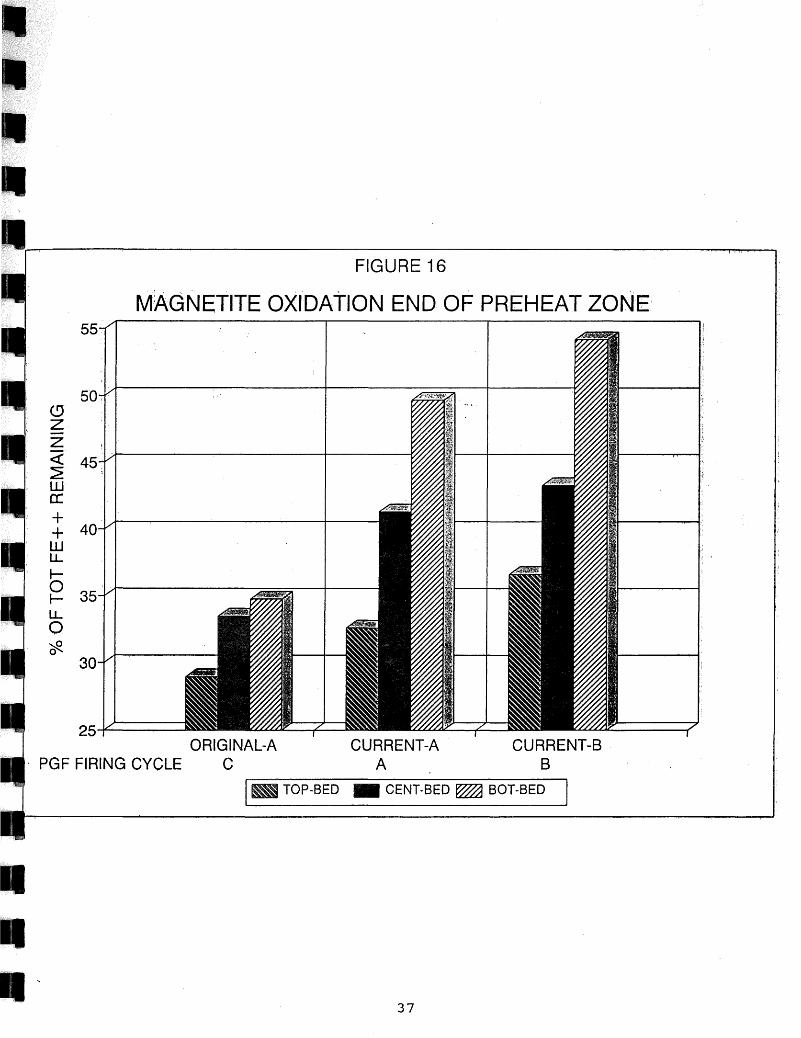
Magnetite oxidation shown as percent of total greenball ferrous iron remaining at the end of the preheat cycle was clearly affected by the differences in the drying temperature profiles. These results are shown in figure 16. The pellet ferrous iron content increased as the temperature profiles decreased in intensity. The original A-side profile (cycle C) , had the least ferrous iron remaining ranging from 29% near the top of the bed to 35% near the bottom of the bed, followed by the current A-side profile (cycle A), in which ferrous iron ranged from 32% to 49%, while the current B-side profile (cycle B) had the most ferrous iron remaining ranging from 36% to 54%. The most significant changes in ferrous iron content were found in the pellets at the bottom of the bed.
Magnetite oxidation is the subject of another Iron Ore Cooperative Research Study which has shown that pellet physical strengths are greatly affected by both the rate of oxidation and the time/temperature profiles at which the oxidation occurs. Our study did not attempt to optimize the oxidation pellet strength relationship, but only demonstrate that magnetite oxidation in the preheat zone is, in part, dependent on the gas temperature profile experienced by pellets in the drying zone.
8
' ,I
.'
:,·. ·.·.·,····
• 1.·1·,•, .,.' ~
I I I ,I
• I I
[I ,,, l
I I
I I I
• • •
• • • • • • • • I
• I
Compression strength at the end of preheat was greatest for cycle c, ranging from 46 kgs at the bottom of the bed to 52 kgs at the top of the bed, decreasing as temperature intensity decreased, for cycle A, from 29 kgs to 48 kgs respectively, and for cycle B, from 26 kgs to 46 kgs. There was little variation in strengths at the top of the bed, but considerable variation among pellets in the lower half (center/bottom) of the bed as seen in figu~e 17.
The mini-tumble test is another measure of pellet strength and was performed on bed composites from the preheat quench tests. This test tumbles a pellet charge in a partitioned ASTM tumble drum and measures breakage after 200 revolutions. Figure 18 shows that abrasion strength has same relation to drying temperature profile as compression strength, that is, as the profiles became progressively colder, pellet resistance to breakage and abrasio~ decreased as measured by percent weight plus 6.3mm, %wt-6.3mm+28m and %wt-28 mesh. It is desirable to maximize the material retained on the·6.3mm size after tumbling. From table 1. the range was 64%wt +6. 3mm to 48%.wt. to 41%wt for cycle c, cycle A, and cycle B, respectively.
Fm.ED PELLET TESTS:
Looking at fired pellet quality, the picture becomes a bit more complicated. The cycle B profile yielded the highest compression strengths for fired pellets, while cycle c yielded the lowest compression strengths. Observations of pellet bed thermocouples showed the highest peak temperatures in the bed occurring with the coolest drying zone temperature profile, and the lowest peak temperatures in the bed occurring for the hottest drying zone profile. Peak temperatures are no doubt related to magnetite content remaining at the end of preheat. The remaining magnetite which oxidizes during firing, raises peak firing temperatures in the bed, temperature increasing with the quantity of magnetite being oxidized. The greatest variation of compression strengths occurred for cycle B. The percentage of pellets breaking under 136 kgs (300 lbs) also exhibited some variation with firing cycle, indicating that magnetite oxidation has a pronounced effect on this parameter as well. We saw larger fractions of pellets breaking under 136 kgs in cycles c and B than with cycle A which had the lowest percentage. In cycles c and B oxidation rates were faster and slower, respectively, relative to cycle A. Fired pellet compression strengths are shown in figure 19.
Extrapolation of pot grate results to kiln fired plants is tricky at best, because the pot-grate apparatus cannot simulate the segregation of gas and solids and the tumbling/mixing action that occurs in the kiln. But the results demonstrate that drying zone temperature conditions seem to impact on pellet physical quality throughout the process. Tumble strength and reducibility properties were not affected, by the drying temperature profiles in these tests .
9
2D BAFFLE SIMULATIONS:
The 2D mode.l was also used to look at some internal baffle arrangements. We hoped that placement of baffles would improve gas mixing above the pellet bed. We were unable to identify any passive baffle arrangement capable of completely mixing the gases. One arrangement achieved partial success by deflecting lB preheat gases downward as they enter on the B~side. This solution does not eliminate the temperature disparity, but merely confines it closer to the furnace wall. Figures' 20a&b compare 2D simulations for similar conditions with and without baffles present.
Hanging plates were simulated near the inlet face to stop the horizontal gas momentum. The first and top most plate is located 0.5 meters in fro~ the inlet face and extends 0.66 meters down from the furnace ceiling. The next plate is 1.0 meter in from the inlet face and extends 0.66 meters down from the first plate. The third and lowermost' plate is 1. 8 3 meters in from the inlet face and extends down yet another o. 66 meters. This baffle arrangement reduced the preheat inlet flow by 35%, and increased recoup flow by 30% relative to the same boundary conditions without baffles.
MODEL VALIDATION:
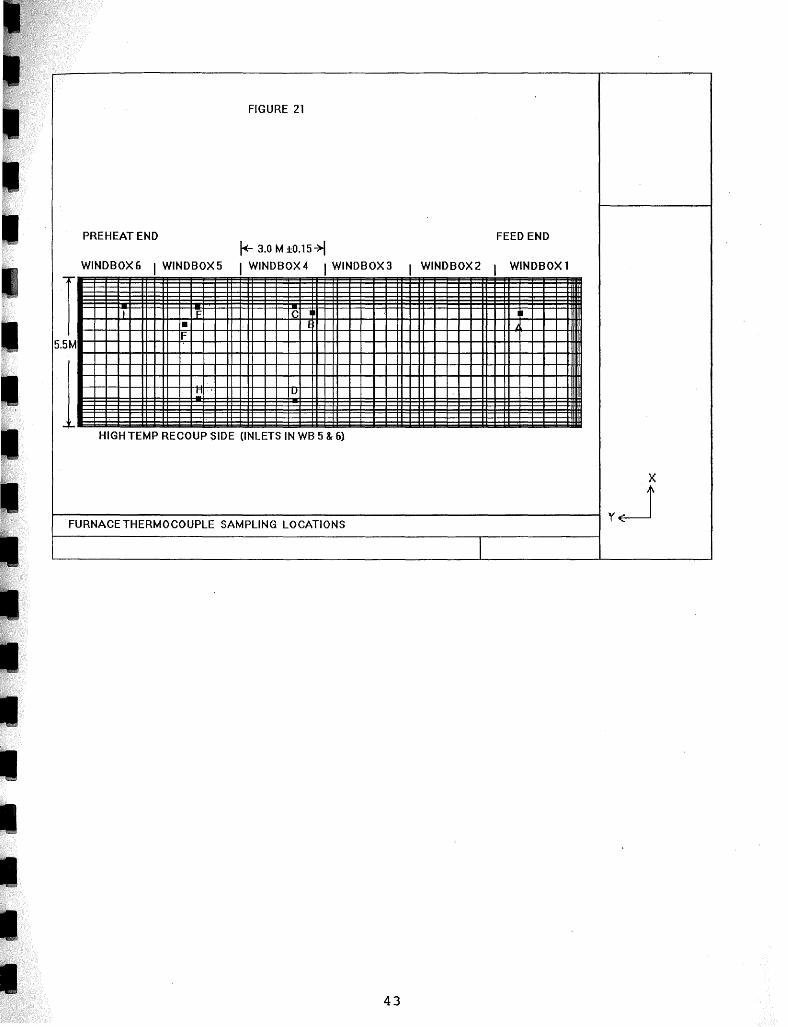
The results discussed thus far were based on model simulations generated between November 92 and February 93. On April 14, 1993, a temperature survey was made of the Eveleth furnace drying zone. Temperatures within the drying zone were manually recorded at eight sample points in the zone. Sampling ports were installed prior to the April start-up and can now be used at any time. A schematic showing location of the points is shown in Figure 21. The ports are located on the roof of the furnace.
A thermocouple probe was inserted through the port and lowered to a specific depth in the furnace. The probe consisted of a type K thermocouple with an unshielded junction. It is approximately 12 feet long. The probe was marked in one foot intervals and temperatures were recorded at those intervals, measured from the internal face of the furnace ceiling.
The level of turbulence in the furnace was quickly found to be considerably more significant than had been represented in the model. The reference to turbulence in the furnace at this time is somewhat subjective, being based on the force of pulses felt on the probe, and noted as large, rapid fluctuations in gas temperatures at the sampling point. For this survey approximate minimum and maximum temperatures were manually recorded at each sampling point and thermocouple location. Only at thermocouple location A (TC-A), did the temperature stabilize to a constant value; at the remaining locations the temperature could change as much as 200 F within 5-10 seconds. The probe was held at each sampling point for approximately 90 seconds.
10
• I I I I I I I I I I I I I I

• • • • • • • • • II
• • • • • • • II
The· recorded temperatures are listed in Table 4 (top half), showing that temperature gradients exist within the furnace, but that t-µrbulence . dampens the grad.ients when compared to the model predictions (Table 4 bottom half). Looking at the average of the minimum and maximum valu~s giv~n in Table 4, the following results confirm the existence of I q. gradient and indicate that further refinement is necessq.ry in. the turbulence parameters used in the model .
RANGE OF TEMP GRADIENTS FROM SIDE TO SIDE OF FURNACE Windbox Approx. Meas. Gradient Predicted Gradient 4 TC C/D 40-135 Deg C 20-50 Deg C 5 TC E/H, 75-160 Deg c 360-370 Deg c (ports located about :1 meter in .from side walls see fig. 21)
~he .range of gradient values,were found by comparing points at equal distance from ,the ceiling for thermocou,ple locations on opposite sides of the windbox. The predicted gradient values came from grid cells located as close to the actual sampling point as the model grid would allow. The CFD grid locations at cente·rs. of cells might vary from the actual sample points by up to 0.5 feet.
Comparing results along the length of the grate, significant temperature gradients. occur over the distance of one windbox (3 meters) and the larger gradients are found on the B-side· which appears to receive the least impact from recoup gases entering on the A-side in windboxes 5 and 6.
··RANGE OF TEMP GRADIENTS FROM CENTER WB-4 TO CENTER WB-5 Grate Side Approx. Meas. Gradient Predicted Gradient A-Side TC D/H 71-150 Deg C 310-350 Deg C B-Side TC C/E 130-250 Deg C 360-370 Deg C
Preliminary runs with the 2-D model have shown that increasing turbulence in the simulations tends to reduce the temperature gradient across the machine, moving the predicted results closer to the measured results. ·However, attempts to incorporate more turbulence in the 3-D models has led to unstable runs. Presently, attempts are being made to overcome the divergence, but progress has been slow .
Because of the wide and rapid temperature variations, at least one more survey should be conducted in the coming fiscal year (FY94), For this survey, temperature logging and recording will be carried out automatically so that mean temperatures and temperature distributions about the mean can be analyzed. However, ):>efore making this survey the turbulence parameters in the 3-D model will be revised and stable runs obtained with which to compare plant data .
11

CONCLUSIONS:
Upbn performing the temperature·survey·on the Eve+eth furnace, the ~Kistence of temperatur~/tjas'segregation'has been shown to e~ist, but to·a lesser e~tent 'than' 6riginally predicted. It is presumed that the differences are att~ibutable to the role of turbulence in the furnace. Indicating·· the ne·ed for refinement of turbulence parameters in the model. Work is presently underway to incorpor~·te these effects into the model, this work will be continued in FY94. Additional temperature surveys are· planned when model revision i~ complete~.
Three dimensi~nal ·analysis of pellet induration systems using CFO software is feasible and of value as a research tool· for reevaluating gas flow mixing in the furnace. The mass flow data gener~t~d f~om the CFO runs, can provide additional insight in setting up data files for INOSYS runs, particularly when evaluating conditic::>ns wh~re no plant data is available.
The pbt-grate series performed demonstrate that impact on pellet quality can be quantified for CFO simulation conditions, and effects on energy consumption and production rate can be found by making ·INOSYS runs. - The predictive capabilities for mod~ling pellet induratio'n systems are then greatly enhanced if one uses a combination of these three simulation tools.
It is also possible to define variables that measure mass and energy flux moving through the bed. Generating surface contours with these variables would allow the user to easily identify regions 'of low mass flow or low energy flow, resulting from the modifications'tested.
There are a number of other problems in the indurating system that could also be·modeled:
Optimizing burner placement in preheat zones for fluxed pellet production, to evenly distribute heat to the pellet bed.
Generating a detailed moisture migration contour for the pellet beds in straight grate systems where recondensation can be a serious problem, to evaluate drying cycle efficiencies.
Creating an oxygen concentration map for air injection into kilns, 'or preheat zones, to predict magnetite oxidation levels.
The solutions to these examples are not necessarily straightforward, but should be possible through user written subroutines added to the source code. Some of the examples may require incorporation of two phase models which also increases the level of complexity. Finally, parametric studies can be carried out to investigate a number of variables on mass flow. For example, how flow and heat are distributed as a function of fan pressure or damper position.
'ii .. :·:·· \1 I
)! ! , .. ;J
1.:1·· /I .
/,I
I:··· I'
ill
l 'I. ii "•
11
I
I
I
.I
• • • • • • • • • • • • • • • • • • •
The down side of three dimensional CFO modeling is computing time. In order to achie~e any practicality in 3D solution, computation must be moved from the PC environment to a work station environment to reduce solution time. :
REFERENCES: .
1. Phoenics, Cham L~d. Uk, Cham North America, - Instruction Manual TRlOO.
2. s.v. Patankar, Numerical Heat Transfer and Fluid Flow, Hemisphere Publishing Corp., 1980.
3. s.v. Patanka~, Cqmputation of Conduction and Duct Flow Heat Transfer, published by Innovative Research Inc .. , St~ Paul, 1991.
4. O.J. Illegbusi, J. Szekely, Computational Fluid Mechanics in Metals Pro6essing, Iron & Steelmaker, Dec. 1991, V.18, No. 12, pp. 23-.30.·
5. R~T.Bui, Building Useful and User-Friendly ComputerModeis of Metallurgical Processes, Journal of Metals, Feb. 1992, V. 4·4, No. 2, pp. 16-22 .
6. CFD2000 Version 1.01 User Manual.
7. M. Cross, K. c. Wade, Computer Simulation of Iron Ore Pellet Induration with Additives, 5th International symposium on Agglomeration, United Kingdom, Sept. 1989 .
8. M. Cross, M.K. Patel, K.C. Wade, Analysis of the Gas Flow and Heat Distribution in Iron Ore Pellet Induration Systems, Control 90 ·Mineral and Metallurgical Processing, Salt Lake City, Utah, AIME/SME 1990, pp. 99-106 .
9. M. Cross, M.K. Patel, and M. Afzal, Computer Simulation ·of Pellet Induration for Process Optimization and Control, 64t:h Annual Meeting, Minnesota Section AIME, Duluth, Minnesota, Jan. 1991, pp. 353-365.
10. M. Afzal and M. Cross, Mathematical Modeling of the Gas Flow Distribution in Iron Ore Pellet Induration Systems, :2nd International Symposium on Modeling in Iron and Steel Industry, Toronto, Canada, April 1992, pp. 367-374 .
13

TABLE 1. POT-GRATE PREHEAT QUENCH TEST RESULTS
Compression Str. Kgs:
Cycle Cycle Cycle c A B
Top-Bed Compression Kgs 53.9 49.4 48.9 % Wt.+6.3mm 51.7 48.1 44.9
Average 52.8 48.8 46.9 Average
Center Compression Kgs 51.7 47.6 42.2 % Wt. 6.3mm + 28M 50.8 48.5 39.0
Average 51.2 48.1 40.6
Bottom Compression Kgs 44.0 32.7 29.0 % Wt. -28M 48.5 26.3 24.0
Average 46.3 29.5 26.5
Green Ball Moisture % Wt. - 9 .1
Cycle A = Current machine drying zone .temp profile - 1 meter from A-side
Cycle B = Current machine drying zone temp profile - 1 meter from B-side
Cycle C = Original machine drying zone temp profile - 1 meter from A-side
t-' ~
,,_ "- ·- - .... - - -
Average
Average
-
Mini-Tumble % Wt. on: Oxidation % of Total Fe Remaining:,
Cycle Cycle ·Cycle Cycle Cycle Cycle c A B •. c A B
64.6 49:4 50.2 Top-Bed Oxidation 29.72 35.l6 34.05 64.0 48.0 32.4 28.27 30.06 39.15 64.3 48.7 41.3 Average 28.99 32.61 36.59
11.6 17.6 18.-0 Center-Bed Oxidation 34.05 43.47 43.47 13.4 19.4 29.8 32.98 39.15 43.13 12.5 18.5 23.9 Average 33.51 41.30 43.29
23.8 33.0 31.8 Bottom-Bed Oxidation 34.77 49.30 50.36 22.6 32.6 37.8 34.77 49.9_8 57.99 23.2 32.8 34.8 Average 34.77 49.63 54.17
TABLE 2. PO'l' GRATE FIRED PELLET TEST REsULTS
Original A-Side Current A-Side Current B-Side Cycle C Cycle A Cycle B
Avg. Compression Str. Kgs 183.2 215.9 209.5.
Compression % < 136 Kgs 15 8.3 13.3
Std. Dev. 48.0 59.9 63.0 -
Tumble %Wt +6.3mm 96.6 96.3 96.4 -
Reducibility R40 0.91 -0.88 0.9
- .... -.i - - - - - - -

• • • • • • • • • • • • • II
• • • •• •
TABLE 3. CPD SIMULATION - MASS FLOW RESULTS
Case 0 '"
PREHEAT IA FAN FLOW KG/SEC
Inlet IA 36.77
2A 34.60 ,,
3A 30.39 "'
TOTAL 101.76
Gas/Solids* 0.7269
% Change** 0
PREHEAT 1B FAN FLOW KG/SEC
Inlet 2B -'3B. 31.13
· '4B 27.33
SB 26.82
... TOTAL 85.28
Gas/Solids* 0.6091
% Change** 0
HIGH TEMP RECOUP FLOW KG/SEC
Inlet 4A 24.97
SA 23.S8
6A I9.58
TOTAL 68.I3
Gas/Solids* 0.4866
% Change** 0
WASTE GAS OUTLET KG/SEC 255.17 (includes leakage)
IA/lB FLOW RATIO 1. I9 .
*Mass Flow Ratio - simulated solids flow was S04 MT or 140 Kg/sec Hr
** % change is change relative to Case 0
15
Case I Case 2
38.45 37.09
37.04 34.59
35.10 29.91
II0.59 IOl.59
0.7899 0.725~
8.68 -0.I7
- -34.57 31.57
I
3I.87 26.77
30.61 26.46
97.0S 84.80
0.6932 0.6057
13.80 -0.56
- 24.74
28.5I 23.32
21.99 19.2
50.50 67.26
0.3607 0.4804
-25.88 -1.28
258.I4 253.65
1.I4 1.20
Case 3 I'
31.36
29.63
28.03
89.02
0.6359
-12.S2 I
29.88
28.03
28.81
-· 86.72
I
0.6194
1.69
26.26
27.21
23.25
76.72 i
0.548q
12.6I I
252.46
I' ,
1.03

~
°'
TABLE 4. EVELETH TACONITE FURNACE TEMPERATURE SURVEY
.. .. ·i. ,-
Therkocouple Location/Designation ' .. ' -,.
Dist. - -
from WB 4 TC B WB 4·TC C WB4TCD ~5TCE WB 5 TC F WB5TCH WB 6 TC 1 Roof WB 1
Mm H WB5
Min (ft.) TCA Max Min 'Max Min Max Min :Max Min Max TCG Min Max Max
Meas. 1 560 950 1050 880 950 950 1020 890 1000 900 970 NA 1130 1200 1370 1400 Temp 2 600 990 1080 850 950 1000 1050 850 900 900 1000 1150 1180 1400 1430 DegF 3 620 900 1000 700 800 900 980 780 -950 950 1050 1110 1120 13:80 1420
4 600 790 850 650 800 900 970 800 . 890 " '960 1050" 1090 1100 1380 1430 5 570 :, 700 840 600 750 900 950 840 920 980 1040 1060 1070 1380 -1420 6 580 650 790 550 700 830 900 850 950 980 1040 1030 1040 13~0 1400 7 560 650 830 580 650 830 890 890 980 970 1030 I 1100 1160 1350 1370 8 550 . 700 850 600 700 840 920 850 950 930 990 1040 1100 1330 1360 9 540 790 850 600 700 840 900 ~80 960 920 950 1050 1150 - 1320 1340
Temp 1 293 . 510 566 471 510 510 549 477 538 482 521 610 649. 743 760 Deg C 2 316 532 582 454 510 538 566 454 482 482 538 621 638 760 .777
3 327 482 538 371 427 482 527 416 510 510 566 599 604 749 . 771 4 316 421 454 343 427 482 521 427 ·477 516 .. 566 588 _593 ' 749 . 777 5 299 . 371 449 316 399 482 510 449 493 527 560 571 577 749 : 771 6 304 343 421 288 371 443 482 454 510 527 560 554 560 754 '760 7 293 - 343 443 304 343 443 471 477 527 521 554 593 627 732 743 8 288 371 454 316 371 449 493 454 510 499 532 560 593 721 738 9 282 421 454 316 371 449 482 471 516 493 510 566 621 716 727
Avg 1 293 . 538 491 529 507 502 629 752 Temp 2 316 557 482 552 468 510 629 768 Deg C 3 327 510 399 504 463 538 .602 760
4 316 438 385 502 452 541 591 763 5 299 410 357 496 471 543 574 760 6 304 382 329 463 482 543 557 757.
7 293 . 393 324 460 502 538 - 610 738 8 288 413 343 411 482 - 516 577 729 9 282 438 343 466 493 502 - 593 721
*CFD 1 650 . 680 680 700 6.80 681 1050 840 Model 2 650 680 680 710 680 683 1050 851 Temp 3 650 680 680 715 680 685 I 1050 870 DegC 4 650 680 6.80 718 680 687 1050 888
5 650 680 680 722 680 ti89 1050 910 6 650 680 680 724 680 691 1050 930 I 650 680 680 728 680 693 1049 955
--· 8 650 - 680 680~ 730 680 693 1048 960 9 650 680 680 732 680 693 1043 . 955
~ * CliiWimps iiiii fro1ilili FU~lillililY2iiif'hic1iiiiiw11ateilllifhin~f FeliiillFCiulilfhe s .. uct i-~A""*- in wliifx 6. --- - ... -· -- - -

• • • , • II
II II II
.;
·i_,, ...
FIGURE1 .. . \~,
CFD PROBLEM DEFINITION
, GEOMETRY/GRID DEF.iNITION -... · --~_,.......__,____.;,..~
SOLUTION ANALYSIS
RES UL TS/REVIEW
REDEFINE PROBLEM
I FINAL SOLUTION I
17

FIGURE 2a
I GRATE-KILN INDURATING SYSTEM I STACK
' HIGH TEMPERATU1
RE RECOUP ! ,..... . .
L2AFAN ' . I . ···· 1:AFAN.
£I r···::::::::::::::::;::::::::::~::: .. ·····-, > , .· ..
Ii \ .· \ I L .
DRYING PREHEAT KILN ~ ............................... ..
' ................ ,.................................................. .
i ' ~ ...................... ... • ! 28 FAN . ,.. · .
:
t · STACK
18 FAN ........................ ~·...................... MODEL BOUNDARY
--..--------llllilllo- SOLIDS FLOW
............................... ; ........... GAS FLOW
, 18
....... ................... .
r I : ..........
3AFAN

• • II 1111
1111
1111
1111
"I II
I,
1111
Ill Ill II II II II
FlCURE 2b
, PREHEAT
: '
EUELETH TACOHITE DRY I HG ZOHE - · 6 •HHD,Q:OXES
:19
0
~ a: (/) (/) <( ~ (/) 0 _J
0 (/) --(/) <( ~
FIGURE 3 20 GRID S~RIE!S
1.3
t:
1.? '
1.1
1
0,9 80X100 100X12
o.a-+-.---.---....-+-.-.,..,._ ____ ___.._-___,...,......,._+,_....,.._..__,...,.._..,.._,.....--+--~----........-.--......--.--~~ 0 2 4 6 8
TOTAL CELLS IN ~RID (Thousanc;f s)
.. 20
10 12
)I
j
~ I
11 !

I I
• • 1111
II II II II
' II Ill II II
' • • • II
77,7 TEtf P DEi; C
52'7
., > ,,
' : Ir
·~'
FIGURE It
..GAS TEHPERATUR~ PIJOFIL~ A.TI P'EllET 9ED. SU .. FAC~ ) ' ~ ' 'i •' I ' " i
''» ·,(2D' G.RID $.ERIES)
GRID' o 2QXlJO · c laQX60 ¢ 60X8o~ :~.~~ + .,. 80X10D · ~· 1oox12•
1, ' I I
• · .. ~\ 1 cas: ;; , .. ....__....__..__ __ FL••~i __..._......_........_' --~
~;\, i : 1;
'~ ·'
I :\,,'l; ,· ·: I. 'i\ ,,
' ..
12 7 ..... • ---.-+-,..,....,....""-.::1:-.-. ---L-,-.----"""""'.2~-__._,....,...__..,--,!:3,...---.---.-+-_:;_-::!.~. --r-__,..1.--.:!;--,-..,mli-~-IJ B • 5 A~S"llD~ DISlAHCEf .•. METERS 'r'":~:~:.~··E
J •·

·' f-icuR~ s UERTI'C:QL GAS TE'"PERATURE 'PROf IL~ \.''; . ~:EHTER Qf" GRATE
(2D·SERIES)
. J
727 --_,_,.~-G~R-l~D~-,--~--.......,..,,._,_~~---.-~-.......,.......~~~~-r-~~~-
TEMP DEG C
.<> 20X40 !C .. ox~o o.~ ,60X80 ~ 80X100
-~ ~ > ' : ~ _- ~:-~ ~; ~.,,.,......~-T"""+MI"-~~~ i A 0
s2t ~.,.._._~---1~o_o~x~1+~~Q~-t+*-~·.A-~:"~·'·-·-··~·--·+..,..,...."'~ .. y~/~;--~~~,~.~~P-A_S_,~,,~~ v: I ~~~
.' ~FLO~·
·. "' . . 'f
0 •.; 1 ,. 2 ~ . Ii 5 · .,:99:1nuc DIS.TAHCE 9 HETEiflS TQP
.22
• • I
• I
• I I I I I I I I I
I I I
• • • • • • • • • • • • • I I I
• I I
0
FICURE6 PRESS PRE·' DROP· -'CllOSS . BED
(2D G .. ID ~ERl~S)
*~-·I 'L ~: ~~1000k-.,..,...--,4r---..~~~~4-"-~....,_t--~--+~-....-~-,;~-rt-~,.......,..r-n~-.-i
PRE:$sURt; t . ". 'cR~D ' PASCAL'. 1--........---1 o· 20X40
. d~ -'OX60 .
-2000·...,..._~...., "·~. :.:·~:~:O . ........,._........., __ ...._.....,..........,...~,...._......._........,.._G_A_S~......,.._..,.....,....,... X 1DOX120 . ~ FLOlf
' ~30QO~_,....,. ,-. -1-.....--..-+.--._.;..~~.::-..,.--r------tr-~~t-r..--.....---t"'!'r'"""__.~~~ f.1
'5:3.IQ BtOJ,TO"
3.15 3.90 ' :J·".,~
D•STRMCE • ·iMETE._$
:23

927
TEMP DEG C
727
FIGURE 1
. G~S 'JEHPERRTURE PROF~LE RT •HLET CEHTER LIHE ,, . J ·• r,
... , ' f.,
. ,;-..,.,.-a .. . \_ ... \. -·
0 20 IOX100 ·:o a~. 211~~-
-: 1' ., ';, ~ "
, ..
'I
'' .:-------- -'
. i I i
'I
/.
. ,. , I
I 327'~~....._,.,.__...._._,~_,,__,.,.,.-,._,......~--''-..,--.----......~~-.-L-~___..-'"l->-'-..,__,__ ·O 1' ~ . . 3 Ja I' ., " .5
A~SIOE .. D·ISTAffCE'. MET.J;9'$
24
~-[I
[I
[I
11
I
!.I :I l
ti

II
• • • • • • • • • • • • • • • •
9.27 TEHP DEG c
721
sir
327
127
FIGURE 8
GAS .TEHP~RfHUffE rRDFILE Al B~D SURFACE
..
;
I
.... ( - -·
~
-~I c::r-" m
I f I
J
, ',I
~I
I !J
0 ·AiSIDE
.
0 _ 2D' IOX.10 .. CJ 3Di24X54
--~·,·
1
•-
\
~ 'Cf.,
\ I GAS "!--..
:-.. 1 F~OV
'\I ~ "~
I
r-..._ r ... _~· ., - - - - - -- ._....--
·~ ,_ 2. - \\' - .......--.~
I
I •·. -
'·'··
1" I
2 3 ~ISTAHCE 11 HETEHS
25
,,.
I
I ·~~
\
I I L:I'
' 5·
8-rSIDE

FICURE 9
PRESSURE fRQFIL~ RT BE~ SURFACE
0
I
-10~r-r---t-~-t-,--,..--,-t-~~~~~~-t-~-M-~-+---c--.~-r-+----t
PRESSURE PA~CAL ·. ~ , ,e.~-o
. ! \ 13...-.e . .-2(10 Ltl
-300• ·~
1
...., ..... .._. .!'.::! ...,-e~t . p --f!J.....J
GAS 0 2D 80X100
, [J. 3D 24X54 ,..,...._____,......,.._ ___ -.-1 FLDW--i----
2 3 DJ STAtfC.E" M~TE"S
,26
· l. ·
.. · /
5 8"""'.'.SIDE
~I
'I
I

I I I I I I
• I I
• I
• I
• • I I
•
FICURE 10a
COS TEMPERATURE COHTOURS - VIHDROX II
TEMP DEi; C
Q
'i'lii'J!i 79 i:!ub 1~7
23~
31"' 393 "'12 55Q 629 107 786 fil61& 9113
=W»' 1022 ::~:~j;l: 11 0 0
FIGURE 10b
780 c 350 c
550 c
2D HODEL
CRS TEHPERRTURE·coHTOURS - WIHDBOX ~
28
TEMP DEG C 0 79 157 236 3111 393 1172 550 6~9
·101 786
''" 91J3 1022 1100
y
Lx
I I I f •. I

II I I I
I I
I I I
• • • • •
FIGURE 11
FURHACE DHYIHG ZOHE - 6 WIHDBOXES GAS TEMPERATURE AT FUHHACE WALLS
29
+-BED SURFACE
DEG C
0 83 173 262 352 IJIJ1 5.31 620 11.0
800 .889 978 106'8

1127
927
727 TEMP DEG c
527·
327
127
- - - -~ - ~ -Jr , Ir. -
~1 WBOX....
0 FEED
f ICURE 12
CAS TEMPERATURE PROFILE AT BED SURFACE RLOHG CEHTER OF CRATE
I T
o CASE 0 DCASE 1 <>CASE 2 +CASE 3 ~"'; i--i--- .•
~~ ' - ,,._
l ~ '.)~ cf-7~
-.I /'1'""· :}'-
.. ,.r'. .. P Jl r;f.
- • . ..L.--'.::::;::~--~· --~ ~ -
~ ~1..J ~'"-II
....
I I 5 10
DISTRHCE, METERS
30
• l
J I ~
-±":!:'"~ .... ~ ------er-~ -~ ~--
F
15 PREHEAT
• 'I· I
• vi' t
' I I I [I
ii ~-
ll I

II
• • • • • • • • • • • • • • • I I
--FIGURE 13a
TEMP DEG C 0 79 157 236 3111 393 117.2 550 62? 707 786 8611 ·.9113
:;~1\liii. ~ ~~ ~ x
i--------------i y~ CASE 0 - ORIGIHRL HACHIHE COHFICURATIOH
CAS TEMPERATURE COHTOURS - BED SURFACE
31
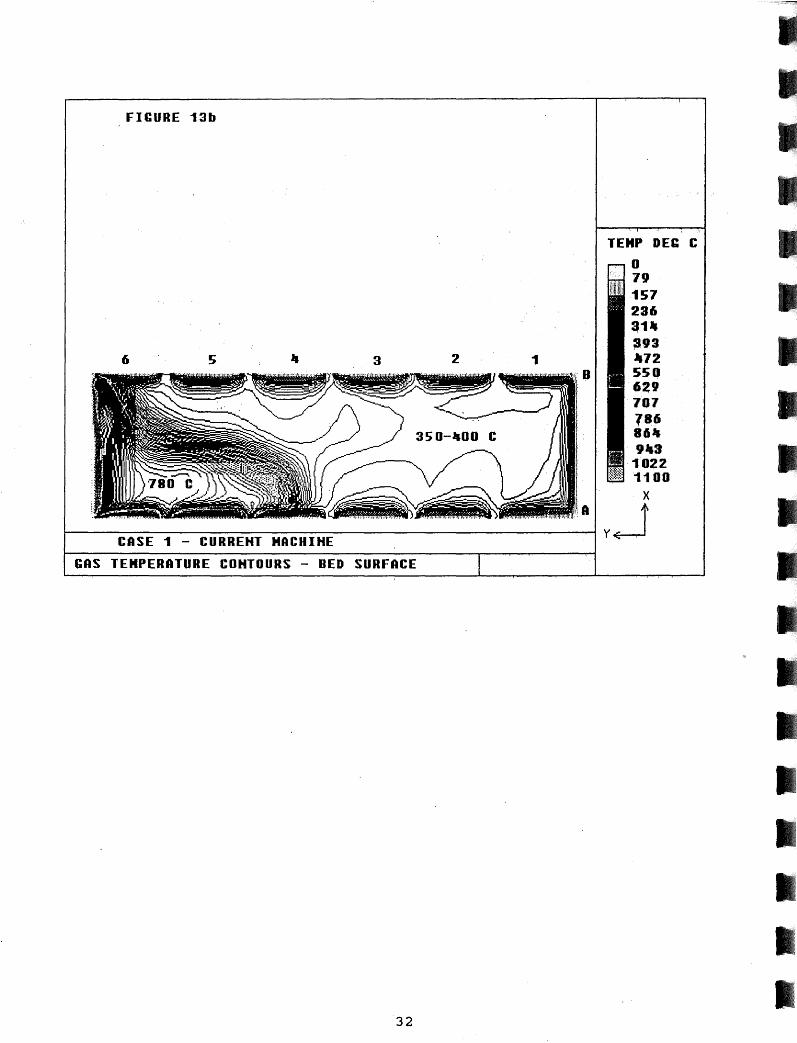
FIGURE 13b
6 5 "' 3 2 1 ..
35 0-.IJOO
A
CASE 1 - CURREHT MACHI HE
GAS TEMPERATURE COHTOURS - BED SURFACE
32
TEMP DEG C 0 79 157 236 ~111 ;193 .\72 551J ,,, 707 1'86 ., ..
. 9113 1022 1100
x
y~
•
• • • • I
• • • • • I

FIGURE 13c
TEMP DEG C 0 79 157 236 3111 393
6 1 1172 550 :r ~:~
I !~~ I: 1022 I 1:00
~~~~~~---~~~~~~~~~~~~·1._ ..... 1.,_ .. ,"1'_"'~ ... l,_ .... )-iA y~ CASE 2 - OUTLET RELOCATIOH
GAS TEMPERATURE COHTOURS - BED SURFACE
33

FIGURE 13d
6 5
TEHP DEG C 0 79 157 236 3111 393 1172 550 629 707 786 8611 9 ... 3
.;.-.;;:: 1 02 2 @*~ 1100
x
r--~~~~~~~~~~~~~~~~~~~~~~~~~A y~ CASE 3 - IHLET/OUTLET RELOCATIOH
GAS TEHPERATURE COHTOURS - BED SURFACE
34
• • : ~
---91
• • II
• • • I

FIGURE 14 RELATIVE GA~/squos FLOW
~J.- -1-,
2
1.8
0 1.6
r-<( 1.4 a: Cf)
1.2 Cf) <( ~
1 Cf) 0 _J 0.8 0 Cf) -.... 0.6 Cf) <( (.!J
0.4
0.2
0 CASEO CASE 1 CASE2 CASE 3
I~ PREHEAT 1A .. PREHEAT 18 ~RECOUP
35

1127
o CASE 0
927 o CASE 1
TEMP
FIGURE 15
CRS TEMPERATURE PROFILES RT BED SURFACE
(POT-CRATE TEST CYCLES)
PGF CYCLE C
DEC C 727r-~~~-+-~~~--+~~~~~~->r---"1--1-~~~~-1-~:..--.m--1
527
327
0 5 10 15
FEED DISTAHCE, HETERS PREHEAT
36
ll
• • • I
• II II
• • I I I
I II I
•
(.!J z z <( ::::? w a: + + w LL r-0 r-LL 0 cfi.
FIGURE 16
MAGNETITE OXIDATION END OF PREHEAT ZONE
40
35
30
ORIGINAL-A · PGF FIRING CYCLE C
CURRENT-A A
CURRENT-B · B
• • • ,
I• TOP-BED .. CENT-BED ~ BOT-BED
37

(,/) (!) ~
:C
55
50
~ 40 z w a: I-(/) 35
30
FIGURE 17
COMPRESSION STRENGTH END OF PREHEAT ZONE
ORIGINAL-A PGF FIRING CYCLE C
CURRENT-A A
CURRENT-8 B
.---, ~--TO-P--8-ED--.. -C-E-NT-E-R--BE-D-~--BO_TT_O_M ___ BE-D--.
38
.! I 11 1 •. ,' \ -~
ii 11 :1, I '·
• • • • • •

FIGURE 18
MINI-TUMBLE STRENGTH END OF P_REHEAT ZONE
60
w 50 N (J)
z 0 40 ..._: ~ I- 30 z w () a: w 20 a..
10
ORIGINAL-A PGF FIRING CYCLE C
GURRENT-A A
CURRENT-8 B
I• +6.3mm .. -6.3mm +28MESH ~ -28MESH
39

• • • I I r--i----------..---.,...__...,.-'-""---'-------------.---,-..--.--..--..--
~ ~
I 1-(!J z UJ a: 1-(f)
FIGURE 19
FIRED PELLET COMPRESSION STRENGTH
240
230
220
210
200
190
180
170
ORIGINAL-A PGF FIRING CYCLE C
CURRENT-A A
CURRENT-B B
IB TOP-BED .. CENTER-BED ~ BOTIOM-BED
40
• •

I I I
FIGURE 20a
780 c 350 c
550 c
2D MODEL WITHOUT BAFFLE PLATES GAS TEMPERATURE CONTOURS - UIHDBOX -
41
TEMP DEG C 0 79 157
.236 3111 393 1172 550 629 707 786 86'1 9-3
1022 1100
'(
Lx

FICURE 20b
780 c
550 c
2D HODEL WITH BAFFLE PLATES GA$ TEHPERATUHE COHTOUHS -· WIHDHOX -
42
TEHP PEG C 0 79 157 236 3111 393 1172 550 629 707 786 86 .. 91J3
1022 1~0CJ
Lx
• I .
•~.1 I
• • • • • • • • • • • • • • •
I II I I I I
FIGURE 21
PREHEAT END i-'-- 3.0 M ±0.15~
WINDBOX6 I WINDBOX5 I WINDBOX4 I WINDBOX3
I -I F c I
• I F
5.5M
l ~ ,, u
HIGH TEMP RECOUP SIDE (INLETS IN WB 5 & 6)
FURNACE THERMOCOUPLE SAMPLING LOCATIONS
43
FEED END
I WINDBOX2 I WINDBOX 1
11
J_
x
y~ I


I I I I I I I I I
• • • • • • ' • • f