- a nutraceutical ( substance with associated heath benefits ) - an antioxidant from .
16
Characterization of Coenzyme Q10- loaded Ethyl Cellulose Nanoparticles using HPLC, Dynamic Light Scattering, Electron Microscopy and DSC
-
Upload
marcus-armstrong -
Category
Documents
-
view
213 -
download
0
Transcript of - a nutraceutical ( substance with associated heath benefits ) - an antioxidant from .

Characterization of Coenzyme Q10-loaded Ethyl Cellulose Nanoparticles
using HPLC, Dynamic Light Scattering,
Electron Microscopy and DSC
- a nutraceutical
(substance with associated heath
benefits)- an antioxidant
Coenzyme Q10
from www.sigmaaldrich.com

- a biomaterial used for microencapsulation- derived from cellulose and ethanol in the
presence of dehydrating agents OR alkali cellulose and ethyl chloride
Ethyl cellulose
from www.sigmaaldrich.com

CoQ10 tends to bunch together, making it hard to absorb in the intestine.
Nanoencapsulation- separates individual
molecules w/o altering its function
- Increases bioavailability in the intestine
Nanoencapsulation of coQ10

To determine physical properties of coenzyme Q10-loaded ethyl cellulose
nanoparticles: Particle size % drug loading UV stability thermal stability
Objective

Presupposition from Literature:
Nanoparticles of ethyl cellulose can be prepared by solvent-evaporation
Langmuir, 2003, 19(22), 9504-9510.

SEM images of EC microspheres
Presupposition from Literature:
Ethyl cellulose (EC) is used as a biomaterial
media for encapsulation
For microencapsulation of aspirin, for drug delivery application [J. of Microencapsulation, 2001,18(2), 223-236]
For controlled release of a pesticide, norfluazon [Pest Management Science, 2001, 57: 688-694]
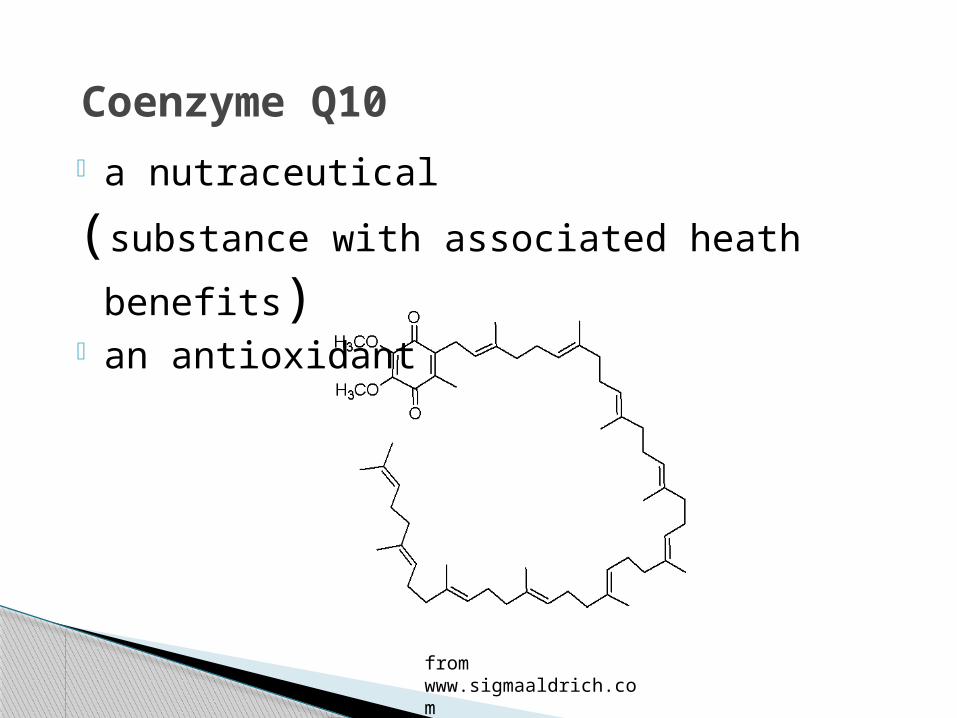
Presupposition from Literature:
Coenzyme Q10 - loaded PMMA
were characterized usingTEM, Dynamic light scattering,DSC, HPLC, NMRto determine
Particle size Thermal stability % drug loading
Colloids and Surfaces A : Physicochemical and Engineering Aspects, 2002, 210 (1): 95-104.
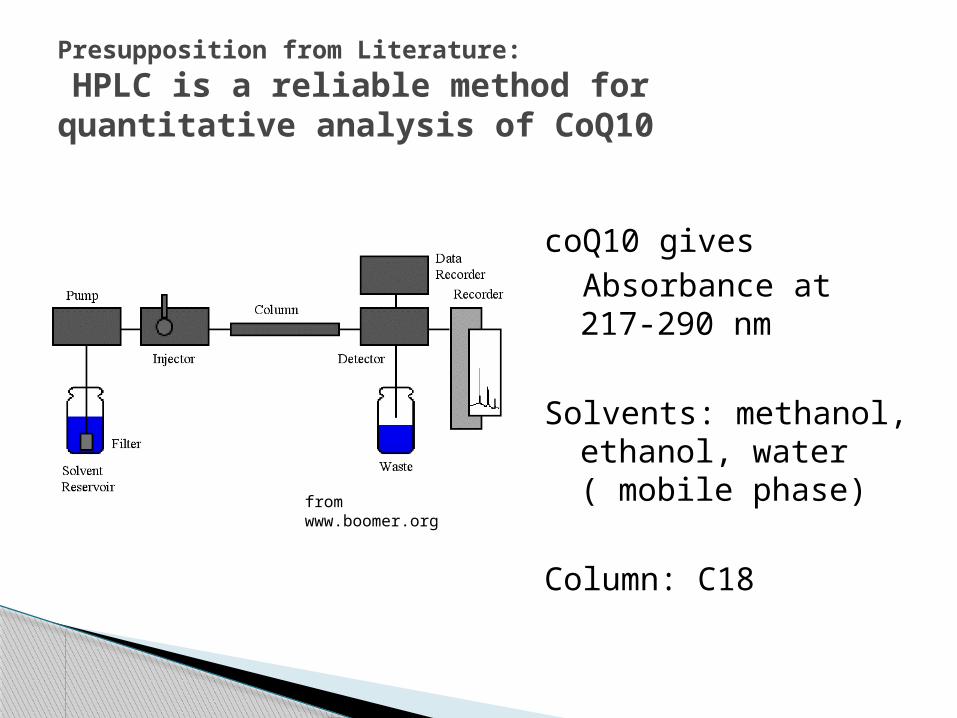
Presupposition from Literature:
HPLC is a reliable method for quantitative analysis of CoQ10
coQ10 gives
Absorbance at 217-290 nm
Solvents: methanol, ethanol, water ( mobile phase)
Column: C18 from www.boomer.org
Prepare nanoparticles by solvent-evaporation method by Desgouilles [Langmuir, 2003,19(22), 9504-9510]
Vary the mass ratio of coQ10 to EC (20, 40, 50, 60, 80%)
Characterization of nanoparticles
Methods
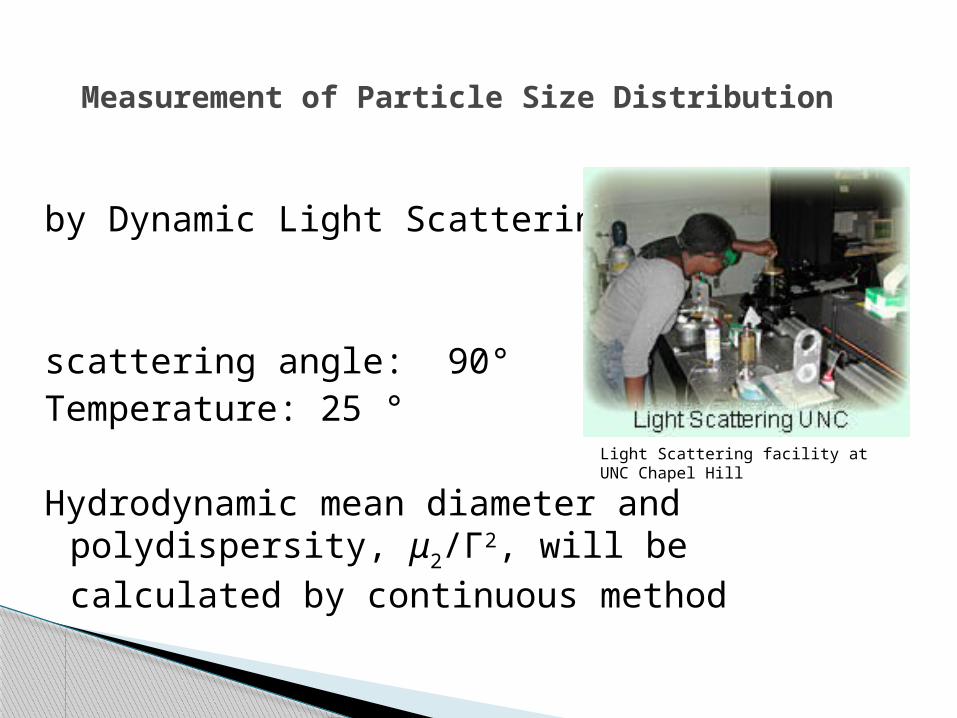
by Dynamic Light Scattering
scattering angle: 90° Temperature: 25 °
Hydrodynamic mean diameter and polydispersity, μ2/Γ
2, will be calculated by continuous method
Measurement of Particle Size Distribution
Light Scattering facility at UNC Chapel Hill

Measurement of Particle Size Distribution
by Scanning Transmission Electron Microscopy
Hitachi HD 2000 Scanning Transmission Electron Microscope Specifications( at NCSU Engineering Graduate Research Center)
Capabilities Brightfield,Darkfield, Difraction z-contrast
Accelerating Voltage
200 kV
Magnification 2,000,000 X
SEI Resolution 2.4 Angstroms
from NCSU Analytical Instrumentation Facility website

Sample preparation:-Freeze dry the particles-Extract coQ10 with methylene chloride-Dissolve further in ethanol
Drug-loading efficiency determination of coQ10 by HPLC
concentration from calibration curve, g/mL x mL of injected sample x dilution factor% drug loading = 100
mass of freeze-dried sample, gx
Quantitation of coQ10:
-Prepare calibration solutions of coQ10 in ethanol
-Plot peak areas vs concentrations of calibration solutions
-Compute for the amount of coQ10 in sample from peak area
From www.waters.com
External calibration curve
y = 747,965x - 13,407
R2 = 0.998
-
200,000.00
400,000.00
600,000.00
800,000.00
1,000,000.00
0.00 0.50 1.00 1.50
Concentration, g/L
Pea
k A
rea,
mic
roV
sec
Sample calibration curve
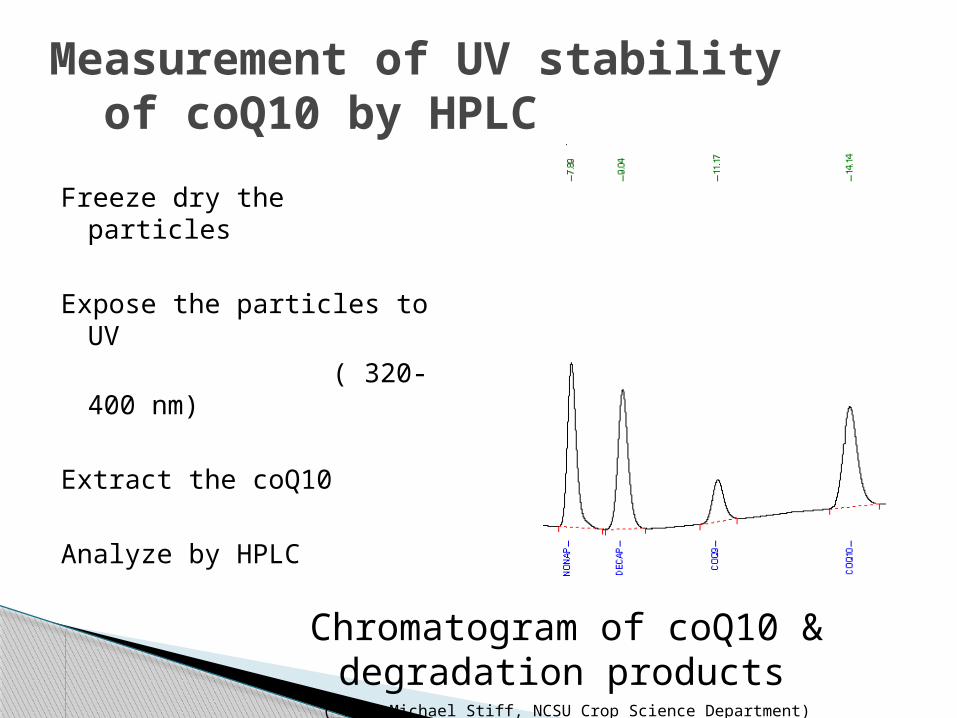
Freeze dry the particles
Expose the particles to UV ( 320-400 nm)
Extract the coQ10
Analyze by HPLC
Measurement of UV stability of coQ10 by HPLC
Chromatogram of coQ10 & degradation products
( from Michael Stiff, NCSU Crop Science Department)

Measurement of thermal stability by DSC
Compare Tg and DHfusion
for coQ10, EC and coQ10-EC particles
TA2010 Thermal Analyzer(TA Instruments, New Castle, DE)
Sample preparation: Freeze drying
Thermal scan:
Rate: 10° C per min
Range: -10 to 160° C
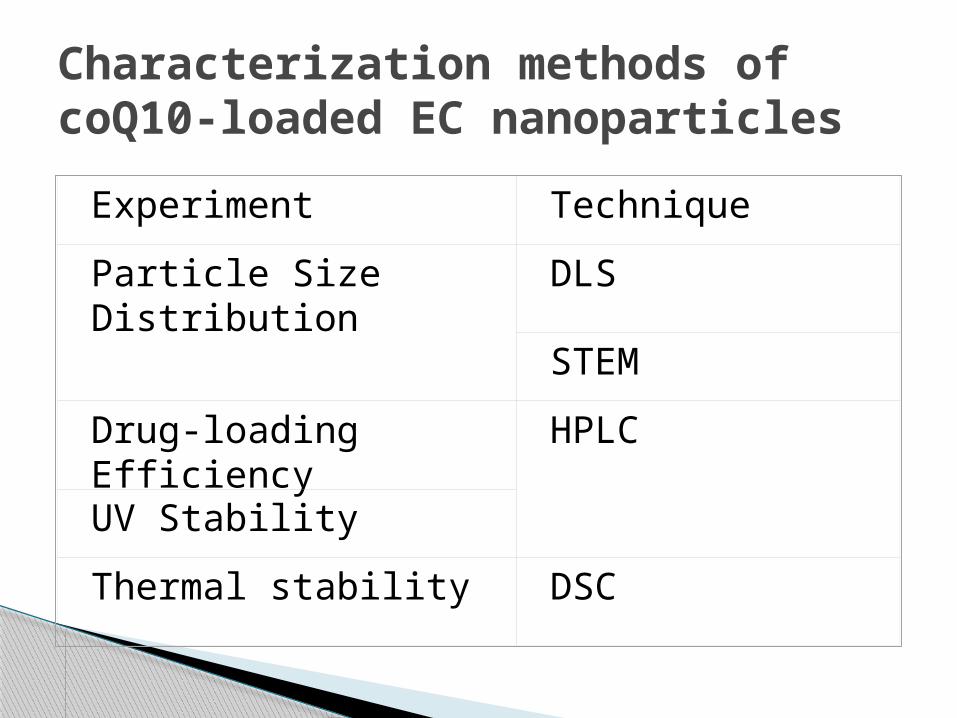
Characterization methods of coQ10-loaded EC nanoparticles
Experiment Technique
Particle Size Distribution DLS STEM
Drug-loading Efficiency HPLC
UV Stability
Thermal stability DSC