-A Leading Multi Metal Distributor - Klöckner & Co SE · -A Leading Multi Metal Distributor -...
32
Klckner & Co - A Leading Multi Metal Distributor - April 2007 Gisbert Rühl CFO Dr. Thomas Ludwig CEO
Transcript of -A Leading Multi Metal Distributor - Klöckner & Co SE · -A Leading Multi Metal Distributor -...

Klöckner & Co- A Leading Multi Metal Distributor -
April 2007
Gisbert Rühl
CFO
Dr. Thomas Ludwig
CEO
2
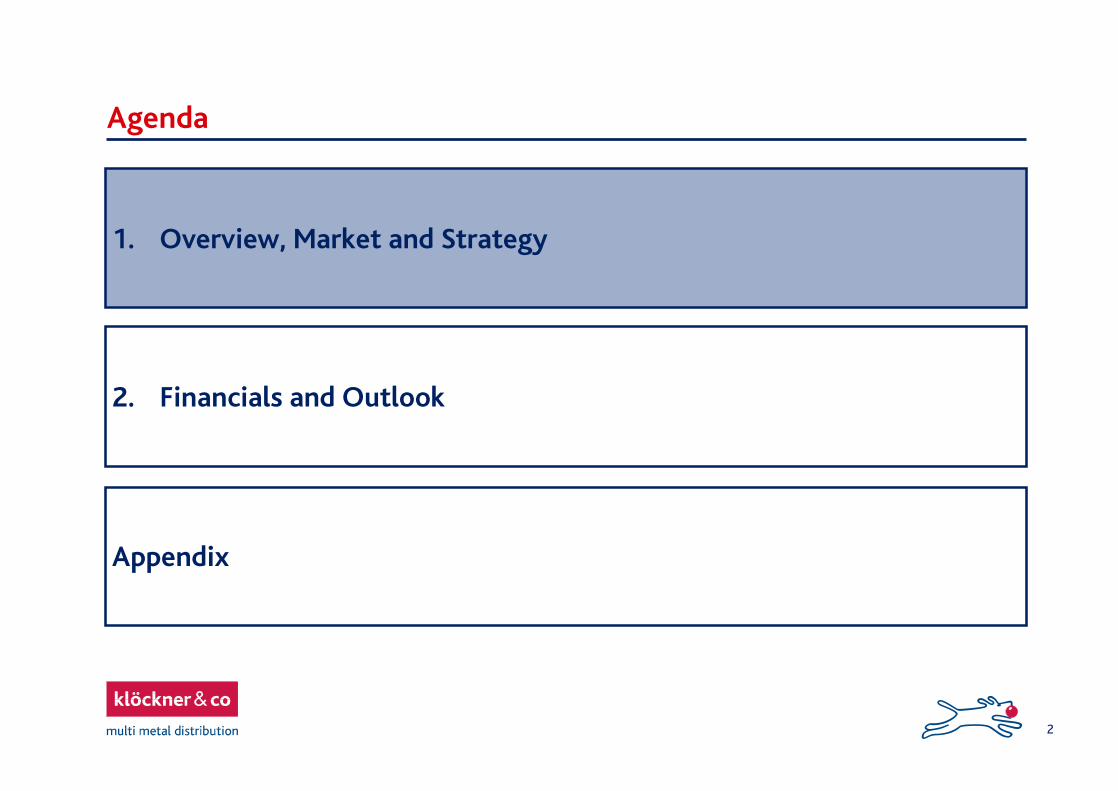
Agenda
1. Overview, Market and Strategy
Appendix
2. Financials and Outlook
3
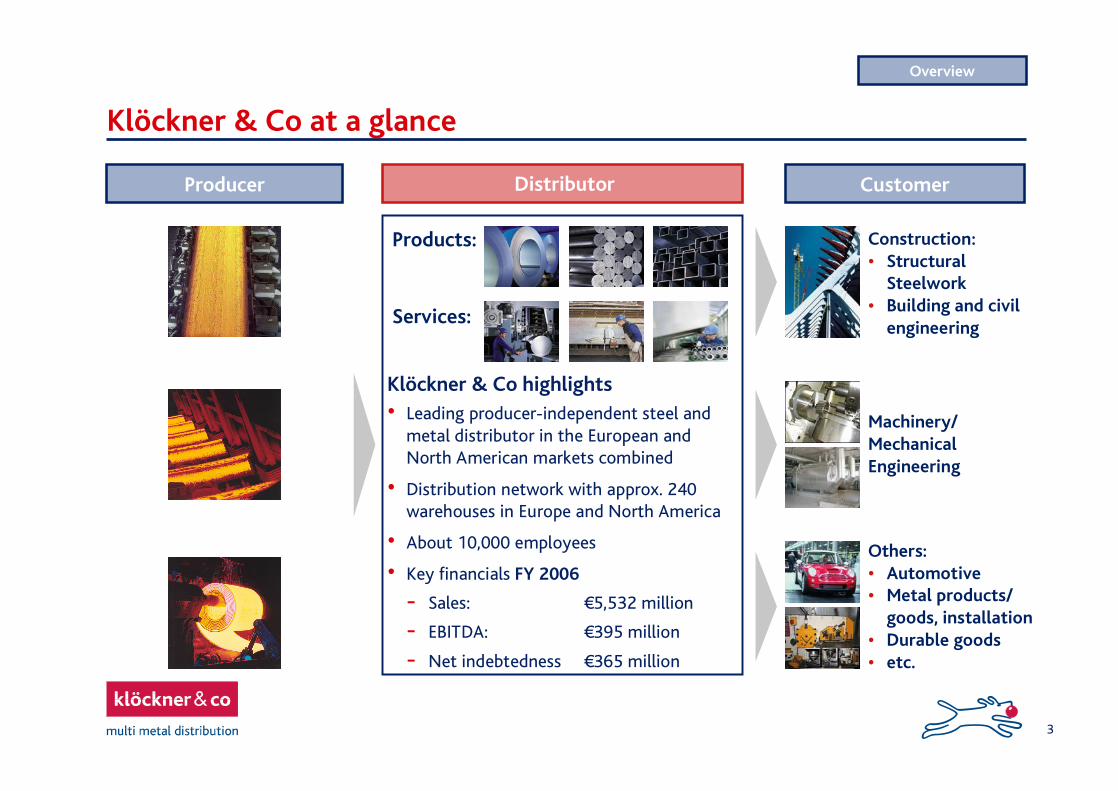
Klöckner & Co at a glance
Klöckner & Co highlights� Leading producer-independent steel and
metal distributor in the European and North American markets combined
� Distribution network with approx. 240 warehouses in Europe and North America
� About 10,000 employees
� Key financials FY 2006
- Sales: �5,532 million
- EBITDA: �395 million
- Net indebtedness �365 million
DistributorProducer Customer
Products:
Services:
Construction:� Structural
Steelwork� Building and civil
engineering
Machinery/MechanicalEngineering
Others:� Automotive� Metal products/
goods, installation� Durable goods� etc.
Overview
4
Distributor in the sweet spot
Suppliers SourcingProducts and services
Logistics/Distribution
Customers
� Global Sourcing in competitive sizes
� Strategic partnerships
� Frame contracts
� Leverage one supplier against the other
� No speculative trading
� One-stop-shop with wide product range of high-quality products
� Value added processing services
� Quality assurance
� Efficient inventory management
� Local presence
� Tailor-made logistics including on-time delivery within 24 hours
� More than 200,000 customers
� No customer with more than 1% of sales
� Average order size of �2,000
� Wide range of industries and markets
� Service more important than price
� Purchase volume p.a. of 6 million tones
� Diversified set of worldwide ca. 70 suppliers
� Examples:
Klöckner & Co�s value chain
Overview
Global suppliers Local customers

5
Global reach with broad product and customer diversification
Germany/Austria 23%
France/Belgium 21%
Switzerland 15%
Spain 10%
UK 9%
Nether-lands 6%
Eastern Europe 1%
USA 10%Canada 5%
Steel-flat Products28%
Steel-long Products 31%Tubes 9%
Special Steel/Quality Steel 10%
Aluminum 8%
Other Products 14%
Construc-tion 40%
Machinery/Manufacturing 20%
Auto-motive 5%
Metal Products20%
Other 15%
USA
CAD
USA
CAN
G 25 LocationsF 76 Locations CH 31 LocationsE 48 LocationsUK 24 LocationsIE 1 LocationNL 7 LocationsEastern Europe 4 LocationsCAN 5 LocationsUSA 17 Locations Total 238 Locations
Locations (Dec. 31, 2006)
Country headquarters
Sales split by markets (2006)
Sales split by product (2006)
Sales split by industry (2006)
IE
Overview

6
Strong position in Europe; significantly improved position in NA after acquisition of Primary
Europe (2005) North America (2005)
Arcelor Mittal AM3S 12%
(Sales Distribution �3.2m = 5%)
ThyssenKrupp 8%
Corus 6.5%
Klöckner & Co 5.9%
Other Mill-Tied Distributors ~15-
25%
Other Independents
~45-55%
Klöckner & Co 6%
Corus 4%
Source: EuroMetal, Company reports, Klöckner & Co
Other72.5%
Ryerson5.0% Reliance Steel
4.4% Samuel, Son & Co.2.3%
ThyssenKrupp Materials NA
2.0%
Russel Metals1.9%
Worthington Steel1.6%
Metals USA1.3%
Carpenter Technology1.1%
PNA Group1.1%
McJunkin1.2%
O'Neal Steel1.4%
MacSteelService Centers
1.5%
Olympic Steel0.8%
AM Castle0.7%
Klöckner & Co 1
1.0%
1) Operates as Namasco in North AmericaSource: Purchasing Magazine (May 2006)
Market
Structure: 67% through distribution, service centersSize in value: ~�65�80bnCompanies: ~3,000 few mill-tied, most independent
Structure: 50-60% through distribution, service centersSize in value: ~�68-92bnCompanies: ~1,300 only independent distributors
Only independent in top tier

7
Broad coverage of the US marketand much stronger platform for further bolt-on acquisitions
Geographical Scope
Primary outlet
Primary Sales office
Oakland
Houston
Missouri
Chicago
Tampa
CharlotteArizona
Arkansas
Iowa
Alabama Georgia
South Carolina
North Carolina
Indiana
Maryland
Maine
Connecticut
Florida
Louisiana
Illinois
Texas
CaliforniaDubuque
Louisville
Indianapolis
AtlantaB´ham
CharlestonDallas
AustinNew Orleans
Jacksonville
Orlando
Pompano
Phoenix
Santa Fee Springs
Tulare
West Memphis
Savannah
Portland
Middletown
New Castle
Namasco Gen. line
Namasco Processing
� Sales: 2006: $467 million
� Leading market position in plate distribution
� Wide range of offered services
� Broad geographic coverage with seven locations
Key Facts
Primary Steel

8
Investment highlights
� The plate market is attractive and has a good perspective� Pricing has been relatively stable and less volatile than other segments (also supported by high supply
side concentration)� Low dependency on individual market segments� Good growth perspective for main segments heavy equipment, oil & gas, transportation and railcar,
shipbuilding, etc.
� Primary is a well respected and well managed major player in plate distribution segment� Good quality based market reputation� Decent profitability and relatively good operational performance also supported by PE environment� Strong management team with good acquisition track record
� A combined Primary and Namasco company would create a leading position in plate distribution� Estimated total market share of 10% in plate segment� Broad geographic coverage� Wide range of offered services
� Complementary sales coverage combined with strong product overlap offers synergy potential� Namasco�s market coverage hugely enlarged� More than doubled purchasing power helps to counterweight the strong supplier consolidation (top 3
account for more than 90% of market)� Additional (typical) synergies in admin, finance, IT, etc.
Growth in an attractive
market segment
Acquire respected and well managed
business
Synergies
Leading position in plate segment
Primary Steel

9
High added value, low customer concentrationwith broad industry split and complementary product mix
Product Mix (2006, $ mio.) (1)
0
50
100
150
200
250
StripMill
AsRolled
FR Pipe Merch.Bar
Beams /struc.
Tube others
Primary Namasco
Customer concentration
Customer 1 Shipbuilding 4,2%Customer 2 Power Generation 3,1%Customer 3 Oil & Gas 1,9%Customer 4 Transp. Equipment 2,1%Customer 5 Service Center 1,9%Customer 6 Transp. Equipment 1,8%Customer 7 Oil & Gas 1,4%Customer 8 Oil & Gas 1,4%Customer 9 Ind. Equipment 1,3%Customer 10 Service Center 1,0%
Segments Served
Service Centres 33,5%
Metal builders 2,9%Construction 2,6%
Heavy in. Equip. 29,3%
Transp. Equipment 4,5%Ship building 4,8%
Oil & Gas 16,2%
Power Generation 6,2%
Sales split by type of value added
Cut to length 45%
Stock sales 34%
Shearing 1%Slitting 3%
Thermal cutting 13%
Outside Processing 4%
Primary Steel

10
Steel industry trends
Industry trends supporting Klöckner�s strategy
� Globalization and consolidation resulted in large costs savings, higher and more flexible capacity utilization, much better supply discipline and higher pricing power, which will prevent the margin destroying behaviour from the past
� Capacity and export containment in China under the drive of central government
� Higher material costs especially of iron ore and decreasingly relevant fixed costs have flattened the global steel cost curve in favour of developed-market steel producers
� Stable global demand growth leads to far quicker destocking and eroded global overcapacity
� On-going consolidation favouring large scale distributors
� Higher prices with much shorter downturns support more stable earnings and cash flows for distributors
Strategy

11
Profitable growth
Strategy
Profitable growth through value-added distribution and services within multi metals to companies in Europe and North America
Grow more thanthe market
Continuous businessoptimization
1 Acquisitions driving market consolidation
2 Organic growth and expansion into new markets
3 STAR Program:- Purchasing- Distribution network- Inventory management

12
Acquisitions driving market consolidation1
Next steps
Further acquisitions in core markets at attractive valuations:
� Leverage existing structure with 10 to 12 smaller (local) bolt on acquisitions in 2007
� Medium and large scale acquisitions when appropriate
� Include attractive industries, e.g. oil and gas
Focus on targets in key markets at attractive valuations
Strategy
BenefitsSignificant synergy opportunities
� Streamlining operations, processes and sales force
� Integration of STAR
Economies of scale
� Stronger purchasing power
Strategy
Status Quo
� Attractive valuations� Proven acquisition integration capability
04/2007: Teuling�14 million sales; 16 employees01/2007: Tournier�35 million sales; 41 employees10/2006: Action Steel �55 million sales; 110 employees10/2006: Gauss �10 million sales; 40 employees07/2006: Aesga�18 million sales; 40 employees02/2006: Targe�25 million sales; 50 employees10/2005: Alu Menziken Service�33 million sales; 70 employees07/2005: Reynolds�108 million sales; 150 employees
04/2007: Primary Steel�360 million sales; 389 employees

13
Organic growth and expansion into new markets2
Status Quo
� Strong growth in core markets above GDP partly as a result of the outstanding development of the construction and machinery industries and steel prices
� Improved performance mainly in Germany and France due to organizational changes
� Eastern European facilities established in Poland, Czech Republic, Romania and Baltic States
� Extending activities of our Chinese representative office
Next steps
Expansion of strong market positions in core markets:
� �STAR-Program� supporting organic growth
� Selective extension of product range
� Increase value added services through investments in new processing capacity
� Extension of customer base
� Opening of new branches in Eastern Europe (Romania, Poland, Czech Republic and Baltic States)
Leveraging existing distribution network
Strategy
Benefits Sustainable profitable growth
Strategy

14
Purchasing � Status Quo
Improved performance as a result of restructured distribution network:
� Close-down of warehouses in Northern Germany (3 0)
� Reduction number of warehouses in the Lyon area in France (8 4)
� Improvement warehouse structure in the Iowa-region in US (3 1)
� Restructuring of service center business in Switzerland (3 1)
3
Next steps
STAR: Status quo 2006 and next steps
Distribution � Status Quo Next steps
� Continuous improvement of distribution network throughout the Group with support of the optimization-tool �Prodacapo� (activity based costing)
� Ongoing roll-out throughout the European countries
� Finalize implementation of SAP throughout the European organization (France, Switzerland) and interface SAP with Prodacapo
� Implement unified article code
� Finalize central purchasing on country level, especially in Germany
� Establish European purchasing (STAR Phase II) and increase sourcing from world-class suppliers with structural cost advantages
� Frame contracts with main suppliers
� Global sourcing for third party countries
� Implementation of new organization in Germany (January 1, 2007)
Strategy

15
3 STAR: Phase I finalized in 2008, further potential in Phase II
Phase I (2005 - 2008)
Overall targets:
� Central purchasing on country level, especially in Germany
� Improvement of distribution network
� Improvement of inventory management
2006: ~ �20 million
2007: ~ �40 million
2008: ~ �20 million
~ �80 million
Phase II (2008 onwards)
Phase I upside potential
Overall targets:
� European Sourcing
� Ongoing improvement of distribution network
Strategy

16
Agenda
1. Overview, Market and Strategy
Appendix
2. Financials and Outlook

17
Strong quarterly development in 2006 compared to 2005
48494654 70108104
74
05 Q1 06 05 Q2 06 05 Q3 06 05 Q4 06
EBITDA¹
(�m)
Net debt deleveraging2
(�m)
Sales(�m)
670482 435
365
Q1 06 Q2 06 Q3 06 Q4 06
1,2171,1911,348
1,2071.3981,3941,4181,323
05 Q1 06 05 Q2 06 05 Q3 06 05 Q4 06
Fast and constants deleveraging
Sales increase driven by volume and price increases
1) Adjusted by one-off effects (asset disposals): Q1 2006: about 5M� and Q3 2006: about 35M�2) Q1 2006 incl. shareholder loan
Strong profitability growth in Q2 and Q3 also driven by stock profits
Financials
18
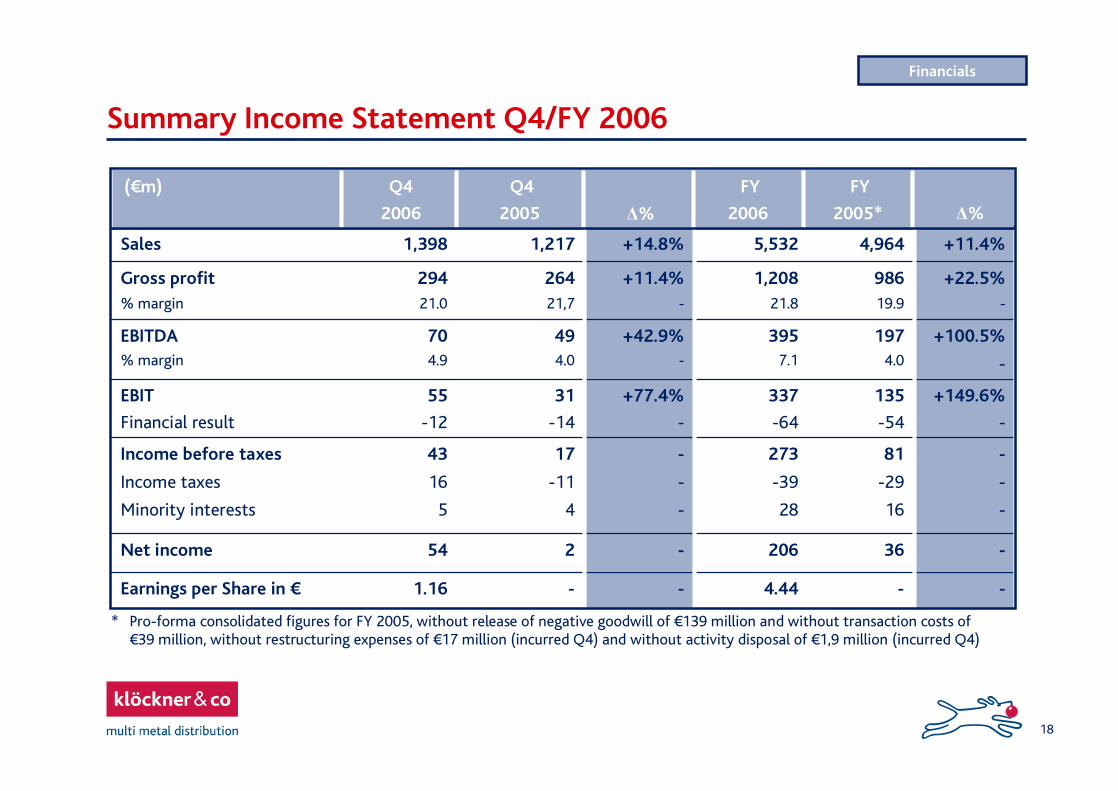
Summary Income Statement Q4/FY 2006
--4.44--1.16Earnings per Share in �
-36206-254Net income
-
-
-
81
-29
16
273
-39
28
-
-
-
17
-11
4
43
16
5
Income before taxes
Income taxes
Minority interests
+149.6%
-
135
-54
337
-64
+77.4%
-
31
-14
55
-12
EBIT
Financial result
+100.5%
-
1974.0
3957.1
+42.9%-
494.0
704.9
EBITDA% margin
+22.5%-
98619.9
1,20821.8
+11.4%-
26421,7
29421.0
Gross profit% margin
+11.4%4,9645,532+14.8% 1,2171,398Sales
Ä%
FY
2005*
FY
2006Ä%
Q4
2005
Q4
2006
(�m)
* Pro-forma consolidated figures for FY 2005, without release of negative goodwill of �139 million and without transaction costs of �39 million, without restructuring expenses of �17 million (incurred Q4) and without activity disposal of �1,9 million (incurred Q4)
Financials

19
Segment Performance FY 2006
3955,532Total
-50-HQ/Consol.
79862North America
3664,670Europe
EBITDASales(�m)
� Both segments show excellent performance
� Sales in Europe including �164 million from Reynolds (F), �65 million from Alu MenzikenMetall Service (CH), �8 million from Aesga (E), �2 million from Gauss (CH), �20 million from Targe (F) and �8 million from Klöckner Romania
� Sales in North America including �15 million from Action Steel
Comments
Financials

20
Balance Sheet FY 2006
957
719
1, 135
365
Net Working Capital
Net financial debt
2,2562,552Total equity and liabilities
2,256
323
921
589
1,012
536
-
2,552
799
744
416
1,009
639
-
Total assets
Equity
Total long-term liabilities
- thereof financial liabilities
Total short-term liabilities
- thereof trade payables
Other liabilities
595
694
800
80
87
579
841
933
130
69
Long-term assets
Inventories
Trade receivables
Cash & Cash equivalents
Other assets
Dec. 31
2005
Dec. 31
2006
(�m)Comments
Financial debt as of December 31, 2006:
� Outstanding bonds: �170 million
� ABS: �156 million
� Bilateral credit facilities: �147 million
� Net financial debt reduced from �719 to �365million
Equity:
� Conversion shareholder loan: �165 million
� IPO: capital increase �98 million
� Strong results
� Equity ratio increased from 14% to 31%
Net Working Capital:
� Increase in line with the additional sales
Financials

21
365 M�
558 M�
50%
173%
0
200
400
600
FY 2005 FY 2006
�m
/ %
Net debt Gearing
Constant deleveraging
� Strong cash flow leads to constant deleveraging and opens up room for acquisitions
� Bond redeemed from �260 million to �170 million
� Standard & Poor�s increased rating to �BB� with stable outlook
Comments
Financials
Leverage* 2.8 0.9
Net debt FY 2005 excluding shareholder loans �161 million* Net indebtedness/EBITDA LTM
Net debt and Gearing

22
Statement of Cash Flow
FY
2005*
FY
2006
(�m)
* Pro-forma consolidated figures for the FY 2005
� Strong business development reflected in positive CF deriving from operational activities and increased NWC requirements
� Investing CF FY 2006 mainly includes:
- cash inflow from the sale of non core activity AVZ and real estate disposals
- cash outflows mainly due to acquisitions of Targe, Aesga, Action Steel and Gauss
Comments
38
-119
64
-33
-12
-62
15
98
-
-136
-46
-6
-90
52
Proceeds from capital increase
Net impact of change of financing
Changes in financial liabilities
Net interest payments
Dividends
Cash Flow from financing activities
Total Cash Flow
22
-66
-44
102
-92
10
Inflow from disposals of fixed assets/others
Outflow from investments in fixed assets
Cash Flow from investing activities
179
126
-184
121
354
-195
-27
132
From operational activities
Changes in net working capital
Others
Cash Flow from operating activities
Financials

23
Challenging financial targets throughout the cycle
Financials
Target Actual2006
Financial Targets
Underlying sales growth
Underlying EBITDA margin
Leverage (Net financial debt/EBITDA)
Gearing (Net financial debt/Equity)
> 10% p.a
> 6%
< 3.0x
< 150%
11%
7.1%
0.9x
50%

24
New holding facility increases scope for further acquisitions
Debt structure
ABS EuropeABS USA
Total
Syndicated LoanBilateral Credit Agreements
Total Senior Bank Facilities
High Yield Bond
Total Facilities
Current DebtStructure
Change inDebt Structure
New DebtStructure
38060
440
-480
480
170
1,090
+40-
+40
+450-100
+350
-
+390
42060
480
450380
830
170
1,480
(�m)

25
Outlook / Guidance 2007
Basic Assumptions for 2007
� Positive prospects for the steel industry
� Economic growth in relevant markets of about 1.8% -5% in 2007
� Stable and increasing demand especially in the construction and machinery industries
� Price development stable or better
� In H1 expected to rise
Outlook
Guidance
� At least10% top line growth driven by acquisitions and organic growth
� EBITDA at about 2006 level adjusted by one-offs � provided that the positive economic development continues
� Dividend continuity: 30% payout ratio after deduction of extraordinary income

26
Financial Calendar 2007 and Contact Details
Contact Details Investor Relations
Claudia Nickolaus, Head of IR
Phone: +49 (0) 203 307 2050Fax: +49 (0) 203 307 5025E-mail: [email protected]: www.kloeckner.de
Financial Calendar 2007
May 14: Q1 Interim Report
June 20: General Shareholders� Meeting
August 15: Q2 Interim Report
September 19: Analysts� and Investors� Meeting
November 14: Q3 Interim Report
Contact

27
Agenda
1. Overview, Market and Strategy
Appendix
2. Financials and Outlook

28
Table of contents
Appendix
� Quarterly/FY Results 2006
� IPO on 28 June 2006 followed by free float increase

29
Quarterly/FY Results 2006
* Pro-forma consolidated figures for FY 2005, without release of negative goodwill of �139 million and without transaction costs of �39 million, without restructuring expenses of �17 million (incurred Q4) and without activity disposal of �1,9 million (incurred Q4).
Appendix
Q4 Q3 Q2 Q1 FY FY 2006 2006 2006 2006 2006 2005*
Sales 1,398 1,394 1,418 1,323 5,532 4,964
Gross profit 294 313 316 285 1,208 986
% margin 21.0 22.5 22.3 21.5 21.8 19.9
EBITDA 70 143 104 79 395 197
% margin 4.9 10.3 7.3 6.0 7.1 4.0
EBIT 55 128 89 64 337 135
Financial result -12 -24 -14 -14 -64 -54
Income before taxes 43 104 75 50 273 81
Income taxes 16 -20 -21 -13 -39 -29
Minority interests 5 8 9 6 28 16
Net income 54 76 45 31 206 36
Earnings per Share in � 1.16 1.64 0.97 - 4.44 -
(�m)

30
IPO on 28 June 2006 followed by free float increase
IPO Highlights
Issue price: �16 per share
Offer Size: �264 million; of which Klöckner received �104 million gross proceeds from the capital increase
Placement: 16.5 million shares (in total 46.5 million shares); thereof:
� 6.5 million new shares from a capital increase
� 10 million from the selling shareholder Lindsay Goldberg & Bessemer (via Multi Metal Investment S.à.r.l.)
Current shareholder structure
January 2007 sell-down� LGB/Management 15.5%� Free float 84.5%
October 2006 sell-down� LGB/Management 45.0%� Free float 55.0%
Post-IPO� LGB/Management 65.0%� Free float 35.0%
� Mainly large European Institutional Investors� Increasing share of US Investors� Growing share of Retail Investors
Appendix
31
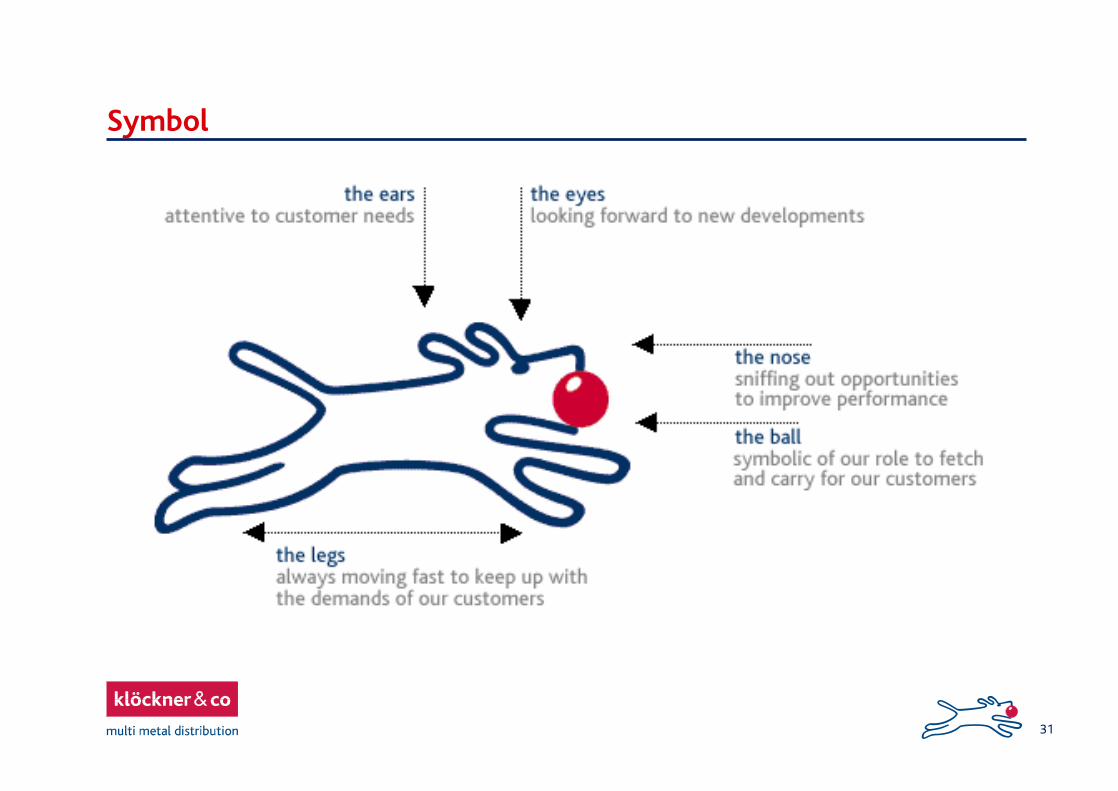
Symbol
32
This presentation contains forward-looking statements. These statements use words like "believes, "assumes," "expects" or similar formulations. Various known and unknown risks, uncertainties and other factors could lead to material differences between the actual future results, financial situation, development or performance of our company and those either expressed or implied by these statements. These factors include, among other things:
Downturns in the business cycle of the industries in which we compete; Increases in the prices of our raw materials, especially if we are unable to pass these costs along
to customers; Fluctuation in international currency exchange rates as well as changes in the general economic
climateand other factors identified in this presentation.In view of these uncertainties, we caution you not to place undue reliance on these forward-looking statements. We assume no liability whatsoever to update these forward-looking statements or to conform them to future events or developments.
Disclaimer