& 7KLV - rsc.org · UPS (HeI hv = 21.22 eV) and XPS (monochromatized AlK h = 1486.6 eV) spectra...
9
S1 Electronic Supplementary Information Effects of Water Vapor and Oxygen on Non-Fullerene Small Molecule Acceptors Chuanfei Wang,* a Shaofei Ni, b Slawomir Braun, a Mats Fahlman,* a Xianjie Liu a a Division of Surface Physics and Chemistry, IFM, Linköping University, SE-58183, Linköping, Sweden. b Institute of Chemical Research of Catalonia, Tarragona, 43007 Spain Email: [email protected], [email protected] Contents Experiment Methods ................................................................................................................2 Fig. S1. Chemical structure and frontier energy level distribution of o-IDTBR, p-ITIC and m- ITIC.............................................................................................................................................3 Table S1. Energy levels of o-IDTBR, p-ITIC and m-ITIC. .......................................................3 Fig. S2. Integer charge transfer (ICT) model. ............................................................................4 Fig. S3. Thermal annealing treatment of a) o-IDTBR, b) p-ITIC and c) m-ITIC. .....................5 Fig. S4. UPS spectra evolution under in situ oxygen exposure a) a) o-IDTBR, b) p-ITIC and c) m-ITIC. All the spectrums are aligned at high binding energy. .............................................5 Fig. S5. Effect of TCNQ on the oxygen exposure degradation..................................................5 Table S2. Comparison of energy level between pristine and oxygen attached molecules.........6 Fig. S6. Frontier molecular orbitals distribution of p-ITIC and O 2 p-ITIC. ...........................7 Fig. S7. The calculated molecular structures of o-IDTBR, p-ITIC and m-ITIC from top to bottom. ........................................................................................................................................8 Table S3. The calculated dihedral of o-IDTBR, p-ITIC and m-ITIC. .......................................8 Fig. S8. UV-light illumination on ITIC. .....................................................................................9 References ..................................................................................................................................9 Electronic Supplementary Material (ESI) for Journal of Materials Chemistry C. This journal is © The Royal Society of Chemistry 2019
Transcript of & 7KLV - rsc.org · UPS (HeI hv = 21.22 eV) and XPS (monochromatized AlK h = 1486.6 eV) spectra...

S1
Electronic Supplementary Information
Effects of Water Vapor and Oxygen on Non-Fullerene Small Molecule Acceptors
Chuanfei Wang,*a Shaofei Ni,b Slawomir Braun,a Mats Fahlman,*a Xianjie Liua
aDivision of Surface Physics and Chemistry, IFM, Linköping University, SE-58183,
Linköping, Sweden.
bInstitute of Chemical Research of Catalonia, Tarragona, 43007 Spain
Email: [email protected], [email protected]
ContentsExperiment Methods ................................................................................................................2Fig. S1. Chemical structure and frontier energy level distribution of o-IDTBR, p-ITIC and m-ITIC.............................................................................................................................................3Table S1. Energy levels of o-IDTBR, p-ITIC and m-ITIC. .......................................................3Fig. S2. Integer charge transfer (ICT) model. ............................................................................4Fig. S3. Thermal annealing treatment of a) o-IDTBR, b) p-ITIC and c) m-ITIC. .....................5Fig. S4. UPS spectra evolution under in situ oxygen exposure a) a) o-IDTBR, b) p-ITIC and c) m-ITIC. All the spectrums are aligned at high binding energy. .............................................5Fig. S5. Effect of TCNQ on the oxygen exposure degradation..................................................5Table S2. Comparison of energy level between pristine and oxygen attached molecules.........6Fig. S6. Frontier molecular orbitals distribution of p-ITIC and O2p-ITIC. ...........................7Fig. S7. The calculated molecular structures of o-IDTBR, p-ITIC and m-ITIC from top to bottom. ........................................................................................................................................8Table S3. The calculated dihedral of o-IDTBR, p-ITIC and m-ITIC. .......................................8Fig. S8. UV-light illumination on ITIC. .....................................................................................9References ..................................................................................................................................9
Electronic Supplementary Material (ESI) for Journal of Materials Chemistry C.This journal is © The Royal Society of Chemistry 2019
S2
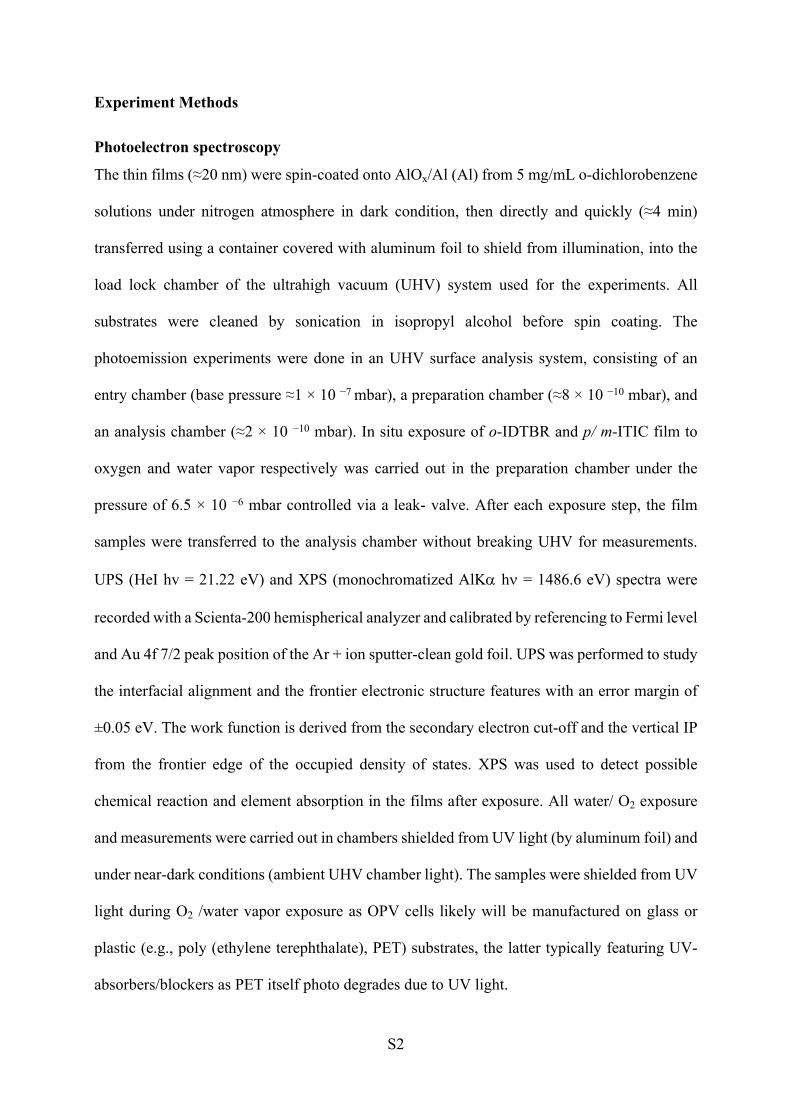
Experiment Methods
Photoelectron spectroscopy
The thin films (≈20 nm) were spin-coated onto AlOx/Al (Al) from 5 mg/mL o-dichlorobenzene
solutions under nitrogen atmosphere in dark condition, then directly and quickly (≈4 min)
transferred using a container covered with aluminum foil to shield from illumination, into the
load lock chamber of the ultrahigh vacuum (UHV) system used for the experiments. All
substrates were cleaned by sonication in isopropyl alcohol before spin coating. The
photoemission experiments were done in an UHV surface analysis system, consisting of an
entry chamber (base pressure ≈1 × 10 −7 mbar), a preparation chamber (≈8 × 10 −10 mbar), and
an analysis chamber (≈2 × 10 −10 mbar). In situ exposure of o-IDTBR and p/ m-ITIC film to
oxygen and water vapor respectively was carried out in the preparation chamber under the
pressure of 6.5 × 10 −6 mbar controlled via a leak- valve. After each exposure step, the film
samples were transferred to the analysis chamber without breaking UHV for measurements.
UPS (HeI hv = 21.22 eV) and XPS (monochromatized AlK h = 1486.6 eV) spectra were
recorded with a Scienta-200 hemispherical analyzer and calibrated by referencing to Fermi level
and Au 4f 7/2 peak position of the Ar + ion sputter-clean gold foil. UPS was performed to study
the interfacial alignment and the frontier electronic structure features with an error margin of
±0.05 eV. The work function is derived from the secondary electron cut-off and the vertical IP
from the frontier edge of the occupied density of states. XPS was used to detect possible
chemical reaction and element absorption in the films after exposure. All water/ O2 exposure
and measurements were carried out in chambers shielded from UV light (by aluminum foil) and
under near-dark conditions (ambient UHV chamber light). The samples were shielded from UV
light during O2 /water vapor exposure as OPV cells likely will be manufactured on glass or
plastic (e.g., poly (ethylene terephthalate), PET) substrates, the latter typically featuring UV-
absorbers/blockers as PET itself photo degrades due to UV light.

S3
HOMO LUMO
o-IDTBR
p-ITIC
m-ITIC
S
SS
SO
OCN
NC
NCCN
SS
NSN
NS
N
S N
SN
S
O O
S
C8H17
C8H17
C6H13C6H13
C6H13C6H13
S
SS
SO
OCN
NC
NCCN
C6H13C6H13
C6H13C6H13
C8H17
C8H17
Structure
Fig. S1. Chemical structure and frontier energy level distribution of o-IDTBR, p-ITIC and m-ITIC.
Table S1. Energy levels of o-IDTBR, p-ITIC and m-ITIC.IPa (eV) EAb (eV) EICT-
c (eV) Eg optd. (eV)
PC71BM 5.900.1 4.18 4.350.05 1.72
o-IDTBR 5.540.1 3.82 3.940.05 1.72e
p-ITIC 5.630.1 4.01 4.190.05 1.62
m-ITIC 5.640.1 4.02 4.200.05 1.62
a Measured by UPS. bCalculated from IP and optical gap. cDeduced from the UPS. dEstimated
from the onset of the absorption spectra. eEstimated from absorption onset of o-IDTBR CHCl3
solution.
S4
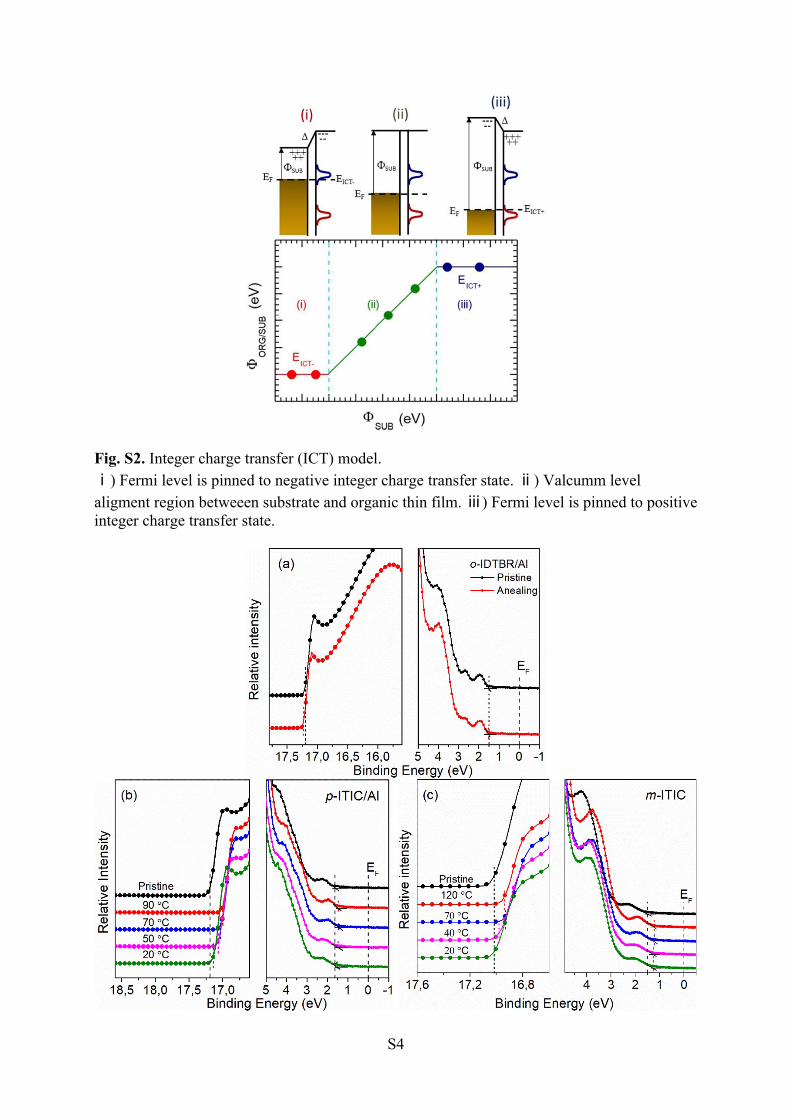
Fig. S2. Integer charge transfer (ICT) model. ⅰ) Fermi level is pinned to negative integer charge transfer state. ⅱ) Valcumm level aligment region betweeen substrate and organic thin film. ⅲ) Fermi level is pinned to positive integer charge transfer state.

S5
Fig. S3. Thermal annealing treatment of a) o-IDTBR, b) p-ITIC and c) m-ITIC.
Fig. S4. UPS spectra evolution under in situ oxygen exposure a) a) o-IDTBR, b) p-ITIC and c) m-ITIC. All the spectrums are aligned at high binding energy.
Fig. S5. Effect of TCNQ on the oxygen exposure degradation.

S6
Table S2. Comparison of energy level between pristine and oxygen attached molecules.o-IDTBR o-IDTBRO2 o-IDTBR2O2 o-IDTBR3O2
LUMO (eV) -2.511 -2.690a
-2.703b-2.726ab
-2.712a*b
-2.690bb
-2.702bb*
-2.730bab
-2.739ba*b
-2.712bab*
Difference (eV) 0.000 -0.179-0.192
-0.215-0.201-0.179-0.191
-0.219-0.228-0.201
HOMO -6.395 -6.432a
-6.490b-6.526ab
-6.473ba*
-6.476 bb
-6.525bb*
-6.567bab
-6.568 ba*b
-6.576 bab*
Difference (eV) 0.000 -0.095-0.037
-0.131-0.078-0.081-0.130
-0.172-0.173-0.181
p-ITIC p-ITICO2 p-ITIC2O2 p-ITIC3O2LUMO (eV) -2.847 -2.851a
-2.894b-2.865ab
-2.910bb-2.925bab
Difference (eV) 0.000 -0.004-0.047
-0.018-0.063
-0.078
HOMO (eV) -6.680 -6.734a
-6.691b-6.618ab
-6.700bb-6.754bab
Difference (eV) 0.000 -0.054-0.011
+0.062-0.020
-0.074
m-ITIC m-ITICO2 m-ITIC2O2 m-ITIC3O2LUMO (eV) -2.895 -2.897a
-2.930b-2.963ab
-2.973bb-2.971bab
Difference (eV) 0.000 -0.002-0.035
-0.068-0.078
-0.076
HOMO (eV) -6.716 -6.775a
-6.742b-6.787ab
-6.745bb-6.795bab
Difference (eV) 0.000 -0.059-0.026
-0.071-0.029
-0.079
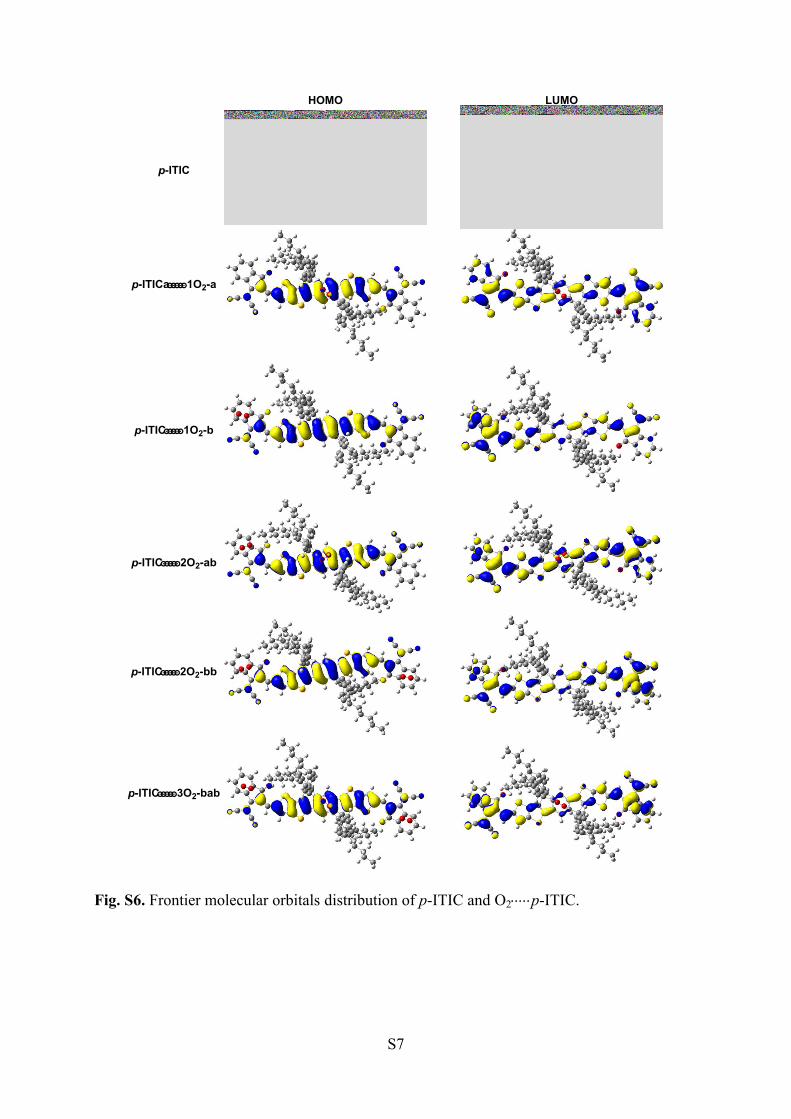
arepresent middle location, brepresent terminal loction and *represent different side of the plane. Example can be found in Fig. S6
S7
p-ITIC
p-ITICa1O2-a
p-ITIC1O2-b
p-ITIC2O2-ab
p-ITIC3O2-bab
HOMO LUMO
p-ITIC2O2-bb
Fig. S6. Frontier molecular orbitals distribution of p-ITIC and O2p-ITIC.

S8
Fig. S7. The calculated molecular structures of o-IDTBR, p-ITIC and m-ITIC from top to bottom.
Table S3. The calculated dihedral of o-IDTBR, p-ITIC and m-ITIC.NFAs NFAsO2 NFAs2O2 NFAs3O2
o-IDTBR 19.15 19.78 20.72 20.71p-ITIC 1.27 3.44 3.17 3.61m-ITIC 9.48 3.25 4.41 9.17
The geometric structures of all species were optimized by the M06-2X functional in Gaussian
09 program.[1] The all-electron basis set 6-311G** was used in describing all the atoms. The
oxygen molecule has been considered in its stable triplet ground state, and a UM06-2X/6-
311G** calculation has been carried out. Different kinds of interactions between the moleculars
and O2 by varying the positions and numbers of dioxygen have been considered and totally 19
interaction models have been tested in our calculations.
NFAs NFAsO2 NFAs2O2 NFAs3O2
S9
Fig. S8. UV-light illumination on p-ITIC.
The acceptor p-ITIC was exposed to UV-light. As shown in Fig. S8. The HOMO properties
show little change compared to pristine film after 2.5 hours UV-light illumination under UHV
chamber within the measurement error bar, indicating the tolerance of non-fullerene acceptor
p-ITIC to UV-light illumination without attendance of the water vapor and oxygen.
References
[1] M. J. Frisch, G. W. Trucks, H. B. Schlegel, G. E. Scuseria, M. A. Robb, J. R. Cheeseman, G. Scalmani, V. Barone, B. Mennucci, G. A. Petersson, H. Nakatsuji, M. Caricato, X. Li, H. P. Ratchian, A. F. Izmaylov, J. Bloino, G. Zheng, J. L. Sonnenberg, M. E. Hada, M., K. F. Toyota, R., J. Hasegawa, M. Ishida, T. Nakajima, Y. Honda, O. N. Kitao, H., T. Vreven, J. A. Montgomery, Jr., J. E. Peralta, F. Ogliaro, M. Bearpark, J. J. Heyd, E. Brothers, K. N. Kudin, V. N. Staroverov, T. Keith, R. Kobayashi, J. Normand, K. Raghavachari, A. Rendell, J. C. Burant, S. S. Iyengar, J. Tomasi, M. Cossi, N. Rega, J. M. Millam, M. Klene, J. E. Knox, J. B. Cross, V. Bakken, C. Adamo, J. Jaramillo, R. Gomperts, R. E. Stratmann, O. Yazyev, A. J. Austin, R. Cammi, C. Pomelli, J. W. Ochterski, R. L. Martin, K. Morokuma, V. G. Zakrzewski, G. A. Voth, P. Salvador, J. J. Dannenberg, S. Dapprich, A. D. Daniels, O. Farkas, J. B. Foresman, J. V. Ortiz, J. Cioslowski, D. J. Fox, Gaussian 09, Revision D.01, Wallingford CT ( 2013).


![arXiv:1703.01778v1 [cond-mat.mtrl-sci] 6 Mar 2017 · ture under base pressure of ∼10−9 Torr. The samples were illuminated by a monochromated Al Kα source (1486.6 eV) with an](https://static.fdocuments.net/doc/165x107/5f99863e98e11426f42a640d/arxiv170301778v1-cond-matmtrl-sci-6-mar-2017-ture-under-base-pressure-of-a10a9.jpg)