
Публікація іноземного студента
13
September, 2014 Agric Eng Int: CIGR Journal Open access at http://www.cigrjournal.org Vol. 16, No.3 43 Thermal energy use in three Swedish greenhouses – the outdoor temperature-dependent variation and the influence of wind speed under no-sunlight conditions Katarzyna Maslak, Sven Nimmermark (Swedish University of Agricultural Sciences, Dept. of Biosystems and Technology, Alnarp, Sweden) Abstract: Thermal energy is used in greenhouses for the temperature and humidity control. In the North of Europe, energy expenditures have a significant share in the total greenhouse production cost. A study was performed to quantify and analyze the use of thermal energy in three Swedish commercial greenhouses (two with tomatoes and one with ornamental plants), to test the hypothesis that substantial amounts of heat are used at higher outdoor temperatures, and to investigate the influence of the wind speed on the energy use under no-sunlight conditions. Hourly climate data were registered by means of Priva control systems. The use of thermal energy was computed based on the readings from the flowmeters and the temperature of the inlet/outlet water to/from the boilers. In the study, seven different ranges of outdoor temperatures for studying energy use at various outdoor temperatures were considered. The use of thermal energy in Greenhouse A amounted to 793 MJ/m 2 (April-October). The yearly use of thermal energy in Greenhouse B with tomatoes was 1529 MJ/m 2 and in Greenhouse C with ornamental plants 873 MJ/m 2 . The results showed a positive relation between the wind speed and the use of thermal energy. Under no-sunlight conditions, correlation coefficients between the wind speed and the use of thermal energy obtained for the various outdoor temperature ranges being considered were in the range of 0.017 to 0.470. Calculations suggested that a reduction of the wind speed, e.g. by a fence or trees, by 50% may result in a 4% to 10% decrease of thermal energy use. In one of the greenhouses (A) the magnitude of thermal energy use at higher outdoor temperatures (15°C to 20°C) was similar to the use in the same greenhouse at outdoor temperatures of 10°C to 15°C. It was noted that the use of thermal energy is dependent on more factors than the wind speed and the outdoor temperature and that the importance of energy efficient dehumidification should be studied in future work. Keywords: Thermal energy use; greenhouses; tomatoes; ornamental plants; wind speed Citation: Maslak, K., and S. Nimmermark. 2014. Thermal energy use in three Swedish greenhouses – the outdoor temperature-dependent variation and the influence of wind speed under no-sunlight conditions. Agric Eng Int: CIGR Journal, 16(3): 43-54. 1 Introduction Efforts for introducing energy conservation measures in greenhouses have been driven by two main factors – the economic one, associated with the increasing energy prices, and the environmental one, related to the targets decided upon during the conference in Kyoto, where the Received date: 2014-05-23 Accepted date: 2014-08-01 Corresponding author: Katarzyna Maslak, PhD student Swedish University of Agricultural Sciences, Dept. of Biosystems and Technology, Alnarp, Sweden. Email: katarzyna.maslak@ slu.se. participating parties agreed to limit their emissions of greenhouse gases (UNFCCC, 1997). The energy expenses, related both to the use of electricity for lights, pumps, etc. and to heat for climatization, directly affect the agricultural production costs. In case of greenhouse cultivation, such energy associated expenditures can be significant. In Italy, the cost of energy used to condition greenhouse air accounts for 20% to 30% of the total production cost (De Pascale and Maggio, 2005). In the North European countries, the energy cost can be higher than 50% of the overall production cost (Greenergy, 2008). In the Netherlands,
Transcript of Публікація іноземного студента

September, 2014 Agric Eng Int: CIGR Journal Open access at http://www.cigrjournal.org Vol. 16, No.3 43
Thermal energy use in three Swedish greenhouses – the outdoor
temperature-dependent variation and the influence of wind speed under no-sunlight conditions
Katarzyna Maslak, Sven Nimmermark (Swedish University of Agricultural Sciences, Dept. of Biosystems and Technology, Alnarp, Sweden)
Abstract: Thermal energy is used in greenhouses for the temperature and humidity control. In the North of Europe, energy expenditures have a significant share in the total greenhouse production cost. A study was performed to quantify and analyze the use of thermal energy in three Swedish commercial greenhouses (two with tomatoes and one with ornamental plants), to test the hypothesis that substantial amounts of heat are used at higher outdoor temperatures, and to investigate the influence of the wind speed on the energy use under no-sunlight conditions. Hourly climate data were registered by means of Priva control systems. The use of thermal energy was computed based on the readings from the flowmeters and the temperature of the inlet/outlet water to/from the boilers. In the study, seven different ranges of outdoor temperatures for studying energy use at various outdoor temperatures were considered. The use of thermal energy in Greenhouse A amounted to 793 MJ/m2 (April-October). The yearly use of thermal energy in Greenhouse B with tomatoes was 1529 MJ/m2 and in Greenhouse C with ornamental plants 873 MJ/m2. The results showed a positive relation between the wind speed and the use of thermal energy. Under no-sunlight conditions, correlation coefficients between the wind speed and the use of thermal energy obtained for the various outdoor temperature ranges being considered were in the range of 0.017 to 0.470. Calculations suggested that a reduction of the wind speed, e.g. by a fence or trees, by 50% may result in a 4% to 10% decrease of thermal energy use. In one of the greenhouses (A) the magnitude of thermal energy use at higher outdoor temperatures (15°C to 20°C) was similar to the use in the same greenhouse at outdoor temperatures of 10°C to 15°C. It was noted that the use of thermal energy is dependent on more factors than the wind speed and the outdoor temperature and that the importance of energy efficient dehumidification should be studied in future work.
Keywords: Thermal energy use; greenhouses; tomatoes; ornamental plants; wind speed
Citation: Maslak, K., and S. Nimmermark. 2014. Thermal energy use in three Swedish greenhouses – the outdoor temperature-dependent variation and the influence of wind speed under no-sunlight conditions. Agric Eng Int: CIGR Journal, 16(3): 43-54.
1 Introduction
Efforts for introducing energy conservation measures in greenhouses have been driven by two main factors – the economic one, associated with the increasing energy prices, and the environmental one, related to the targets decided upon during the conference in Kyoto, where the
Received date: 2014-05-23 Accepted date: 2014-08-01 Corresponding author: Katarzyna Maslak, PhD student Swedish University of Agricultural Sciences, Dept. of Biosystems and Technology, Alnarp, Sweden. Email: katarzyna.maslak@ slu.se.
participating parties agreed to limit their emissions of greenhouse gases (UNFCCC, 1997).
The energy expenses, related both to the use of electricity for lights, pumps, etc. and to heat for climatization, directly affect the agricultural production costs. In case of greenhouse cultivation, such energy associated expenditures can be significant. In Italy, the cost of energy used to condition greenhouse air accounts for 20% to 30% of the total production cost (De Pascale and Maggio, 2005). In the North European countries, the energy cost can be higher than 50% of the overall production cost (Greenergy, 2008). In the Netherlands,

44 September, 2014 Agric Eng Int: CIGR Journal Open access at http://www.cigrjournal.org Vol. 16, No.3
75% to 90% of energy used in the non-illuminated greenhouses is for heating purposes (Kempkes et al., 2014). Canakci and Akinci (2006) analyzed the energy use pattern in the production of four greenhouse vegetables – tomatoes, cucumbers, peppers and eggplants – in Antalya, Turkey. The result showed that the consumption of energy for heating accounted for 54% to 62% of the total energy used in the greenhouse operation.
Thermal energy in greenhouses is used for keeping both the indoor temperature and the humidity of the air within the desired range. The amount of energy that is used is influenced by a large number of factors, including the geographical location and orientation of the greenhouse, its design and the crop species that are cultivated.
Depending on the location and, to some extent, on the orientation of the greenhouse the external climatic conditions differ. The temperature of the air, solar radiation, humidity, precipitation and wind speed vary between different locations. The amount of solar radiation and the effect of wind speed can vary depending on the greenhouse orientation.
When analyzing the influence of the greenhouse design on the energy use, the construction type (Djevic and Dimitrijevic, 2009), the covering materials (Zhang et al., 1996; Cemek et al., 2006; Hemming et al., 2011; Fabrizio, 2012; Max et al., 2012) and the usage and type of screens (Bot et al., 2005) need to be considered. Available covering materials have different thermal insulation properties and are characterized by different coefficients of transmissivity (Papadakis et al., 2000) influencing the amount of solar radiation that can reach the crop. Gupta and Chandra (2002) studied how the greenhouse shape, orientation, the application of insulation in the north wall, double-wall glazing and thermal screens affected the heating needs of a greenhouse located in a cold climate of northern India. They concluded that the optimal combination of these parameters can reduce the heating demand by 80%.
Depending on the cultivated species, requirements on the temperature and the humidity differ. A variety of energy conservation strategies associated with set-points and the operational climate control in the greenhouse was
tested and described by Elings et al. (2005). A decision support tool enabling energy use
simulations was developed in the frame of the EU research project Greenergy (Greenergy, 2008). The impact of different factors, including the climatic conditions (among others the wind speed), the greenhouse construction, the climate set points and the application of screens and lighting was evaluated. The simulations carried out in the frame of the project showed that the reduction of the wind speed and the following decrease of the infiltration rate resulted in a reduced energy use (MJ/m2) and an increased energy efficiency (kgfruit/MJ), especially in case of the Northern European countries – Denmark, Estonia and Finland (Körner et al., 2008). In case of Denmark, the use of energy for a tomato crop decreased in these simulations by 4% when the infiltration rate was lowered from 1.0/h to 0.5/h and by 14% when the infiltration was lowered from 2.0/h to 1.0/h. For Finland, the corresponding reductions were 6% and 13%.
Sanford (2011) reported that the use of windbreaks, e.g. a fence or four-five rows of trees can reduce the wind speed by 50% and decrease the heat losses by 5%-10%.
Bailey (1985) studied the wind dependent temperature control, i.e. varying temperature set-points by wind speed, and its potential for energy savings. Based on the measurements and calculations performed, it was found that if the wind speed is higher than the average value, the energy requirement can be reduced through decreasing the indoor temperature below the required average value. After performing simulations, the same conclusion was drawn by Bailey and Seginer (1989). The impact of climatic conditions on the greenhouse heat losses was studied by Zamir et al. (1984). The measurements were performed in two greenhouses located in a region of Galilee, in northern Israel. The results indicated a linear correlation between the mean overnight heat demand and the outdoor wind velocity. The amount of heat that had to be supplied to the greenhouse (necessary to counteract heat losses) was increasing together with the growing wind speed and decreasing relative humidity.
Most of the studies concerning the wind speed that has been done so far concentrated rather on its influence

September, 2014 Thermal energy use in three Swedish greenhouses Vol. 16, No.3 45
on the ventilation rate for cooling (Baptista et al., 1999; Campen and Bot, 2003; Shilo et al., 2004; Khaoua et al., 2006) than on its impact on the energy use in greenhouses. Even though a number of studies describing the influence of the wind speed on the use of energy for heating are available (Bailey, 1985; Bailey and Seginer, 1989; Zamir, 1984), they are rather old. The construction of greenhouses has changed since then – covering materials with different heat transfer coefficients are used, panels of the covering materials are larger, greenhouse structures are tighter and generally higher. In a comprehensive review of the thermal properties of greenhouse cover materials it is stated that estimations of U-values for covering materials differ largely between studies and that greenhouse U-values depend on the: 1) material type and wet or dry conditions, 2) convection heat exchange (inside and outside), 3) long-wave radiation exchange, 4) air leakage, 5) cover material area, 6) structure and geometry of the greenhouse, and 7) use of thermal screens (Papadakis et al., 2000). Further, also the temperature difference between the inside and the outside of the greenhouse seems to affect the U-value (Geoola et al., 2009). Standard methods for the determination of heat transfer coefficients for specific materials and structures include a widely used hot box method using controlled conditions. Such a method is described in the American and German standards (Papadakis et al., 2000). However, Papadakis et al. (2000) states that even if a common testing method is used, values obtained from such a method will not be of great significance for characterizing the overall thermal behavior of a greenhouse since, as mentioned above, heat transfer mechanisms are highly complex for greenhouses. There is a limited knowledge of today’s energy use and thermal behavior in Swedish commercial greenhouses.
The objective of this work was to quantify and analyze the use of thermal energy in commercial Swedish greenhouses. A hypothesis is that a considerable amount of heat may be used, e.g. for dehumidification also at high outdoor temperatures. Thus, the amounts of thermal energy used in three commercial greenhouses at different outdoor temperatures were calculated from the measured data and studied. Furthermore, the aim of the
study was to investigate how one of the outdoor climate parameters – the wind speed – affects the use of energy for heating under no-sunlight conditions.
2 Materials and methods
2.1 Greenhouse facilities The measurements for this study were carried out in
three commercial greenhouses (A, B, C) located in the province of Scania (latitude 55 to 56° N) in the southern part of Sweden. In Greenhouse A, tomatoes were cultivated, in Greenhouse B, tomatoes and a small amount of melons (see 2.1.2) and in Greenhouse C, ornamental plants with Kalanchoe being the main species. All greenhouse constructions where measurements took place were of the Venlo-type. The studied greenhouses differed in terms of their size, layout, covering materials used, shading and the type of heating system being operated. 2.1.1 Greenhouse A
The total floor area of the greenhouse – 80 000 m2 – was distributed between eight equally sized compartments (Figure 1). It was 5 m high to the gutter and had the roof with the slope of 26°. The walls and the roof of the greenhouse were covered by single glass. The glass sheets used in the walls were of the size 1.5 × 0.8 m each. The lowest part of the walls (up to the height of 1.5 m) was additionally insulated. Glass sheets of the southern wall were sprayed with lime up to the height of 3 m. All compartments were equipped with thermal screens.
The thermal energy came from burning natural gas. In the heating system, hot water was delivered to the greenhouse by two separate circuits - one provided the water to compartments 2, 4, 6 and 8 and another one to compartments 1, 3, 5 and 7. During the study, the average temperature of the inlet water in circuit 1 was 82°C and of the outlet water 37°C. In circuit 2, the inlet water had the average temperature of 82°C and the outlet water of 38°C. In each of the compartments, heating pipes were located both below the crop beds and above the plant canopy. During the study (April-October), the total floor area under cultivation was heated (Atotal = Aheated, m2).

46 September, 2014 Agric Eng Int: CIGR Journal Open access at http://www.cigrjournal.org Vol. 16, No.3
Environmental conditions in the greenhouse were monitored and controlled by means of a Priva Intégro system (v. 724). Priva sensors (thermistors and aspirated psychrometers) registering the temperature and the relative humidity were placed in each of the compartments (two sensors could be found in compartments 1-6 and four sensors were in compartments 7-8) (Figure 1). The pairs of sensors were placed in measuring boxes at the height of 1.8 m. The temperature set-point was 21°C during the day and 17°C during the night (April-October).
Figure 1 The layout of Greenhouse A showing the distribution of
compartments, heating circuits, flow meters and sensors for air temperature and relative humidity
2.1.2 Greenhouse B The greenhouse consisted of six compartments having
the total floor area of 13,700 m2 (Figure 2). Tomatoes were grown in all compartments except for compartment 5 where at the area of 425 m2 melons were cultivated. The height of the greenhouse was 3.75 m to the gutter except for compartment 3 which was 4.20 m high. The walls and the roof of the greenhouse were covered by single glass apart from the walls of compartment 4, which were covered by double-wall acrylic panels. Compartments 2 and 3 were equipped with thermal screens.
The thermal energy came from burning natural gas
and woodchips (with the share 50% each). Hot water was delivered to the greenhouse by one circuit. In this study, the average temperature of the inlet water was 67°C and of the outlet water 51°C. The location of the heating pipes differed between compartments – in compartments 1 and 4 there were three levels of heating (pipes were located below the benches, inside the plant canopy and at the gutter height), in compartment 2 pipes were below the benches and inside the canopy (at two different levels), in compartment 3 – below the benches, inside the plant canopy (at two levels) and at the gutter height, and, in compartment 5 – under the tables and below the roof at the height of the gutter. During the study (January-October), in January not all compartments were heated. Thus, the heated area for that month was lower than the total floor area.
A Priva Intégro system (v. 724) was utilized to monitor and to control the climatic conditions. Priva sensors measuring the temperature (thermistors) and relative humidity (aspirated psychrometers) were located in each compartment (Figure 2) at the height of 1.7 m. The temperature set-point for the heated compartments was 20°C during the day and 17°C during the night (January-October).
Figure 2 The layout of Greenhouse B showing the distribution of compartments, the heating circuit, the flow meter and sensors for air
temperature and relative humidity
2.1.3 Greenhouse C The greenhouse consisted of eight different sections
(Figure 3). Between weeks 12 and 42 the whole area of 6,500 m2 was under cultivation, whereas between weeks 43 and 11, compartment 1 was excluded from the use.

September, 2014 Thermal energy use in three Swedish greenhouses Vol. 16, No.3 47
The height of compartments no. 1 and 8 was 4.5 m, no. 2, 3, 4 and 5 – 3.5 m, no. 6 – 4 m and no. 7 – 2.5 m to the gutter. In compartment 1 the walls consisted of two air-inflated layers of PE plastic film and the roof of double-wall polycarbonate panels. In compartments 2, 3 and 7 the walls and the roof were covered by double-wall acrylic panels. In compartments 4 and 5 walls and the roof were covered by glass. In compartment 6 walls were covered by double-wall polycarbonate panels and the roof by single glass and in compartment 8 walls were covered by double-wall acrylic panels and the roof by single glass. Compartments 2-8 were equipped with screens. For supplemental lighting high-pressure sodium lamps with an irradiance level of 30-40 W/m2 were used in order to keep the desired number of light-hours for the plants at their varying development stages.
Figure 3 The layout of Greenhouse C showing the distribution of compartments, the heating circuit, the flow meter and sensors for
air temperature and relative humidity
Three ground water heat pumps, backed up by an electric boiler and two oil boilers were used for supplying heat to the greenhouse. During this study, the inlet water had the average temperature of 43°C and the outlet water of 33°C. In compartment 1 an air-heating system with fan coils was utilized. In compartments 2, 4, 5, 6 and 8, the heating pipes were located below the benches at which the plants were grown, below the roof at the
gutter height and along the walls, in compartment 3 – below the benches and at the gutter height and in compartment 7 – at the gutter height and along the walls. During the study (January-October), compartment 1 was not heated thus the heated area was lower than the total area under cultivation.
The indoor climate parameters were monitored and controlled by means of a Priva Intégro system (v. 724). Both the temperature and the relative humidity were measured by Priva sensors (thermistors and aspirated psychrometers, correspondingly) situated in each compartment at the height of 1.4 m (Figure 3). The temperature set-point was 21°C during the day and 20°C during the night (January-October). 2.2 Climate and thermal energy use
Hourly data on the outdoor climate (temperature, wind speed and solar radiation), on the indoor temperature, relative humidity and on the heating system (temperature of inlet and outlet water to/from the boiler and readings from the flow meter) were recorded for each of the greenhouses. The outdoor temperature and wind speed were registered by the sensors included in the Priva meteorological station mounted on the roof of each greenhouse. The amount of solar radiation was measured by Kipp & Zonen solarimeters. Priva sensors placed in the measuring boxes were used to register the indoor temperature and relative humidity. The temperature was measured with the accuracy of 0.3°C in the range of 15°C to 35°C and the relative humidity with the accuracy of 3% in the range of 10% to 100% RH (15°C to 35°C). The use of thermal energy in each greenhouse was calculated from the measured temperature of water entering and leaving the boiler and from the pulses registered by flow meters. The temperature of water was registered using SVM TCF Pt100 sensors. The flow meters used were of the following types: Hydrometer WP-XKA model 457 with the nominal diameter 200 mm and the pulse rate 250 pulses/liter (Greenhouse A), Hydrometer WP-XKA model 457 with the nominal diameter 150 mm and the pulse rate 100 pulses/liter (Greenhouse B) and Hydrometer WP-XKA model 456 with the nominal diameter 100 mm and the pulse rate 25 pulses/liter (Greenhouse C).

48 September, 2014 Agric Eng Int: CIGR Journal Open access at http://www.cigrjournal.org Vol. 16, No.3
The use of thermal energy (Q, kJ) during each hour was determined by means of the following formula:
Q = V·ΔTw·ρ·Vp av (1) where: V is the water flow calculated from pulses from the flow meter, m3; ΔTw denotes the difference between the inlet and the return temperature of water (water leaving/entering the boiler), °C; ρ is the density of water (calculated on the side of the flow meter), kg/m3; Cp av is the average specific heat capacity (calculated based on the temperature of inlet and return water) (kJ kg-1 °C-1).
The total monthly and for two greenhouses (B and C) yearly use of energy per square meter of the total floor area (MJ/m2
total area) was calculated. 2.3 Data sets under no-sunlight conditions
A set consisting of 5136 hourly values (April-October) was obtained for Greenhouse A and of 7296 hourly values (January-October) for both Greenhouses B and C. In case of all greenhouses the choice of the period was conditioned by the availability of data. Out of the primary data sets, the data on temperature, wind and energy under no-sunlight conditions (qsolar < 5 W m-2) were chosen for further analysis. These new data sets included 2075, 3390 and 3501 hourly values for Greenhouses A, B and C, respectively. The selected values were subsequently grouped depending on the outdoor temperature (Tout). Seven outdoor temperature ranges were considered: Tout<0° C, 0≤Tout<5° C, 5≤Tout< 10° C, 10≤Tout<15° C, 15≤Tout<20° C, 20≤Tout<25° C and Tout≥25° C. The use of thermal energy (MJ/m2
total area) in all intervals was calculated and the number of hours in each outdoor temperature range was determined. 2.4 Data processing 2.4.1 Statistical evaluation
The statistical software Minitab version 16.2.4 was used to perform the analyses. By the help of Minitab calculations, the energy use per square meter of heated greenhouse area was determined (kJ/m2
heated area). A number of correlations were done in order to investigate the impact of wind speed on the energy used for heating and to determine the degree of linear relationship between these two parameters. Regression analyses with the thermal energy use as a response variable and with the outdoor temperature and the wind speed as predictor
variables were performed. Regression equations were utilized to estimate how the reduction of the wind speed affected the use of thermal energy. It was done in the following way: the influence of reduced wind speed on thermal energy use was estimated by the help of calculations where the measured values of wind speed for each hour were decreased by 5%, 10%, 15%, 25%, 50% and 75% and substituted into equations obtained from regression analyses. The decrease in the thermal energy use was compared to the actual thermal energy use in the period of April to October for Greenhouse A and in the period of January to October for Greenhouses B and C, under no-sunlight conditions. 2.4.2 Heat loss coefficient per square meter floor area
The relationship between the energy used for heating and the difference between the indoor and the outdoor temperatures (ΔT = Tin – Tout) were determined in order to estimate thermal insulation properties of the greenhouses. For Greenhouse A, values corresponding to April- October and for Greenhouses B and C to January-October were calculated. When calculating heat transfer (W/m2) through e.g. a wall, the heat transfer coefficient (U-value, W/m2·°C) for the wall was multiplied by the difference in temperature (ΔT, °C) between the indoor and outdoor climate giving an expected heat loss (W/m2) being proportional to the temperature difference. Further, no heat transfer can be expected when ΔT is zero. Using the regression analysis of the measured thermal energy loss (W/m2) versus ΔT (°C) and its trendline with the intercept (0.0), a heat transfer coefficient Utotal_loss per square meter of the floor area (W/m2
heated area °C) was estimated for Greenhouses A, B and C. The linear regression between thermal energy loss and ΔT with an intercept at (0, 0) gives a trendline of the type y = ax, where: y is thermal energy loss (W/m2), x is ΔT (°C), and a is a coefficient showing the slope, i.e. the U-value. A function of Utotal_loss can be used to express the heat loss from a greenhouse.
3 Results and discussion
3.1 Thermal energy use in greenhouses The amount of thermal energy used for Greenhouse A
during the period April-October was 793 MJ/m2total area.

September, 2014 Thermal energy use in three Swedish greenhouses Vol. 16, No.3 49
The yearly use of thermal energy in Greenhouse B amounted to 1,529 MJ/m2
total area and in Greenhouse C to 873 MJ/m2
total area. Figure 4 presents the use of thermal energy in consecutive months. The values calculated in this study are comparable with the statistics presented by the Swedish Board of Agriculture (Jordbruksverket, 2012). In Table 1, the average monthly values of the indoor temperature, of the temperature difference between the indoor and the outdoor climate and of the wind speed measured for each of the greenhouses are presented. The average indoor temperature corresponds to the total greenhouse area (not just to the heated area).
Although the average indoor temperature in Greenhouse B (18.6°C) was lower than the temperature in Greenhouse C (20.8°C), its consumption of thermal energy per square meter was larger (January-October). Due to the type of crop cultivated in Greenhouse C (ornamental plants) the usage of lighting was higher and thus the temperature could be increased even though less heat from the heating system was supplied. The average values of relative humidity were normal, though higher in Greenhouse B (amounting to 78%) than in Greenhouse C (equal to 73%), indicating an expected higher need for
dehumidification and increased heat losses due to this.
Figure 4 Monthly thermal energy use per square meter of the total
floor area (MJ/m2total area) in the three greenhouses in the study
Table 1 Average monthly values of the indoor temperature (Tin), the difference between the indoor and the outdoor temperature (ΔT) and the wind. The average indoor temperatures were calculated for the total floor area (not just for the heated area)
Average values (SD)
Greenhouse A Greenhouse B Greenhouse C Month
Tin, °C ΔT, °C Wind speed, m/s Tin, °C ΔT, °C Wind speed, m/s Tin, °C ΔT, °C Wind speed, m/s
Jan N.A. N.A. N.A. 10.8 (2.4) 6.5 (4.1) 4.6 (2.0) 17.5 (1.1) 13.6 (3.6) 3.7 (2.0)
Feb N.A. N.A. N.A. 15.5 (1.7) 14.0 (2.6) 3.4 (2.0) 17.3 (0.8) 16.5 (2.3) 2.3 (1.7)
Mar N.A. N.A. N.A. 16.6 (2.4) 10.7 (2.0) 3.2 (1.9) 17.9 (1.7) 12.2 (2.4) 2.5 (2.0)
Apr 19.4 (2.5) 11.2 (2.5) 4.0 (2.1) 18.1 (2.8) 9.6 (2.6) 2.8 (1.8) 18.7 (2.4) 10.5 (2.9) 2.1 (2.4)
May 19.9 (2.8) 8.3 (2.9) 3.3 (1.5) 18.8 (2.6) 7.0 (2.7) 2.6 (1.3) 19.9 (2.4) 7.6 (2.7) 1.1 (1.5)
June 19.9 (3.3) 3.7 (1.8) 3.4 (1.6) 19.3 (2.9) 3.5 (2.1) 2.3 (1.4) 22.2 (3.6) 5.4 (1.7) 1.4 (1.3)
July 19.7 (2.7) 3.8 (1.7) 3.8 (1.6) 19.9 (2.7) 3.5 (1.7) 2.9 (1.4) 21.4 (2.4) 5.6 (1.6) 2.5 (1.5)
Aug 20.3 (3.2) 3.1 (1.6) 3.8 (1.6) 20.3 (3.0) 2.8 (1.8) 2.7 (1.4) 22.1 (2.7) 5.2 (2.2) 2.1 (1.4)
Sept 18.3 (2.4) 5.3 (2.0) 4.3 (1.9) 18.1 (2.3) 4.9 (2.4) 3.2 (1.7) 20.5 (1.6) 8.1 (1.9) 2.5 (1.5)
Oct 18.1 (2.2) 9.1 (2.7) 3.0 (1.5) 17.4 (2.3) 8.7 (3.3) 1.9 (1.5) 18.7 (1.9) 10.8 (2.4) 1.4 (1.3)
Nov N.A. N.A. N.A. 8.6 (4.1) 3.4 (2.5) 3.2 (1.7) 17.7 (1.4) 13.8 (2.8) 2.3 (1.6)
Dec N.A. N.A. N.A. 6.6 (2.1) 2.8 (1.8) 3.2 (2.0) 17.8 (0.9) 14.8 (2.4) 2.5 (1.4)
Note: N.A. – not applicable.
3.2 The impact of wind and outdoor temperature on energy use
In all investigated cases – in all greenhouses and in each outdoor temperature interval – Pearson correlation
coefficients for the thermal energy use versus the wind speed were positive (Table 2). The use of thermal energy was increasing together with the growing wind speed. The values of Pearson correlation coefficients
50 September, 2014 Agric Eng Int: CIGR Journal Open access at http://www.cigrjournal.org Vol. 16, No.3
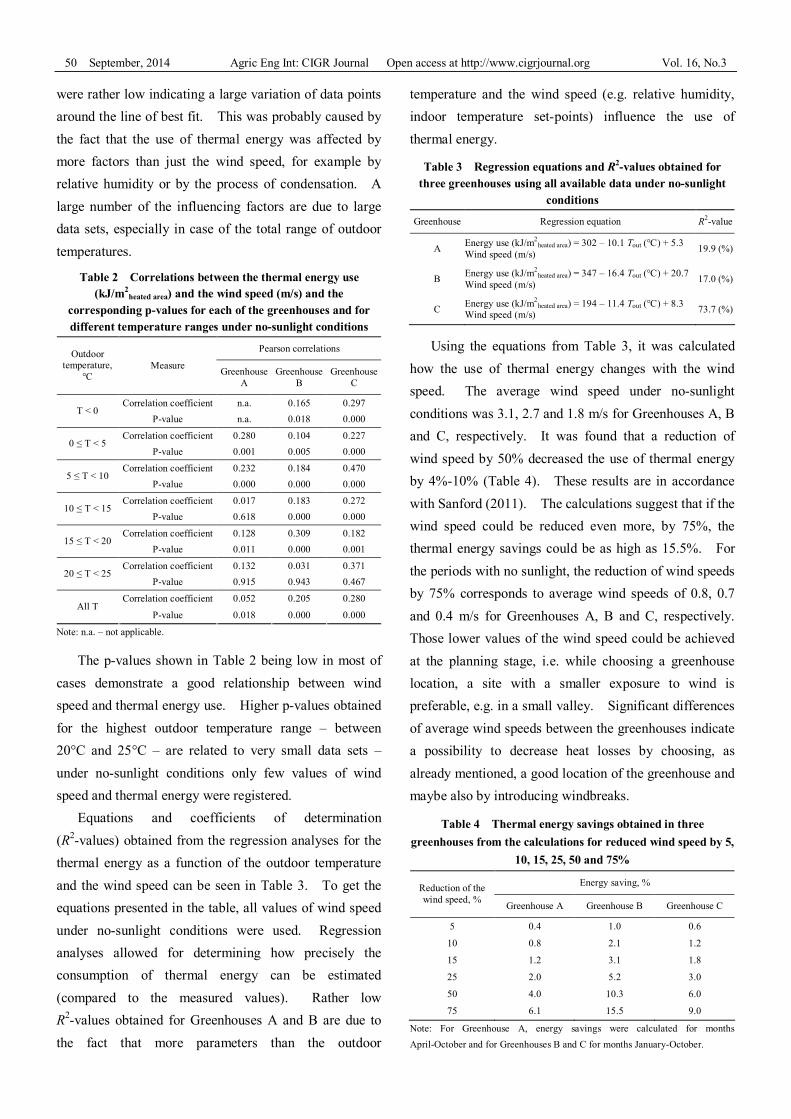
were rather low indicating a large variation of data points around the line of best fit. This was probably caused by the fact that the use of thermal energy was affected by more factors than just the wind speed, for example by relative humidity or by the process of condensation. A large number of the influencing factors are due to large data sets, especially in case of the total range of outdoor temperatures.
Table 2 Correlations between the thermal energy use (kJ/m2
heated area) and the wind speed (m/s) and the corresponding p-values for each of the greenhouses and for different temperature ranges under no-sunlight conditions
Pearson correlations Outdoor temperature,
°C Measure Greenhouse
A Greenhouse
B Greenhouse
C
Correlation coefficient n.a. 0.165 0.297 T < 0
P-value n.a. 0.018 0.000
Correlation coefficient 0.280 0.104 0.227 0 ≤ T < 5
P-value 0.001 0.005 0.000
Correlation coefficient 0.232 0.184 0.470 5 ≤ T < 10
P-value 0.000 0.000 0.000
Correlation coefficient 0.017 0.183 0.272 10 ≤ T < 15
P-value 0.618 0.000 0.000
Correlation coefficient 0.128 0.309 0.182 15 ≤ T < 20
P-value 0.011 0.000 0.001
Correlation coefficient 0.132 0.031 0.371 20 ≤ T < 25
P-value 0.915 0.943 0.467
Correlation coefficient 0.052 0.205 0.280 All T
P-value 0.018 0.000 0.000
Note: n.a. – not applicable.
The p-values shown in Table 2 being low in most of cases demonstrate a good relationship between wind speed and thermal energy use. Higher p-values obtained for the highest outdoor temperature range – between 20°C and 25°C – are related to very small data sets – under no-sunlight conditions only few values of wind speed and thermal energy were registered.
Equations and coefficients of determination (R2-values) obtained from the regression analyses for the thermal energy as a function of the outdoor temperature and the wind speed can be seen in Table 3. To get the equations presented in the table, all values of wind speed under no-sunlight conditions were used. Regression analyses allowed for determining how precisely the consumption of thermal energy can be estimated (compared to the measured values). Rather low R2-values obtained for Greenhouses A and B are due to the fact that more parameters than the outdoor
temperature and the wind speed (e.g. relative humidity, indoor temperature set-points) influence the use of thermal energy.
Table 3 Regression equations and R2-values obtained for three greenhouses using all available data under no-sunlight
conditions
Greenhouse Regression equation R2-value
A Energy use (kJ/m2heated area) = 302 – 10.1 Tout (°C) + 5.3
Wind speed (m/s) 19.9 (%)
B Energy use (kJ/m2heated area) = 347 – 16.4 Tout (°C) + 20.7
Wind speed (m/s) 17.0 (%)
C Energy use (kJ/m2heated area) = 194 – 11.4 Tout (°C) + 8.3
Wind speed (m/s) 73.7 (%)
Using the equations from Table 3, it was calculated how the use of thermal energy changes with the wind speed. The average wind speed under no-sunlight conditions was 3.1, 2.7 and 1.8 m/s for Greenhouses A, B and C, respectively. It was found that a reduction of wind speed by 50% decreased the use of thermal energy by 4%-10% (Table 4). These results are in accordance with Sanford (2011). The calculations suggest that if the wind speed could be reduced even more, by 75%, the thermal energy savings could be as high as 15.5%. For the periods with no sunlight, the reduction of wind speeds by 75% corresponds to average wind speeds of 0.8, 0.7 and 0.4 m/s for Greenhouses A, B and C, respectively. Those lower values of the wind speed could be achieved at the planning stage, i.e. while choosing a greenhouse location, a site with a smaller exposure to wind is preferable, e.g. in a small valley. Significant differences of average wind speeds between the greenhouses indicate a possibility to decrease heat losses by choosing, as already mentioned, a good location of the greenhouse and maybe also by introducing windbreaks.
Table 4 Thermal energy savings obtained in three greenhouses from the calculations for reduced wind speed by 5,
10, 15, 25, 50 and 75%
Energy saving, % Reduction of the wind speed, % Greenhouse A Greenhouse B Greenhouse C
5 0.4 1.0 0.6
10 0.8 2.1 1.2
15 1.2 3.1 1.8
25 2.0 5.2 3.0
50 4.0 10.3 6.0
75 6.1 15.5 9.0
Note: For Greenhouse A, energy savings were calculated for months April-October and for Greenhouses B and C for months January-October.

September, 2014 Thermal energy use in three Swedish greenhouses Vol. 16, No.3 51
Increased energy use by increased wind speed occurs because of the higher heat transfer through the greenhouse cover due to higher convection losses from the surface and increased infiltration.
The results concerning the impact of the wind speed on the use of thermal energy obtained in this study are in accordance with Bailey (1985), Bailey and Seginer (1989), Greenergy (2008) and Zamir et al. (1984).
3.3 The use of thermal energy in different outdoor temperature ranges
The consumption of thermal energy (MJ/m2total area) in
different outdoor temperature intervals and the number of hours with the average outdoor temperature within a specific temperature range are shown in Figure 5. Only hours with the average solar radiation qsolar < 5 W/m2 are included.
Note: For Greenhouse A, energy used between April and October is depicted; for Greenhouse B and Greenhouse C, energy used between January and October is presented.
Figure 5 Thermal energy use per square meter total floor area (MJ/m2total area) in different outdoor temperature intervals under no-sunlight
conditions (qsolar < 5 W/m2) and the number of hours in the data set within each temperature interval
In Greenhouse A, the amount of thermal energy used per hour at outdoor temperatures between 10°C and 15°C was almost of the same magnitude as for the outdoor temperatures between 15°C and 20°C (178 versus 167 kJ m-2 h-1). In Greenhouse B, the corresponding values amounted to 178 and 83 kJ m-2 h-1, whereas in
Greenhouse C the values were 49 and 22 kJ m-2 h-1. A considerable use of thermal energy at higher outdoor temperatures (15-20°C), especially in Greenhouse A, may be caused by the process of dehumidification and the operation of heating system while vents are open. Another explanation may be the type of the heating

52 September, 2014 Agric Eng Int: CIGR Journal Open access at http://www.cigrjournal.org Vol. 16, No.3
system used – water pipes have rather large thermal inertia, especially when compared with ducts used in air heating systems (Teitel et al., 1999). Large thermal inertia in the heating system results in a slower change of released amounts of thermal energy to the greenhouse interior which may increase heat losses. 3.4 Thermal energy use versus the indoor and the outdoor temperature difference
In Figure 6 the relation between the use of thermal energy (kJ m-2
heated area h-1) and the difference between the indoor and the outdoor temperature (ΔT = Tin – Tout, °C) under no-sunlight conditions is presented.
Note: For Greenhouse A, data sets for the months of April-October and for
Greenhouses B and C data for the months of January-October are included.
Figure 6 Energy use per square meter of the heated greenhouse area (kJ m-2
heated area h-1) versus difference between the indoor and the outdoor temperature (ΔT = Tin – Tout, °C) under no-sunlight
conditions
In Greenhouse B, a number of thermal energy values registered for ΔT between 10°C and 15°C were much higher than the majority of points measured in the same interval. The reason for that was malfunction of the heating system (a furnace with wood chips with occasional problems) and maybe sometimes also problems with the climate control system. After the exclusion of those values, the trendline equation of y = 19.606x + 83.385 and the R2-value of 53.5% were obtained. Furthermore, a new regression equation: Energy use (kJ/m2
heated area) = 346 – 15.4 Tout (°C) + 8.56 Wind speed (m/s) with its corresponding R2-value of 44.9% were obtained (compare with the equation and the R2-value shown in Table 3).
For two of the greenhouses (A and B) with walls and roofs covered by glass, the calculated values of heat loss coefficients, Utotal_loss, obtained when the trendline has the intercept point (0.0), were equal to 7.8 and 8.5 W m-2
heated area °C-1 for Greenhouse A and Greenhouse B, respectively. The Utotal_loss per square meter is an indicator of the insulation properties of the greenhouse cover. The corresponding values of heat loss coefficients related to the total area of the greenhouse cover (the area of walls and the area of roof) were equal to 6.5 and 6.4 W m-2
cover °C-1. The calculations were made for no-sunlight conditions. Under such circumstances screens were closed. Data suggested a significantly lower value of the heat loss coefficient (Utotal_loss) for Greenhouse C (2.9 W m-2
heated area °C-1) where another crop (ornamental plants) was grown and much of the greenhouse cover material consisted of double plastic sheets of polycarbonate and acrylic. However, in this house, also lighting was used when needed, providing extra thermal energy to the greenhouse and lowering the heat supply from the heating system and also lowering the calculated Utotal_loss, which in these calculations represented only the heat coming from the heating system.
4 Conclusions
Thermal energy use in greenhouses varies due to a large number of climate parameters and also due to management practices making analyses of the influence

September, 2014 Thermal energy use in three Swedish greenhouses Vol. 16, No.3 53
of single parameters complicated. Thus limited conclusions can be made in the study. Based on the conducted study, the following was concluded:
1) A significantly lower amount of thermal energy was used in the greenhouse with ornamental plants compared to the use in the two greenhouses with tomatoes for which the use was similar. Supplemental lighting in the greenhouse with ornamental plants and the use of double-wall plastic cover materials are two reasons for that. However, also a lower need for dehumidification at higher temperatures is a likely cause.
2) Data revealed that much thermal energy may be used in greenhouses with tomatoes also when outdoor temperatures are higher. However, the heat use at higher temperatures in such greenhouses seems to vary to a large extent between different greenhouses. The amount of thermal energy used per area unit and hour in Greenhouse A at the higher outdoor temperatures of 15°C to 20°C was almost of the same magnitude as the use at 10-15°C, while for Greenhouse B the thermal energy use at higher temperatures (15-20°C) was just about half of that in Greenhouse A.
3) The study indicated a significant increase of thermal energy use by increased wind speed suggesting that thermal energy use in a greenhouse can be decreased significantly when choosing a location with lower average wind speeds. Also, an application of windbreaks allows for a decreased heat demand. Calculations based on collected data showed that a reduction of the wind speed by 50% decreased the demand for thermal energy by 4% to 10%.
The use of thermal energy is influenced by many more factors than the wind speed and the outdoor temperature. The impact of other climate factors,
including relative humidity and different levels of insolation as well as the impact of various types of energy efficient dehumidification, should be investigated in future work.
Acknowledgements This research was funded by the Swedish Energy
Agency and by the Swedish Farmers’ Foundation for Agricultural Research (SLF). Their financial support is gratefully acknowledged. Thanks are due to Jan-Eric Englund from the Department of Biosystems and Technology, Swedish University of Agricultural Sciences for his useful comments regarding the statistical part of the study. The cooperation of growers thanks to whom data used in this study could be collected is greatly acknowledged.
Nomenclature Aheated – heated greenhouse area (m2
heated area) Atotal – total greenhouse floor area (m2
total area) Cp av – specific heat capacity of water (kJ kg-1 °C-1) qsolar – intensity of solar radiation (W/m2) Q – thermal energy use (kJ) P – heat transfer rate (W) Tin – indoor temperature (°C) Tout – outdoor temperature (°C) Utotal_loss – heat transfer coefficient per square meter of the greenhouse floor area (W m-2
heated area °C-1) V – flow of water (m3) ΔT – difference between the indoor and the outdoor temperature (°C) ΔTw – difference between the temperature of water leaving and entering the boiler (°C) ρ – density of water (kg/m3)
References
Bailey, B. J. 1985. Wind dependent control of greenhouse temperature. Acta Horticulturae, 174(1): 381-386.
Bailey, B. J., and I. Seginer. 1989. Optimum control of greenhouse heating. Acta Horticulturae, 245(1): 512-518.
Baptista, F. J., B. J. Bailey, J. M. Randall, and J. F. Meneses. 1999. Greenhouse ventilation rate: theory and measurement
with tracer gas techniques. Journal of Agricultural Engineering Research, 72(4): 363-37.
Bot, G., N. van de Braak, H. Challa, S. Hemming, T. Rieswijk, G. van Straten, and I. Verlodt. 2005. The solar greenhouse: State of the art in energy saving and sustainable energy supply. Acta Horticulturae (ISHS), 691(2): 501-508.

54 September, 2014 Agric Eng Int: CIGR Journal Open access at http://www.cigrjournal.org Vol. 16, No.3
Campen, J. B., and G. P. A. Bot. 2003. Determination of greenhouse-specific aspects of ventilation using three-dimensional computational fluid dynamics. Biosystems Engineering, 84(1): 69-77.
Canakci, A., and I. Akinci. 2006. Energy use pattern analyses of greenhouse vegetable production. Energy, 31(8-9): 1243-1256.
Cemek, B., Y. Demir, S. Uzun, and V. Ceyhan. 2006. The effects of different greenhouse covering materials on energy requirement, growth and yield of aubergine. Energy, 31(12): 1780-1788.
De Pascale, S., and A. Maggio. 2005. Sustainable protected cultivation at a Mediterranean climate. Perspectives and challenges. Acta Horticulturae (ISHS), 691(1): 29-42.
Djevic, M., and A. Dimitrijevic. 2009. Energy consumption for different greenhouse constructions. Energy, 34(9): 1325-1331.
Elings, A., F. L. K. Kempkes, R. C. Kaarsemaker, M. N. A. Ruijs, N. J. van de Braak, and T. A. Dueck. 2005. The energy balance and energy-saving measures in greenhouse tomato cultivation. Acta Horticulturae (ISHS), 691(1): 67-74.
Fabrizio, E. 2012. Energy reduction measures in agricultural greenhouses heating: envelope, systems and solar energy collection. Energy and Buildings, 53(1): 57-63.
Geoola, F., Y. Kashti, A. Levi, and R. Brickman. 2009. A study of the overall heat transfer coefficient of greenhouse cladding materials with thermal screens using the hot box method. Polymer Testing, 28(5): 470-474.
Greenergy. Collective Research Project. 2008. Energy optimisation in European greenhouses. Final activity report. COLL-CT-2005-012566.
Gupta, M. J., and P. Chandra. 2002. Effect of greenhouse design parameters on conservation of energy for greenhouse environmental control. Energy, 27(8): 777-794.
Hemming, S., Kempkes, F. L. K., Mohammadkhani, V. 2011. New glass coatings for high insulating greenhouses without light losses - energy saving, crop production and economic potentials. Acta Horticulturae (ISHS), 893(1): 217-226.
Jordbruksverket (Swedish Board of Agriculture). 2012. Energianvändning i växthus 2011. Tomat, gurka och prydnadsväxter. (Greenhouse energy use in 2011. Tomatoes, cucumbers and ornamental plants.). Statistikrapport 2012:05. Jönköping, Sweden: Statens Jordbruksverk (In Swedish).
Kempkes, F. L. K., J. Janse, and S. Hemming. 2014. Greenhouse concept with high insulating double glass with
coatings and new climate control strategies; from design to results from tomato experiments. Acta Horticulturae (ISHS), 1037(1): 83-92.
Khaoua, S.A.O., P. E. Bournet, C. Migeon, T. Boulard, and G. Chasseriaux. 2006. Analysis of greenhouse ventilation efficiency based on computational fluid dynamics. Biosystems Engineering, 95(1): 83-98.
Körner, O., D. Warner, J. Tzilivakis, B. Eveleens, and E. Heuvelink. 2008. Decision support for optimising energy consumption in European greenhouses. Acta Horticulturae (ISHS), 801(1): 803-810.
Max, J. F. J., G. Reisinger, T. Hofmann, J. Hinken, H. J. Tantaud, A. Ulbrich, S. Lambrecht, B. von Elsner, and U. Schurr. 2012. Glass-film-combination: opto-physical properties and energy saving potential of a novel greenhouse glazing system. Energy and Buildings, 50(1): 298-307.
Papadakis, G., D. Briassoulis, G. Scarascia Mugnozza, G. Vox, P. Feuilloley, and J. A. Stoffers. 2000. Review Paper (SE—Structures and Environment): Radiometric and thermal properties of, and testing methods for, greenhouse covering materials. Journal of Agricultural Engineering Research, 77(1): 7-38.
Sanford, S. 2011. Reducing greenhouse energy consumption - An overview. University of Wisconsin-Extension, Cooperative Extension. A3907-01. Madison, WI: Cooperative Extension Publishing.
Shilo, E., M. Teitel, Y. Mahrer, and T. Boulard. 2004. Air-flow patterns and heat fluxes in roof-ventilated multi-span greenhouse with insect-proof screens. Agricultural and Forest Meteorology, 122(1-2): 3-20.
Teitel, M., I. Segal, A. Shklyar, M. Barak. 1999. A comparison between pipe and air heating methods for greenhouses. Journal of Agricultural Engineering Research, 72(3): 259-273.
UNFCCC. 1997. (United Nations Framework Convention on Climate Change). n.a.. Kyoto Protocol. [Online], available at: http://unfccc.int/kyoto_protocol/items/2830.php (accessed May 15, 2014).
Zamir, N., G. Medan, A. Arbel, and N. Levav. 1984. The influence of climatic conditions on the heat losses from conventional and sloping greenhouses. Acta Horticulturae, 148(1): 319-328.
Zhang, Y., L. Gauthier, D. de Halleux, B. Dansereau, and A. Gosselin. 1996. Effect of covering materials on energy consumption and greenhouse microclimate. Agricultural and Forest Meteorology, 82(1-4): 227-244.

Copyright of Agricultural Engineering International: CIGR Journal is the property ofInternational Commission of Agricultural Engineering and its content may not be copied oremailed to multiple sites or posted to a listserv without the copyright holder's express writtenpermission. However, users may print, download, or email articles for individual use.