鉱床の成因研究と探査への応用 - Unit...Bayan Obo鉱山(中国)の鉱石 Mountain Pass鉱山(米国)の鉱石 イオン吸着型希土類鉱床 鉱石の多くは風化花崗岩
date post
06-Aug-2015Category
view
71download
1
平成27年5月分May, 2015
Indices of Industrial Production (Revised Report)鉱工業(生産・出荷・在庫)指数確報
Ministry of Economy, Trade and Industry
I I P
Research and Statistics DepartmentMinister’s Secretariat
平成27年7月13日July 13, 2015
経済産業省大臣官房調査統計グループ
Tel:03-3501-1644(ダイヤルイン) FAX:03-3501-7775
1
時系列表 7
32
36
38
40
September 30, 2015平成27年9月30日
August, 2015
平成27年9月14日
August 31, 2015平成27年8月31日
September 14, 2015
平成27年10月29日
November 13, 2015平成27年11月13日
平成27年9月分平成27年8月分平成27年7月分平成27年6月分
5. “METI: Indices of Industrial Production” should be indicated as the reference source.
公表時間
3. Annual data revision was implemented for the data for January 2014 and thereafter in the revised report for February 2015, which was published on April 15, 2015.
1.鉱工業指数は、統計法第二条第四項第三号の規定により指定された基幹統計です。
3.平成27年2月分確報公表(平成27年4月15日公表)において、平成26年1月分以降の数値について年間補正を行いました。
4.季節調整方法については、センサス局法のX-12-ARIMAにより季節調整を行っています。使用しているX-12-ARIMAのスペックファイル等については、
「鉱工業指数におけるX-12-ARIMAのスペックファイル等について」(44頁)を参照してください。
6.本書の内容についてのお問い合せ:経済産業省大臣官房調査統計グループ経済解析室 東京都千代田区霞が関一丁目3番1号(〒100-8902)
Economic Analysis Office, Research and Statistics Department, Minister’s Secretariat, Ministry of Economy, Trade and Industry
August 12, 2015平成27年8月12日
今後の公表予定 Date of release from now on
Revised Report
July, 2015
October 29, 2015速報 ( 8:50 a.m.)
June, 2015
July 30, 2015
目 次 CONTENTS
指数表 Tables of Indices
平成27年7月30日
5.本書に記載された数値を他に転載するときは、「経済産業省:鉱工業指数」による旨を必ず明記してください。
2.本書は以下の指数等を公表するものです。
ウェイト表 Tables of weights ・・・・・・・・・・・・・・・・・・・・・・・・・・・・・・・・・・・・・・・・・・・・・・・・・・・・・・・・・・・・・・・・・・・・・・・・・・・・・・・・・・・・・・・・・・・・・・・・・・・・・・・・・・・・・・・・・・・・・・・・・・・・
October 15, 2015平成27年10月15日
1-3-1, Kasumigaseki, Chiyoda-ku, Tokyo 100-8902, Japan Tel:81-3-3501-1644 Fax:81-3-3501-7775
確報 ( 1:30 p.m.)
Preliminary Report
Historical Data ・・・・・・・・・・・・・・・・・・・・・・・・・・・・・・・・・・・・・・・・・・・・・・・・・・・・・・・・・・・・・・・・・・・・・・・・・・・・・・・・・・・・・・・・・・・・・・・・・・・・・・・・・・・・・・・・・・・・・・・・
Time of Release
鉱工業指数におけるX-12-ARIMAのスペックファイル等について ・・・・・・・・・・・・・・・・・・・・・・・・・・・・・・・・・・・・・・・・・・・・・・・・・・・・・・・・・・・・・・・・・・・・・・・・・・・・・・・・・・・・・・・
September, 2015
利用上の注意
(1) Indices of Industrial Production, Producer’s Shipments, Producer’s Inventories and Inventory Ratio (Revised Report)
2. This monthly survey contains the following data.
1. Indices of Industrial Production are the fundamental statistics designated under Article 2, paragraph (4), item (iii) of the Statistics Act.
REMARKS
7.統計情報アクセス用URLは、http://www.meti.go.jp/statistics/index.html
業種別 生産・出荷・在庫・在庫率指数 Indices of Industrial Production, Shipments, Inventories and Inventory Ratio (Classification by Industry) ・・・・・・・・・・・
(1) 鉱工業生産・出荷・在庫指数確報
平成27年5月の鉱工業(生産・出荷・在庫)指数の動向(確報) Indices of Industrial Production for May, 2015 (Revised Report) ・・・・・・・・・・・・・・・・・・・・・・・・・
4. As for the Indices of Industrial Production, the Census Bureau’s X-12-ARIMA method is adopted for the seasonal adjustment. Please refer to
The spec files, etc. adopted in the seasonal adjustment of the Indices of Industrial Production using the X-12-ARIMA method
7. The URL is http://www.meti.go.jp/english/statistics/index.html
‘The Spec files, etc. adopted in the seasonal adjustment of the Indices of Industrial Production using the X-12-ARIMA method’(P.44) for details.
財分類別 生産・出荷・在庫・在庫率指数 Indices of Industrial Production, Shipments, Inventories and Inventory Ratio (Classification by Use of Goods) ・・・・・
6. Please contact the following for additional information.
- 1 -
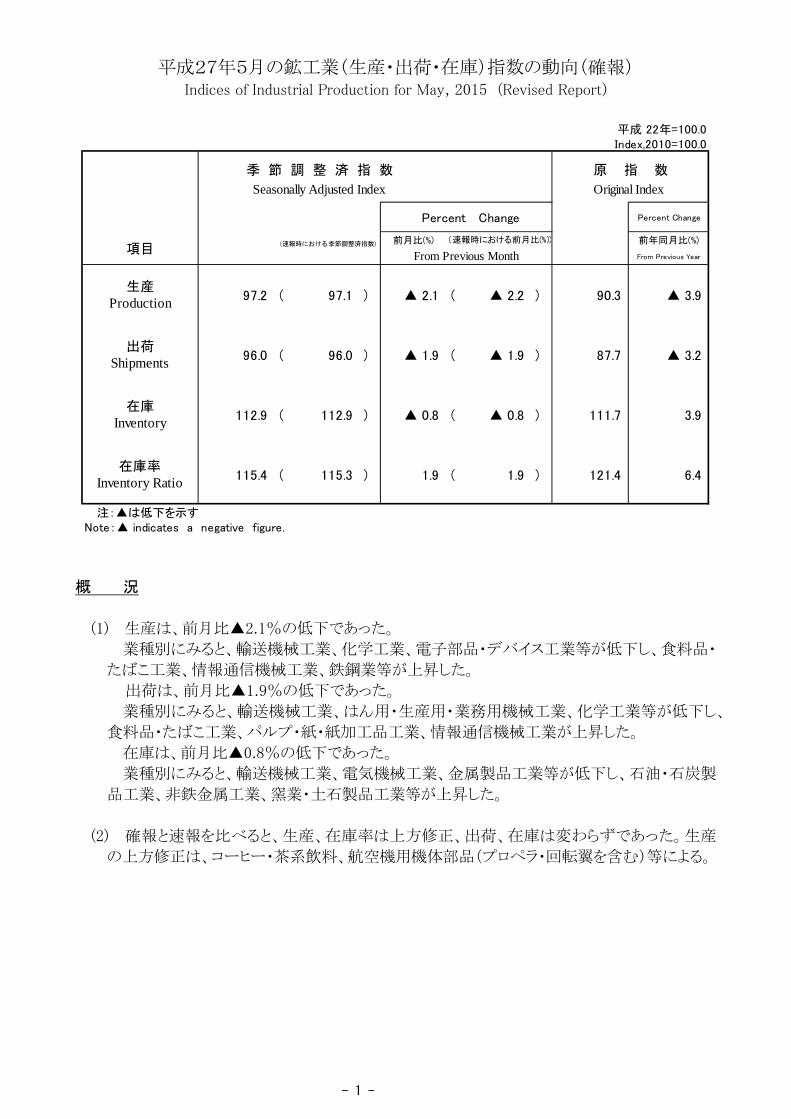
平成27年5月の鉱工業(生産・出荷・在庫)指数の動向(確報) Indices of Industrial Production for May, 2015 (Revised Report)
平成 22年=100.0Index,2010=100.0
Percent Change
前月比(%) 前年同月比(%)
From Previous Year
生産Production 97.2 ( 97.1 ) ▲ 2.1 ( ▲ 2.2 ) 90.3 ▲ 3.9
出荷Shipments 96.0 ( 96.0 ) ▲ 1.9 ( ▲ 1.9 ) 87.7 ▲ 3.2
在庫Inventory 112.9 ( 112.9 ) ▲ 0.8 ( ▲ 0.8 ) 111.7 3.9
在庫率Inventory Ratio 115.4 ( 115.3 ) 1.9 ( 1.9 ) 121.4 6.4
注:▲は低下を示すNote:▲ indicates a negative figure.
季 節 調 整 済 指 数 原 指 数
Seasonally Adjusted Index Original Index
Percent Change
項目(速報時における季節調整済指数)
(速報時における前月比(%))
From Previous Month
概 況
(1) 生産は、前月比▲2.1%の低下であった。
業種別にみると、輸送機械工業、化学工業、電子部品・デバイス工業等が低下し、食料品・
たばこ工業、情報通信機械工業、鉄鋼業等が上昇した。
出荷は、前月比▲1.9%の低下であった。
業種別にみると、輸送機械工業、はん用・生産用・業務用機械工業、化学工業等が低下し、
食料品・たばこ工業、パルプ・紙・紙加工品工業、情報通信機械工業が上昇した。
在庫は、前月比▲0.8%の低下であった。
業種別にみると、輸送機械工業、電気機械工業、金属製品工業等が低下し、石油・石炭製
品工業、非鉄金属工業、窯業・土石製品工業等が上昇した。
(2) 確報と速報を比べると、生産、在庫率は上方修正、出荷、在庫は変わらずであった。生産
の上方修正は、コーヒー・茶系飲料、航空機用機体部品(プロペラ・回転翼を含む)等による。

- 2 -
(平成22年基準・季節調整済指数) (2010 average=100・Seasonally Adjusted Index)
鉱工業生産・出荷・在庫・在庫率指数の推移
90
100
110
120
130
140
5 6 7 8 9 10 11 12 1 2 3 4 5 6 7 8 9 10 11 12 1 2 3 4 5
25年 26年 27年
鉄鋼業 Iron and steel
生産(Production)
出荷(Shipments)
在庫(Inventory)
在庫率(Inventory Ratio)
90
100
110
120
130
140
5 6 7 8 9 10 11 12 1 2 3 4 5 6 7 8 9 10 11 12 1 2 3 4 5
25年 26年 27年
非鉄金属工業 Non-ferrous metals
生産(Production)
出荷(Shipments)
在庫(Inventory)
在庫率(Inventory Ratio)
90
100
110
120
130
140
150
5 6 7 8 9 10 11 12 1 2 3 4 5 6 7 8 9 10 11 12 1 2 3 4 5
25年 26年 27年
金属製品工業 Fabricated metals
生産(Production)
出荷(Shipments)
在庫(Inventory)
在庫率(Inventory Ratio)
90
100
110
120
130
140
150
160
5 6 7 8 9 10 11 12 1 2 3 4 5 6 7 8 9 10 11 12 1 2 3 4 5
25年 26年 27年
はん用・生産用・業務用機械工業 General-purpose, production and business oriented machinery
生産(Production)
出荷(Shipments)
在庫(Inventory)
在庫率(Inventory Ratio)
80
90
100
110
120
130
5 6 7 8 9 10 11 12 1 2 3 4 5 6 7 8 9 10 11 12 1 2 3 4 5 6 7 8 9 10 11 12 1 2 3 4 5 6 7 8 9 10 11 12 1 2 3 4 5 6 7 8 9 10 11 12 1 2 3 4 5
22 年 23 年 24 年 25 年 26 年 27 年
生 産(Production)
出 荷(Shipments)
在 庫(Inventory)
在庫率(Inventory Ratio)
90
100
110
120
5 6 7 8 9 10 11 12 1 2 3 4 5 6 7 8 9 10 11 12 1 2 3 4 5
25 年 26 年 27 年
生 産(Production)
出 荷(Shipments)
在 庫(Inventory)
在庫率(Inventory Ratio)
上記グラフのうち、平成25年5月分~27年5月分までの拡大図 Magrified figure ( from May,2013 to May,2015 )
- 3 -
80
100
120
140
160
5 6 7 8 9 10 11 12 1 2 3 4 5 6 7 8 9 10 11 12 1 2 3 4 5
25年 26年 27年
電子部品・デバイス工業 Electronic parts and devices
生産(Production)
出荷(Shipments)
在庫(Inventory)
在庫率(Inventory Ratio)
90
100
110
120
130
140
150
160
170
180
5 6 7 8 9 10 11 12 1 2 3 4 5 6 7 8 9 10 11 12 1 2 3 4 5
25年 26年 27年
電気機械工業 Electrical machinery
生産(Production)
出荷(Shipments)
在庫(Inventory)
在庫率(Inventory Ratio)
40
60
80
100
120
140
160
180
200
5 6 7 8 9 10 11 12 1 2 3 4 5 6 7 8 9 10 11 12 1 2 3 4 5
25年 26年 27年
情報通信機械工業
Information and communication electronics equipment 生産(Production)
出荷(Shipments)
在庫(Inventory)
在庫率(Inventory Ratio)
60
70
80
90
100
110
120
130
5 6 7 8 9 10 11 12 1 2 3 4 5 6 7 8 9 10 11 12 1 2 3 4 5
25年 26年 27年
輸送機械工業 Transport equipment
生産(Production)
出荷(Shipments)
在庫(Inventory)
在庫率(Inventory Ratio)
95
100
105
110
115
5 6 7 8 9 10 11 12 1 2 3 4 5 6 7 8 9 10 11 12 1 2 3 4 5
25年 26年 27年
窯業・土石製品工業 Ceramics, stone and clay products
生産(Production)
出荷(Shipments)
在庫(Inventory)
在庫率(Inventory Ratio)
80
90
100
110
120
130
5 6 7 8 9 10 11 12 1 2 3 4 5 6 7 8 9 10 11 12 1 2 3 4 5
25年 26年 27年
化学工業 Chemicals 生産(Production)
出荷(Shipments)
在庫(Inventory)
在庫率(Inventory Ratio)
80
85
90
95
100
105
110
5 6 7 8 9 10 11 12 1 2 3 4 5 6 7 8 9 10 11 12 1 2 3 4 5
25年 26年 27年
石油・石炭製品工業 Petroleum and coal products
生産(Production)
出荷(Shipments)
在庫(Inventory)
在庫率(Inventory Ratio)
90
95
100
105
110
115
120
5 6 7 8 9 10 11 12 1 2 3 4 5 6 7 8 9 10 11 12 1 2 3 4 5
25年 26年 27年
プラスチック製品工業 Plastic products
生産(Production)
出荷(Shipments)
在庫(Inventory)
在庫率(Inventory Ratio)
90
95
100
105
110
115
120
5 6 7 8 9 10 11 12 1 2 3 4 5 6 7 8 9 10 11 12 1 2 3 4 5
25年 26年 27年
パルプ・紙・紙加工品工業 Pulp, paper and paper products
生産(Production)
出荷(Shipments)
在庫(Inventory)
在庫率(Inventory Ratio)
90
95
100
105
110
115
120
5 6 7 8 9 10 11 12 1 2 3 4 5 6 7 8 9 10 11 12 1 2 3 4 5
25年 26年 27年
繊維工業 Textiles
生産(Production)
出荷(Shipments)
在庫(Inventory)
在庫率(Inventory Ratio)
- 4 -
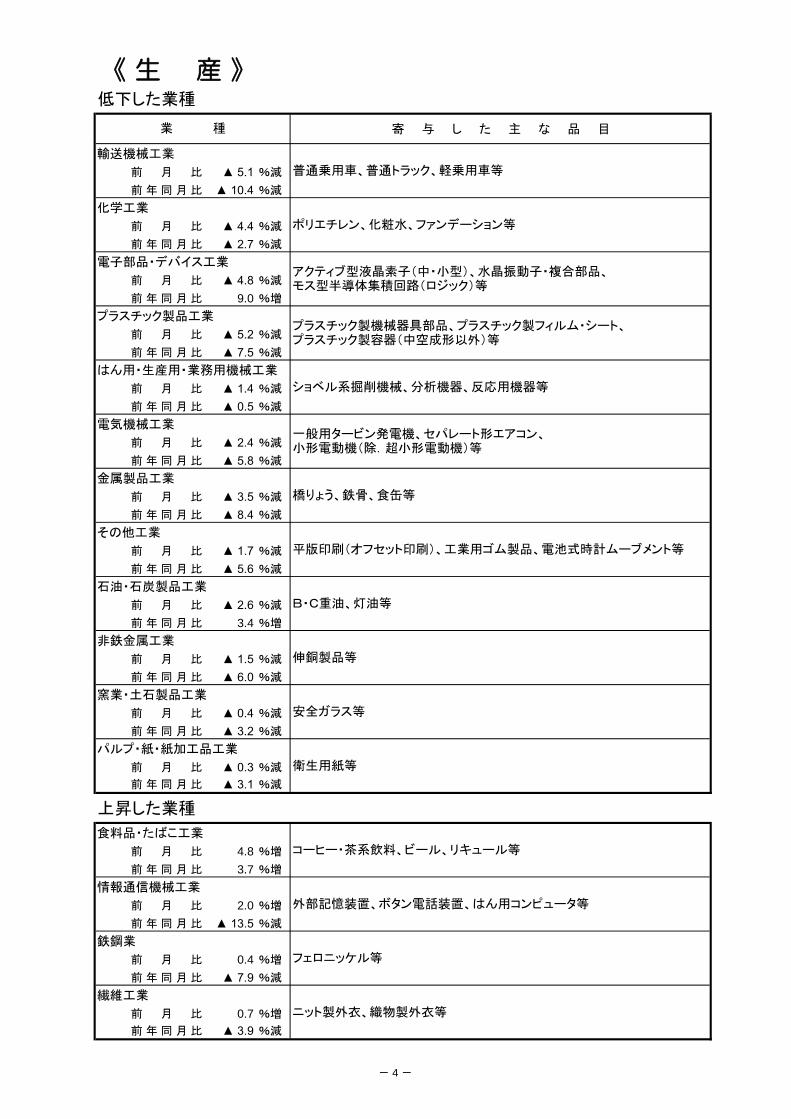
《 生 産 》低下した業種
寄 与 し た 主 な 品 目
前 月 比 ▲ 5.1 %減
前 年 同 月 比 ▲ 10.4 %減
前 月 比 ▲ 4.4 %減
前 年 同 月 比 ▲ 2.7 %減
前 月 比 ▲ 4.8 %減
前 年 同 月 比 9.0 %増
前 月 比 ▲ 5.2 %減
前 年 同 月 比 ▲ 7.5 %減
前 月 比 ▲ 1.4 %減
前 年 同 月 比 ▲ 0.5 %減
前 月 比 ▲ 2.4 %減
前 年 同 月 比 ▲ 5.8 %減
前 月 比 ▲ 3.5 %減
前 年 同 月 比 ▲ 8.4 %減
前 月 比 ▲ 1.7 %減
前 年 同 月 比 ▲ 5.6 %減
前 月 比 ▲ 2.6 %減
前 年 同 月 比 3.4 %増
前 月 比 ▲ 1.5 %減
前 年 同 月 比 ▲ 6.0 %減
前 月 比 ▲ 0.4 %減
前 年 同 月 比 ▲ 3.2 %減
前 月 比 ▲ 0.3 %減
前 年 同 月 比 ▲ 3.1 %減
上昇した業種
前 月 比 4.8 %増
前 年 同 月 比 3.7 %増
前 月 比 2.0 %増
前 年 同 月 比 ▲ 13.5 %減
前 月 比 0.4 %増
前 年 同 月 比 ▲ 7.9 %減
前 月 比 0.7 %増
前 年 同 月 比 ▲ 3.9 %減
業 種
輸送機械工業
化学工業
普通乗用車、普通トラック、軽乗用車等
ポリエチレン、化粧水、ファンデーション等
電子部品・デバイス工業アクティブ型液晶素子(中・小型)、水晶振動子・複合部品、モス型半導体集積回路(ロジック)等
フェロニッケル等
情報通信機械工業
橋りょう、鉄骨、食缶等
その他工業
平版印刷(オフセット印刷)、工業用ゴム製品、電池式時計ムーブメント等
食料品・たばこ工業
コーヒー・茶系飲料、ビール、リキュール等
石油・石炭製品工業
B・C重油、灯油等
プラスチック製品工業プラスチック製機械器具部品、プラスチック製フィルム・シート、プラスチック製容器(中空成形以外)等
はん用・生産用・業務用機械工業
ショベル系掘削機械、分析機器、反応用機器等
金属製品工業
電気機械工業一般用タービン発電機、セパレート形エアコン、小形電動機(除.超小形電動機)等
安全ガラス等
パルプ・紙・紙加工品工業
衛生用紙等
繊維工業
ニット製外衣、織物製外衣等
非鉄金属工業
伸銅製品等
外部記憶装置、ボタン電話装置、はん用コンピュータ等
窯業・土石製品工業
鉄鋼業
- 5 -
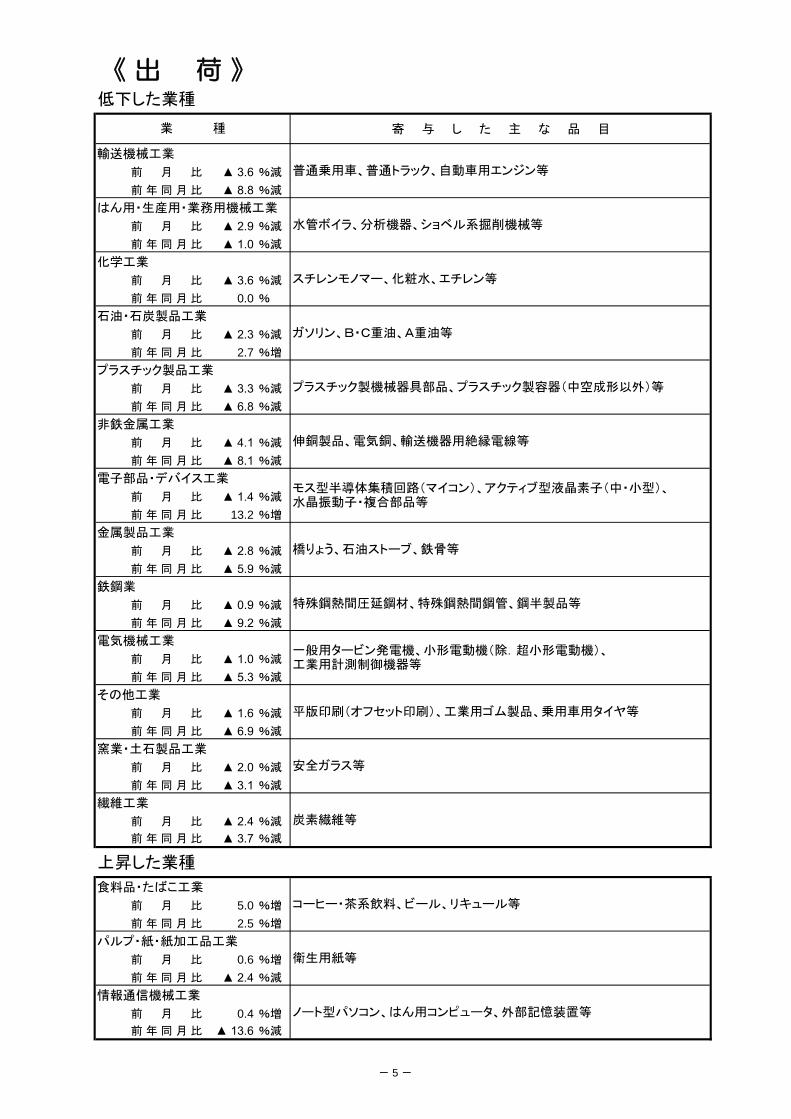
《 出 荷 》低下した業種
寄 与 し た 主 な 品 目
前 月 比 ▲ 3.6 %減
前 年 同 月 比 ▲ 8.8 %減
前 月 比 ▲ 2.9 %減
前 年 同 月 比 ▲ 1.0 %減
前 月 比 ▲ 3.6 %減
前 年 同 月 比 0.0 %
前 月 比 ▲ 2.3 %減
前 年 同 月 比 2.7 %増
前 月 比 ▲ 3.3 %減
前 年 同 月 比 ▲ 6.8 %減
前 月 比 ▲ 4.1 %減
前 年 同 月 比 ▲ 8.1 %減
前 月 比 ▲ 1.4 %減
前 年 同 月 比 13.2 %増
前 月 比 ▲ 2.8 %減
前 年 同 月 比 ▲ 5.9 %減
前 月 比 ▲ 0.9 %減
前 年 同 月 比 ▲ 9.2 %減
前 月 比 ▲ 1.0 %減
前 年 同 月 比 ▲ 5.3 %減
前 月 比 ▲ 1.6 %減
前 年 同 月 比 ▲ 6.9 %減
前 月 比 ▲ 2.0 %減
前 年 同 月 比 ▲ 3.1 %減
前 月 比 ▲ 2.4 %減
前 年 同 月 比 ▲ 3.7 %減
上昇した業種
前 月 比 5.0 %増
前 年 同 月 比 2.5 %増
前 月 比 0.6 %増
前 年 同 月 比 ▲ 2.4 %減
前 月 比 0.4 %増
前 年 同 月 比 ▲ 13.6 %減
伸銅製品、電気銅、輸送機器用絶縁電線等
その他工業
平版印刷(オフセット印刷)、工業用ゴム製品、乗用車用タイヤ等
情報通信機械工業
ノート型パソコン、はん用コンピュータ、外部記憶装置等
業 種
輸送機械工業
はん用・生産用・業務用機械工業
普通乗用車、普通トラック、自動車用エンジン等
水管ボイラ、分析機器、ショベル系掘削機械等
電子部品・デバイス工業モス型半導体集積回路(マイコン)、アクティブ型液晶素子(中・小型)、水晶振動子・複合部品等
金属製品工業
一般用タービン発電機、小形電動機(除.超小形電動機)、工業用計測制御機器等
プラスチック製機械器具部品、プラスチック製容器(中空成形以外)等
パルプ・紙・紙加工品工業
衛生用紙等
食料品・たばこ工業
コーヒー・茶系飲料、ビール、リキュール等
橋りょう、石油ストーブ、鉄骨等
鉄鋼業
特殊鋼熱間圧延鋼材、特殊鋼熱間鋼管、鋼半製品等
非鉄金属工業
窯業・土石製品工業
安全ガラス等
繊維工業
炭素繊維等
化学工業
スチレンモノマー、化粧水、エチレン等
石油・石炭製品工業
ガソリン、B・C重油、A重油等
プラスチック製品工業
電気機械工業
- 6 -
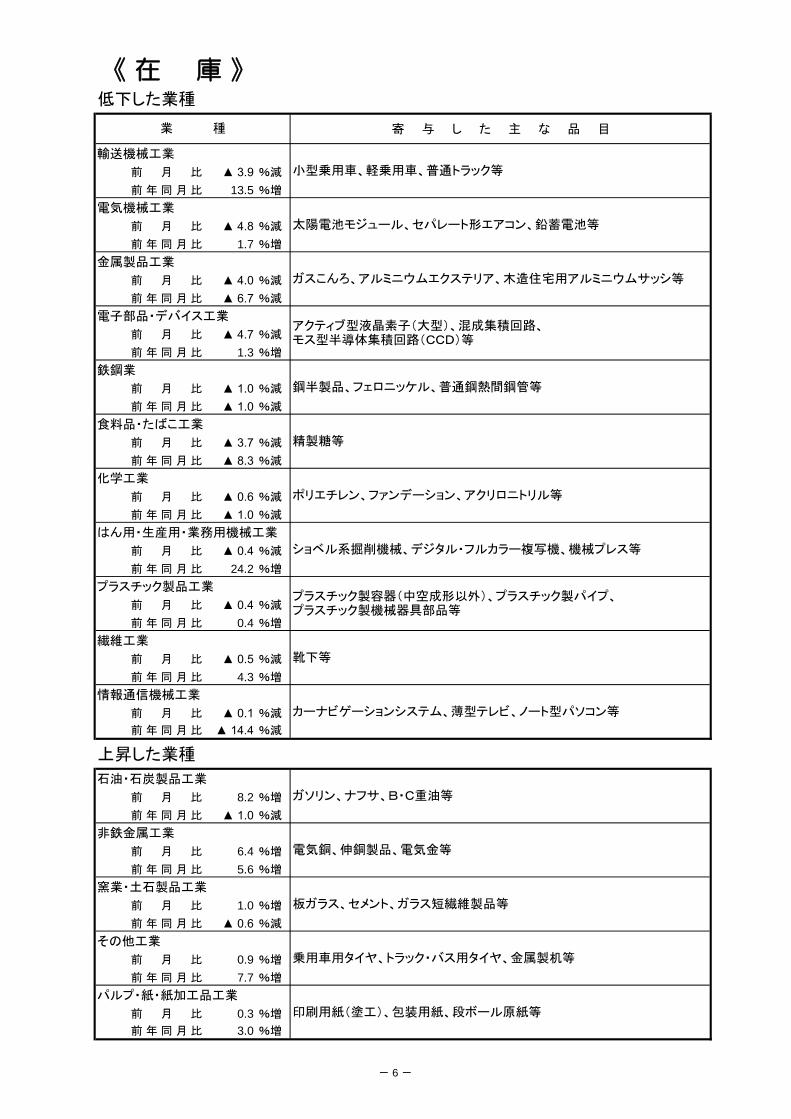
《 在 庫 》低下した業種
寄 与 し た 主 な 品 目
前 月 比 ▲ 3.9 %減
前 年 同 月 比 13.5 %増
前 月 比 ▲ 4.8 %減
前 年 同 月 比 1.7 %増
前 月 比 ▲ 4.0 %減
前 年 同 月 比 ▲ 6.7 %減
前 月 比 ▲ 4.7 %減
前 年 同 月 比 1.3 %増
前 月 比 ▲ 1.0 %減
前 年 同 月 比 ▲ 1.0 %減
前 月 比 ▲ 3.7 %減
前 年 同 月 比 ▲ 8.3 %減
前 月 比 ▲ 0.6 %減
前 年 同 月 比 ▲ 1.0 %減
前 月 比 ▲ 0.4 %減
前 年 同 月 比 24.2 %増
前 月 比 ▲ 0.4 %減
前 年 同 月 比 0.4 %増
前 月 比 ▲ 0.5 %減
前 年 同 月 比 4.3 %増
前 月 比 ▲ 0.1 %減
前 年 同 月 比 ▲ 14.4 %減
上昇した業種
前 月 比 8.2 %増
前 年 同 月 比 ▲ 1.0 %減
前 月 比 6.4 %増
前 年 同 月 比 5.6 %増
前 月 比 1.0 %増
前 年 同 月 比 ▲ 0.6 %減
前 月 比 0.9 %増
前 年 同 月 比 7.7 %増
前 月 比 0.3 %増
前 年 同 月 比 3.0 %増
鋼半製品、フェロニッケル、普通鋼熱間鋼管等
食料品・たばこ工業
精製糖等
はん用・生産用・業務用機械工業
ショベル系掘削機械、デジタル・フルカラー複写機、機械プレス等
鉄鋼業
ガスこんろ、アルミニウムエクステリア、木造住宅用アルミニウムサッシ等
電子部品・デバイス工業アクティブ型液晶素子(大型)、混成集積回路、モス型半導体集積回路(CCD)等
窯業・土石製品工業
板ガラス、セメント、ガラス短繊維製品等
プラスチック製品工業
情報通信機械工業
カーナビゲーションシステム、薄型テレビ、ノート型パソコン等
ガソリン、ナフサ、B・C重油等
非鉄金属工業
業 種
輸送機械工業
小型乗用車、軽乗用車、普通トラック等
電気機械工業
電気銅、伸銅製品、電気金等
石油・石炭製品工業
太陽電池モジュール、セパレート形エアコン、鉛蓄電池等
化学工業
ポリエチレン、ファンデーション、アクリロニトリル等
金属製品工業
パルプ・紙・紙加工品工業
印刷用紙(塗工)、包装用紙、段ボール原紙等
その他工業
乗用車用タイヤ、トラック・バス用タイヤ、金属製机等
プラスチック製容器(中空成形以外)、プラスチック製パイプ、プラスチック製機械器具部品等
繊維工業
靴下等
- 7 -
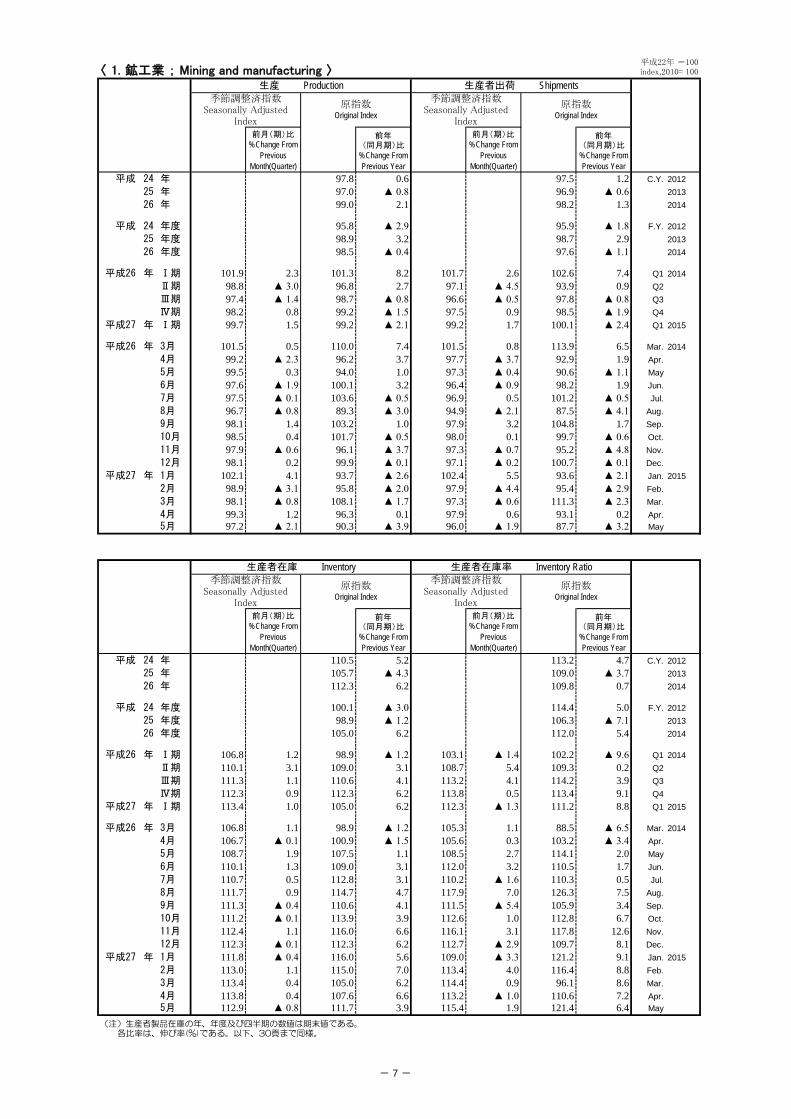
〈 1. 鉱工業 ; Mining and manufacturing 〉
前月(期)比%Change From
PreviousMonth(Quarter)
前年(同月期)比
%Change FromPrevious Year
前月(期)比%Change From
PreviousMonth(Quarter)
前年(同月期)比
%Change FromPrevious Year
平成 24 年 97.8 0.6 97.5 1.2 C.Y. 201225 年 97.0 ▲ 0.8 96.9 ▲ 0.6 201326 年 99.0 2.1 98.2 1.3 2014
平成 24 年度 95.8 ▲ 2.9 95.9 ▲ 1.8 F.Y. 201225 年度 98.9 3.2 98.7 2.9 201326 年度 98.5 ▲ 0.4 97.6 ▲ 1.1 2014
平成26 年 Ⅰ期 101.9 2.3 101.3 8.2 101.7 2.6 102.6 7.4 Q1 2014Ⅱ期 98.8 ▲ 3.0 96.8 2.7 97.1 ▲ 4.5 93.9 0.9 Q2Ⅲ期 97.4 ▲ 1.4 98.7 ▲ 0.8 96.6 ▲ 0.5 97.8 ▲ 0.8 Q3Ⅳ期 98.2 0.8 99.2 ▲ 1.5 97.5 0.9 98.5 ▲ 1.9 Q4
平成27 年 Ⅰ期 99.7 1.5 99.2 ▲ 2.1 99.2 1.7 100.1 ▲ 2.4 Q1 2015
平成26 年 3月 101.5 0.5 110.0 7.4 101.5 0.8 113.9 6.5 Mar. 20144月 99.2 ▲ 2.3 96.2 3.7 97.7 ▲ 3.7 92.9 1.9 Apr.5月 99.5 0.3 94.0 1.0 97.3 ▲ 0.4 90.6 ▲ 1.1 May6月 97.6 ▲ 1.9 100.1 3.2 96.4 ▲ 0.9 98.2 1.9 Jun.7月 97.5 ▲ 0.1 103.6 ▲ 0.5 96.9 0.5 101.2 ▲ 0.5 Jul.8月 96.7 ▲ 0.8 89.3 ▲ 3.0 94.9 ▲ 2.1 87.5 ▲ 4.1 Aug.9月 98.1 1.4 103.2 1.0 97.9 3.2 104.8 1.7 Sep.10月 98.5 0.4 101.7 ▲ 0.5 98.0 0.1 99.7 ▲ 0.6 Oct.11月 97.9 ▲ 0.6 96.1 ▲ 3.7 97.3 ▲ 0.7 95.2 ▲ 4.8 Nov.12月 98.1 0.2 99.9 ▲ 0.1 97.1 ▲ 0.2 100.7 ▲ 0.1 Dec.
平成27 年 1月 102.1 4.1 93.7 ▲ 2.6 102.4 5.5 93.6 ▲ 2.1 Jan. 20152月 98.9 ▲ 3.1 95.8 ▲ 2.0 97.9 ▲ 4.4 95.4 ▲ 2.9 Feb.3月 98.1 ▲ 0.8 108.1 ▲ 1.7 97.3 ▲ 0.6 111.3 ▲ 2.3 Mar.4月 99.3 1.2 96.3 0.1 97.9 0.6 93.1 0.2 Apr.5月 97.2 ▲ 2.1 90.3 ▲ 3.9 96.0 ▲ 1.9 87.7 ▲ 3.2 May
前月(期)比%Change From
PreviousMonth(Quarter)
前年(同月期)比
%Change FromPrevious Year
前月(期)比%Change From
PreviousMonth(Quarter)
前年(同月期)比
%Change FromPrevious Year
平成 24 年 110.5 5.2 113.2 4.7 C.Y. 201225 年 105.7 ▲ 4.3 109.0 ▲ 3.7 201326 年 112.3 6.2 109.8 0.7 2014
平成 24 年度 100.1 ▲ 3.0 114.4 5.0 F.Y. 201225 年度 98.9 ▲ 1.2 106.3 ▲ 7.1 201326 年度 105.0 6.2 112.0 5.4 2014
平成26 年 Ⅰ期 106.8 1.2 98.9 ▲ 1.2 103.1 ▲ 1.4 102.2 ▲ 9.6 Q1 2014Ⅱ期 110.1 3.1 109.0 3.1 108.7 5.4 109.3 0.2 Q2Ⅲ期 111.3 1.1 110.6 4.1 113.2 4.1 114.2 3.9 Q3Ⅳ期 112.3 0.9 112.3 6.2 113.8 0.5 113.4 9.1 Q4
平成27 年 Ⅰ期 113.4 1.0 105.0 6.2 112.3 ▲ 1.3 111.2 8.8 Q1 2015
平成26 年 3月 106.8 1.1 98.9 ▲ 1.2 105.3 1.1 88.5 ▲ 6.5 Mar. 20144月 106.7 ▲ 0.1 100.9 ▲ 1.5 105.6 0.3 103.2 ▲ 3.4 Apr.5月 108.7 1.9 107.5 1.1 108.5 2.7 114.1 2.0 May6月 110.1 1.3 109.0 3.1 112.0 3.2 110.5 1.7 Jun.7月 110.7 0.5 112.8 3.1 110.2 ▲ 1.6 110.3 0.5 Jul.8月 111.7 0.9 114.7 4.7 117.9 7.0 126.3 7.5 Aug.9月 111.3 ▲ 0.4 110.6 4.1 111.5 ▲ 5.4 105.9 3.4 Sep.10月 111.2 ▲ 0.1 113.9 3.9 112.6 1.0 112.8 6.7 Oct.11月 112.4 1.1 116.0 6.6 116.1 3.1 117.8 12.6 Nov.12月 112.3 ▲ 0.1 112.3 6.2 112.7 ▲ 2.9 109.7 8.1 Dec.
平成27 年 1月 111.8 ▲ 0.4 116.0 5.6 109.0 ▲ 3.3 121.2 9.1 Jan. 20152月 113.0 1.1 115.0 7.0 113.4 4.0 116.4 8.8 Feb.3月 113.4 0.4 105.0 6.2 114.4 0.9 96.1 8.6 Mar.4月 113.8 0.4 107.6 6.6 113.2 ▲ 1.0 110.6 7.2 Apr.5月 112.9 ▲ 0.8 111.7 3.9 115.4 1.9 121.4 6.4 May
平成22年 =100index,2010= 100
生産 Production 生産者出荷 Shipments季節調整済指数
Seasonally AdjustedIndex
原指数Original Index
季節調整済指数Seasonally Adjusted
Index
原指数Original Index
生産者在庫 Inventory 生産者在庫率 Inventory Ratio季節調整済指数
Seasonally AdjustedIndex
原指数Original Index
季節調整済指数Seasonally Adjusted
Index
原指数Original Index
(注)生産者製品在庫の年、年度及び四半期の数値は期末値である。 各比率は、伸び率(%)である。以下、30頁まで同様。
- 8 -
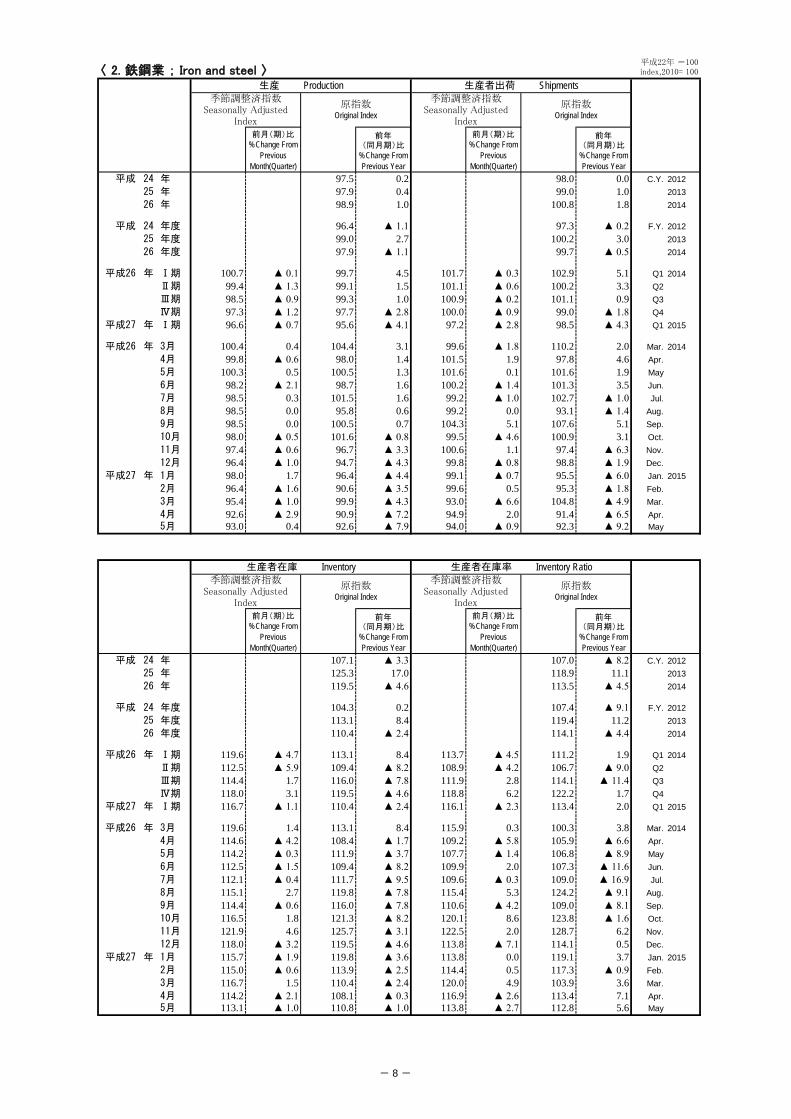
〈 2. 鉄鋼業 ; Iron and steel 〉
前月(期)比%Change From
PreviousMonth(Quarter)
前年(同月期)比
%Change FromPrevious Year
前月(期)比%Change From
PreviousMonth(Quarter)
前年(同月期)比
%Change FromPrevious Year
平成 24 年 97.5 0.2 98.0 0.0 C.Y. 201225 年 97.9 0.4 99.0 1.0 201326 年 98.9 1.0 100.8 1.8 2014
平成 24 年度 96.4 ▲ 1.1 97.3 ▲ 0.2 F.Y. 201225 年度 99.0 2.7 100.2 3.0 201326 年度 97.9 ▲ 1.1 99.7 ▲ 0.5 2014
平成26 年 Ⅰ期 100.7 ▲ 0.1 99.7 4.5 101.7 ▲ 0.3 102.9 5.1 Q1 2014Ⅱ期 99.4 ▲ 1.3 99.1 1.5 101.1 ▲ 0.6 100.2 3.3 Q2Ⅲ期 98.5 ▲ 0.9 99.3 1.0 100.9 ▲ 0.2 101.1 0.9 Q3Ⅳ期 97.3 ▲ 1.2 97.7 ▲ 2.8 100.0 ▲ 0.9 99.0 ▲ 1.8 Q4
平成27 年 Ⅰ期 96.6 ▲ 0.7 95.6 ▲ 4.1 97.2 ▲ 2.8 98.5 ▲ 4.3 Q1 2015
平成26 年 3月 100.4 0.4 104.4 3.1 99.6 ▲ 1.8 110.2 2.0 Mar. 20144月 99.8 ▲ 0.6 98.0 1.4 101.5 1.9 97.8 4.6 Apr.5月 100.3 0.5 100.5 1.3 101.6 0.1 101.6 1.9 May6月 98.2 ▲ 2.1 98.7 1.6 100.2 ▲ 1.4 101.3 3.5 Jun.7月 98.5 0.3 101.5 1.6 99.2 ▲ 1.0 102.7 ▲ 1.0 Jul.8月 98.5 0.0 95.8 0.6 99.2 0.0 93.1 ▲ 1.4 Aug.9月 98.5 0.0 100.5 0.7 104.3 5.1 107.6 5.1 Sep.10月 98.0 ▲ 0.5 101.6 ▲ 0.8 99.5 ▲ 4.6 100.9 3.1 Oct.11月 97.4 ▲ 0.6 96.7 ▲ 3.3 100.6 1.1 97.4 ▲ 6.3 Nov.12月 96.4 ▲ 1.0 94.7 ▲ 4.3 99.8 ▲ 0.8 98.8 ▲ 1.9 Dec.
平成27 年 1月 98.0 1.7 96.4 ▲ 4.4 99.1 ▲ 0.7 95.5 ▲ 6.0 Jan. 20152月 96.4 ▲ 1.6 90.6 ▲ 3.5 99.6 0.5 95.3 ▲ 1.8 Feb.3月 95.4 ▲ 1.0 99.9 ▲ 4.3 93.0 ▲ 6.6 104.8 ▲ 4.9 Mar.4月 92.6 ▲ 2.9 90.9 ▲ 7.2 94.9 2.0 91.4 ▲ 6.5 Apr.5月 93.0 0.4 92.6 ▲ 7.9 94.0 ▲ 0.9 92.3 ▲ 9.2 May
前月(期)比%Change From
PreviousMonth(Quarter)
前年(同月期)比
%Change FromPrevious Year
前月(期)比%Change From
PreviousMonth(Quarter)
前年(同月期)比
%Change FromPrevious Year
平成 24 年 107.1 ▲ 3.3 107.0 ▲ 8.2 C.Y. 201225 年 125.3 17.0 118.9 11.1 201326 年 119.5 ▲ 4.6 113.5 ▲ 4.5 2014
平成 24 年度 104.3 0.2 107.4 ▲ 9.1 F.Y. 201225 年度 113.1 8.4 119.4 11.2 201326 年度 110.4 ▲ 2.4 114.1 ▲ 4.4 2014
平成26 年 Ⅰ期 119.6 ▲ 4.7 113.1 8.4 113.7 ▲ 4.5 111.2 1.9 Q1 2014Ⅱ期 112.5 ▲ 5.9 109.4 ▲ 8.2 108.9 ▲ 4.2 106.7 ▲ 9.0 Q2Ⅲ期 114.4 1.7 116.0 ▲ 7.8 111.9 2.8 114.1 ▲ 11.4 Q3Ⅳ期 118.0 3.1 119.5 ▲ 4.6 118.8 6.2 122.2 1.7 Q4
平成27 年 Ⅰ期 116.7 ▲ 1.1 110.4 ▲ 2.4 116.1 ▲ 2.3 113.4 2.0 Q1 2015
平成26 年 3月 119.6 1.4 113.1 8.4 115.9 0.3 100.3 3.8 Mar. 20144月 114.6 ▲ 4.2 108.4 ▲ 1.7 109.2 ▲ 5.8 105.9 ▲ 6.6 Apr.5月 114.2 ▲ 0.3 111.9 ▲ 3.7 107.7 ▲ 1.4 106.8 ▲ 8.9 May6月 112.5 ▲ 1.5 109.4 ▲ 8.2 109.9 2.0 107.3 ▲ 11.6 Jun.7月 112.1 ▲ 0.4 111.7 ▲ 9.5 109.6 ▲ 0.3 109.0 ▲ 16.9 Jul.8月 115.1 2.7 119.8 ▲ 7.8 115.4 5.3 124.2 ▲ 9.1 Aug.9月 114.4 ▲ 0.6 116.0 ▲ 7.8 110.6 ▲ 4.2 109.0 ▲ 8.1 Sep.10月 116.5 1.8 121.3 ▲ 8.2 120.1 8.6 123.8 ▲ 1.6 Oct.11月 121.9 4.6 125.7 ▲ 3.1 122.5 2.0 128.7 6.2 Nov.12月 118.0 ▲ 3.2 119.5 ▲ 4.6 113.8 ▲ 7.1 114.1 0.5 Dec.
平成27 年 1月 115.7 ▲ 1.9 119.8 ▲ 3.6 113.8 0.0 119.1 3.7 Jan. 20152月 115.0 ▲ 0.6 113.9 ▲ 2.5 114.4 0.5 117.3 ▲ 0.9 Feb.3月 116.7 1.5 110.4 ▲ 2.4 120.0 4.9 103.9 3.6 Mar.4月 114.2 ▲ 2.1 108.1 ▲ 0.3 116.9 ▲ 2.6 113.4 7.1 Apr.5月 113.1 ▲ 1.0 110.8 ▲ 1.0 113.8 ▲ 2.7 112.8 5.6 May
平成22年 =100index,2010= 100
生産 Production 生産者出荷 Shipments季節調整済指数
Seasonally AdjustedIndex
原指数Original Index
季節調整済指数Seasonally Adjusted
Index
原指数Original Index
生産者在庫 Inventory 生産者在庫率 Inventory Ratio季節調整済指数
Seasonally AdjustedIndex
原指数Original Index
季節調整済指数Seasonally Adjusted
Index
原指数Original Index
- 9 -
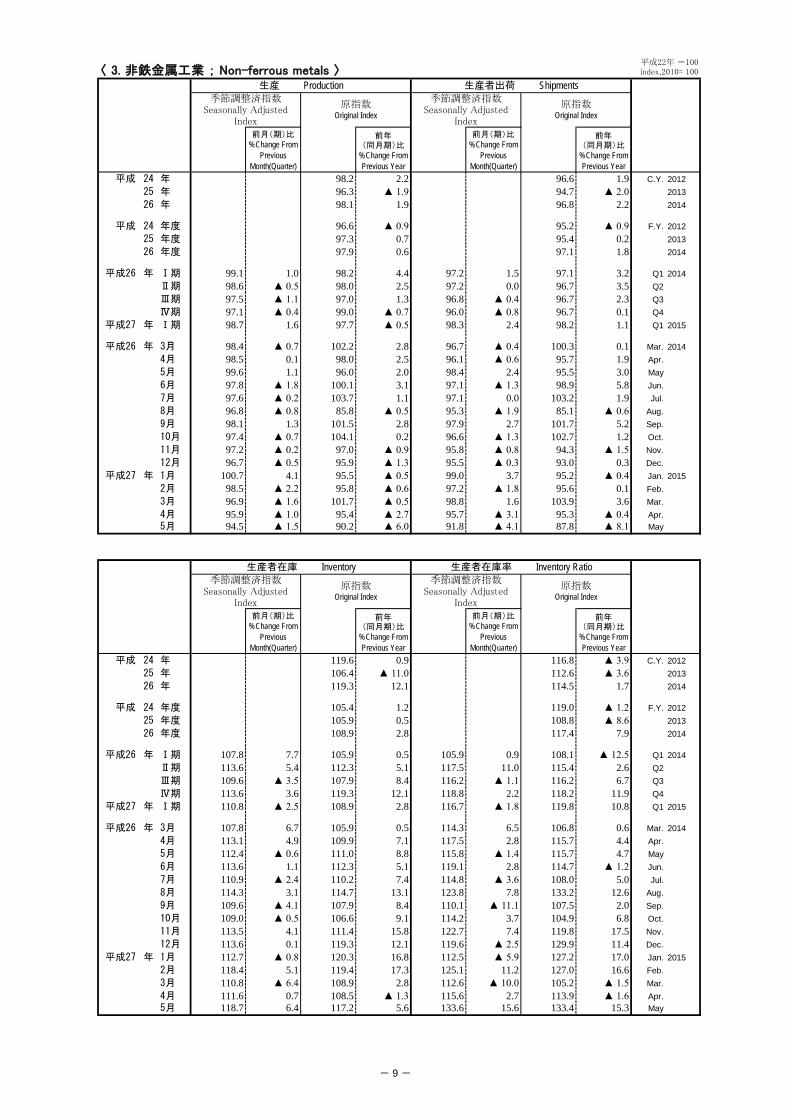
〈 3. 非鉄金属工業 ; Non-ferrous metals 〉
前月(期)比%Change From
PreviousMonth(Quarter)
前年(同月期)比
%Change FromPrevious Year
前月(期)比%Change From
PreviousMonth(Quarter)
前年(同月期)比
%Change FromPrevious Year
平成 24 年 98.2 2.2 96.6 1.9 C.Y. 201225 年 96.3 ▲ 1.9 94.7 ▲ 2.0 201326 年 98.1 1.9 96.8 2.2 2014
平成 24 年度 96.6 ▲ 0.9 95.2 ▲ 0.9 F.Y. 201225 年度 97.3 0.7 95.4 0.2 201326 年度 97.9 0.6 97.1 1.8 2014
平成26 年 Ⅰ期 99.1 1.0 98.2 4.4 97.2 1.5 97.1 3.2 Q1 2014Ⅱ期 98.6 ▲ 0.5 98.0 2.5 97.2 0.0 96.7 3.5 Q2Ⅲ期 97.5 ▲ 1.1 97.0 1.3 96.8 ▲ 0.4 96.7 2.3 Q3Ⅳ期 97.1 ▲ 0.4 99.0 ▲ 0.7 96.0 ▲ 0.8 96.7 0.1 Q4
平成27 年 Ⅰ期 98.7 1.6 97.7 ▲ 0.5 98.3 2.4 98.2 1.1 Q1 2015
平成26 年 3月 98.4 ▲ 0.7 102.2 2.8 96.7 ▲ 0.4 100.3 0.1 Mar. 20144月 98.5 0.1 98.0 2.5 96.1 ▲ 0.6 95.7 1.9 Apr.5月 99.6 1.1 96.0 2.0 98.4 2.4 95.5 3.0 May6月 97.8 ▲ 1.8 100.1 3.1 97.1 ▲ 1.3 98.9 5.8 Jun.7月 97.6 ▲ 0.2 103.7 1.1 97.1 0.0 103.2 1.9 Jul.8月 96.8 ▲ 0.8 85.8 ▲ 0.5 95.3 ▲ 1.9 85.1 ▲ 0.6 Aug.9月 98.1 1.3 101.5 2.8 97.9 2.7 101.7 5.2 Sep.10月 97.4 ▲ 0.7 104.1 0.2 96.6 ▲ 1.3 102.7 1.2 Oct.11月 97.2 ▲ 0.2 97.0 ▲ 0.9 95.8 ▲ 0.8 94.3 ▲ 1.5 Nov.12月 96.7 ▲ 0.5 95.9 ▲ 1.3 95.5 ▲ 0.3 93.0 0.3 Dec.
平成27 年 1月 100.7 4.1 95.5 ▲ 0.5 99.0 3.7 95.2 ▲ 0.4 Jan. 20152月 98.5 ▲ 2.2 95.8 ▲ 0.6 97.2 ▲ 1.8 95.6 0.1 Feb.3月 96.9 ▲ 1.6 101.7 ▲ 0.5 98.8 1.6 103.9 3.6 Mar.4月 95.9 ▲ 1.0 95.4 ▲ 2.7 95.7 ▲ 3.1 95.3 ▲ 0.4 Apr.5月 94.5 ▲ 1.5 90.2 ▲ 6.0 91.8 ▲ 4.1 87.8 ▲ 8.1 May
前月(期)比%Change From
PreviousMonth(Quarter)
前年(同月期)比
%Change FromPrevious Year
前月(期)比%Change From
PreviousMonth(Quarter)
前年(同月期)比
%Change FromPrevious Year
平成 24 年 119.6 0.9 116.8 ▲ 3.9 C.Y. 201225 年 106.4 ▲ 11.0 112.6 ▲ 3.6 201326 年 119.3 12.1 114.5 1.7 2014
平成 24 年度 105.4 1.2 119.0 ▲ 1.2 F.Y. 201225 年度 105.9 0.5 108.8 ▲ 8.6 201326 年度 108.9 2.8 117.4 7.9 2014
平成26 年 Ⅰ期 107.8 7.7 105.9 0.5 105.9 0.9 108.1 ▲ 12.5 Q1 2014Ⅱ期 113.6 5.4 112.3 5.1 117.5 11.0 115.4 2.6 Q2Ⅲ期 109.6 ▲ 3.5 107.9 8.4 116.2 ▲ 1.1 116.2 6.7 Q3Ⅳ期 113.6 3.6 119.3 12.1 118.8 2.2 118.2 11.9 Q4
平成27 年 Ⅰ期 110.8 ▲ 2.5 108.9 2.8 116.7 ▲ 1.8 119.8 10.8 Q1 2015
平成26 年 3月 107.8 6.7 105.9 0.5 114.3 6.5 106.8 0.6 Mar. 20144月 113.1 4.9 109.9 7.1 117.5 2.8 115.7 4.4 Apr.5月 112.4 ▲ 0.6 111.0 8.8 115.8 ▲ 1.4 115.7 4.7 May6月 113.6 1.1 112.3 5.1 119.1 2.8 114.7 ▲ 1.2 Jun.7月 110.9 ▲ 2.4 110.2 7.4 114.8 ▲ 3.6 108.0 5.0 Jul.8月 114.3 3.1 114.7 13.1 123.8 7.8 133.2 12.6 Aug.9月 109.6 ▲ 4.1 107.9 8.4 110.1 ▲ 11.1 107.5 2.0 Sep.10月 109.0 ▲ 0.5 106.6 9.1 114.2 3.7 104.9 6.8 Oct.11月 113.5 4.1 111.4 15.8 122.7 7.4 119.8 17.5 Nov.12月 113.6 0.1 119.3 12.1 119.6 ▲ 2.5 129.9 11.4 Dec.
平成27 年 1月 112.7 ▲ 0.8 120.3 16.8 112.5 ▲ 5.9 127.2 17.0 Jan. 20152月 118.4 5.1 119.4 17.3 125.1 11.2 127.0 16.6 Feb.3月 110.8 ▲ 6.4 108.9 2.8 112.6 ▲ 10.0 105.2 ▲ 1.5 Mar.4月 111.6 0.7 108.5 ▲ 1.3 115.6 2.7 113.9 ▲ 1.6 Apr.5月 118.7 6.4 117.2 5.6 133.6 15.6 133.4 15.3 May
平成22年 =100index,2010= 100
生産 Production 生産者出荷 Shipments季節調整済指数
Seasonally AdjustedIndex
原指数Original Index
季節調整済指数Seasonally Adjusted
Index
原指数Original Index
生産者在庫 Inventory 生産者在庫率 Inventory Ratio季節調整済指数
Seasonally AdjustedIndex
原指数Original Index
季節調整済指数Seasonally Adjusted
Index
原指数Original Index
- 10 -
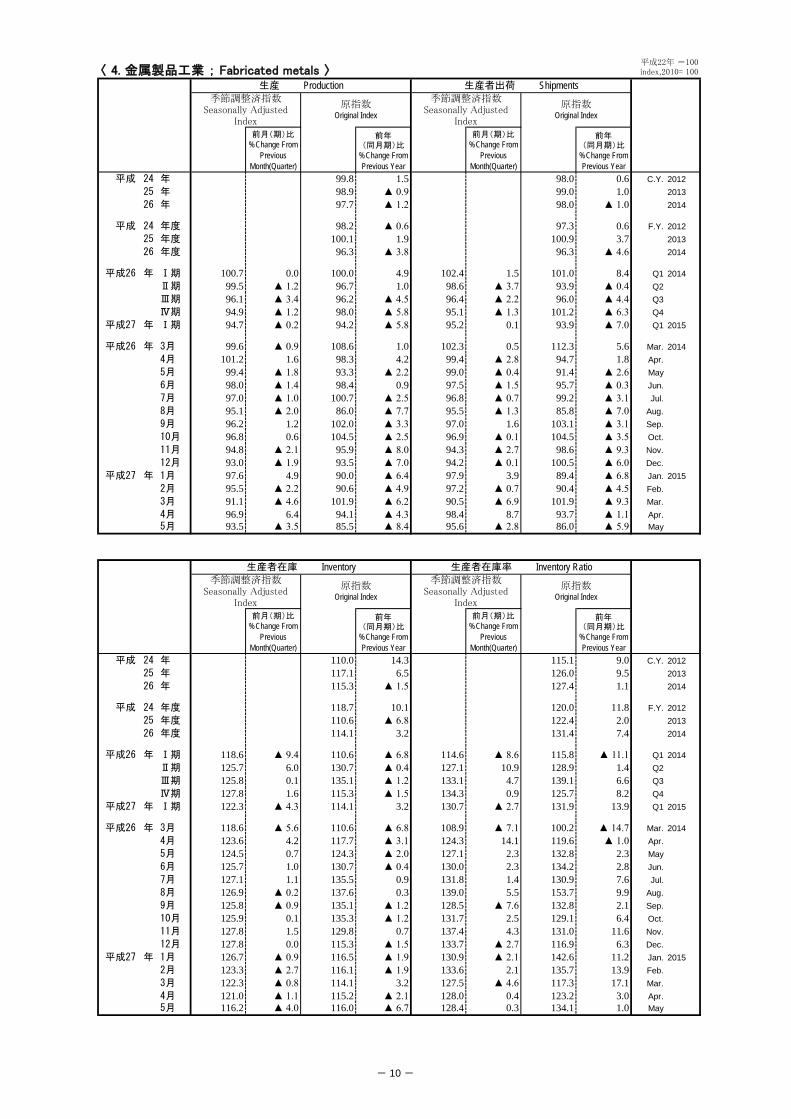
〈 4. 金属製品工業 ; Fabricated metals 〉
前月(期)比%Change From
PreviousMonth(Quarter)
前年(同月期)比
%Change FromPrevious Year
前月(期)比%Change From
PreviousMonth(Quarter)
前年(同月期)比
%Change FromPrevious Year
平成 24 年 99.8 1.5 98.0 0.6 C.Y. 201225 年 98.9 ▲ 0.9 99.0 1.0 201326 年 97.7 ▲ 1.2 98.0 ▲ 1.0 2014
平成 24 年度 98.2 ▲ 0.6 97.3 0.6 F.Y. 201225 年度 100.1 1.9 100.9 3.7 201326 年度 96.3 ▲ 3.8 96.3 ▲ 4.6 2014
平成26 年 Ⅰ期 100.7 0.0 100.0 4.9 102.4 1.5 101.0 8.4 Q1 2014Ⅱ期 99.5 ▲ 1.2 96.7 1.0 98.6 ▲ 3.7 93.9 ▲ 0.4 Q2Ⅲ期 96.1 ▲ 3.4 96.2 ▲ 4.5 96.4 ▲ 2.2 96.0 ▲ 4.4 Q3Ⅳ期 94.9 ▲ 1.2 98.0 ▲ 5.8 95.1 ▲ 1.3 101.2 ▲ 6.3 Q4
平成27 年 Ⅰ期 94.7 ▲ 0.2 94.2 ▲ 5.8 95.2 0.1 93.9 ▲ 7.0 Q1 2015
平成26 年 3月 99.6 ▲ 0.9 108.6 1.0 102.3 0.5 112.3 5.6 Mar. 20144月 101.2 1.6 98.3 4.2 99.4 ▲ 2.8 94.7 1.8 Apr.5月 99.4 ▲ 1.8 93.3 ▲ 2.2 99.0 ▲ 0.4 91.4 ▲ 2.6 May6月 98.0 ▲ 1.4 98.4 0.9 97.5 ▲ 1.5 95.7 ▲ 0.3 Jun.7月 97.0 ▲ 1.0 100.7 ▲ 2.5 96.8 ▲ 0.7 99.2 ▲ 3.1 Jul.8月 95.1 ▲ 2.0 86.0 ▲ 7.7 95.5 ▲ 1.3 85.8 ▲ 7.0 Aug.9月 96.2 1.2 102.0 ▲ 3.3 97.0 1.6 103.1 ▲ 3.1 Sep.10月 96.8 0.6 104.5 ▲ 2.5 96.9 ▲ 0.1 104.5 ▲ 3.5 Oct.11月 94.8 ▲ 2.1 95.9 ▲ 8.0 94.3 ▲ 2.7 98.6 ▲ 9.3 Nov.12月 93.0 ▲ 1.9 93.5 ▲ 7.0 94.2 ▲ 0.1 100.5 ▲ 6.0 Dec.
平成27 年 1月 97.6 4.9 90.0 ▲ 6.4 97.9 3.9 89.4 ▲ 6.8 Jan. 20152月 95.5 ▲ 2.2 90.6 ▲ 4.9 97.2 ▲ 0.7 90.4 ▲ 4.5 Feb.3月 91.1 ▲ 4.6 101.9 ▲ 6.2 90.5 ▲ 6.9 101.9 ▲ 9.3 Mar.4月 96.9 6.4 94.1 ▲ 4.3 98.4 8.7 93.7 ▲ 1.1 Apr.5月 93.5 ▲ 3.5 85.5 ▲ 8.4 95.6 ▲ 2.8 86.0 ▲ 5.9 May
前月(期)比%Change From
PreviousMonth(Quarter)
前年(同月期)比
%Change FromPrevious Year
前月(期)比%Change From
PreviousMonth(Quarter)
前年(同月期)比
%Change FromPrevious Year
平成 24 年 110.0 14.3 115.1 9.0 C.Y. 201225 年 117.1 6.5 126.0 9.5 201326 年 115.3 ▲ 1.5 127.4 1.1 2014
平成 24 年度 118.7 10.1 120.0 11.8 F.Y. 201225 年度 110.6 ▲ 6.8 122.4 2.0 201326 年度 114.1 3.2 131.4 7.4 2014
平成26 年 Ⅰ期 118.6 ▲ 9.4 110.6 ▲ 6.8 114.6 ▲ 8.6 115.8 ▲ 11.1 Q1 2014Ⅱ期 125.7 6.0 130.7 ▲ 0.4 127.1 10.9 128.9 1.4 Q2Ⅲ期 125.8 0.1 135.1 ▲ 1.2 133.1 4.7 139.1 6.6 Q3Ⅳ期 127.8 1.6 115.3 ▲ 1.5 134.3 0.9 125.7 8.2 Q4
平成27 年 Ⅰ期 122.3 ▲ 4.3 114.1 3.2 130.7 ▲ 2.7 131.9 13.9 Q1 2015
平成26 年 3月 118.6 ▲ 5.6 110.6 ▲ 6.8 108.9 ▲ 7.1 100.2 ▲ 14.7 Mar. 20144月 123.6 4.2 117.7 ▲ 3.1 124.3 14.1 119.6 ▲ 1.0 Apr.5月 124.5 0.7 124.3 ▲ 2.0 127.1 2.3 132.8 2.3 May6月 125.7 1.0 130.7 ▲ 0.4 130.0 2.3 134.2 2.8 Jun.7月 127.1 1.1 135.5 0.9 131.8 1.4 130.9 7.6 Jul.8月 126.9 ▲ 0.2 137.6 0.3 139.0 5.5 153.7 9.9 Aug.9月 125.8 ▲ 0.9 135.1 ▲ 1.2 128.5 ▲ 7.6 132.8 2.1 Sep.10月 125.9 0.1 135.3 ▲ 1.2 131.7 2.5 129.1 6.4 Oct.11月 127.8 1.5 129.8 0.7 137.4 4.3 131.0 11.6 Nov.12月 127.8 0.0 115.3 ▲ 1.5 133.7 ▲ 2.7 116.9 6.3 Dec.
平成27 年 1月 126.7 ▲ 0.9 116.5 ▲ 1.9 130.9 ▲ 2.1 142.6 11.2 Jan. 20152月 123.3 ▲ 2.7 116.1 ▲ 1.9 133.6 2.1 135.7 13.9 Feb.3月 122.3 ▲ 0.8 114.1 3.2 127.5 ▲ 4.6 117.3 17.1 Mar.4月 121.0 ▲ 1.1 115.2 ▲ 2.1 128.0 0.4 123.2 3.0 Apr.5月 116.2 ▲ 4.0 116.0 ▲ 6.7 128.4 0.3 134.1 1.0 May
平成22年 =100index,2010= 100
生産 Production 生産者出荷 Shipments季節調整済指数
Seasonally AdjustedIndex
原指数Original Index
季節調整済指数Seasonally Adjusted
Index
原指数Original Index
生産者在庫 Inventory 生産者在庫率 Inventory Ratio季節調整済指数
Seasonally AdjustedIndex
原指数Original Index
季節調整済指数Seasonally Adjusted
Index
原指数Original Index
- 11 -
前月(期)比%Change From
PreviousMonth(Quarter)
前年(同月期)比
%Change FromPrevious Year
前月(期)比%Change From
PreviousMonth(Quarter)
前年(同月期)比
%Change FromPrevious Year
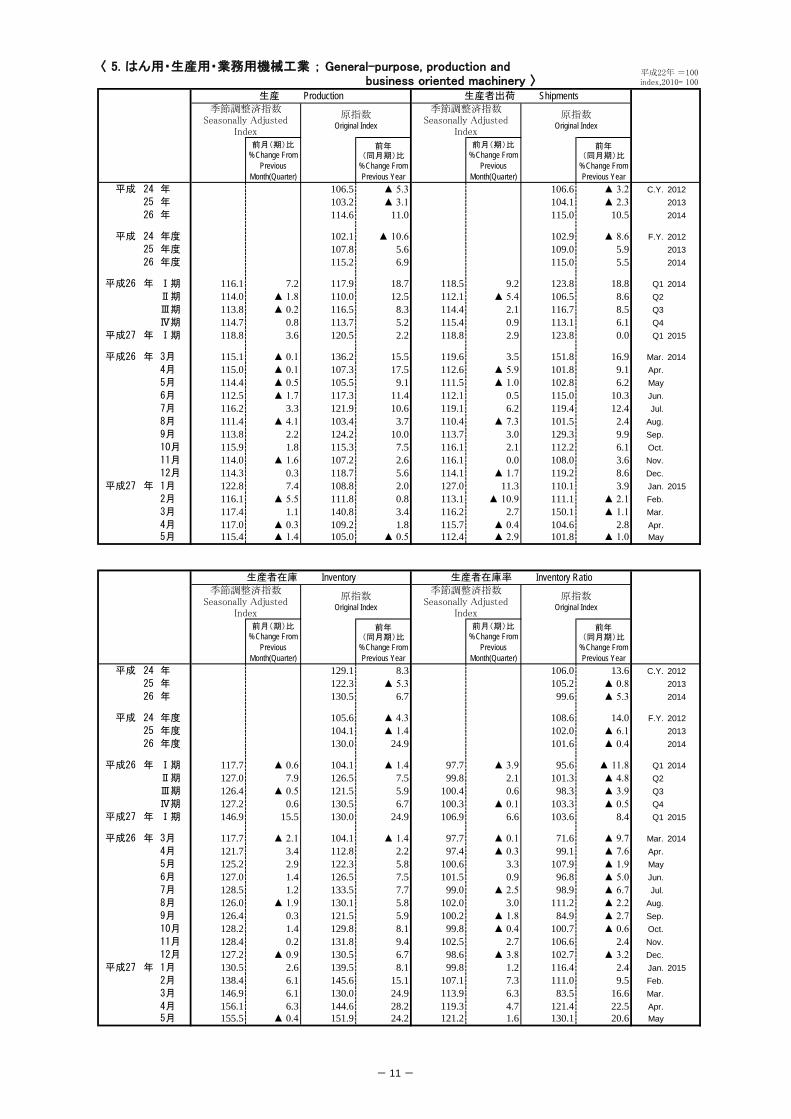
平成 24 年 106.5 ▲ 5.3 106.6 ▲ 3.2 C.Y. 201225 年 103.2 ▲ 3.1 104.1 ▲ 2.3 201326 年 114.6 11.0 115.0 10.5 2014
平成 24 年度 102.1 ▲ 10.6 102.9 ▲ 8.6 F.Y. 201225 年度 107.8 5.6 109.0 5.9 201326 年度 115.2 6.9 115.0 5.5 2014
平成26 年 Ⅰ期 116.1 7.2 117.9 18.7 118.5 9.2 123.8 18.8 Q1 2014Ⅱ期 114.0 ▲ 1.8 110.0 12.5 112.1 ▲ 5.4 106.5 8.6 Q2Ⅲ期 113.8 ▲ 0.2 116.5 8.3 114.4 2.1 116.7 8.5 Q3Ⅳ期 114.7 0.8 113.7 5.2 115.4 0.9 113.1 6.1 Q4
平成27 年 Ⅰ期 118.8 3.6 120.5 2.2 118.8 2.9 123.8 0.0 Q1 2015
平成26 年 3月 115.1 ▲ 0.1 136.2 15.5 119.6 3.5 151.8 16.9 Mar. 20144月 115.0 ▲ 0.1 107.3 17.5 112.6 ▲ 5.9 101.8 9.1 Apr.5月 114.4 ▲ 0.5 105.5 9.1 111.5 ▲ 1.0 102.8 6.2 May6月 112.5 ▲ 1.7 117.3 11.4 112.1 0.5 115.0 10.3 Jun.7月 116.2 3.3 121.9 10.6 119.1 6.2 119.4 12.4 Jul.8月 111.4 ▲ 4.1 103.4 3.7 110.4 ▲ 7.3 101.5 2.4 Aug.9月 113.8 2.2 124.2 10.0 113.7 3.0 129.3 9.9 Sep.10月 115.9 1.8 115.3 7.5 116.1 2.1 112.2 6.1 Oct.11月 114.0 ▲ 1.6 107.2 2.6 116.1 0.0 108.0 3.6 Nov.12月 114.3 0.3 118.7 5.6 114.1 ▲ 1.7 119.2 8.6 Dec.
平成27 年 1月 122.8 7.4 108.8 2.0 127.0 11.3 110.1 3.9 Jan. 20152月 116.1 ▲ 5.5 111.8 0.8 113.1 ▲ 10.9 111.1 ▲ 2.1 Feb.3月 117.4 1.1 140.8 3.4 116.2 2.7 150.1 ▲ 1.1 Mar.4月 117.0 ▲ 0.3 109.2 1.8 115.7 ▲ 0.4 104.6 2.8 Apr.5月 115.4 ▲ 1.4 105.0 ▲ 0.5 112.4 ▲ 2.9 101.8 ▲ 1.0 May
前月(期)比%Change From
PreviousMonth(Quarter)
前年(同月期)比
%Change FromPrevious Year
前月(期)比%Change From
PreviousMonth(Quarter)
前年(同月期)比
%Change FromPrevious Year
平成 24 年 129.1 8.3 106.0 13.6 C.Y. 201225 年 122.3 ▲ 5.3 105.2 ▲ 0.8 201326 年 130.5 6.7 99.6 ▲ 5.3 2014
平成 24 年度 105.6 ▲ 4.3 108.6 14.0 F.Y. 201225 年度 104.1 ▲ 1.4 102.0 ▲ 6.1 201326 年度 130.0 24.9 101.6 ▲ 0.4 2014
平成26 年 Ⅰ期 117.7 ▲ 0.6 104.1 ▲ 1.4 97.7 ▲ 3.9 95.6 ▲ 11.8 Q1 2014Ⅱ期 127.0 7.9 126.5 7.5 99.8 2.1 101.3 ▲ 4.8 Q2Ⅲ期 126.4 ▲ 0.5 121.5 5.9 100.4 0.6 98.3 ▲ 3.9 Q3Ⅳ期 127.2 0.6 130.5 6.7 100.3 ▲ 0.1 103.3 ▲ 0.5 Q4
平成27 年 Ⅰ期 146.9 15.5 130.0 24.9 106.9 6.6 103.6 8.4 Q1 2015
平成26 年 3月 117.7 ▲ 2.1 104.1 ▲ 1.4 97.7 ▲ 0.1 71.6 ▲ 9.7 Mar. 20144月 121.7 3.4 112.8 2.2 97.4 ▲ 0.3 99.1 ▲ 7.6 Apr.5月 125.2 2.9 122.3 5.8 100.6 3.3 107.9 ▲ 1.9 May6月 127.0 1.4 126.5 7.5 101.5 0.9 96.8 ▲ 5.0 Jun.7月 128.5 1.2 133.5 7.7 99.0 ▲ 2.5 98.9 ▲ 6.7 Jul.8月 126.0 ▲ 1.9 130.1 5.8 102.0 3.0 111.2 ▲ 2.2 Aug.9月 126.4 0.3 121.5 5.9 100.2 ▲ 1.8 84.9 ▲ 2.7 Sep.10月 128.2 1.4 129.8 8.1 99.8 ▲ 0.4 100.7 ▲ 0.6 Oct.11月 128.4 0.2 131.8 9.4 102.5 2.7 106.6 2.4 Nov.12月 127.2 ▲ 0.9 130.5 6.7 98.6 ▲ 3.8 102.7 ▲ 3.2 Dec.
平成27 年 1月 130.5 2.6 139.5 8.1 99.8 1.2 116.4 2.4 Jan. 20152月 138.4 6.1 145.6 15.1 107.1 7.3 111.0 9.5 Feb.3月 146.9 6.1 130.0 24.9 113.9 6.3 83.5 16.6 Mar.4月 156.1 6.3 144.6 28.2 119.3 4.7 121.4 22.5 Apr.5月 155.5 ▲ 0.4 151.9 24.2 121.2 1.6 130.1 20.6 May
〈 5. はん用・生産用・業務用機械工業 ; General-purpose, production and business oriented machinery 〉
平成22年 =100index,2010= 100
生産 Production 生産者出荷 Shipments季節調整済指数
Seasonally AdjustedIndex
原指数Original Index
季節調整済指数Seasonally Adjusted
Index
原指数Original Index
生産者在庫 Inventory 生産者在庫率 Inventory Ratio季節調整済指数
Seasonally AdjustedIndex
原指数Original Index
季節調整済指数Seasonally Adjusted
Index
原指数Original Index
- 12 -
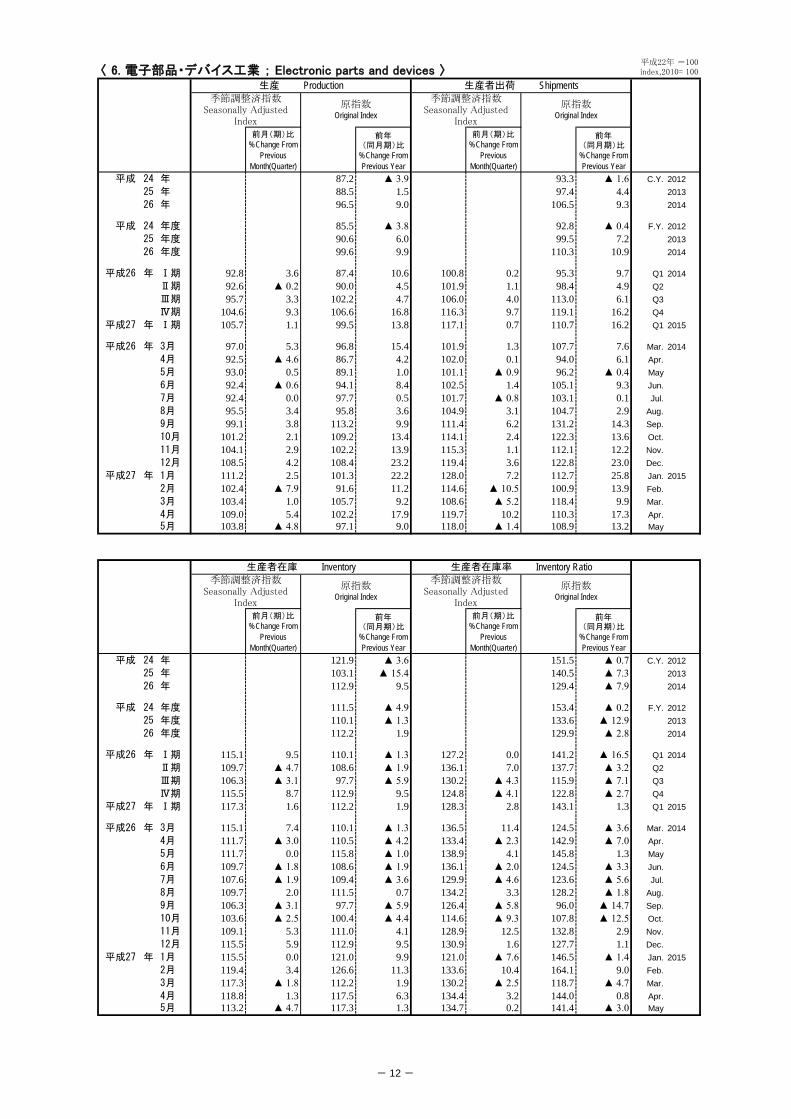
〈 6. 電子部品・デバイス工業 ; Electronic parts and devices 〉
前月(期)比%Change From
PreviousMonth(Quarter)
前年(同月期)比
%Change FromPrevious Year
前月(期)比%Change From
PreviousMonth(Quarter)
前年(同月期)比
%Change FromPrevious Year
平成 24 年 87.2 ▲ 3.9 93.3 ▲ 1.6 C.Y. 201225 年 88.5 1.5 97.4 4.4 201326 年 96.5 9.0 106.5 9.3 2014
平成 24 年度 85.5 ▲ 3.8 92.8 ▲ 0.4 F.Y. 201225 年度 90.6 6.0 99.5 7.2 201326 年度 99.6 9.9 110.3 10.9 2014
平成26 年 Ⅰ期 92.8 3.6 87.4 10.6 100.8 0.2 95.3 9.7 Q1 2014Ⅱ期 92.6 ▲ 0.2 90.0 4.5 101.9 1.1 98.4 4.9 Q2Ⅲ期 95.7 3.3 102.2 4.7 106.0 4.0 113.0 6.1 Q3Ⅳ期 104.6 9.3 106.6 16.8 116.3 9.7 119.1 16.2 Q4
平成27 年 Ⅰ期 105.7 1.1 99.5 13.8 117.1 0.7 110.7 16.2 Q1 2015
平成26 年 3月 97.0 5.3 96.8 15.4 101.9 1.3 107.7 7.6 Mar. 20144月 92.5 ▲ 4.6 86.7 4.2 102.0 0.1 94.0 6.1 Apr.5月 93.0 0.5 89.1 1.0 101.1 ▲ 0.9 96.2 ▲ 0.4 May6月 92.4 ▲ 0.6 94.1 8.4 102.5 1.4 105.1 9.3 Jun.7月 92.4 0.0 97.7 0.5 101.7 ▲ 0.8 103.1 0.1 Jul.8月 95.5 3.4 95.8 3.6 104.9 3.1 104.7 2.9 Aug.9月 99.1 3.8 113.2 9.9 111.4 6.2 131.2 14.3 Sep.10月 101.2 2.1 109.2 13.4 114.1 2.4 122.3 13.6 Oct.11月 104.1 2.9 102.2 13.9 115.3 1.1 112.1 12.2 Nov.12月 108.5 4.2 108.4 23.2 119.4 3.6 122.8 23.0 Dec.
平成27 年 1月 111.2 2.5 101.3 22.2 128.0 7.2 112.7 25.8 Jan. 20152月 102.4 ▲ 7.9 91.6 11.2 114.6 ▲ 10.5 100.9 13.9 Feb.3月 103.4 1.0 105.7 9.2 108.6 ▲ 5.2 118.4 9.9 Mar.4月 109.0 5.4 102.2 17.9 119.7 10.2 110.3 17.3 Apr.5月 103.8 ▲ 4.8 97.1 9.0 118.0 ▲ 1.4 108.9 13.2 May
前月(期)比%Change From
PreviousMonth(Quarter)
前年(同月期)比
%Change FromPrevious Year
前月(期)比%Change From
PreviousMonth(Quarter)
前年(同月期)比
%Change FromPrevious Year
平成 24 年 121.9 ▲ 3.6 151.5 ▲ 0.7 C.Y. 201225 年 103.1 ▲ 15.4 140.5 ▲ 7.3 201326 年 112.9 9.5 129.4 ▲ 7.9 2014
平成 24 年度 111.5 ▲ 4.9 153.4 ▲ 0.2 F.Y. 201225 年度 110.1 ▲ 1.3 133.6 ▲ 12.9 201326 年度 112.2 1.9 129.9 ▲ 2.8 2014
平成26 年 Ⅰ期 115.1 9.5 110.1 ▲ 1.3 127.2 0.0 141.2 ▲ 16.5 Q1 2014Ⅱ期 109.7 ▲ 4.7 108.6 ▲ 1.9 136.1 7.0 137.7 ▲ 3.2 Q2Ⅲ期 106.3 ▲ 3.1 97.7 ▲ 5.9 130.2 ▲ 4.3 115.9 ▲ 7.1 Q3Ⅳ期 115.5 8.7 112.9 9.5 124.8 ▲ 4.1 122.8 ▲ 2.7 Q4
平成27 年 Ⅰ期 117.3 1.6 112.2 1.9 128.3 2.8 143.1 1.3 Q1 2015
平成26 年 3月 115.1 7.4 110.1 ▲ 1.3 136.5 11.4 124.5 ▲ 3.6 Mar. 20144月 111.7 ▲ 3.0 110.5 ▲ 4.2 133.4 ▲ 2.3 142.9 ▲ 7.0 Apr.5月 111.7 0.0 115.8 ▲ 1.0 138.9 4.1 145.8 1.3 May6月 109.7 ▲ 1.8 108.6 ▲ 1.9 136.1 ▲ 2.0 124.5 ▲ 3.3 Jun.7月 107.6 ▲ 1.9 109.4 ▲ 3.6 129.9 ▲ 4.6 123.6 ▲ 5.6 Jul.8月 109.7 2.0 111.5 0.7 134.2 3.3 128.2 ▲ 1.8 Aug.9月 106.3 ▲ 3.1 97.7 ▲ 5.9 126.4 ▲ 5.8 96.0 ▲ 14.7 Sep.10月 103.6 ▲ 2.5 100.4 ▲ 4.4 114.6 ▲ 9.3 107.8 ▲ 12.5 Oct.11月 109.1 5.3 111.0 4.1 128.9 12.5 132.8 2.9 Nov.12月 115.5 5.9 112.9 9.5 130.9 1.6 127.7 1.1 Dec.
平成27 年 1月 115.5 0.0 121.0 9.9 121.0 ▲ 7.6 146.5 ▲ 1.4 Jan. 20152月 119.4 3.4 126.6 11.3 133.6 10.4 164.1 9.0 Feb.3月 117.3 ▲ 1.8 112.2 1.9 130.2 ▲ 2.5 118.7 ▲ 4.7 Mar.4月 118.8 1.3 117.5 6.3 134.4 3.2 144.0 0.8 Apr.5月 113.2 ▲ 4.7 117.3 1.3 134.7 0.2 141.4 ▲ 3.0 May
平成22年 =100index,2010= 100
生産 Production 生産者出荷 Shipments季節調整済指数
Seasonally AdjustedIndex
原指数Original Index
季節調整済指数Seasonally Adjusted
Index
原指数Original Index
生産者在庫 Inventory 生産者在庫率 Inventory Ratio季節調整済指数
Seasonally AdjustedIndex
原指数Original Index
季節調整済指数Seasonally Adjusted
Index
原指数Original Index
- 13 -
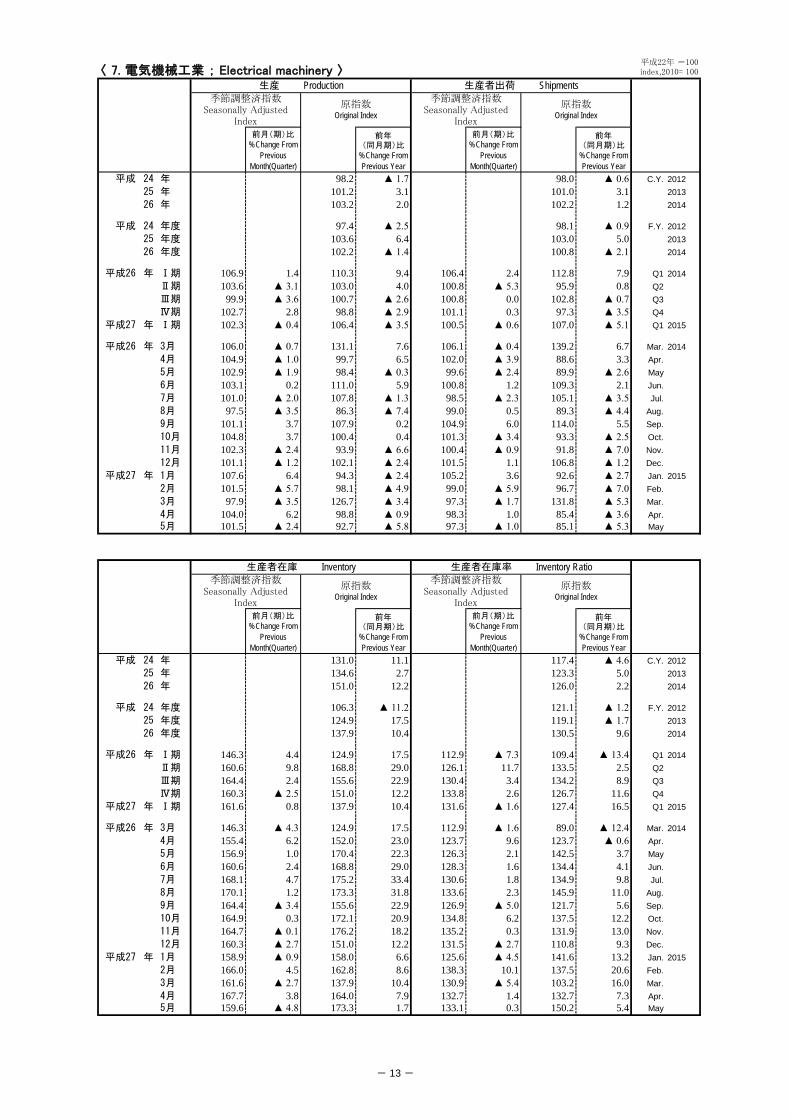
〈 7. 電気機械工業 ; Electrical machinery 〉
前月(期)比%Change From
PreviousMonth(Quarter)
前年(同月期)比
%Change FromPrevious Year
前月(期)比%Change From
PreviousMonth(Quarter)
前年(同月期)比
%Change FromPrevious Year
平成 24 年 98.2 ▲ 1.7 98.0 ▲ 0.6 C.Y. 201225 年 101.2 3.1 101.0 3.1 201326 年 103.2 2.0 102.2 1.2 2014
平成 24 年度 97.4 ▲ 2.5 98.1 ▲ 0.9 F.Y. 201225 年度 103.6 6.4 103.0 5.0 201326 年度 102.2 ▲ 1.4 100.8 ▲ 2.1 2014
平成26 年 Ⅰ期 106.9 1.4 110.3 9.4 106.4 2.4 112.8 7.9 Q1 2014Ⅱ期 103.6 ▲ 3.1 103.0 4.0 100.8 ▲ 5.3 95.9 0.8 Q2Ⅲ期 99.9 ▲ 3.6 100.7 ▲ 2.6 100.8 0.0 102.8 ▲ 0.7 Q3Ⅳ期 102.7 2.8 98.8 ▲ 2.9 101.1 0.3 97.3 ▲ 3.5 Q4
平成27 年 Ⅰ期 102.3 ▲ 0.4 106.4 ▲ 3.5 100.5 ▲ 0.6 107.0 ▲ 5.1 Q1 2015
平成26 年 3月 106.0 ▲ 0.7 131.1 7.6 106.1 ▲ 0.4 139.2 6.7 Mar. 20144月 104.9 ▲ 1.0 99.7 6.5 102.0 ▲ 3.9 88.6 3.3 Apr.5月 102.9 ▲ 1.9 98.4 ▲ 0.3 99.6 ▲ 2.4 89.9 ▲ 2.6 May6月 103.1 0.2 111.0 5.9 100.8 1.2 109.3 2.1 Jun.7月 101.0 ▲ 2.0 107.8 ▲ 1.3 98.5 ▲ 2.3 105.1 ▲ 3.5 Jul.8月 97.5 ▲ 3.5 86.3 ▲ 7.4 99.0 0.5 89.3 ▲ 4.4 Aug.9月 101.1 3.7 107.9 0.2 104.9 6.0 114.0 5.5 Sep.10月 104.8 3.7 100.4 0.4 101.3 ▲ 3.4 93.3 ▲ 2.5 Oct.11月 102.3 ▲ 2.4 93.9 ▲ 6.6 100.4 ▲ 0.9 91.8 ▲ 7.0 Nov.12月 101.1 ▲ 1.2 102.1 ▲ 2.4 101.5 1.1 106.8 ▲ 1.2 Dec.
平成27 年 1月 107.6 6.4 94.3 ▲ 2.4 105.2 3.6 92.6 ▲ 2.7 Jan. 20152月 101.5 ▲ 5.7 98.1 ▲ 4.9 99.0 ▲ 5.9 96.7 ▲ 7.0 Feb.3月 97.9 ▲ 3.5 126.7 ▲ 3.4 97.3 ▲ 1.7 131.8 ▲ 5.3 Mar.4月 104.0 6.2 98.8 ▲ 0.9 98.3 1.0 85.4 ▲ 3.6 Apr.5月 101.5 ▲ 2.4 92.7 ▲ 5.8 97.3 ▲ 1.0 85.1 ▲ 5.3 May
前月(期)比%Change From
PreviousMonth(Quarter)
前年(同月期)比
%Change FromPrevious Year
前月(期)比%Change From
PreviousMonth(Quarter)
前年(同月期)比
%Change FromPrevious Year
平成 24 年 131.0 11.1 117.4 ▲ 4.6 C.Y. 201225 年 134.6 2.7 123.3 5.0 201326 年 151.0 12.2 126.0 2.2 2014
平成 24 年度 106.3 ▲ 11.2 121.1 ▲ 1.2 F.Y. 201225 年度 124.9 17.5 119.1 ▲ 1.7 201326 年度 137.9 10.4 130.5 9.6 2014
平成26 年 Ⅰ期 146.3 4.4 124.9 17.5 112.9 ▲ 7.3 109.4 ▲ 13.4 Q1 2014Ⅱ期 160.6 9.8 168.8 29.0 126.1 11.7 133.5 2.5 Q2Ⅲ期 164.4 2.4 155.6 22.9 130.4 3.4 134.2 8.9 Q3Ⅳ期 160.3 ▲ 2.5 151.0 12.2 133.8 2.6 126.7 11.6 Q4
平成27 年 Ⅰ期 161.6 0.8 137.9 10.4 131.6 ▲ 1.6 127.4 16.5 Q1 2015
平成26 年 3月 146.3 ▲ 4.3 124.9 17.5 112.9 ▲ 1.6 89.0 ▲ 12.4 Mar. 20144月 155.4 6.2 152.0 23.0 123.7 9.6 123.7 ▲ 0.6 Apr.5月 156.9 1.0 170.4 22.3 126.3 2.1 142.5 3.7 May6月 160.6 2.4 168.8 29.0 128.3 1.6 134.4 4.1 Jun.7月 168.1 4.7 175.2 33.4 130.6 1.8 134.9 9.8 Jul.8月 170.1 1.2 173.3 31.8 133.6 2.3 145.9 11.0 Aug.9月 164.4 ▲ 3.4 155.6 22.9 126.9 ▲ 5.0 121.7 5.6 Sep.10月 164.9 0.3 172.1 20.9 134.8 6.2 137.5 12.2 Oct.11月 164.7 ▲ 0.1 176.2 18.2 135.2 0.3 131.9 13.0 Nov.12月 160.3 ▲ 2.7 151.0 12.2 131.5 ▲ 2.7 110.8 9.3 Dec.
平成27 年 1月 158.9 ▲ 0.9 158.0 6.6 125.6 ▲ 4.5 141.6 13.2 Jan. 20152月 166.0 4.5 162.8 8.6 138.3 10.1 137.5 20.6 Feb.3月 161.6 ▲ 2.7 137.9 10.4 130.9 ▲ 5.4 103.2 16.0 Mar.4月 167.7 3.8 164.0 7.9 132.7 1.4 132.7 7.3 Apr.5月 159.6 ▲ 4.8 173.3 1.7 133.1 0.3 150.2 5.4 May
平成22年 =100index,2010= 100
生産 Production 生産者出荷 Shipments季節調整済指数
Seasonally AdjustedIndex
原指数Original Index
季節調整済指数Seasonally Adjusted
Index
原指数Original Index
生産者在庫 Inventory 生産者在庫率 Inventory Ratio季節調整済指数
Seasonally AdjustedIndex
原指数Original Index
季節調整済指数Seasonally Adjusted
Index
原指数Original Index
- 14 -
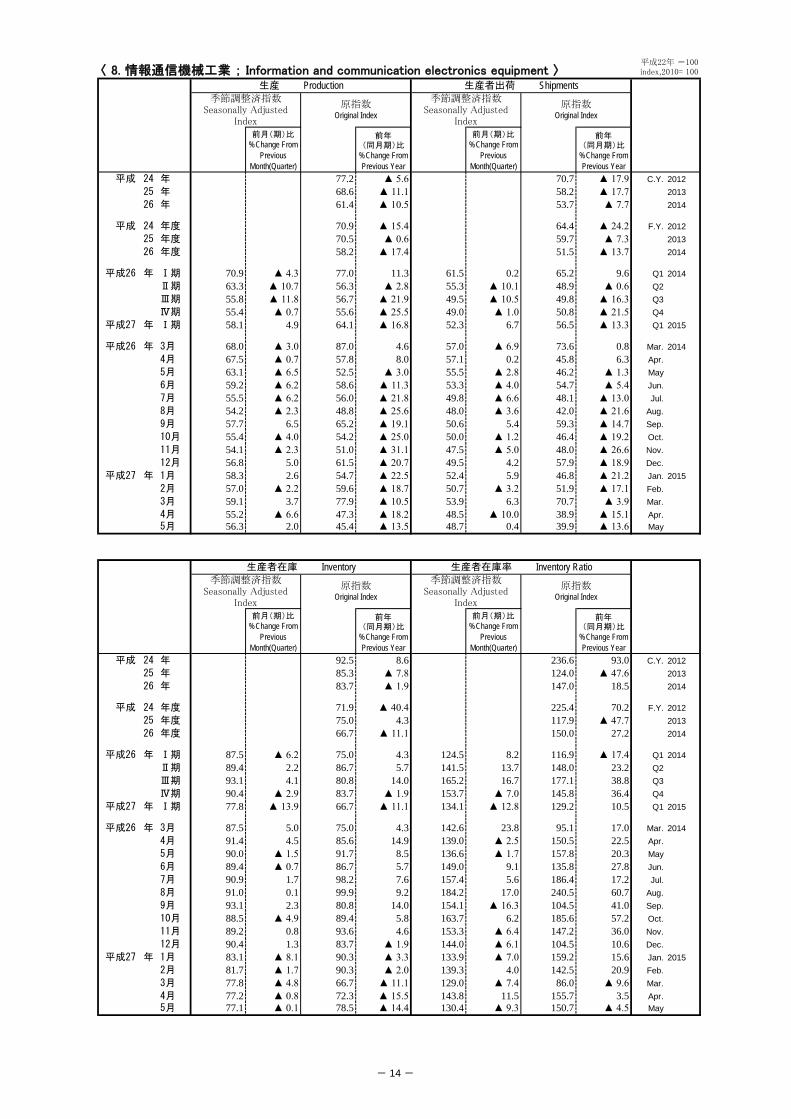
〈 8. 情報通信機械工業 ; Information and communication electronics equipment 〉
前月(期)比%Change From
PreviousMonth(Quarter)
前年(同月期)比
%Change FromPrevious Year
前月(期)比%Change From
PreviousMonth(Quarter)
前年(同月期)比
%Change FromPrevious Year
平成 24 年 77.2 ▲ 5.6 70.7 ▲ 17.9 C.Y. 201225 年 68.6 ▲ 11.1 58.2 ▲ 17.7 201326 年 61.4 ▲ 10.5 53.7 ▲ 7.7 2014
平成 24 年度 70.9 ▲ 15.4 64.4 ▲ 24.2 F.Y. 201225 年度 70.5 ▲ 0.6 59.7 ▲ 7.3 201326 年度 58.2 ▲ 17.4 51.5 ▲ 13.7 2014
平成26 年 Ⅰ期 70.9 ▲ 4.3 77.0 11.3 61.5 0.2 65.2 9.6 Q1 2014Ⅱ期 63.3 ▲ 10.7 56.3 ▲ 2.8 55.3 ▲ 10.1 48.9 ▲ 0.6 Q2Ⅲ期 55.8 ▲ 11.8 56.7 ▲ 21.9 49.5 ▲ 10.5 49.8 ▲ 16.3 Q3Ⅳ期 55.4 ▲ 0.7 55.6 ▲ 25.5 49.0 ▲ 1.0 50.8 ▲ 21.5 Q4
平成27 年 Ⅰ期 58.1 4.9 64.1 ▲ 16.8 52.3 6.7 56.5 ▲ 13.3 Q1 2015
平成26 年 3月 68.0 ▲ 3.0 87.0 4.6 57.0 ▲ 6.9 73.6 0.8 Mar. 20144月 67.5 ▲ 0.7 57.8 8.0 57.1 0.2 45.8 6.3 Apr.5月 63.1 ▲ 6.5 52.5 ▲ 3.0 55.5 ▲ 2.8 46.2 ▲ 1.3 May6月 59.2 ▲ 6.2 58.6 ▲ 11.3 53.3 ▲ 4.0 54.7 ▲ 5.4 Jun.7月 55.5 ▲ 6.2 56.0 ▲ 21.8 49.8 ▲ 6.6 48.1 ▲ 13.0 Jul.8月 54.2 ▲ 2.3 48.8 ▲ 25.6 48.0 ▲ 3.6 42.0 ▲ 21.6 Aug.9月 57.7 6.5 65.2 ▲ 19.1 50.6 5.4 59.3 ▲ 14.7 Sep.10月 55.4 ▲ 4.0 54.2 ▲ 25.0 50.0 ▲ 1.2 46.4 ▲ 19.2 Oct.11月 54.1 ▲ 2.3 51.0 ▲ 31.1 47.5 ▲ 5.0 48.0 ▲ 26.6 Nov.12月 56.8 5.0 61.5 ▲ 20.7 49.5 4.2 57.9 ▲ 18.9 Dec.
平成27 年 1月 58.3 2.6 54.7 ▲ 22.5 52.4 5.9 46.8 ▲ 21.2 Jan. 20152月 57.0 ▲ 2.2 59.6 ▲ 18.7 50.7 ▲ 3.2 51.9 ▲ 17.1 Feb.3月 59.1 3.7 77.9 ▲ 10.5 53.9 6.3 70.7 ▲ 3.9 Mar.4月 55.2 ▲ 6.6 47.3 ▲ 18.2 48.5 ▲ 10.0 38.9 ▲ 15.1 Apr.5月 56.3 2.0 45.4 ▲ 13.5 48.7 0.4 39.9 ▲ 13.6 May
前月(期)比%Change From
PreviousMonth(Quarter)
前年(同月期)比
%Change FromPrevious Year
前月(期)比%Change From
PreviousMonth(Quarter)
前年(同月期)比
%Change FromPrevious Year
平成 24 年 92.5 8.6 236.6 93.0 C.Y. 201225 年 85.3 ▲ 7.8 124.0 ▲ 47.6 201326 年 83.7 ▲ 1.9 147.0 18.5 2014
平成 24 年度 71.9 ▲ 40.4 225.4 70.2 F.Y. 201225 年度 75.0 4.3 117.9 ▲ 47.7 201326 年度 66.7 ▲ 11.1 150.0 27.2 2014
平成26 年 Ⅰ期 87.5 ▲ 6.2 75.0 4.3 124.5 8.2 116.9 ▲ 17.4 Q1 2014Ⅱ期 89.4 2.2 86.7 5.7 141.5 13.7 148.0 23.2 Q2Ⅲ期 93.1 4.1 80.8 14.0 165.2 16.7 177.1 38.8 Q3Ⅳ期 90.4 ▲ 2.9 83.7 ▲ 1.9 153.7 ▲ 7.0 145.8 36.4 Q4
平成27 年 Ⅰ期 77.8 ▲ 13.9 66.7 ▲ 11.1 134.1 ▲ 12.8 129.2 10.5 Q1 2015
平成26 年 3月 87.5 5.0 75.0 4.3 142.6 23.8 95.1 17.0 Mar. 20144月 91.4 4.5 85.6 14.9 139.0 ▲ 2.5 150.5 22.5 Apr.5月 90.0 ▲ 1.5 91.7 8.5 136.6 ▲ 1.7 157.8 20.3 May6月 89.4 ▲ 0.7 86.7 5.7 149.0 9.1 135.8 27.8 Jun.7月 90.9 1.7 98.2 7.6 157.4 5.6 186.4 17.2 Jul.8月 91.0 0.1 99.9 9.2 184.2 17.0 240.5 60.7 Aug.9月 93.1 2.3 80.8 14.0 154.1 ▲ 16.3 104.5 41.0 Sep.10月 88.5 ▲ 4.9 89.4 5.8 163.7 6.2 185.6 57.2 Oct.11月 89.2 0.8 93.6 4.6 153.3 ▲ 6.4 147.2 36.0 Nov.12月 90.4 1.3 83.7 ▲ 1.9 144.0 ▲ 6.1 104.5 10.6 Dec.
平成27 年 1月 83.1 ▲ 8.1 90.3 ▲ 3.3 133.9 ▲ 7.0 159.2 15.6 Jan. 20152月 81.7 ▲ 1.7 90.3 ▲ 2.0 139.3 4.0 142.5 20.9 Feb.3月 77.8 ▲ 4.8 66.7 ▲ 11.1 129.0 ▲ 7.4 86.0 ▲ 9.6 Mar.4月 77.2 ▲ 0.8 72.3 ▲ 15.5 143.8 11.5 155.7 3.5 Apr.5月 77.1 ▲ 0.1 78.5 ▲ 14.4 130.4 ▲ 9.3 150.7 ▲ 4.5 May
平成22年 =100index,2010= 100
生産 Production 生産者出荷 Shipments季節調整済指数
Seasonally AdjustedIndex
原指数Original Index
季節調整済指数Seasonally Adjusted
Index
原指数Original Index
生産者在庫 Inventory 生産者在庫率 Inventory Ratio季節調整済指数
Seasonally AdjustedIndex
原指数Original Index
季節調整済指数Seasonally Adjusted
Index
原指数Original Index
- 15 -
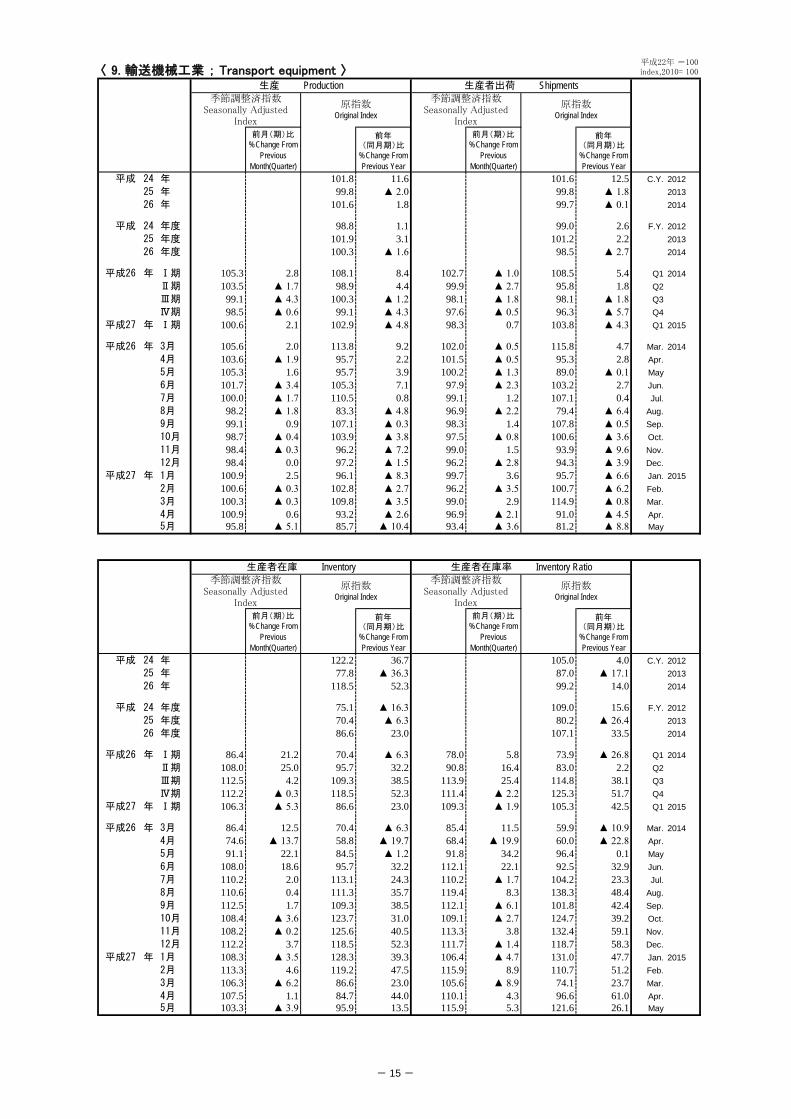
〈 9. 輸送機械工業 ; Transport equipment 〉
前月(期)比%Change From
PreviousMonth(Quarter)
前年(同月期)比
%Change FromPrevious Year
前月(期)比%Change From
PreviousMonth(Quarter)
前年(同月期)比
%Change FromPrevious Year
平成 24 年 101.8 11.6 101.6 12.5 C.Y. 201225 年 99.8 ▲ 2.0 99.8 ▲ 1.8 201326 年 101.6 1.8 99.7 ▲ 0.1 2014
平成 24 年度 98.8 1.1 99.0 2.6 F.Y. 201225 年度 101.9 3.1 101.2 2.2 201326 年度 100.3 ▲ 1.6 98.5 ▲ 2.7 2014
平成26 年 Ⅰ期 105.3 2.8 108.1 8.4 102.7 ▲ 1.0 108.5 5.4 Q1 2014Ⅱ期 103.5 ▲ 1.7 98.9 4.4 99.9 ▲ 2.7 95.8 1.8 Q2Ⅲ期 99.1 ▲ 4.3 100.3 ▲ 1.2 98.1 ▲ 1.8 98.1 ▲ 1.8 Q3Ⅳ期 98.5 ▲ 0.6 99.1 ▲ 4.3 97.6 ▲ 0.5 96.3 ▲ 5.7 Q4
平成27 年 Ⅰ期 100.6 2.1 102.9 ▲ 4.8 98.3 0.7 103.8 ▲ 4.3 Q1 2015
平成26 年 3月 105.6 2.0 113.8 9.2 102.0 ▲ 0.5 115.8 4.7 Mar. 20144月 103.6 ▲ 1.9 95.7 2.2 101.5 ▲ 0.5 95.3 2.8 Apr.5月 105.3 1.6 95.7 3.9 100.2 ▲ 1.3 89.0 ▲ 0.1 May6月 101.7 ▲ 3.4 105.3 7.1 97.9 ▲ 2.3 103.2 2.7 Jun.7月 100.0 ▲ 1.7 110.5 0.8 99.1 1.2 107.1 0.4 Jul.8月 98.2 ▲ 1.8 83.3 ▲ 4.8 96.9 ▲ 2.2 79.4 ▲ 6.4 Aug.9月 99.1 0.9 107.1 ▲ 0.3 98.3 1.4 107.8 ▲ 0.5 Sep.10月 98.7 ▲ 0.4 103.9 ▲ 3.8 97.5 ▲ 0.8 100.6 ▲ 3.6 Oct.11月 98.4 ▲ 0.3 96.2 ▲ 7.2 99.0 1.5 93.9 ▲ 9.6 Nov.12月 98.4 0.0 97.2 ▲ 1.5 96.2 ▲ 2.8 94.3 ▲ 3.9 Dec.
平成27 年 1月 100.9 2.5 96.1 ▲ 8.3 99.7 3.6 95.7 ▲ 6.6 Jan. 20152月 100.6 ▲ 0.3 102.8 ▲ 2.7 96.2 ▲ 3.5 100.7 ▲ 6.2 Feb.3月 100.3 ▲ 0.3 109.8 ▲ 3.5 99.0 2.9 114.9 ▲ 0.8 Mar.4月 100.9 0.6 93.2 ▲ 2.6 96.9 ▲ 2.1 91.0 ▲ 4.5 Apr.5月 95.8 ▲ 5.1 85.7 ▲ 10.4 93.4 ▲ 3.6 81.2 ▲ 8.8 May
前月(期)比%Change From
PreviousMonth(Quarter)
前年(同月期)比
%Change FromPrevious Year
前月(期)比%Change From
PreviousMonth(Quarter)
前年(同月期)比
%Change FromPrevious Year
平成 24 年 122.2 36.7 105.0 4.0 C.Y. 201225 年 77.8 ▲ 36.3 87.0 ▲ 17.1 201326 年 118.5 52.3 99.2 14.0 2014
平成 24 年度 75.1 ▲ 16.3 109.0 15.6 F.Y. 201225 年度 70.4 ▲ 6.3 80.2 ▲ 26.4 201326 年度 86.6 23.0 107.1 33.5 2014
平成26 年 Ⅰ期 86.4 21.2 70.4 ▲ 6.3 78.0 5.8 73.9 ▲ 26.8 Q1 2014Ⅱ期 108.0 25.0 95.7 32.2 90.8 16.4 83.0 2.2 Q2Ⅲ期 112.5 4.2 109.3 38.5 113.9 25.4 114.8 38.1 Q3Ⅳ期 112.2 ▲ 0.3 118.5 52.3 111.4 ▲ 2.2 125.3 51.7 Q4
平成27 年 Ⅰ期 106.3 ▲ 5.3 86.6 23.0 109.3 ▲ 1.9 105.3 42.5 Q1 2015
平成26 年 3月 86.4 12.5 70.4 ▲ 6.3 85.4 11.5 59.9 ▲ 10.9 Mar. 20144月 74.6 ▲ 13.7 58.8 ▲ 19.7 68.4 ▲ 19.9 60.0 ▲ 22.8 Apr.5月 91.1 22.1 84.5 ▲ 1.2 91.8 34.2 96.4 0.1 May6月 108.0 18.6 95.7 32.2 112.1 22.1 92.5 32.9 Jun.7月 110.2 2.0 113.1 24.3 110.2 ▲ 1.7 104.2 23.3 Jul.8月 110.6 0.4 111.3 35.7 119.4 8.3 138.3 48.4 Aug.9月 112.5 1.7 109.3 38.5 112.1 ▲ 6.1 101.8 42.4 Sep.10月 108.4 ▲ 3.6 123.7 31.0 109.1 ▲ 2.7 124.7 39.2 Oct.11月 108.2 ▲ 0.2 125.6 40.5 113.3 3.8 132.4 59.1 Nov.12月 112.2 3.7 118.5 52.3 111.7 ▲ 1.4 118.7 58.3 Dec.
平成27 年 1月 108.3 ▲ 3.5 128.3 39.3 106.4 ▲ 4.7 131.0 47.7 Jan. 20152月 113.3 4.6 119.2 47.5 115.9 8.9 110.7 51.2 Feb.3月 106.3 ▲ 6.2 86.6 23.0 105.6 ▲ 8.9 74.1 23.7 Mar.4月 107.5 1.1 84.7 44.0 110.1 4.3 96.6 61.0 Apr.5月 103.3 ▲ 3.9 95.9 13.5 115.9 5.3 121.6 26.1 May
平成22年 =100index,2010= 100
生産 Production 生産者出荷 Shipments季節調整済指数
Seasonally AdjustedIndex
原指数Original Index
季節調整済指数Seasonally Adjusted
Index
原指数Original Index
生産者在庫 Inventory 生産者在庫率 Inventory Ratio季節調整済指数
Seasonally AdjustedIndex
原指数Original Index
季節調整済指数Seasonally Adjusted
Index
原指数Original Index
- 16 -
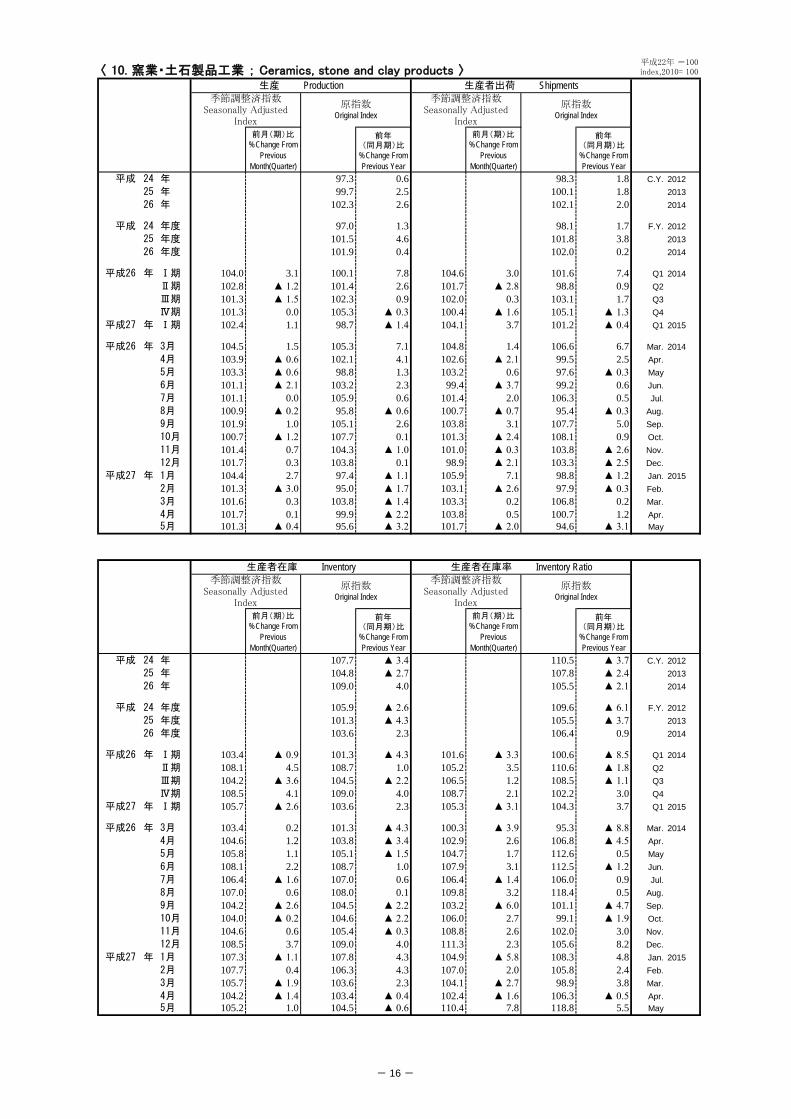
〈 10. 窯業・土石製品工業 ; Ceramics, stone and clay products 〉
前月(期)比%Change From
PreviousMonth(Quarter)
前年(同月期)比
%Change FromPrevious Year
前月(期)比%Change From
PreviousMonth(Quarter)
前年(同月期)比
%Change FromPrevious Year
平成 24 年 97.3 0.6 98.3 1.8 C.Y. 201225 年 99.7 2.5 100.1 1.8 201326 年 102.3 2.6 102.1 2.0 2014
平成 24 年度 97.0 1.3 98.1 1.7 F.Y. 201225 年度 101.5 4.6 101.8 3.8 201326 年度 101.9 0.4 102.0 0.2 2014
平成26 年 Ⅰ期 104.0 3.1 100.1 7.8 104.6 3.0 101.6 7.4 Q1 2014Ⅱ期 102.8 ▲ 1.2 101.4 2.6 101.7 ▲ 2.8 98.8 0.9 Q2Ⅲ期 101.3 ▲ 1.5 102.3 0.9 102.0 0.3 103.1 1.7 Q3Ⅳ期 101.3 0.0 105.3 ▲ 0.3 100.4 ▲ 1.6 105.1 ▲ 1.3 Q4
平成27 年 Ⅰ期 102.4 1.1 98.7 ▲ 1.4 104.1 3.7 101.2 ▲ 0.4 Q1 2015
平成26 年 3月 104.5 1.5 105.3 7.1 104.8 1.4 106.6 6.7 Mar. 20144月 103.9 ▲ 0.6 102.1 4.1 102.6 ▲ 2.1 99.5 2.5 Apr.5月 103.3 ▲ 0.6 98.8 1.3 103.2 0.6 97.6 ▲ 0.3 May6月 101.1 ▲ 2.1 103.2 2.3 99.4 ▲ 3.7 99.2 0.6 Jun.7月 101.1 0.0 105.9 0.6 101.4 2.0 106.3 0.5 Jul.8月 100.9 ▲ 0.2 95.8 ▲ 0.6 100.7 ▲ 0.7 95.4 ▲ 0.3 Aug.9月 101.9 1.0 105.1 2.6 103.8 3.1 107.7 5.0 Sep.10月 100.7 ▲ 1.2 107.7 0.1 101.3 ▲ 2.4 108.1 0.9 Oct.11月 101.4 0.7 104.3 ▲ 1.0 101.0 ▲ 0.3 103.8 ▲ 2.6 Nov.12月 101.7 0.3 103.8 0.1 98.9 ▲ 2.1 103.3 ▲ 2.5 Dec.
平成27 年 1月 104.4 2.7 97.4 ▲ 1.1 105.9 7.1 98.8 ▲ 1.2 Jan. 20152月 101.3 ▲ 3.0 95.0 ▲ 1.7 103.1 ▲ 2.6 97.9 ▲ 0.3 Feb.3月 101.6 0.3 103.8 ▲ 1.4 103.3 0.2 106.8 0.2 Mar.4月 101.7 0.1 99.9 ▲ 2.2 103.8 0.5 100.7 1.2 Apr.5月 101.3 ▲ 0.4 95.6 ▲ 3.2 101.7 ▲ 2.0 94.6 ▲ 3.1 May
前月(期)比%Change From
PreviousMonth(Quarter)
前年(同月期)比
%Change FromPrevious Year
前月(期)比%Change From
PreviousMonth(Quarter)
前年(同月期)比
%Change FromPrevious Year
平成 24 年 107.7 ▲ 3.4 110.5 ▲ 3.7 C.Y. 201225 年 104.8 ▲ 2.7 107.8 ▲ 2.4 201326 年 109.0 4.0 105.5 ▲ 2.1 2014
平成 24 年度 105.9 ▲ 2.6 109.6 ▲ 6.1 F.Y. 201225 年度 101.3 ▲ 4.3 105.5 ▲ 3.7 201326 年度 103.6 2.3 106.4 0.9 2014
平成26 年 Ⅰ期 103.4 ▲ 0.9 101.3 ▲ 4.3 101.6 ▲ 3.3 100.6 ▲ 8.5 Q1 2014Ⅱ期 108.1 4.5 108.7 1.0 105.2 3.5 110.6 ▲ 1.8 Q2Ⅲ期 104.2 ▲ 3.6 104.5 ▲ 2.2 106.5 1.2 108.5 ▲ 1.1 Q3Ⅳ期 108.5 4.1 109.0 4.0 108.7 2.1 102.2 3.0 Q4
平成27 年 Ⅰ期 105.7 ▲ 2.6 103.6 2.3 105.3 ▲ 3.1 104.3 3.7 Q1 2015
平成26 年 3月 103.4 0.2 101.3 ▲ 4.3 100.3 ▲ 3.9 95.3 ▲ 8.8 Mar. 20144月 104.6 1.2 103.8 ▲ 3.4 102.9 2.6 106.8 ▲ 4.5 Apr.5月 105.8 1.1 105.1 ▲ 1.5 104.7 1.7 112.6 0.5 May6月 108.1 2.2 108.7 1.0 107.9 3.1 112.5 ▲ 1.2 Jun.7月 106.4 ▲ 1.6 107.0 0.6 106.4 ▲ 1.4 106.0 0.9 Jul.8月 107.0 0.6 108.0 0.1 109.8 3.2 118.4 0.5 Aug.9月 104.2 ▲ 2.6 104.5 ▲ 2.2 103.2 ▲ 6.0 101.1 ▲ 4.7 Sep.10月 104.0 ▲ 0.2 104.6 ▲ 2.2 106.0 2.7 99.1 ▲ 1.9 Oct.11月 104.6 0.6 105.4 ▲ 0.3 108.8 2.6 102.0 3.0 Nov.12月 108.5 3.7 109.0 4.0 111.3 2.3 105.6 8.2 Dec.
平成27 年 1月 107.3 ▲ 1.1 107.8 4.3 104.9 ▲ 5.8 108.3 4.8 Jan. 20152月 107.7 0.4 106.3 4.3 107.0 2.0 105.8 2.4 Feb.3月 105.7 ▲ 1.9 103.6 2.3 104.1 ▲ 2.7 98.9 3.8 Mar.4月 104.2 ▲ 1.4 103.4 ▲ 0.4 102.4 ▲ 1.6 106.3 ▲ 0.5 Apr.5月 105.2 1.0 104.5 ▲ 0.6 110.4 7.8 118.8 5.5 May
平成22年 =100index,2010= 100
生産 Production 生産者出荷 Shipments季節調整済指数
Seasonally AdjustedIndex
原指数Original Index
季節調整済指数Seasonally Adjusted
Index
原指数Original Index
生産者在庫 Inventory 生産者在庫率 Inventory Ratio季節調整済指数
Seasonally AdjustedIndex
原指数Original Index
季節調整済指数Seasonally Adjusted
Index
原指数Original Index
- 17 -
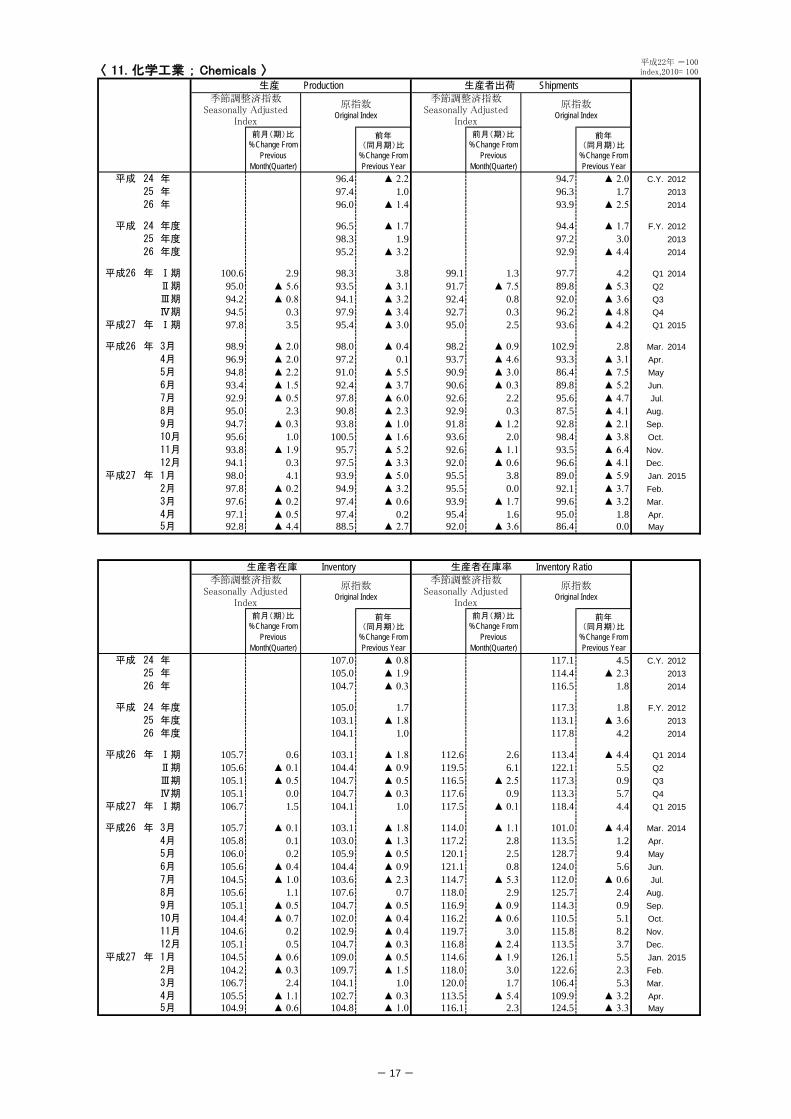
〈 11. 化学工業 ; Chemicals 〉
前月(期)比%Change From
PreviousMonth(Quarter)
前年(同月期)比
%Change FromPrevious Year
前月(期)比%Change From
PreviousMonth(Quarter)
前年(同月期)比
%Change FromPrevious Year
平成 24 年 96.4 ▲ 2.2 94.7 ▲ 2.0 C.Y. 201225 年 97.4 1.0 96.3 1.7 201326 年 96.0 ▲ 1.4 93.9 ▲ 2.5 2014
平成 24 年度 96.5 ▲ 1.7 94.4 ▲ 1.7 F.Y. 201225 年度 98.3 1.9 97.2 3.0 201326 年度 95.2 ▲ 3.2 92.9 ▲ 4.4 2014
平成26 年 Ⅰ期 100.6 2.9 98.3 3.8 99.1 1.3 97.7 4.2 Q1 2014Ⅱ期 95.0 ▲ 5.6 93.5 ▲ 3.1 91.7 ▲ 7.5 89.8 ▲ 5.3 Q2Ⅲ期 94.2 ▲ 0.8 94.1 ▲ 3.2 92.4 0.8 92.0 ▲ 3.6 Q3Ⅳ期 94.5 0.3 97.9 ▲ 3.4 92.7 0.3 96.2 ▲ 4.8 Q4
平成27 年 Ⅰ期 97.8 3.5 95.4 ▲ 3.0 95.0 2.5 93.6 ▲ 4.2 Q1 2015
平成26 年 3月 98.9 ▲ 2.0 98.0 ▲ 0.4 98.2 ▲ 0.9 102.9 2.8 Mar. 20144月 96.9 ▲ 2.0 97.2 0.1 93.7 ▲ 4.6 93.3 ▲ 3.1 Apr.5月 94.8 ▲ 2.2 91.0 ▲ 5.5 90.9 ▲ 3.0 86.4 ▲ 7.5 May6月 93.4 ▲ 1.5 92.4 ▲ 3.7 90.6 ▲ 0.3 89.8 ▲ 5.2 Jun.7月 92.9 ▲ 0.5 97.8 ▲ 6.0 92.6 2.2 95.6 ▲ 4.7 Jul.8月 95.0 2.3 90.8 ▲ 2.3 92.9 0.3 87.5 ▲ 4.1 Aug.9月 94.7 ▲ 0.3 93.8 ▲ 1.0 91.8 ▲ 1.2 92.8 ▲ 2.1 Sep.10月 95.6 1.0 100.5 ▲ 1.6 93.6 2.0 98.4 ▲ 3.8 Oct.11月 93.8 ▲ 1.9 95.7 ▲ 5.2 92.6 ▲ 1.1 93.5 ▲ 6.4 Nov.12月 94.1 0.3 97.5 ▲ 3.3 92.0 ▲ 0.6 96.6 ▲ 4.1 Dec.
平成27 年 1月 98.0 4.1 93.9 ▲ 5.0 95.5 3.8 89.0 ▲ 5.9 Jan. 20152月 97.8 ▲ 0.2 94.9 ▲ 3.2 95.5 0.0 92.1 ▲ 3.7 Feb.3月 97.6 ▲ 0.2 97.4 ▲ 0.6 93.9 ▲ 1.7 99.6 ▲ 3.2 Mar.4月 97.1 ▲ 0.5 97.4 0.2 95.4 1.6 95.0 1.8 Apr.5月 92.8 ▲ 4.4 88.5 ▲ 2.7 92.0 ▲ 3.6 86.4 0.0 May
前月(期)比%Change From
PreviousMonth(Quarter)
前年(同月期)比
%Change FromPrevious Year
前月(期)比%Change From
PreviousMonth(Quarter)
前年(同月期)比
%Change FromPrevious Year
平成 24 年 107.0 ▲ 0.8 117.1 4.5 C.Y. 201225 年 105.0 ▲ 1.9 114.4 ▲ 2.3 201326 年 104.7 ▲ 0.3 116.5 1.8 2014
平成 24 年度 105.0 1.7 117.3 1.8 F.Y. 201225 年度 103.1 ▲ 1.8 113.1 ▲ 3.6 201326 年度 104.1 1.0 117.8 4.2 2014
平成26 年 Ⅰ期 105.7 0.6 103.1 ▲ 1.8 112.6 2.6 113.4 ▲ 4.4 Q1 2014Ⅱ期 105.6 ▲ 0.1 104.4 ▲ 0.9 119.5 6.1 122.1 5.5 Q2Ⅲ期 105.1 ▲ 0.5 104.7 ▲ 0.5 116.5 ▲ 2.5 117.3 0.9 Q3Ⅳ期 105.1 0.0 104.7 ▲ 0.3 117.6 0.9 113.3 5.7 Q4
平成27 年 Ⅰ期 106.7 1.5 104.1 1.0 117.5 ▲ 0.1 118.4 4.4 Q1 2015
平成26 年 3月 105.7 ▲ 0.1 103.1 ▲ 1.8 114.0 ▲ 1.1 101.0 ▲ 4.4 Mar. 20144月 105.8 0.1 103.0 ▲ 1.3 117.2 2.8 113.5 1.2 Apr.5月 106.0 0.2 105.9 ▲ 0.5 120.1 2.5 128.7 9.4 May6月 105.6 ▲ 0.4 104.4 ▲ 0.9 121.1 0.8 124.0 5.6 Jun.7月 104.5 ▲ 1.0 103.6 ▲ 2.3 114.7 ▲ 5.3 112.0 ▲ 0.6 Jul.8月 105.6 1.1 107.6 0.7 118.0 2.9 125.7 2.4 Aug.9月 105.1 ▲ 0.5 104.7 ▲ 0.5 116.9 ▲ 0.9 114.3 0.9 Sep.10月 104.4 ▲ 0.7 102.0 ▲ 0.4 116.2 ▲ 0.6 110.5 5.1 Oct.11月 104.6 0.2 102.9 ▲ 0.4 119.7 3.0 115.8 8.2 Nov.12月 105.1 0.5 104.7 ▲ 0.3 116.8 ▲ 2.4 113.5 3.7 Dec.
平成27 年 1月 104.5 ▲ 0.6 109.0 ▲ 0.5 114.6 ▲ 1.9 126.1 5.5 Jan. 20152月 104.2 ▲ 0.3 109.7 ▲ 1.5 118.0 3.0 122.6 2.3 Feb.3月 106.7 2.4 104.1 1.0 120.0 1.7 106.4 5.3 Mar.4月 105.5 ▲ 1.1 102.7 ▲ 0.3 113.5 ▲ 5.4 109.9 ▲ 3.2 Apr.5月 104.9 ▲ 0.6 104.8 ▲ 1.0 116.1 2.3 124.5 ▲ 3.3 May
平成22年 =100index,2010= 100
生産 Production 生産者出荷 Shipments季節調整済指数
Seasonally AdjustedIndex
原指数Original Index
季節調整済指数Seasonally Adjusted
Index
原指数Original Index
生産者在庫 Inventory 生産者在庫率 Inventory Ratio季節調整済指数
Seasonally AdjustedIndex
原指数Original Index
季節調整済指数Seasonally Adjusted
Index
原指数Original Index
- 18 -
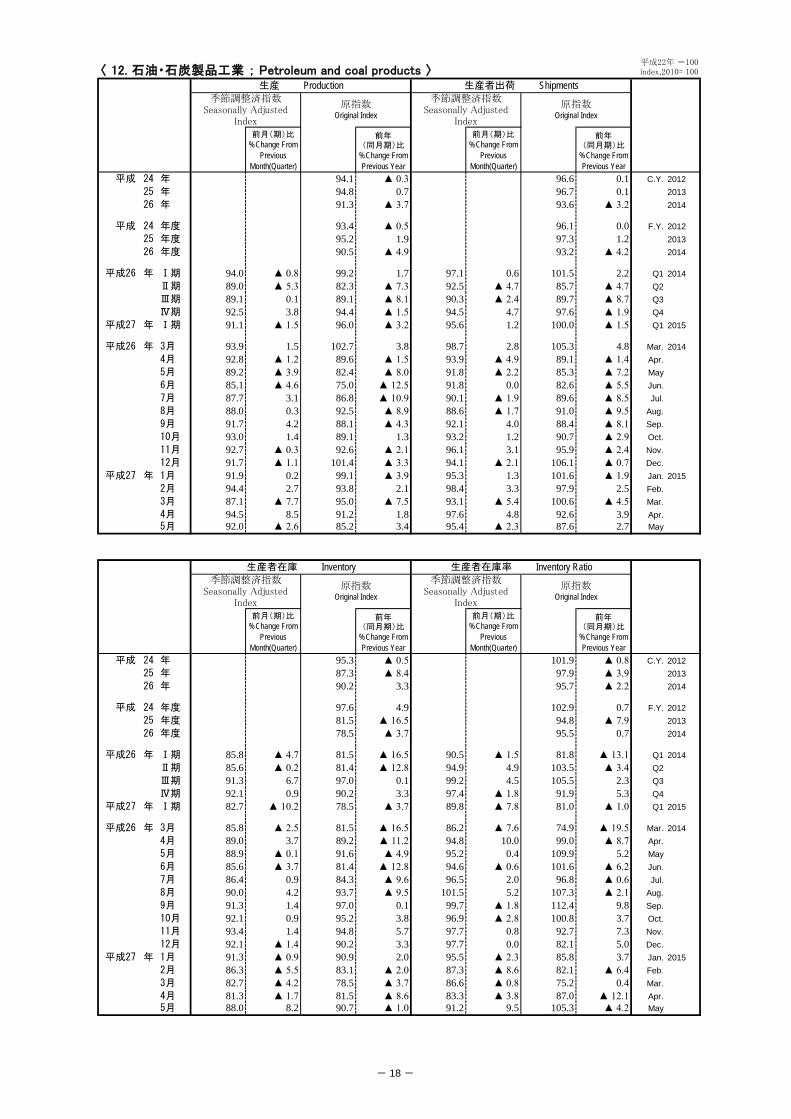
〈 12. 石油・石炭製品工業 ; Petroleum and coal products 〉
前月(期)比%Change From
PreviousMonth(Quarter)
前年(同月期)比
%Change FromPrevious Year
前月(期)比%Change From
PreviousMonth(Quarter)
前年(同月期)比
%Change FromPrevious Year
平成 24 年 94.1 ▲ 0.3 96.6 0.1 C.Y. 201225 年 94.8 0.7 96.7 0.1 201326 年 91.3 ▲ 3.7 93.6 ▲ 3.2 2014
平成 24 年度 93.4 ▲ 0.5 96.1 0.0 F.Y. 201225 年度 95.2 1.9 97.3 1.2 201326 年度 90.5 ▲ 4.9 93.2 ▲ 4.2 2014
平成26 年 Ⅰ期 94.0 ▲ 0.8 99.2 1.7 97.1 0.6 101.5 2.2 Q1 2014Ⅱ期 89.0 ▲ 5.3 82.3 ▲ 7.3 92.5 ▲ 4.7 85.7 ▲ 4.7 Q2Ⅲ期 89.1 0.1 89.1 ▲ 8.1 90.3 ▲ 2.4 89.7 ▲ 8.7 Q3Ⅳ期 92.5 3.8 94.4 ▲ 1.5 94.5 4.7 97.6 ▲ 1.9 Q4
平成27 年 Ⅰ期 91.1 ▲ 1.5 96.0 ▲ 3.2 95.6 1.2 100.0 ▲ 1.5 Q1 2015
平成26 年 3月 93.9 1.5 102.7 3.8 98.7 2.8 105.3 4.8 Mar. 20144月 92.8 ▲ 1.2 89.6 ▲ 1.5 93.9 ▲ 4.9 89.1 ▲ 1.4 Apr.5月 89.2 ▲ 3.9 82.4 ▲ 8.0 91.8 ▲ 2.2 85.3 ▲ 7.2 May6月 85.1 ▲ 4.6 75.0 ▲ 12.5 91.8 0.0 82.6 ▲ 5.5 Jun.7月 87.7 3.1 86.8 ▲ 10.9 90.1 ▲ 1.9 89.6 ▲ 8.5 Jul.8月 88.0 0.3 92.5 ▲ 8.9 88.6 ▲ 1.7 91.0 ▲ 9.5 Aug.9月 91.7 4.2 88.1 ▲ 4.3 92.1 4.0 88.4 ▲ 8.1 Sep.10月 93.0 1.4 89.1 1.3 93.2 1.2 90.7 ▲ 2.9 Oct.11月 92.7 ▲ 0.3 92.6 ▲ 2.1 96.1 3.1 95.9 ▲ 2.4 Nov.12月 91.7 ▲ 1.1 101.4 ▲ 3.3 94.1 ▲ 2.1 106.1 ▲ 0.7 Dec.
平成27 年 1月 91.9 0.2 99.1 ▲ 3.9 95.3 1.3 101.6 ▲ 1.9 Jan. 20152月 94.4 2.7 93.8 2.1 98.4 3.3 97.9 2.5 Feb.3月 87.1 ▲ 7.7 95.0 ▲ 7.5 93.1 ▲ 5.4 100.6 ▲ 4.5 Mar.4月 94.5 8.5 91.2 1.8 97.6 4.8 92.6 3.9 Apr.5月 92.0 ▲ 2.6 85.2 3.4 95.4 ▲ 2.3 87.6 2.7 May
前月(期)比%Change From
PreviousMonth(Quarter)
前年(同月期)比
%Change FromPrevious Year
前月(期)比%Change From
PreviousMonth(Quarter)
前年(同月期)比
%Change FromPrevious Year
平成 24 年 95.3 ▲ 0.5 101.9 ▲ 0.8 C.Y. 201225 年 87.3 ▲ 8.4 97.9 ▲ 3.9 201326 年 90.2 3.3 95.7 ▲ 2.2 2014
平成 24 年度 97.6 4.9 102.9 0.7 F.Y. 201225 年度 81.5 ▲ 16.5 94.8 ▲ 7.9 201326 年度 78.5 ▲ 3.7 95.5 0.7 2014
平成26 年 Ⅰ期 85.8 ▲ 4.7 81.5 ▲ 16.5 90.5 ▲ 1.5 81.8 ▲ 13.1 Q1 2014Ⅱ期 85.6 ▲ 0.2 81.4 ▲ 12.8 94.9 4.9 103.5 ▲ 3.4 Q2Ⅲ期 91.3 6.7 97.0 0.1 99.2 4.5 105.5 2.3 Q3Ⅳ期 92.1 0.9 90.2 3.3 97.4 ▲ 1.8 91.9 5.3 Q4
平成27 年 Ⅰ期 82.7 ▲ 10.2 78.5 ▲ 3.7 89.8 ▲ 7.8 81.0 ▲ 1.0 Q1 2015
平成26 年 3月 85.8 ▲ 2.5 81.5 ▲ 16.5 86.2 ▲ 7.6 74.9 ▲ 19.5 Mar. 20144月 89.0 3.7 89.2 ▲ 11.2 94.8 10.0 99.0 ▲ 8.7 Apr.5月 88.9 ▲ 0.1 91.6 ▲ 4.9 95.2 0.4 109.9 5.2 May6月 85.6 ▲ 3.7 81.4 ▲ 12.8 94.6 ▲ 0.6 101.6 ▲ 6.2 Jun.7月 86.4 0.9 84.3 ▲ 9.6 96.5 2.0 96.8 ▲ 0.6 Jul.8月 90.0 4.2 93.7 ▲ 9.5 101.5 5.2 107.3 ▲ 2.1 Aug.9月 91.3 1.4 97.0 0.1 99.7 ▲ 1.8 112.4 9.8 Sep.10月 92.1 0.9 95.2 3.8 96.9 ▲ 2.8 100.8 3.7 Oct.11月 93.4 1.4 94.8 5.7 97.7 0.8 92.7 7.3 Nov.12月 92.1 ▲ 1.4 90.2 3.3 97.7 0.0 82.1 5.0 Dec.
平成27 年 1月 91.3 ▲ 0.9 90.9 2.0 95.5 ▲ 2.3 85.8 3.7 Jan. 20152月 86.3 ▲ 5.5 83.1 ▲ 2.0 87.3 ▲ 8.6 82.1 ▲ 6.4 Feb.3月 82.7 ▲ 4.2 78.5 ▲ 3.7 86.6 ▲ 0.8 75.2 0.4 Mar.4月 81.3 ▲ 1.7 81.5 ▲ 8.6 83.3 ▲ 3.8 87.0 ▲ 12.1 Apr.5月 88.0 8.2 90.7 ▲ 1.0 91.2 9.5 105.3 ▲ 4.2 May
平成22年 =100index,2010= 100
生産 Production 生産者出荷 Shipments季節調整済指数
Seasonally AdjustedIndex
原指数Original Index
季節調整済指数Seasonally Adjusted
Index
原指数Original Index
生産者在庫 Inventory 生産者在庫率 Inventory Ratio季節調整済指数
Seasonally AdjustedIndex
原指数Original Index
季節調整済指数Seasonally Adjusted
Index
原指数Original Index
- 19 -
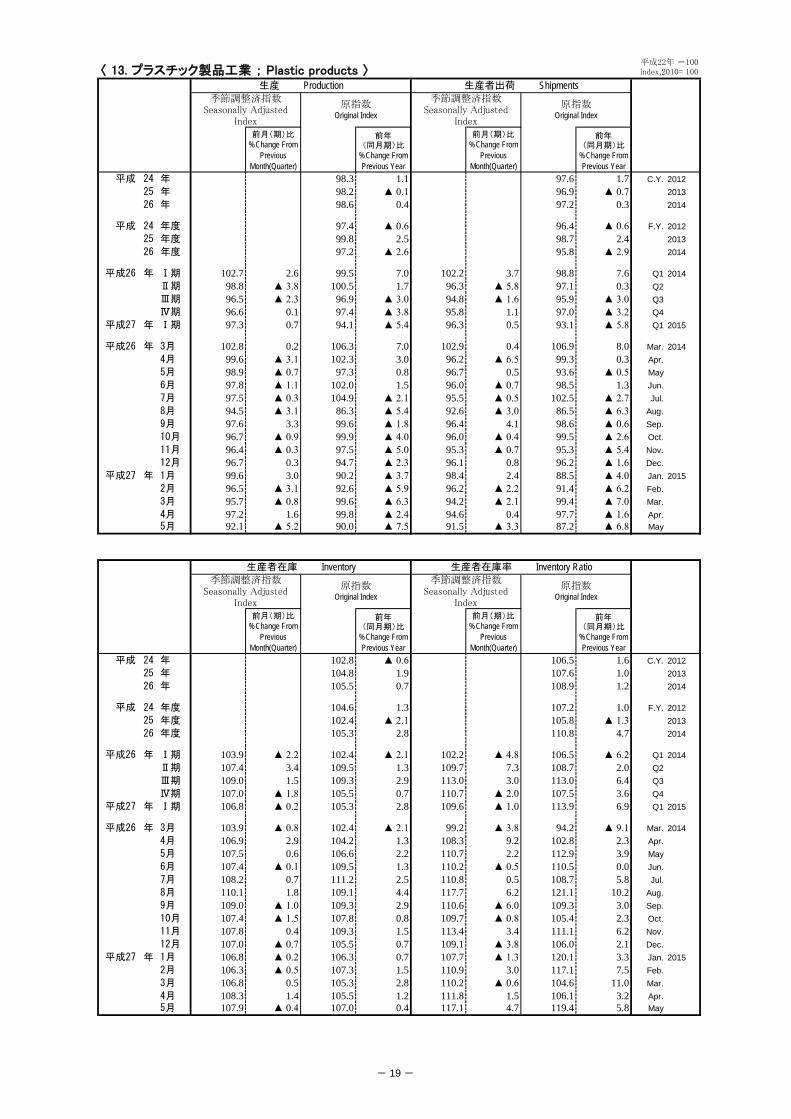
〈 13. プラスチック製品工業 ; Plastic products 〉
前月(期)比%Change From
PreviousMonth(Quarter)
前年(同月期)比
%Change FromPrevious Year
前月(期)比%Change From
PreviousMonth(Quarter)
前年(同月期)比
%Change FromPrevious Year
平成 24 年 98.3 1.1 97.6 1.7 C.Y. 201225 年 98.2 ▲ 0.1 96.9 ▲ 0.7 201326 年 98.6 0.4 97.2 0.3 2014
平成 24 年度 97.4 ▲ 0.6 96.4 ▲ 0.6 F.Y. 201225 年度 99.8 2.5 98.7 2.4 201326 年度 97.2 ▲ 2.6 95.8 ▲ 2.9 2014
平成26 年 Ⅰ期 102.7 2.6 99.5 7.0 102.2 3.7 98.8 7.6 Q1 2014Ⅱ期 98.8 ▲ 3.8 100.5 1.7 96.3 ▲ 5.8 97.1 0.3 Q2Ⅲ期 96.5 ▲ 2.3 96.9 ▲ 3.0 94.8 ▲ 1.6 95.9 ▲ 3.0 Q3Ⅳ期 96.6 0.1 97.4 ▲ 3.8 95.8 1.1 97.0 ▲ 3.2 Q4
平成27 年 Ⅰ期 97.3 0.7 94.1 ▲ 5.4 96.3 0.5 93.1 ▲ 5.8 Q1 2015
平成26 年 3月 102.8 0.2 106.3 7.0 102.9 0.4 106.9 8.0 Mar. 20144月 99.6 ▲ 3.1 102.3 3.0 96.2 ▲ 6.5 99.3 0.3 Apr.5月 98.9 ▲ 0.7 97.3 0.8 96.7 0.5 93.6 ▲ 0.5 May6月 97.8 ▲ 1.1 102.0 1.5 96.0 ▲ 0.7 98.5 1.3 Jun.7月 97.5 ▲ 0.3 104.9 ▲ 2.1 95.5 ▲ 0.5 102.5 ▲ 2.7 Jul.8月 94.5 ▲ 3.1 86.3 ▲ 5.4 92.6 ▲ 3.0 86.5 ▲ 6.3 Aug.9月 97.6 3.3 99.6 ▲ 1.8 96.4 4.1 98.6 ▲ 0.6 Sep.10月 96.7 ▲ 0.9 99.9 ▲ 4.0 96.0 ▲ 0.4 99.5 ▲ 2.6 Oct.11月 96.4 ▲ 0.3 97.5 ▲ 5.0 95.3 ▲ 0.7 95.3 ▲ 5.4 Nov.12月 96.7 0.3 94.7 ▲ 2.3 96.1 0.8 96.2 ▲ 1.6 Dec.
平成27 年 1月 99.6 3.0 90.2 ▲ 3.7 98.4 2.4 88.5 ▲ 4.0 Jan. 20152月 96.5 ▲ 3.1 92.6 ▲ 5.9 96.2 ▲ 2.2 91.4 ▲ 6.2 Feb.3月 95.7 ▲ 0.8 99.6 ▲ 6.3 94.2 ▲ 2.1 99.4 ▲ 7.0 Mar.4月 97.2 1.6 99.8 ▲ 2.4 94.6 0.4 97.7 ▲ 1.6 Apr.5月 92.1 ▲ 5.2 90.0 ▲ 7.5 91.5 ▲ 3.3 87.2 ▲ 6.8 May
前月(期)比%Change From
PreviousMonth(Quarter)
前年(同月期)比
%Change FromPrevious Year
前月(期)比%Change From
PreviousMonth(Quarter)
前年(同月期)比
%Change FromPrevious Year
平成 24 年 102.8 ▲ 0.6 106.5 1.6 C.Y. 201225 年 104.8 1.9 107.6 1.0 201326 年 105.5 0.7 108.9 1.2 2014
平成 24 年度 104.6 1.3 107.2 1.0 F.Y. 201225 年度 102.4 ▲ 2.1 105.8 ▲ 1.3 201326 年度 105.3 2.8 110.8 4.7 2014
平成26 年 Ⅰ期 103.9 ▲ 2.2 102.4 ▲ 2.1 102.2 ▲ 4.8 106.5 ▲ 6.2 Q1 2014Ⅱ期 107.4 3.4 109.5 1.3 109.7 7.3 108.7 2.0 Q2Ⅲ期 109.0 1.5 109.3 2.9 113.0 3.0 113.0 6.4 Q3Ⅳ期 107.0 ▲ 1.8 105.5 0.7 110.7 ▲ 2.0 107.5 3.6 Q4
平成27 年 Ⅰ期 106.8 ▲ 0.2 105.3 2.8 109.6 ▲ 1.0 113.9 6.9 Q1 2015
平成26 年 3月 103.9 ▲ 0.8 102.4 ▲ 2.1 99.2 ▲ 3.8 94.2 ▲ 9.1 Mar. 20144月 106.9 2.9 104.2 1.3 108.3 9.2 102.8 2.3 Apr.5月 107.5 0.6 106.6 2.2 110.7 2.2 112.9 3.9 May6月 107.4 ▲ 0.1 109.5 1.3 110.2 ▲ 0.5 110.5 0.0 Jun.7月 108.2 0.7 111.2 2.5 110.8 0.5 108.7 5.8 Jul.8月 110.1 1.8 109.1 4.4 117.7 6.2 121.1 10.2 Aug.9月 109.0 ▲ 1.0 109.3 2.9 110.6 ▲ 6.0 109.3 3.0 Sep.10月 107.4 ▲ 1.5 107.8 0.8 109.7 ▲ 0.8 105.4 2.3 Oct.11月 107.8 0.4 109.3 1.5 113.4 3.4 111.1 6.2 Nov.12月 107.0 ▲ 0.7 105.5 0.7 109.1 ▲ 3.8 106.0 2.1 Dec.
平成27 年 1月 106.8 ▲ 0.2 106.3 0.7 107.7 ▲ 1.3 120.1 3.3 Jan. 20152月 106.3 ▲ 0.5 107.3 1.5 110.9 3.0 117.1 7.5 Feb.3月 106.8 0.5 105.3 2.8 110.2 ▲ 0.6 104.6 11.0 Mar.4月 108.3 1.4 105.5 1.2 111.8 1.5 106.1 3.2 Apr.5月 107.9 ▲ 0.4 107.0 0.4 117.1 4.7 119.4 5.8 May
平成22年 =100index,2010= 100
生産 Production 生産者出荷 Shipments季節調整済指数
Seasonally AdjustedIndex
原指数Original Index
季節調整済指数Seasonally Adjusted
Index
原指数Original Index
生産者在庫 Inventory 生産者在庫率 Inventory Ratio季節調整済指数
Seasonally AdjustedIndex
原指数Original Index
季節調整済指数Seasonally Adjusted
Index
原指数Original Index

- 20 -
〈 14. パルプ・紙・紙加工品工業 ; Pulp, paper and paper products 〉
前月(期)比%Change From
PreviousMonth(Quarter)
前年(同月期)比
%Change FromPrevious Year
前月(期)比%Change From
PreviousMonth(Quarter)
前年(同月期)比
%Change FromPrevious Year
平成 24 年 96.2 ▲ 1.6 95.1 ▲ 2.2 C.Y. 201225 年 97.3 1.1 97.1 2.1 201326 年 98.2 0.9 96.8 ▲ 0.3 2014
平成 24 年度 95.3 ▲ 2.6 95.0 ▲ 1.7 F.Y. 201225 年度 98.9 3.8 98.5 3.7 201326 年度 97.4 ▲ 1.5 96.0 ▲ 2.5 2014
平成26 年 Ⅰ期 101.5 2.9 99.1 7.1 100.9 3.3 98.5 6.1 Q1 2014Ⅱ期 97.2 ▲ 4.2 97.7 0.4 95.1 ▲ 5.7 94.5 ▲ 2.3 Q2Ⅲ期 97.0 ▲ 0.2 96.2 ▲ 1.5 95.4 0.3 94.4 ▲ 2.3 Q3Ⅳ期 97.6 0.6 100.0 ▲ 1.5 96.2 0.8 100.0 ▲ 2.1 Q4
平成27 年 Ⅰ期 97.8 0.2 95.7 ▲ 3.4 97.3 1.1 95.2 ▲ 3.4 Q1 2015
平成26 年 3月 102.8 2.8 107.6 8.6 102.0 1.6 108.3 6.8 Mar. 20144月 96.5 ▲ 6.1 100.2 0.1 94.2 ▲ 7.6 97.6 ▲ 3.0 Apr.5月 98.0 1.6 97.7 0.6 95.9 1.8 92.6 ▲ 3.3 May6月 97.1 ▲ 0.9 95.2 0.5 95.1 ▲ 0.8 93.2 ▲ 0.5 Jun.7月 97.3 0.2 97.7 ▲ 0.6 96.0 0.9 97.6 ▲ 1.5 Jul.8月 96.4 ▲ 0.9 93.8 ▲ 3.5 93.9 ▲ 2.2 88.6 ▲ 5.2 Aug.9月 97.3 0.9 97.0 ▲ 0.6 96.3 2.6 97.0 ▲ 0.2 Sep.10月 96.6 ▲ 0.7 101.7 ▲ 2.7 96.7 0.4 102.5 ▲ 0.9 Oct.11月 97.7 1.1 97.9 ▲ 2.0 95.6 ▲ 1.1 97.0 ▲ 5.0 Nov.12月 98.5 0.8 100.4 0.3 96.3 0.7 100.5 ▲ 0.3 Dec.
平成27 年 1月 97.3 ▲ 1.2 90.7 ▲ 4.8 99.2 3.0 89.3 ▲ 2.4 Jan. 20152月 98.0 0.7 92.5 ▲ 2.0 97.1 ▲ 2.1 92.5 ▲ 3.3 Feb.3月 98.2 0.2 103.9 ▲ 3.4 95.5 ▲ 1.6 103.8 ▲ 4.2 Mar.4月 96.3 ▲ 1.9 100.0 ▲ 0.2 95.2 ▲ 0.3 98.6 1.0 Apr.5月 96.0 ▲ 0.3 94.7 ▲ 3.1 95.8 0.6 90.4 ▲ 2.4 May
前月(期)比%Change From
PreviousMonth(Quarter)
前年(同月期)比
%Change FromPrevious Year
前月(期)比%Change From
PreviousMonth(Quarter)
前年(同月期)比
%Change FromPrevious Year
平成 24 年 104.0 9.7 119.9 21.4 C.Y. 201225 年 93.9 ▲ 9.7 107.0 ▲ 10.8 201326 年 99.3 5.8 108.4 1.3 2014
平成 24 年度 100.7 ▲ 3.8 120.1 18.2 F.Y. 201225 年度 92.3 ▲ 8.3 103.3 ▲ 14.0 201326 年度 98.4 6.6 110.3 6.8 2014
平成26 年 Ⅰ期 95.1 ▲ 2.3 92.3 ▲ 8.3 99.5 ▲ 4.3 98.7 ▲ 12.9 Q1 2014Ⅱ期 101.3 6.5 102.3 1.6 109.8 10.4 111.4 4.0 Q2Ⅲ期 102.5 1.2 105.3 4.7 113.0 2.9 116.3 8.5 Q3Ⅳ期 102.8 0.3 99.3 5.8 110.6 ▲ 2.1 107.2 6.8 Q4
平成27 年 Ⅰ期 101.3 ▲ 1.5 98.4 6.6 107.3 ▲ 3.0 106.2 7.6 Q1 2015
平成26 年 3月 95.1 ▲ 0.1 92.3 ▲ 8.3 98.2 ▲ 1.5 87.5 ▲ 11.7 Mar. 20144月 97.6 2.6 94.1 ▲ 4.5 107.5 9.5 102.1 ▲ 0.4 Apr.5月 99.3 1.7 100.4 1.1 109.2 1.6 114.7 6.7 May6月 101.3 2.0 102.3 1.6 112.7 3.2 117.4 5.5 Jun.7月 101.2 ▲ 0.1 100.6 2.8 111.0 ▲ 1.5 111.3 6.2 Jul.8月 103.9 2.7 106.8 5.4 117.0 5.4 125.1 11.9 Aug.9月 102.5 ▲ 1.3 105.3 4.7 110.9 ▲ 5.2 112.4 6.9 Sep.10月 99.1 ▲ 3.3 101.9 1.1 106.9 ▲ 3.6 105.2 3.2 Oct.11月 102.4 3.3 101.6 5.6 114.3 6.9 110.7 12.0 Nov.12月 102.8 0.4 99.3 5.8 110.7 ▲ 3.1 105.6 5.2 Dec.
平成27 年 1月 99.4 ▲ 3.3 100.9 2.7 105.8 ▲ 4.4 113.4 5.0 Jan. 20152月 99.9 0.5 99.6 5.0 108.0 2.1 108.9 8.4 Feb.3月 101.3 1.4 98.4 6.6 108.1 0.1 96.3 10.1 Mar.4月 102.0 0.7 98.3 4.5 112.4 4.0 106.7 4.5 Apr.5月 102.3 0.3 103.4 3.0 114.7 2.0 120.4 5.0 May
平成22年 =100index,2010= 100
生産 Production 生産者出荷 Shipments季節調整済指数
Seasonally AdjustedIndex
原指数Original Index
季節調整済指数Seasonally Adjusted
Index
原指数Original Index
生産者在庫 Inventory 生産者在庫率 Inventory Ratio季節調整済指数
Seasonally AdjustedIndex
原指数Original Index
季節調整済指数Seasonally Adjusted
Index
原指数Original Index
- 21 -
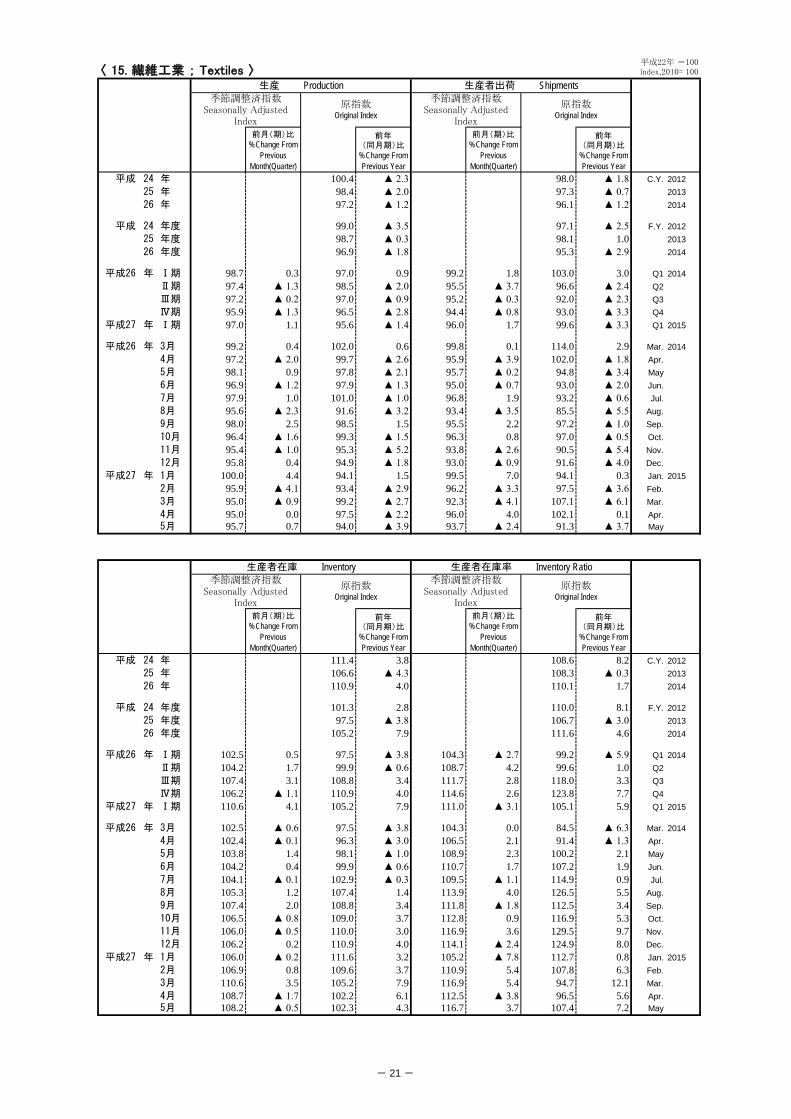
〈 15. 繊維工業 ; Textiles 〉
前月(期)比%Change From
PreviousMonth(Quarter)
前年(同月期)比
%Change FromPrevious Year
前月(期)比%Change From
PreviousMonth(Quarter)
前年(同月期)比
%Change FromPrevious Year
平成 24 年 100.4 ▲ 2.3 98.0 ▲ 1.8 C.Y. 201225 年 98.4 ▲ 2.0 97.3 ▲ 0.7 201326 年 97.2 ▲ 1.2 96.1 ▲ 1.2 2014
平成 24 年度 99.0 ▲ 3.5 97.1 ▲ 2.5 F.Y. 201225 年度 98.7 ▲ 0.3 98.1 1.0 201326 年度 96.9 ▲ 1.8 95.3 ▲ 2.9 2014
平成26 年 Ⅰ期 98.7 0.3 97.0 0.9 99.2 1.8 103.0 3.0 Q1 2014Ⅱ期 97.4 ▲ 1.3 98.5 ▲ 2.0 95.5 ▲ 3.7 96.6 ▲ 2.4 Q2Ⅲ期 97.2 ▲ 0.2 97.0 ▲ 0.9 95.2 ▲ 0.3 92.0 ▲ 2.3 Q3Ⅳ期 95.9 ▲ 1.3 96.5 ▲ 2.8 94.4 ▲ 0.8 93.0 ▲ 3.3 Q4
平成27 年 Ⅰ期 97.0 1.1 95.6 ▲ 1.4 96.0 1.7 99.6 ▲ 3.3 Q1 2015
平成26 年 3月 99.2 0.4 102.0 0.6 99.8 0.1 114.0 2.9 Mar. 20144月 97.2 ▲ 2.0 99.7 ▲ 2.6 95.9 ▲ 3.9 102.0 ▲ 1.8 Apr.5月 98.1 0.9 97.8 ▲ 2.1 95.7 ▲ 0.2 94.8 ▲ 3.4 May6月 96.9 ▲ 1.2 97.9 ▲ 1.3 95.0 ▲ 0.7 93.0 ▲ 2.0 Jun.7月 97.9 1.0 101.0 ▲ 1.0 96.8 1.9 93.2 ▲ 0.6 Jul.8月 95.6 ▲ 2.3 91.6 ▲ 3.2 93.4 ▲ 3.5 85.5 ▲ 5.5 Aug.9月 98.0 2.5 98.5 1.5 95.5 2.2 97.2 ▲ 1.0 Sep.10月 96.4 ▲ 1.6 99.3 ▲ 1.5 96.3 0.8 97.0 ▲ 0.5 Oct.11月 95.4 ▲ 1.0 95.3 ▲ 5.2 93.8 ▲ 2.6 90.5 ▲ 5.4 Nov.12月 95.8 0.4 94.9 ▲ 1.8 93.0 ▲ 0.9 91.6 ▲ 4.0 Dec.
平成27 年 1月 100.0 4.4 94.1 1.5 99.5 7.0 94.1 0.3 Jan. 20152月 95.9 ▲ 4.1 93.4 ▲ 2.9 96.2 ▲ 3.3 97.5 ▲ 3.6 Feb.3月 95.0 ▲ 0.9 99.2 ▲ 2.7 92.3 ▲ 4.1 107.1 ▲ 6.1 Mar.4月 95.0 0.0 97.5 ▲ 2.2 96.0 4.0 102.1 0.1 Apr.5月 95.7 0.7 94.0 ▲ 3.9 93.7 ▲ 2.4 91.3 ▲ 3.7 May
前月(期)比%Change From
PreviousMonth(Quarter)
前年(同月期)比
%Change FromPrevious Year
前月(期)比%Change From
PreviousMonth(Quarter)
前年(同月期)比
%Change FromPrevious Year
平成 24 年 111.4 3.8 108.6 8.2 C.Y. 201225 年 106.6 ▲ 4.3 108.3 ▲ 0.3 201326 年 110.9 4.0 110.1 1.7 2014
平成 24 年度 101.3 2.8 110.0 8.1 F.Y. 201225 年度 97.5 ▲ 3.8 106.7 ▲ 3.0 201326 年度 105.2 7.9 111.6 4.6 2014
平成26 年 Ⅰ期 102.5 0.5 97.5 ▲ 3.8 104.3 ▲ 2.7 99.2 ▲ 5.9 Q1 2014Ⅱ期 104.2 1.7 99.9 ▲ 0.6 108.7 4.2 99.6 1.0 Q2Ⅲ期 107.4 3.1 108.8 3.4 111.7 2.8 118.0 3.3 Q3Ⅳ期 106.2 ▲ 1.1 110.9 4.0 114.6 2.6 123.8 7.7 Q4
平成27 年 Ⅰ期 110.6 4.1 105.2 7.9 111.0 ▲ 3.1 105.1 5.9 Q1 2015
平成26 年 3月 102.5 ▲ 0.6 97.5 ▲ 3.8 104.3 0.0 84.5 ▲ 6.3 Mar. 20144月 102.4 ▲ 0.1 96.3 ▲ 3.0 106.5 2.1 91.4 ▲ 1.3 Apr.5月 103.8 1.4 98.1 ▲ 1.0 108.9 2.3 100.2 2.1 May6月 104.2 0.4 99.9 ▲ 0.6 110.7 1.7 107.2 1.9 Jun.7月 104.1 ▲ 0.1 102.9 ▲ 0.3 109.5 ▲ 1.1 114.9 0.9 Jul.8月 105.3 1.2 107.4 1.4 113.9 4.0 126.5 5.5 Aug.9月 107.4 2.0 108.8 3.4 111.8 ▲ 1.8 112.5 3.4 Sep.10月 106.5 ▲ 0.8 109.0 3.7 112.8 0.9 116.9 5.3 Oct.11月 106.0 ▲ 0.5 110.0 3.0 116.9 3.6 129.5 9.7 Nov.12月 106.2 0.2 110.9 4.0 114.1 ▲ 2.4 124.9 8.0 Dec.
平成27 年 1月 106.0 ▲ 0.2 111.6 3.2 105.2 ▲ 7.8 112.7 0.8 Jan. 20152月 106.9 0.8 109.6 3.7 110.9 5.4 107.8 6.3 Feb.3月 110.6 3.5 105.2 7.9 116.9 5.4 94.7 12.1 Mar.4月 108.7 ▲ 1.7 102.2 6.1 112.5 ▲ 3.8 96.5 5.6 Apr.5月 108.2 ▲ 0.5 102.3 4.3 116.7 3.7 107.4 7.2 May
平成22年 =100index,2010= 100
生産 Production 生産者出荷 Shipments季節調整済指数
Seasonally AdjustedIndex
原指数Original Index
季節調整済指数Seasonally Adjusted
Index
原指数Original Index
生産者在庫 Inventory 生産者在庫率 Inventory Ratio季節調整済指数
Seasonally AdjustedIndex
原指数Original Index
季節調整済指数Seasonally Adjusted
Index
原指数Original Index
- 22 -
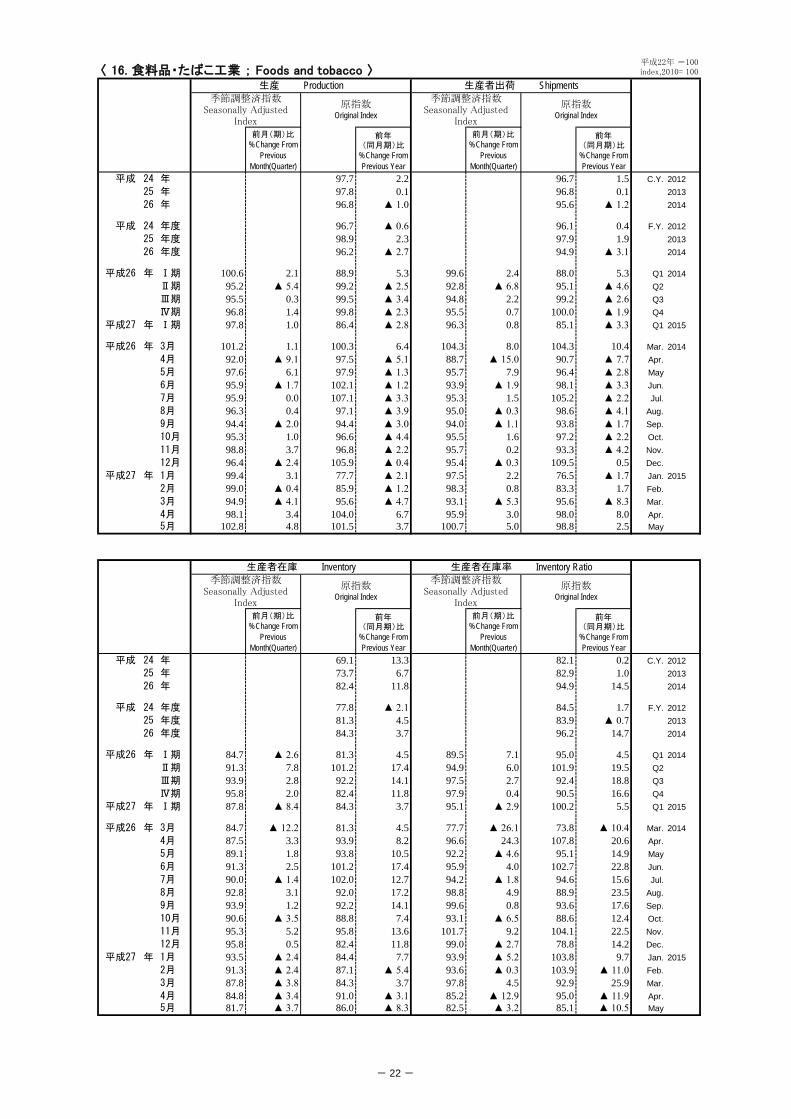
〈 16. 食料品・たばこ工業 ; Foods and tobacco 〉
前月(期)比%Change From
PreviousMonth(Quarter)
前年(同月期)比
%Change FromPrevious Year
前月(期)比%Change From
PreviousMonth(Quarter)
前年(同月期)比
%Change FromPrevious Year
平成 24 年 97.7 2.2 96.7 1.5 C.Y. 201225 年 97.8 0.1 96.8 0.1 201326 年 96.8 ▲ 1.0 95.6 ▲ 1.2 2014
平成 24 年度 96.7 ▲ 0.6 96.1 0.4 F.Y. 201225 年度 98.9 2.3 97.9 1.9 201326 年度 96.2 ▲ 2.7 94.9 ▲ 3.1 2014
平成26 年 Ⅰ期 100.6 2.1 88.9 5.3 99.6 2.4 88.0 5.3 Q1 2014Ⅱ期 95.2 ▲ 5.4 99.2 ▲ 2.5 92.8 ▲ 6.8 95.1 ▲ 4.6 Q2Ⅲ期 95.5 0.3 99.5 ▲ 3.4 94.8 2.2 99.2 ▲ 2.6 Q3Ⅳ期 96.8 1.4 99.8 ▲ 2.3 95.5 0.7 100.0 ▲ 1.9 Q4
平成27 年 Ⅰ期 97.8 1.0 86.4 ▲ 2.8 96.3 0.8 85.1 ▲ 3.3 Q1 2015
平成26 年 3月 101.2 1.1 100.3 6.4 104.3 8.0 104.3 10.4 Mar. 20144月 92.0 ▲ 9.1 97.5 ▲ 5.1 88.7 ▲ 15.0 90.7 ▲ 7.7 Apr.5月 97.6 6.1 97.9 ▲ 1.3 95.7 7.9 96.4 ▲ 2.8 May6月 95.9 ▲ 1.7 102.1 ▲ 1.2 93.9 ▲ 1.9 98.1 ▲ 3.3 Jun.7月 95.9 0.0 107.1 ▲ 3.3 95.3 1.5 105.2 ▲ 2.2 Jul.8月 96.3 0.4 97.1 ▲ 3.9 95.0 ▲ 0.3 98.6 ▲ 4.1 Aug.9月 94.4 ▲ 2.0 94.4 ▲ 3.0 94.0 ▲ 1.1 93.8 ▲ 1.7 Sep.10月 95.3 1.0 96.6 ▲ 4.4 95.5 1.6 97.2 ▲ 2.2 Oct.11月 98.8 3.7 96.8 ▲ 2.2 95.7 0.2 93.3 ▲ 4.2 Nov.12月 96.4 ▲ 2.4 105.9 ▲ 0.4 95.4 ▲ 0.3 109.5 0.5 Dec.
平成27 年 1月 99.4 3.1 77.7 ▲ 2.1 97.5 2.2 76.5 ▲ 1.7 Jan. 20152月 99.0 ▲ 0.4 85.9 ▲ 1.2 98.3 0.8 83.3 1.7 Feb.3月 94.9 ▲ 4.1 95.6 ▲ 4.7 93.1 ▲ 5.3 95.6 ▲ 8.3 Mar.4月 98.1 3.4 104.0 6.7 95.9 3.0 98.0 8.0 Apr.5月 102.8 4.8 101.5 3.7 100.7 5.0 98.8 2.5 May
前月(期)比%Change From
PreviousMonth(Quarter)
前年(同月期)比
%Change FromPrevious Year
前月(期)比%Change From
PreviousMonth(Quarter)
前年(同月期)比
%Change FromPrevious Year
平成 24 年 69.1 13.3 82.1 0.2 C.Y. 201225 年 73.7 6.7 82.9 1.0 201326 年 82.4 11.8 94.9 14.5 2014
平成 24 年度 77.8 ▲ 2.1 84.5 1.7 F.Y. 201225 年度 81.3 4.5 83.9 ▲ 0.7 201326 年度 84.3 3.7 96.2 14.7 2014
平成26 年 Ⅰ期 84.7 ▲ 2.6 81.3 4.5 89.5 7.1 95.0 4.5 Q1 2014Ⅱ期 91.3 7.8 101.2 17.4 94.9 6.0 101.9 19.5 Q2Ⅲ期 93.9 2.8 92.2 14.1 97.5 2.7 92.4 18.8 Q3Ⅳ期 95.8 2.0 82.4 11.8 97.9 0.4 90.5 16.6 Q4
平成27 年 Ⅰ期 87.8 ▲ 8.4 84.3 3.7 95.1 ▲ 2.9 100.2 5.5 Q1 2015
平成26 年 3月 84.7 ▲ 12.2 81.3 4.5 77.7 ▲ 26.1 73.8 ▲ 10.4 Mar. 20144月 87.5 3.3 93.9 8.2 96.6 24.3 107.8 20.6 Apr.5月 89.1 1.8 93.8 10.5 92.2 ▲ 4.6 95.1 14.9 May6月 91.3 2.5 101.2 17.4 95.9 4.0 102.7 22.8 Jun.7月 90.0 ▲ 1.4 102.0 12.7 94.2 ▲ 1.8 94.6 15.6 Jul.8月 92.8 3.1 92.0 17.2 98.8 4.9 88.9 23.5 Aug.9月 93.9 1.2 92.2 14.1 99.6 0.8 93.6 17.6 Sep.10月 90.6 ▲ 3.5 88.8 7.4 93.1 ▲ 6.5 88.6 12.4 Oct.11月 95.3 5.2 95.8 13.6 101.7 9.2 104.1 22.5 Nov.12月 95.8 0.5 82.4 11.8 99.0 ▲ 2.7 78.8 14.2 Dec.
平成27 年 1月 93.5 ▲ 2.4 84.4 7.7 93.9 ▲ 5.2 103.8 9.7 Jan. 20152月 91.3 ▲ 2.4 87.1 ▲ 5.4 93.6 ▲ 0.3 103.9 ▲ 11.0 Feb.3月 87.8 ▲ 3.8 84.3 3.7 97.8 4.5 92.9 25.9 Mar.4月 84.8 ▲ 3.4 91.0 ▲ 3.1 85.2 ▲ 12.9 95.0 ▲ 11.9 Apr.5月 81.7 ▲ 3.7 86.0 ▲ 8.3 82.5 ▲ 3.2 85.1 ▲ 10.5 May
平成22年 =100index,2010= 100
生産 Production 生産者出荷 Shipments季節調整済指数
Seasonally AdjustedIndex
原指数Original Index
季節調整済指数Seasonally Adjusted
Index
原指数Original Index
生産者在庫 Inventory 生産者在庫率 Inventory Ratio季節調整済指数
Seasonally AdjustedIndex
原指数Original Index
季節調整済指数Seasonally Adjusted
Index
原指数Original Index
- 23 -
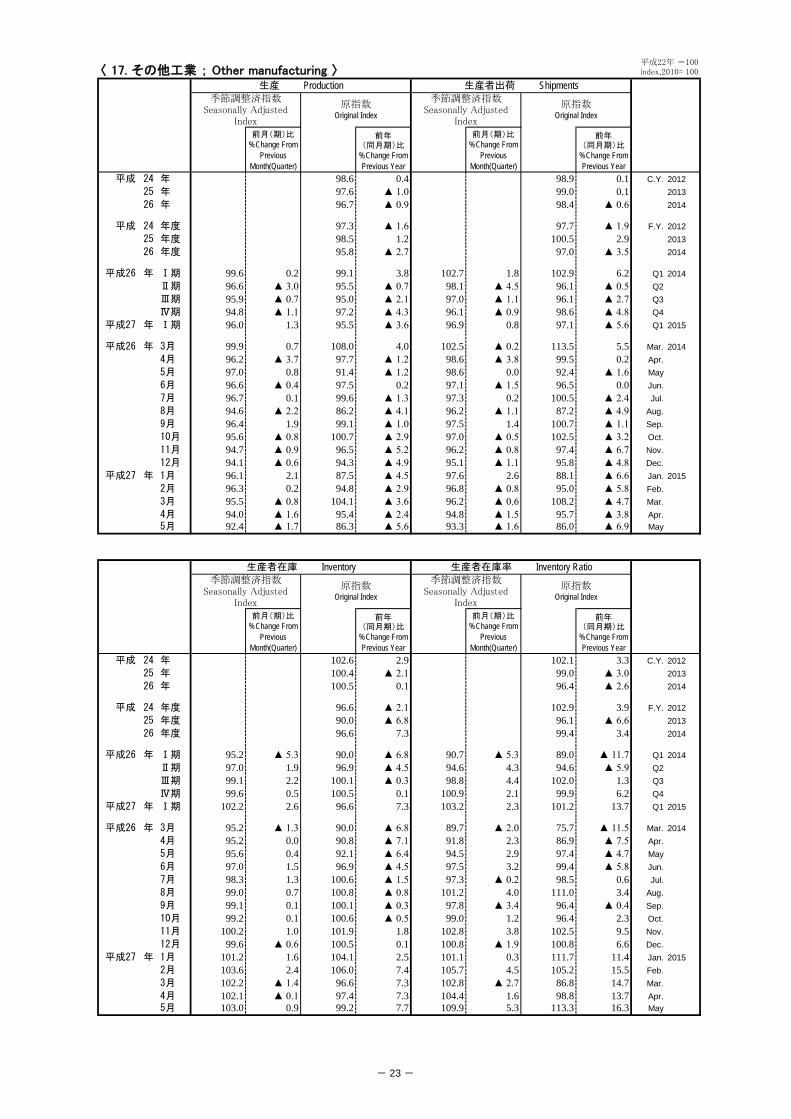
〈 17. その他工業 ; Other manufacturing 〉
前月(期)比%Change From
PreviousMonth(Quarter)
前年(同月期)比
%Change FromPrevious Year
前月(期)比%Change From
PreviousMonth(Quarter)
前年(同月期)比
%Change FromPrevious Year
平成 24 年 98.6 0.4 98.9 0.1 C.Y. 201225 年 97.6 ▲ 1.0 99.0 0.1 201326 年 96.7 ▲ 0.9 98.4 ▲ 0.6 2014
平成 24 年度 97.3 ▲ 1.6 97.7 ▲ 1.9 F.Y. 201225 年度 98.5 1.2 100.5 2.9 201326 年度 95.8 ▲ 2.7 97.0 ▲ 3.5 2014
平成26 年 Ⅰ期 99.6 0.2 99.1 3.8 102.7 1.8 102.9 6.2 Q1 2014Ⅱ期 96.6 ▲ 3.0 95.5 ▲ 0.7 98.1 ▲ 4.5 96.1 ▲ 0.5 Q2Ⅲ期 95.9 ▲ 0.7 95.0 ▲ 2.1 97.0 ▲ 1.1 96.1 ▲ 2.7 Q3Ⅳ期 94.8 ▲ 1.1 97.2 ▲ 4.3 96.1 ▲ 0.9 98.6 ▲ 4.8 Q4
平成27 年 Ⅰ期 96.0 1.3 95.5 ▲ 3.6 96.9 0.8 97.1 ▲ 5.6 Q1 2015
平成26 年 3月 99.9 0.7 108.0 4.0 102.5 ▲ 0.2 113.5 5.5 Mar. 20144月 96.2 ▲ 3.7 97.7 ▲ 1.2 98.6 ▲ 3.8 99.5 0.2 Apr.5月 97.0 0.8 91.4 ▲ 1.2 98.6 0.0 92.4 ▲ 1.6 May6月 96.6 ▲ 0.4 97.5 0.2 97.1 ▲ 1.5 96.5 0.0 Jun.7月 96.7 0.1 99.6 ▲ 1.3 97.3 0.2 100.5 ▲ 2.4 Jul.8月 94.6 ▲ 2.2 86.2 ▲ 4.1 96.2 ▲ 1.1 87.2 ▲ 4.9 Aug.9月 96.4 1.9 99.1 ▲ 1.0 97.5 1.4 100.7 ▲ 1.1 Sep.10月 95.6 ▲ 0.8 100.7 ▲ 2.9 97.0 ▲ 0.5 102.5 ▲ 3.2 Oct.11月 94.7 ▲ 0.9 96.5 ▲ 5.2 96.2 ▲ 0.8 97.4 ▲ 6.7 Nov.12月 94.1 ▲ 0.6 94.3 ▲ 4.9 95.1 ▲ 1.1 95.8 ▲ 4.8 Dec.
平成27 年 1月 96.1 2.1 87.5 ▲ 4.5 97.6 2.6 88.1 ▲ 6.6 Jan. 20152月 96.3 0.2 94.8 ▲ 2.9 96.8 ▲ 0.8 95.0 ▲ 5.8 Feb.3月 95.5 ▲ 0.8 104.1 ▲ 3.6 96.2 ▲ 0.6 108.2 ▲ 4.7 Mar.4月 94.0 ▲ 1.6 95.4 ▲ 2.4 94.8 ▲ 1.5 95.7 ▲ 3.8 Apr.5月 92.4 ▲ 1.7 86.3 ▲ 5.6 93.3 ▲ 1.6 86.0 ▲ 6.9 May
前月(期)比%Change From
PreviousMonth(Quarter)
前年(同月期)比
%Change FromPrevious Year
前月(期)比%Change From
PreviousMonth(Quarter)
前年(同月期)比
%Change FromPrevious Year
平成 24 年 102.6 2.9 102.1 3.3 C.Y. 201225 年 100.4 ▲ 2.1 99.0 ▲ 3.0 201326 年 100.5 0.1 96.4 ▲ 2.6 2014
平成 24 年度 96.6 ▲ 2.1 102.9 3.9 F.Y. 201225 年度 90.0 ▲ 6.8 96.1 ▲ 6.6 201326 年度 96.6 7.3 99.4 3.4 2014
平成26 年 Ⅰ期 95.2 ▲ 5.3 90.0 ▲ 6.8 90.7 ▲ 5.3 89.0 ▲ 11.7 Q1 2014Ⅱ期 97.0 1.9 96.9 ▲ 4.5 94.6 4.3 94.6 ▲ 5.9 Q2Ⅲ期 99.1 2.2 100.1 ▲ 0.3 98.8 4.4 102.0 1.3 Q3Ⅳ期 99.6 0.5 100.5 0.1 100.9 2.1 99.9 6.2 Q4
平成27 年 Ⅰ期 102.2 2.6 96.6 7.3 103.2 2.3 101.2 13.7 Q1 2015
平成26 年 3月 95.2 ▲ 1.3 90.0 ▲ 6.8 89.7 ▲ 2.0 75.7 ▲ 11.5 Mar. 20144月 95.2 0.0 90.8 ▲ 7.1 91.8 2.3 86.9 ▲ 7.5 Apr.5月 95.6 0.4 92.1 ▲ 6.4 94.5 2.9 97.4 ▲ 4.7 May6月 97.0 1.5 96.9 ▲ 4.5 97.5 3.2 99.4 ▲ 5.8 Jun.7月 98.3 1.3 100.6 ▲ 1.5 97.3 ▲ 0.2 98.5 0.6 Jul.8月 99.0 0.7 100.8 ▲ 0.8 101.2 4.0 111.0 3.4 Aug.9月 99.1 0.1 100.1 ▲ 0.3 97.8 ▲ 3.4 96.4 ▲ 0.4 Sep.10月 99.2 0.1 100.6 ▲ 0.5 99.0 1.2 96.4 2.3 Oct.11月 100.2 1.0 101.9 1.8 102.8 3.8 102.5 9.5 Nov.12月 99.6 ▲ 0.6 100.5 0.1 100.8 ▲ 1.9 100.8 6.6 Dec.
平成27 年 1月 101.2 1.6 104.1 2.5 101.1 0.3 111.7 11.4 Jan. 20152月 103.6 2.4 106.0 7.4 105.7 4.5 105.2 15.5 Feb.3月 102.2 ▲ 1.4 96.6 7.3 102.8 ▲ 2.7 86.8 14.7 Mar.4月 102.1 ▲ 0.1 97.4 7.3 104.4 1.6 98.8 13.7 Apr.5月 103.0 0.9 99.2 7.7 109.9 5.3 113.3 16.3 May
平成22年 =100index,2010= 100
生産 Production 生産者出荷 Shipments季節調整済指数
Seasonally AdjustedIndex
原指数Original Index
季節調整済指数Seasonally Adjusted
Index
原指数Original Index
生産者在庫 Inventory 生産者在庫率 Inventory Ratio季節調整済指数
Seasonally AdjustedIndex
原指数Original Index
季節調整済指数Seasonally Adjusted
Index
原指数Original Index
- 24 -
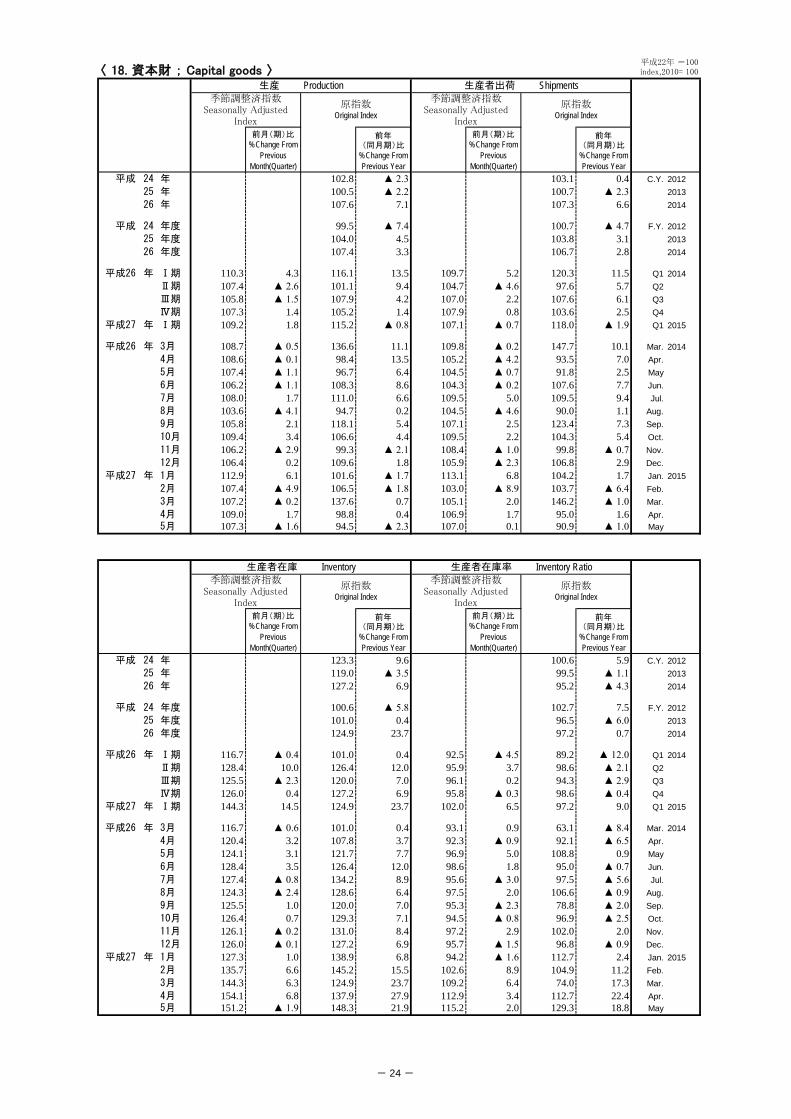
〈 18. 資本財 ; Capital goods 〉
前月(期)比%Change From
PreviousMonth(Quarter)
前年(同月期)比
%Change FromPrevious Year
前月(期)比%Change From
PreviousMonth(Quarter)
前年(同月期)比
%Change FromPrevious Year
平成 24 年 102.8 ▲ 2.3 103.1 0.4 C.Y. 201225 年 100.5 ▲ 2.2 100.7 ▲ 2.3 201326 年 107.6 7.1 107.3 6.6 2014
平成 24 年度 99.5 ▲ 7.4 100.7 ▲ 4.7 F.Y. 201225 年度 104.0 4.5 103.8 3.1 201326 年度 107.4 3.3 106.7 2.8 2014
平成26 年 Ⅰ期 110.3 4.3 116.1 13.5 109.7 5.2 120.3 11.5 Q1 2014Ⅱ期 107.4 ▲ 2.6 101.1 9.4 104.7 ▲ 4.6 97.6 5.7 Q2Ⅲ期 105.8 ▲ 1.5 107.9 4.2 107.0 2.2 107.6 6.1 Q3Ⅳ期 107.3 1.4 105.2 1.4 107.9 0.8 103.6 2.5 Q4
平成27 年 Ⅰ期 109.2 1.8 115.2 ▲ 0.8 107.1 ▲ 0.7 118.0 ▲ 1.9 Q1 2015
平成26 年 3月 108.7 ▲ 0.5 136.6 11.1 109.8 ▲ 0.2 147.7 10.1 Mar. 20144月 108.6 ▲ 0.1 98.4 13.5 105.2 ▲ 4.2 93.5 7.0 Apr.5月 107.4 ▲ 1.1 96.7 6.4 104.5 ▲ 0.7 91.8 2.5 May6月 106.2 ▲ 1.1 108.3 8.6 104.3 ▲ 0.2 107.6 7.7 Jun.7月 108.0 1.7 111.0 6.6 109.5 5.0 109.5 9.4 Jul.8月 103.6 ▲ 4.1 94.7 0.2 104.5 ▲ 4.6 90.0 1.1 Aug.9月 105.8 2.1 118.1 5.4 107.1 2.5 123.4 7.3 Sep.10月 109.4 3.4 106.6 4.4 109.5 2.2 104.3 5.4 Oct.11月 106.2 ▲ 2.9 99.3 ▲ 2.1 108.4 ▲ 1.0 99.8 ▲ 0.7 Nov.12月 106.4 0.2 109.6 1.8 105.9 ▲ 2.3 106.8 2.9 Dec.
平成27 年 1月 112.9 6.1 101.6 ▲ 1.7 113.1 6.8 104.2 1.7 Jan. 20152月 107.4 ▲ 4.9 106.5 ▲ 1.8 103.0 ▲ 8.9 103.7 ▲ 6.4 Feb.3月 107.2 ▲ 0.2 137.6 0.7 105.1 2.0 146.2 ▲ 1.0 Mar.4月 109.0 1.7 98.8 0.4 106.9 1.7 95.0 1.6 Apr.5月 107.3 ▲ 1.6 94.5 ▲ 2.3 107.0 0.1 90.9 ▲ 1.0 May
前月(期)比%Change From
PreviousMonth(Quarter)
前年(同月期)比
%Change FromPrevious Year
前月(期)比%Change From
PreviousMonth(Quarter)
前年(同月期)比
%Change FromPrevious Year
平成 24 年 123.3 9.6 100.6 5.9 C.Y. 201225 年 119.0 ▲ 3.5 99.5 ▲ 1.1 201326 年 127.2 6.9 95.2 ▲ 4.3 2014
平成 24 年度 100.6 ▲ 5.8 102.7 7.5 F.Y. 201225 年度 101.0 0.4 96.5 ▲ 6.0 201326 年度 124.9 23.7 97.2 0.7 2014
平成26 年 Ⅰ期 116.7 ▲ 0.4 101.0 0.4 92.5 ▲ 4.5 89.2 ▲ 12.0 Q1 2014Ⅱ期 128.4 10.0 126.4 12.0 95.9 3.7 98.6 ▲ 2.1 Q2Ⅲ期 125.5 ▲ 2.3 120.0 7.0 96.1 0.2 94.3 ▲ 2.9 Q3Ⅳ期 126.0 0.4 127.2 6.9 95.8 ▲ 0.3 98.6 ▲ 0.4 Q4
平成27 年 Ⅰ期 144.3 14.5 124.9 23.7 102.0 6.5 97.2 9.0 Q1 2015
平成26 年 3月 116.7 ▲ 0.6 101.0 0.4 93.1 0.9 63.1 ▲ 8.4 Mar. 20144月 120.4 3.2 107.8 3.7 92.3 ▲ 0.9 92.1 ▲ 6.5 Apr.5月 124.1 3.1 121.7 7.7 96.9 5.0 108.8 0.9 May6月 128.4 3.5 126.4 12.0 98.6 1.8 95.0 ▲ 0.7 Jun.7月 127.4 ▲ 0.8 134.2 8.9 95.6 ▲ 3.0 97.5 ▲ 5.6 Jul.8月 124.3 ▲ 2.4 128.6 6.4 97.5 2.0 106.6 ▲ 0.9 Aug.9月 125.5 1.0 120.0 7.0 95.3 ▲ 2.3 78.8 ▲ 2.0 Sep.10月 126.4 0.7 129.3 7.1 94.5 ▲ 0.8 96.9 ▲ 2.5 Oct.11月 126.1 ▲ 0.2 131.0 8.4 97.2 2.9 102.0 2.0 Nov.12月 126.0 ▲ 0.1 127.2 6.9 95.7 ▲ 1.5 96.8 ▲ 0.9 Dec.
平成27 年 1月 127.3 1.0 138.9 6.8 94.2 ▲ 1.6 112.7 2.4 Jan. 20152月 135.7 6.6 145.2 15.5 102.6 8.9 104.9 11.2 Feb.3月 144.3 6.3 124.9 23.7 109.2 6.4 74.0 17.3 Mar.4月 154.1 6.8 137.9 27.9 112.9 3.4 112.7 22.4 Apr.5月 151.2 ▲ 1.9 148.3 21.9 115.2 2.0 129.3 18.8 May
平成22年 =100index,2010= 100
生産 Production 生産者出荷 Shipments季節調整済指数
Seasonally AdjustedIndex
原指数Original Index
季節調整済指数Seasonally Adjusted
Index
原指数Original Index
生産者在庫 Inventory 生産者在庫率 Inventory Ratio季節調整済指数
Seasonally AdjustedIndex
原指数Original Index
季節調整済指数Seasonally Adjusted
Index
原指数Original Index
- 25 -
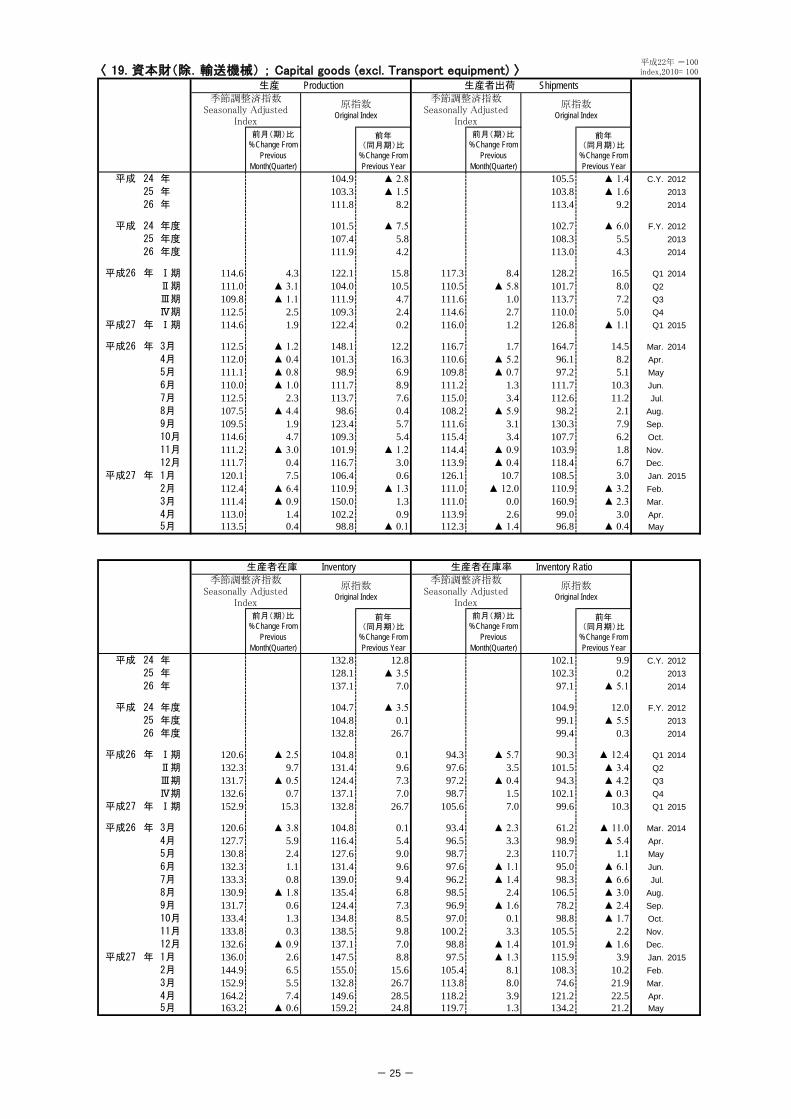
〈 19. 資本財(除.輸送機械) ; Capital goods (excl. Transport equipment) 〉
前月(期)比%Change From
PreviousMonth(Quarter)
前年(同月期)比
%Change FromPrevious Year
前月(期)比%Change From
PreviousMonth(Quarter)
前年(同月期)比
%Change FromPrevious Year
平成 24 年 104.9 ▲ 2.8 105.5 ▲ 1.4 C.Y. 201225 年 103.3 ▲ 1.5 103.8 ▲ 1.6 201326 年 111.8 8.2 113.4 9.2 2014
平成 24 年度 101.5 ▲ 7.5 102.7 ▲ 6.0 F.Y. 201225 年度 107.4 5.8 108.3 5.5 201326 年度 111.9 4.2 113.0 4.3 2014
平成26 年 Ⅰ期 114.6 4.3 122.1 15.8 117.3 8.4 128.2 16.5 Q1 2014Ⅱ期 111.0 ▲ 3.1 104.0 10.5 110.5 ▲ 5.8 101.7 8.0 Q2Ⅲ期 109.8 ▲ 1.1 111.9 4.7 111.6 1.0 113.7 7.2 Q3Ⅳ期 112.5 2.5 109.3 2.4 114.6 2.7 110.0 5.0 Q4
平成27 年 Ⅰ期 114.6 1.9 122.4 0.2 116.0 1.2 126.8 ▲ 1.1 Q1 2015
平成26 年 3月 112.5 ▲ 1.2 148.1 12.2 116.7 1.7 164.7 14.5 Mar. 20144月 112.0 ▲ 0.4 101.3 16.3 110.6 ▲ 5.2 96.1 8.2 Apr.5月 111.1 ▲ 0.8 98.9 6.9 109.8 ▲ 0.7 97.2 5.1 May6月 110.0 ▲ 1.0 111.7 8.9 111.2 1.3 111.7 10.3 Jun.7月 112.5 2.3 113.7 7.6 115.0 3.4 112.6 11.2 Jul.8月 107.5 ▲ 4.4 98.6 0.4 108.2 ▲ 5.9 98.2 2.1 Aug.9月 109.5 1.9 123.4 5.7 111.6 3.1 130.3 7.9 Sep.10月 114.6 4.7 109.3 5.4 115.4 3.4 107.7 6.2 Oct.11月 111.2 ▲ 3.0 101.9 ▲ 1.2 114.4 ▲ 0.9 103.9 1.8 Nov.12月 111.7 0.4 116.7 3.0 113.9 ▲ 0.4 118.4 6.7 Dec.
平成27 年 1月 120.1 7.5 106.4 0.6 126.1 10.7 108.5 3.0 Jan. 20152月 112.4 ▲ 6.4 110.9 ▲ 1.3 111.0 ▲ 12.0 110.9 ▲ 3.2 Feb.3月 111.4 ▲ 0.9 150.0 1.3 111.0 0.0 160.9 ▲ 2.3 Mar.4月 113.0 1.4 102.2 0.9 113.9 2.6 99.0 3.0 Apr.5月 113.5 0.4 98.8 ▲ 0.1 112.3 ▲ 1.4 96.8 ▲ 0.4 May
前月(期)比%Change From
PreviousMonth(Quarter)
前年(同月期)比
%Change FromPrevious Year
前月(期)比%Change From
PreviousMonth(Quarter)
前年(同月期)比
%Change FromPrevious Year
平成 24 年 132.8 12.8 102.1 9.9 C.Y. 201225 年 128.1 ▲ 3.5 102.3 0.2 201326 年 137.1 7.0 97.1 ▲ 5.1 2014
平成 24 年度 104.7 ▲ 3.5 104.9 12.0 F.Y. 201225 年度 104.8 0.1 99.1 ▲ 5.5 201326 年度 132.8 26.7 99.4 0.3 2014
平成26 年 Ⅰ期 120.6 ▲ 2.5 104.8 0.1 94.3 ▲ 5.7 90.3 ▲ 12.4 Q1 2014Ⅱ期 132.3 9.7 131.4 9.6 97.6 3.5 101.5 ▲ 3.4 Q2Ⅲ期 131.7 ▲ 0.5 124.4 7.3 97.2 ▲ 0.4 94.3 ▲ 4.2 Q3Ⅳ期 132.6 0.7 137.1 7.0 98.7 1.5 102.1 ▲ 0.3 Q4
平成27 年 Ⅰ期 152.9 15.3 132.8 26.7 105.6 7.0 99.6 10.3 Q1 2015
平成26 年 3月 120.6 ▲ 3.8 104.8 0.1 93.4 ▲ 2.3 61.2 ▲ 11.0 Mar. 20144月 127.7 5.9 116.4 5.4 96.5 3.3 98.9 ▲ 5.4 Apr.5月 130.8 2.4 127.6 9.0 98.7 2.3 110.7 1.1 May6月 132.3 1.1 131.4 9.6 97.6 ▲ 1.1 95.0 ▲ 6.1 Jun.7月 133.3 0.8 139.0 9.4 96.2 ▲ 1.4 98.3 ▲ 6.6 Jul.8月 130.9 ▲ 1.8 135.4 6.8 98.5 2.4 106.5 ▲ 3.0 Aug.9月 131.7 0.6 124.4 7.3 96.9 ▲ 1.6 78.2 ▲ 2.4 Sep.10月 133.4 1.3 134.8 8.5 97.0 0.1 98.8 ▲ 1.7 Oct.11月 133.8 0.3 138.5 9.8 100.2 3.3 105.5 2.2 Nov.12月 132.6 ▲ 0.9 137.1 7.0 98.8 ▲ 1.4 101.9 ▲ 1.6 Dec.
平成27 年 1月 136.0 2.6 147.5 8.8 97.5 ▲ 1.3 115.9 3.9 Jan. 20152月 144.9 6.5 155.0 15.6 105.4 8.1 108.3 10.2 Feb.3月 152.9 5.5 132.8 26.7 113.8 8.0 74.6 21.9 Mar.4月 164.2 7.4 149.6 28.5 118.2 3.9 121.2 22.5 Apr.5月 163.2 ▲ 0.6 159.2 24.8 119.7 1.3 134.2 21.2 May
平成22年 =100index,2010= 100
生産 Production 生産者出荷 Shipments季節調整済指数
Seasonally AdjustedIndex
原指数Original Index
季節調整済指数Seasonally Adjusted
Index
原指数Original Index
生産者在庫 Inventory 生産者在庫率 Inventory Ratio季節調整済指数
Seasonally AdjustedIndex
原指数Original Index
季節調整済指数Seasonally Adjusted
Index
原指数Original Index
- 26 -
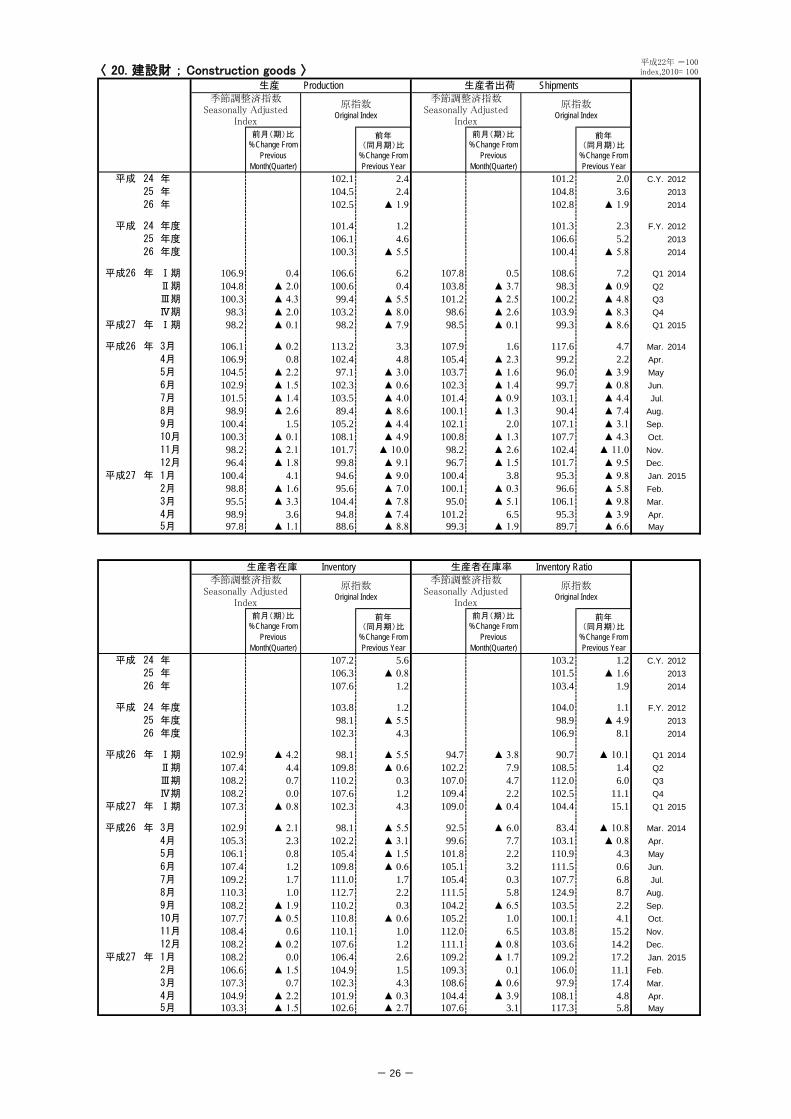
〈 20. 建設財 ; Construction goods 〉
前月(期)比%Change From
PreviousMonth(Quarter)
前年(同月期)比
%Change FromPrevious Year
前月(期)比%Change From
PreviousMonth(Quarter)
前年(同月期)比
%Change FromPrevious Year
平成 24 年 102.1 2.4 101.2 2.0 C.Y. 201225 年 104.5 2.4 104.8 3.6 201326 年 102.5 ▲ 1.9 102.8 ▲ 1.9 2014
平成 24 年度 101.4 1.2 101.3 2.3 F.Y. 201225 年度 106.1 4.6 106.6 5.2 201326 年度 100.3 ▲ 5.5 100.4 ▲ 5.8 2014
平成26 年 Ⅰ期 106.9 0.4 106.6 6.2 107.8 0.5 108.6 7.2 Q1 2014Ⅱ期 104.8 ▲ 2.0 100.6 0.4 103.8 ▲ 3.7 98.3 ▲ 0.9 Q2Ⅲ期 100.3 ▲ 4.3 99.4 ▲ 5.5 101.2 ▲ 2.5 100.2 ▲ 4.8 Q3Ⅳ期 98.3 ▲ 2.0 103.2 ▲ 8.0 98.6 ▲ 2.6 103.9 ▲ 8.3 Q4
平成27 年 Ⅰ期 98.2 ▲ 0.1 98.2 ▲ 7.9 98.5 ▲ 0.1 99.3 ▲ 8.6 Q1 2015
平成26 年 3月 106.1 ▲ 0.2 113.2 3.3 107.9 1.6 117.6 4.7 Mar. 20144月 106.9 0.8 102.4 4.8 105.4 ▲ 2.3 99.2 2.2 Apr.5月 104.5 ▲ 2.2 97.1 ▲ 3.0 103.7 ▲ 1.6 96.0 ▲ 3.9 May6月 102.9 ▲ 1.5 102.3 ▲ 0.6 102.3 ▲ 1.4 99.7 ▲ 0.8 Jun.7月 101.5 ▲ 1.4 103.5 ▲ 4.0 101.4 ▲ 0.9 103.1 ▲ 4.4 Jul.8月 98.9 ▲ 2.6 89.4 ▲ 8.6 100.1 ▲ 1.3 90.4 ▲ 7.4 Aug.9月 100.4 1.5 105.2 ▲ 4.4 102.1 2.0 107.1 ▲ 3.1 Sep.10月 100.3 ▲ 0.1 108.1 ▲ 4.9 100.8 ▲ 1.3 107.7 ▲ 4.3 Oct.11月 98.2 ▲ 2.1 101.7 ▲ 10.0 98.2 ▲ 2.6 102.4 ▲ 11.0 Nov.12月 96.4 ▲ 1.8 99.8 ▲ 9.1 96.7 ▲ 1.5 101.7 ▲ 9.5 Dec.
平成27 年 1月 100.4 4.1 94.6 ▲ 9.0 100.4 3.8 95.3 ▲ 9.8 Jan. 20152月 98.8 ▲ 1.6 95.6 ▲ 7.0 100.1 ▲ 0.3 96.6 ▲ 5.8 Feb.3月 95.5 ▲ 3.3 104.4 ▲ 7.8 95.0 ▲ 5.1 106.1 ▲ 9.8 Mar.4月 98.9 3.6 94.8 ▲ 7.4 101.2 6.5 95.3 ▲ 3.9 Apr.5月 97.8 ▲ 1.1 88.6 ▲ 8.8 99.3 ▲ 1.9 89.7 ▲ 6.6 May
前月(期)比%Change From
PreviousMonth(Quarter)
前年(同月期)比
%Change FromPrevious Year
前月(期)比%Change From
PreviousMonth(Quarter)
前年(同月期)比
%Change FromPrevious Year
平成 24 年 107.2 5.6 103.2 1.2 C.Y. 201225 年 106.3 ▲ 0.8 101.5 ▲ 1.6 201326 年 107.6 1.2 103.4 1.9 2014
平成 24 年度 103.8 1.2 104.0 1.1 F.Y. 201225 年度 98.1 ▲ 5.5 98.9 ▲ 4.9 201326 年度 102.3 4.3 106.9 8.1 2014
平成26 年 Ⅰ期 102.9 ▲ 4.2 98.1 ▲ 5.5 94.7 ▲ 3.8 90.7 ▲ 10.1 Q1 2014Ⅱ期 107.4 4.4 109.8 ▲ 0.6 102.2 7.9 108.5 1.4 Q2Ⅲ期 108.2 0.7 110.2 0.3 107.0 4.7 112.0 6.0 Q3Ⅳ期 108.2 0.0 107.6 1.2 109.4 2.2 102.5 11.1 Q4
平成27 年 Ⅰ期 107.3 ▲ 0.8 102.3 4.3 109.0 ▲ 0.4 104.4 15.1 Q1 2015
平成26 年 3月 102.9 ▲ 2.1 98.1 ▲ 5.5 92.5 ▲ 6.0 83.4 ▲ 10.8 Mar. 20144月 105.3 2.3 102.2 ▲ 3.1 99.6 7.7 103.1 ▲ 0.8 Apr.5月 106.1 0.8 105.4 ▲ 1.5 101.8 2.2 110.9 4.3 May6月 107.4 1.2 109.8 ▲ 0.6 105.1 3.2 111.5 0.6 Jun.7月 109.2 1.7 111.0 1.7 105.4 0.3 107.7 6.8 Jul.8月 110.3 1.0 112.7 2.2 111.5 5.8 124.9 8.7 Aug.9月 108.2 ▲ 1.9 110.2 0.3 104.2 ▲ 6.5 103.5 2.2 Sep.10月 107.7 ▲ 0.5 110.8 ▲ 0.6 105.2 1.0 100.1 4.1 Oct.11月 108.4 0.6 110.1 1.0 112.0 6.5 103.8 15.2 Nov.12月 108.2 ▲ 0.2 107.6 1.2 111.1 ▲ 0.8 103.6 14.2 Dec.
平成27 年 1月 108.2 0.0 106.4 2.6 109.2 ▲ 1.7 109.2 17.2 Jan. 20152月 106.6 ▲ 1.5 104.9 1.5 109.3 0.1 106.0 11.1 Feb.3月 107.3 0.7 102.3 4.3 108.6 ▲ 0.6 97.9 17.4 Mar.4月 104.9 ▲ 2.2 101.9 ▲ 0.3 104.4 ▲ 3.9 108.1 4.8 Apr.5月 103.3 ▲ 1.5 102.6 ▲ 2.7 107.6 3.1 117.3 5.8 May
平成22年 =100index,2010= 100
生産 Production 生産者出荷 Shipments季節調整済指数
Seasonally AdjustedIndex
原指数Original Index
季節調整済指数Seasonally Adjusted
Index
原指数Original Index
生産者在庫 Inventory 生産者在庫率 Inventory Ratio季節調整済指数
Seasonally AdjustedIndex
原指数Original Index
季節調整済指数Seasonally Adjusted
Index
原指数Original Index

- 27 -
〈 21. 耐久消費財 ; Durable consumer goods 〉
前月(期)比%Change From
PreviousMonth(Quarter)
前年(同月期)比
%Change FromPrevious Year
前月(期)比%Change From
PreviousMonth(Quarter)
前年(同月期)比
%Change FromPrevious Year
平成 24 年 93.5 5.9 91.7 3.6 C.Y. 201225 年 89.3 ▲ 4.5 88.0 ▲ 4.0 201326 年 88.4 ▲ 1.0 85.8 ▲ 2.5 2014
平成 24 年度 88.8 ▲ 5.1 88.1 ▲ 4.7 F.Y. 201225 年度 92.0 3.6 89.9 2.0 201326 年度 85.9 ▲ 6.6 83.9 ▲ 6.7 2014
平成26 年 Ⅰ期 95.5 2.2 95.7 12.7 92.1 1.2 95.2 8.4 Q1 2014Ⅱ期 91.2 ▲ 4.5 89.6 3.8 87.5 ▲ 5.0 82.7 0.4 Q2Ⅲ期 84.0 ▲ 7.9 85.3 ▲ 7.1 82.8 ▲ 5.4 83.7 ▲ 6.3 Q3Ⅳ期 82.8 ▲ 1.4 82.8 ▲ 11.9 80.8 ▲ 2.4 81.8 ▲ 11.7 Q4
平成27 年 Ⅰ期 86.0 3.9 85.8 ▲ 10.3 85.2 5.4 87.4 ▲ 8.2 Q1 2015
平成26 年 3月 95.7 2.1 101.2 13.2 90.4 ▲ 0.6 103.0 6.8 Mar. 20144月 91.8 ▲ 4.1 87.3 3.9 90.4 0.0 81.5 4.2 Apr.5月 93.4 1.7 86.5 3.7 86.9 ▲ 3.9 76.1 ▲ 0.9 May6月 88.4 ▲ 5.4 95.1 3.8 85.1 ▲ 2.1 90.5 ▲ 1.8 Jun.7月 85.7 ▲ 3.1 97.3 ▲ 4.5 83.3 ▲ 2.1 90.6 ▲ 4.5 Jul.8月 82.0 ▲ 4.3 69.3 ▲ 11.2 81.2 ▲ 2.5 68.7 ▲ 11.0 Aug.9月 84.4 2.9 89.2 ▲ 6.6 84.0 3.4 91.7 ▲ 4.2 Sep.10月 83.2 ▲ 1.4 86.9 ▲ 11.2 81.2 ▲ 3.3 81.5 ▲ 10.5 Oct.11月 81.9 ▲ 1.6 79.4 ▲ 15.6 79.6 ▲ 2.0 78.6 ▲ 16.7 Nov.12月 83.2 1.6 82.2 ▲ 8.8 81.6 2.5 85.3 ▲ 7.7 Dec.
平成27 年 1月 86.7 4.2 80.2 ▲ 13.2 85.9 5.3 77.7 ▲ 11.9 Jan. 20152月 85.5 ▲ 1.4 85.4 ▲ 8.8 82.9 ▲ 3.5 86.0 ▲ 8.8 Feb.3月 85.7 0.2 91.7 ▲ 9.4 86.8 4.7 98.5 ▲ 4.4 Mar.4月 84.1 ▲ 1.9 79.9 ▲ 8.5 80.7 ▲ 7.0 72.8 ▲ 10.7 Apr.5月 81.2 ▲ 3.4 74.3 ▲ 14.1 75.9 ▲ 5.9 66.7 ▲ 12.4 May
前月(期)比%Change From
PreviousMonth(Quarter)
前年(同月期)比
%Change FromPrevious Year
前月(期)比%Change From
PreviousMonth(Quarter)
前年(同月期)比
%Change FromPrevious Year
平成 24 年 123.5 32.1 131.9 26.8 C.Y. 201225 年 91.0 ▲ 26.3 97.6 ▲ 26.0 201326 年 122.1 34.2 111.5 14.2 2014
平成 24 年度 81.6 ▲ 18.1 133.5 32.8 F.Y. 201225 年度 81.5 ▲ 0.1 90.5 ▲ 32.2 201326 年度 93.5 14.7 119.1 31.6 2014
平成26 年 Ⅰ期 100.5 15.8 81.5 ▲ 0.1 89.0 6.8 84.0 ▲ 25.3 Q1 2014Ⅱ期 115.7 15.1 110.5 24.4 103.2 16.0 98.6 4.6 Q2Ⅲ期 122.0 5.4 117.4 32.1 126.4 22.5 131.1 37.7 Q3Ⅳ期 120.5 ▲ 1.2 122.1 34.2 124.4 ▲ 1.6 132.5 49.9 Q4
平成27 年 Ⅰ期 115.3 ▲ 4.3 93.5 14.7 119.1 ▲ 4.3 114.3 36.1 Q1 2015
平成26 年 3月 100.5 7.3 81.5 ▲ 0.1 97.0 11.2 67.2 ▲ 9.6 Mar. 20144月 96.5 ▲ 4.0 82.6 ▲ 4.3 91.5 ▲ 5.7 80.4 ▲ 11.8 Apr.5月 105.9 9.7 103.6 5.7 101.4 10.8 110.2 3.4 May6月 115.7 9.3 110.5 24.4 116.8 15.2 105.2 23.8 Jun.7月 120.4 4.1 125.5 25.1 117.5 0.6 124.6 22.5 Jul.8月 122.1 1.4 126.6 32.6 137.7 17.2 162.0 51.3 Aug.9月 122.0 ▲ 0.1 117.4 32.1 124.1 ▲ 9.9 106.7 39.1 Sep.10月 119.0 ▲ 2.5 131.1 27.7 125.1 0.8 140.6 47.2 Oct.11月 119.8 0.7 134.2 33.1 126.6 1.2 138.9 56.4 Nov.12月 120.5 0.6 122.1 34.2 121.6 ▲ 3.9 117.9 45.6 Dec.
平成27 年 1月 117.5 ▲ 2.5 129.6 26.3 117.5 ▲ 3.4 141.6 41.6 Jan. 20152月 120.5 2.6 124.2 28.6 125.1 6.5 121.7 43.5 Feb.3月 115.3 ▲ 4.3 93.5 14.7 114.8 ▲ 8.2 79.5 18.3 Mar.4月 116.8 1.3 100.0 21.1 127.3 10.9 111.8 39.1 Apr.5月 111.9 ▲ 4.2 109.5 5.7 117.9 ▲ 7.4 128.2 16.3 May
平成22年 =100index,2010= 100
生産 Production 生産者出荷 Shipments季節調整済指数
Seasonally AdjustedIndex
原指数Original Index
季節調整済指数Seasonally Adjusted
Index
原指数Original Index
生産者在庫 Inventory 生産者在庫率 Inventory Ratio季節調整済指数
Seasonally AdjustedIndex
原指数Original Index
季節調整済指数Seasonally Adjusted
Index
原指数Original Index
- 28 -
〈 22. 非耐久消費財 ; Non-durable consumer goods 〉
前月(期)比%Change From
PreviousMonth(Quarter)
前年(同月期)比
%Change FromPrevious Year
前月(期)比%Change From
PreviousMonth(Quarter)
前年(同月期)比
%Change FromPrevious Year
平成 24 年 99.6 0.7 98.3 0.9 C.Y. 201225 年 99.2 ▲ 0.4 98.1 ▲ 0.2 201326 年 99.0 ▲ 0.2 97.3 ▲ 0.8 2014
平成 24 年度 99.1 ▲ 1.0 97.8 ▲ 0.2 F.Y. 201225 年度 100.3 1.2 99.2 1.4 201326 年度 98.4 ▲ 1.9 96.5 ▲ 2.7 2014
平成26 年 Ⅰ期 103.0 3.8 95.8 4.6 101.3 3.2 95.8 5.2 Q1 2014Ⅱ期 98.5 ▲ 4.4 99.9 ▲ 0.2 95.5 ▲ 5.7 94.6 ▲ 3.1 Q2Ⅲ期 97.6 ▲ 0.9 99.4 ▲ 2.5 96.2 0.7 97.9 ▲ 2.5 Q3Ⅳ期 97.6 0.0 101.0 ▲ 2.4 96.6 0.4 101.0 ▲ 2.0 Q4
平成27 年 Ⅰ期 100.1 2.6 93.2 ▲ 2.7 97.5 0.9 92.3 ▲ 3.7 Q1 2015
平成26 年 3月 103.0 0.9 103.5 4.5 105.4 6.5 108.7 8.8 Mar. 20144月 97.4 ▲ 5.4 100.7 ▲ 0.5 93.6 ▲ 11.2 93.6 ▲ 4.4 Apr.5月 100.0 2.7 96.8 ▲ 1.0 96.9 3.5 93.4 ▲ 3.1 May6月 98.2 ▲ 1.8 102.2 1.0 96.0 ▲ 0.9 96.7 ▲ 1.7 Jun.7月 97.2 ▲ 1.0 106.4 ▲ 3.4 96.1 0.1 102.0 ▲ 2.8 Jul.8月 97.7 0.5 93.4 ▲ 4.0 96.4 0.3 95.8 ▲ 3.5 Aug.9月 97.9 0.2 98.4 0.2 96.0 ▲ 0.4 96.0 ▲ 0.9 Sep.10月 98.3 0.4 104.0 ▲ 1.3 97.3 1.4 100.5 ▲ 0.9 Oct.11月 97.8 ▲ 0.5 98.1 ▲ 4.1 96.6 ▲ 0.7 95.9 ▲ 4.5 Nov.12月 96.8 ▲ 1.0 100.9 ▲ 1.8 96.0 ▲ 0.6 106.6 ▲ 0.9 Dec.
平成27 年 1月 102.0 5.4 86.0 ▲ 3.3 98.0 2.1 84.5 ▲ 3.0 Jan. 20152月 101.4 ▲ 0.6 94.4 ▲ 0.6 99.7 1.7 92.2 0.8 Feb.3月 97.0 ▲ 4.3 99.3 ▲ 4.1 94.8 ▲ 4.9 100.3 ▲ 7.7 Mar.4月 99.1 2.2 102.5 1.8 98.7 4.1 98.7 5.4 Apr.5月 100.0 0.9 94.9 ▲ 2.0 100.4 1.7 94.3 1.0 May
前月(期)比%Change From
PreviousMonth(Quarter)
前年(同月期)比
%Change FromPrevious Year
前月(期)比%Change From
PreviousMonth(Quarter)
前年(同月期)比
%Change FromPrevious Year
平成 24 年 91.0 3.6 98.7 2.1 C.Y. 201225 年 90.9 ▲ 0.1 99.3 0.6 201326 年 93.5 2.9 101.2 1.9 2014
平成 24 年度 92.6 0.2 100.4 3.1 F.Y. 201225 年度 86.3 ▲ 6.8 97.4 ▲ 3.0 201326 年度 91.8 6.4 102.7 5.4 2014
平成26 年 Ⅰ期 89.5 ▲ 6.3 86.3 ▲ 6.8 94.2 ▲ 4.5 92.6 ▲ 7.7 Q1 2014Ⅱ期 96.8 8.2 96.8 4.5 102.5 8.8 102.8 5.2 Q2Ⅲ期 97.9 1.1 99.2 3.8 103.0 0.5 106.3 3.8 Q3Ⅳ期 98.1 0.2 93.5 2.9 104.4 1.4 103.1 6.5 Q4
平成27 年 Ⅰ期 95.2 ▲ 3.0 91.8 6.4 101.0 ▲ 3.3 98.7 6.6 Q1 2015
平成26 年 3月 89.5 ▲ 8.4 86.3 ▲ 6.8 84.1 ▲ 17.1 72.5 ▲ 18.4 Mar. 20144月 95.1 6.3 93.8 ▲ 0.1 102.8 22.2 99.4 4.6 Apr.5月 96.6 1.6 95.6 3.0 102.2 ▲ 0.6 103.6 5.8 May6月 96.8 0.2 96.8 4.5 102.4 0.2 105.3 5.0 Jun.7月 96.2 ▲ 0.6 99.3 2.5 102.5 0.1 107.0 3.9 Jul.8月 96.5 0.3 97.3 2.1 103.5 1.0 107.4 4.1 Aug.9月 97.9 1.5 99.2 3.8 103.1 ▲ 0.4 104.6 3.6 Sep.10月 97.2 ▲ 0.7 100.0 2.9 102.0 ▲ 1.1 103.3 3.9 Oct.11月 98.7 1.5 102.7 4.4 107.6 5.5 113.0 10.5 Nov.12月 98.1 ▲ 0.6 93.5 2.9 103.5 ▲ 3.8 93.0 4.8 Dec.
平成27 年 1月 98.2 0.1 96.8 2.1 101.7 ▲ 1.7 108.1 5.0 Jan. 20152月 96.6 ▲ 1.6 96.4 ▲ 1.1 98.3 ▲ 3.3 99.2 ▲ 3.1 Feb.3月 95.2 ▲ 1.4 91.8 6.4 102.9 4.7 88.7 22.3 Mar.4月 93.7 ▲ 1.6 92.4 ▲ 1.5 94.7 ▲ 8.0 91.6 ▲ 7.8 Apr.5月 91.8 ▲ 2.0 90.8 ▲ 5.0 96.5 1.9 97.8 ▲ 5.6 May
平成22年 =100index,2010= 100
生産 Production 生産者出荷 Shipments季節調整済指数
Seasonally AdjustedIndex
原指数Original Index
季節調整済指数Seasonally Adjusted
Index
原指数Original Index
生産者在庫率 Inventory Ratio季節調整済指数
Seasonally AdjustedIndex
原指数Original Index
季節調整済指数Seasonally Adjusted
Index
原指数Original Index
生産者在庫 Inventory
- 29 -
〈 23. 生産財 ; Producer goods 〉
前月(期)比%Change From
PreviousMonth(Quarter)
前年(同月期)比
%Change FromPrevious Year
前月(期)比%Change From
PreviousMonth(Quarter)
前年(同月期)比
%Change FromPrevious Year
平成 24 年 96.0 0.4 96.6 0.8 C.Y. 201225 年 96.1 0.1 97.2 0.6 201326 年 98.0 2.0 98.5 1.3 2014
平成 24 年度 94.6 ▲ 1.7 95.5 ▲ 0.9 F.Y. 201225 年度 97.6 3.2 98.6 3.2 201326 年度 98.0 0.4 98.5 ▲ 0.1 2014
平成26 年 Ⅰ期 99.2 1.2 98.1 6.4 100.5 1.3 99.6 6.0 Q1 2014Ⅱ期 96.8 ▲ 2.4 95.6 1.0 97.3 ▲ 3.2 95.4 0.5 Q2Ⅲ期 97.2 0.4 98.2 ▲ 0.3 97.2 ▲ 0.1 98.5 ▲ 0.9 Q3Ⅳ期 99.0 1.9 100.0 0.8 99.4 2.3 100.7 0.3 Q4
平成27 年 Ⅰ期 99.3 0.3 98.2 0.1 100.5 1.1 99.6 0.0 Q1 2015
平成26 年 3月 99.3 0.4 103.7 5.8 99.7 ▲ 0.4 106.4 4.6 Mar. 20144月 97.1 ▲ 2.2 95.7 1.4 97.6 ▲ 2.1 95.4 1.2 Apr.5月 97.4 0.3 93.7 ▲ 0.5 97.6 0.0 93.4 ▲ 1.4 May6月 96.0 ▲ 1.4 97.5 2.1 96.8 ▲ 0.8 97.5 2.0 Jun.7月 96.3 0.3 101.6 ▲ 1.1 96.8 0.0 101.2 ▲ 1.7 Jul.8月 96.8 0.5 90.9 ▲ 1.6 95.6 ▲ 1.2 90.1 ▲ 3.7 Aug.9月 98.4 1.7 102.2 1.9 99.1 3.7 104.1 2.4 Sep.10月 98.3 ▲ 0.1 102.0 0.7 99.0 ▲ 0.1 102.5 0.5 Oct.11月 99.0 0.7 97.8 ▲ 0.6 99.2 0.2 97.7 ▲ 2.1 Nov.12月 99.7 0.7 100.3 2.6 100.0 0.8 101.8 2.4 Dec.
平成27 年 1月 101.2 1.5 95.9 0.4 103.4 3.4 96.6 0.3 Jan. 20152月 98.4 ▲ 2.8 94.7 ▲ 0.5 100.0 ▲ 3.3 96.0 ▲ 0.1 Feb.3月 98.3 ▲ 0.1 104.0 0.3 98.0 ▲ 2.0 106.2 ▲ 0.2 Mar.4月 99.3 1.0 97.9 2.3 99.3 1.3 97.1 1.8 Apr.5月 96.4 ▲ 2.9 91.5 ▲ 2.3 96.8 ▲ 2.5 91.2 ▲ 2.4 May
前月(期)比%Change From
PreviousMonth(Quarter)
前年(同月期)比
%Change FromPrevious Year
前月(期)比%Change From
PreviousMonth(Quarter)
前年(同月期)比
%Change FromPrevious Year
平成 24 年 108.3 ▲ 1.2 115.9 1.0 C.Y. 201225 年 108.7 0.4 116.5 0.5 201326 年 110.4 1.6 115.0 ▲ 1.3 2014
平成 24 年度 105.2 ▲ 0.1 116.8 0.0 F.Y. 201225 年度 105.0 ▲ 0.2 114.7 ▲ 1.8 201326 年度 106.1 1.0 116.1 1.2 2014
平成26 年 Ⅰ期 108.6 ▲ 0.4 105.0 ▲ 0.2 111.5 ▲ 1.4 112.6 ▲ 6.0 Q1 2014Ⅱ期 107.7 ▲ 0.8 106.6 ▲ 2.7 114.9 3.0 115.1 ▲ 1.2 Q2Ⅲ期 108.6 0.8 108.8 ▲ 1.3 116.1 1.0 116.3 ▲ 1.4 Q3Ⅳ期 110.5 1.7 110.4 1.6 117.6 1.3 116.0 3.8 Q4
平成27 年 Ⅰ期 109.8 ▲ 0.6 106.1 1.0 115.6 ▲ 1.7 116.8 3.7 Q1 2015
平成26 年 3月 108.6 1.4 105.0 ▲ 0.2 113.5 0.5 102.3 ▲ 3.5 Mar. 20144月 107.9 ▲ 0.6 104.9 ▲ 1.9 113.5 0.0 111.3 ▲ 2.9 Apr.5月 108.1 0.2 107.7 ▲ 1.2 114.7 1.1 118.4 1.0 May6月 107.7 ▲ 0.4 106.6 ▲ 2.7 116.5 1.6 115.6 ▲ 1.8 Jun.7月 107.4 ▲ 0.3 107.5 ▲ 2.9 113.2 ▲ 2.8 110.8 ▲ 4.2 Jul.8月 109.7 2.1 111.9 ▲ 0.7 120.1 6.1 126.1 1.0 Aug.9月 108.6 ▲ 1.0 108.8 ▲ 1.3 115.0 ▲ 4.2 112.1 ▲ 1.1 Sep.10月 108.4 ▲ 0.2 109.0 ▲ 1.4 116.4 1.2 113.8 1.5 Oct.11月 110.5 1.9 111.4 1.5 120.0 3.1 119.8 7.0 Nov.12月 110.5 0.0 110.4 1.6 116.3 ▲ 3.1 114.4 3.2 Dec.
平成27 年 1月 109.6 ▲ 0.8 112.5 1.7 112.2 ▲ 3.5 122.8 3.8 Jan. 20152月 109.4 ▲ 0.2 110.9 2.2 117.7 4.9 122.3 4.3 Feb.3月 109.8 0.4 106.1 1.0 117.0 ▲ 0.6 105.4 3.0 Mar.4月 109.2 ▲ 0.5 106.2 1.2 115.6 ▲ 1.2 113.4 1.9 Apr.5月 109.6 0.4 109.2 1.4 118.9 2.9 122.8 3.7 May
平成22年 =100index,2010= 100
生産 Production 生産者出荷 Shipments季節調整済指数
Seasonally AdjustedIndex
原指数Original Index
季節調整済指数Seasonally Adjusted
Index
原指数Original Index
生産者在庫率 Inventory Ratio季節調整済指数
Seasonally AdjustedIndex
原指数Original Index
季節調整済指数Seasonally Adjusted
Index
原指数Original Index
生産者在庫 Inventory
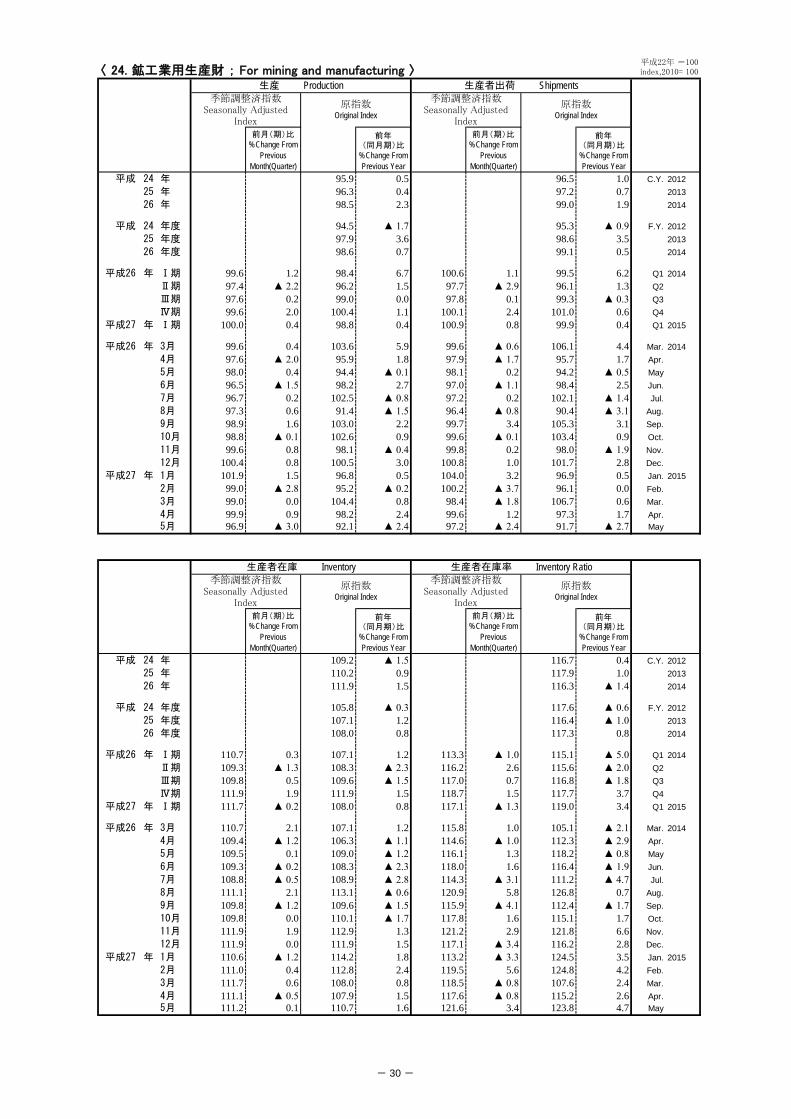
- 30 -
〈 24. 鉱工業用生産財 ; For mining and manufacturing 〉
前月(期)比%Change From
PreviousMonth(Quarter)
前年(同月期)比
%Change FromPrevious Year
前月(期)比%Change From
PreviousMonth(Quarter)
前年(同月期)比
%Change FromPrevious Year
平成 24 年 95.9 0.5 96.5 1.0 C.Y. 201225 年 96.3 0.4 97.2 0.7 201326 年 98.5 2.3 99.0 1.9 2014
平成 24 年度 94.5 ▲ 1.7 95.3 ▲ 0.9 F.Y. 201225 年度 97.9 3.6 98.6 3.5 201326 年度 98.6 0.7 99.1 0.5 2014
平成26 年 Ⅰ期 99.6 1.2 98.4 6.7 100.6 1.1 99.5 6.2 Q1 2014Ⅱ期 97.4 ▲ 2.2 96.2 1.5 97.7 ▲ 2.9 96.1 1.3 Q2Ⅲ期 97.6 0.2 99.0 0.0 97.8 0.1 99.3 ▲ 0.3 Q3Ⅳ期 99.6 2.0 100.4 1.1 100.1 2.4 101.0 0.6 Q4
平成27 年 Ⅰ期 100.0 0.4 98.8 0.4 100.9 0.8 99.9 0.4 Q1 2015
平成26 年 3月 99.6 0.4 103.6 5.9 99.6 ▲ 0.6 106.1 4.4 Mar. 20144月 97.6 ▲ 2.0 95.9 1.8 97.9 ▲ 1.7 95.7 1.7 Apr.5月 98.0 0.4 94.4 ▲ 0.1 98.1 0.2 94.2 ▲ 0.5 May6月 96.5 ▲ 1.5 98.2 2.7 97.0 ▲ 1.1 98.4 2.5 Jun.7月 96.7 0.2 102.5 ▲ 0.8 97.2 0.2 102.1 ▲ 1.4 Jul.8月 97.3 0.6 91.4 ▲ 1.5 96.4 ▲ 0.8 90.4 ▲ 3.1 Aug.9月 98.9 1.6 103.0 2.2 99.7 3.4 105.3 3.1 Sep.10月 98.8 ▲ 0.1 102.6 0.9 99.6 ▲ 0.1 103.4 0.9 Oct.11月 99.6 0.8 98.1 ▲ 0.4 99.8 0.2 98.0 ▲ 1.9 Nov.12月 100.4 0.8 100.5 3.0 100.8 1.0 101.7 2.8 Dec.
平成27 年 1月 101.9 1.5 96.8 0.5 104.0 3.2 96.9 0.5 Jan. 20152月 99.0 ▲ 2.8 95.2 ▲ 0.2 100.2 ▲ 3.7 96.1 0.0 Feb.3月 99.0 0.0 104.4 0.8 98.4 ▲ 1.8 106.7 0.6 Mar.4月 99.9 0.9 98.2 2.4 99.6 1.2 97.3 1.7 Apr.5月 96.9 ▲ 3.0 92.1 ▲ 2.4 97.2 ▲ 2.4 91.7 ▲ 2.7 May
前月(期)比%Change From
PreviousMonth(Quarter)
前年(同月期)比
%Change FromPrevious Year
前月(期)比%Change From
PreviousMonth(Quarter)
前年(同月期)比
%Change FromPrevious Year
平成 24 年 109.2 ▲ 1.5 116.7 0.4 C.Y. 201225 年 110.2 0.9 117.9 1.0 201326 年 111.9 1.5 116.3 ▲ 1.4 2014
平成 24 年度 105.8 ▲ 0.3 117.6 ▲ 0.6 F.Y. 201225 年度 107.1 1.2 116.4 ▲ 1.0 201326 年度 108.0 0.8 117.3 0.8 2014
平成26 年 Ⅰ期 110.7 0.3 107.1 1.2 113.3 ▲ 1.0 115.1 ▲ 5.0 Q1 2014Ⅱ期 109.3 ▲ 1.3 108.3 ▲ 2.3 116.2 2.6 115.6 ▲ 2.0 Q2Ⅲ期 109.8 0.5 109.6 ▲ 1.5 117.0 0.7 116.8 ▲ 1.8 Q3Ⅳ期 111.9 1.9 111.9 1.5 118.7 1.5 117.7 3.7 Q4
平成27 年 Ⅰ期 111.7 ▲ 0.2 108.0 0.8 117.1 ▲ 1.3 119.0 3.4 Q1 2015
平成26 年 3月 110.7 2.1 107.1 1.2 115.8 1.0 105.1 ▲ 2.1 Mar. 20144月 109.4 ▲ 1.2 106.3 ▲ 1.1 114.6 ▲ 1.0 112.3 ▲ 2.9 Apr.5月 109.5 0.1 109.0 ▲ 1.2 116.1 1.3 118.2 ▲ 0.8 May6月 109.3 ▲ 0.2 108.3 ▲ 2.3 118.0 1.6 116.4 ▲ 1.9 Jun.7月 108.8 ▲ 0.5 108.9 ▲ 2.8 114.3 ▲ 3.1 111.2 ▲ 4.7 Jul.8月 111.1 2.1 113.1 ▲ 0.6 120.9 5.8 126.8 0.7 Aug.9月 109.8 ▲ 1.2 109.6 ▲ 1.5 115.9 ▲ 4.1 112.4 ▲ 1.7 Sep.10月 109.8 0.0 110.1 ▲ 1.7 117.8 1.6 115.1 1.7 Oct.11月 111.9 1.9 112.9 1.3 121.2 2.9 121.8 6.6 Nov.12月 111.9 0.0 111.9 1.5 117.1 ▲ 3.4 116.2 2.8 Dec.
平成27 年 1月 110.6 ▲ 1.2 114.2 1.8 113.2 ▲ 3.3 124.5 3.5 Jan. 20152月 111.0 0.4 112.8 2.4 119.5 5.6 124.8 4.2 Feb.3月 111.7 0.6 108.0 0.8 118.5 ▲ 0.8 107.6 2.4 Mar.4月 111.1 ▲ 0.5 107.9 1.5 117.6 ▲ 0.8 115.2 2.6 Apr.5月 111.2 0.1 110.7 1.6 121.6 3.4 123.8 4.7 May
平成22年 =100index,2010= 100
生産 Production 生産者出荷 Shipments季節調整済指数
Seasonally AdjustedIndex
原指数Original Index
季節調整済指数Seasonally Adjusted
Index
原指数Original Index
生産者在庫率 Inventory Ratio季節調整済指数
Seasonally AdjustedIndex
原指数Original Index
季節調整済指数Seasonally Adjusted
Index
原指数Original Index
生産者在庫 Inventory

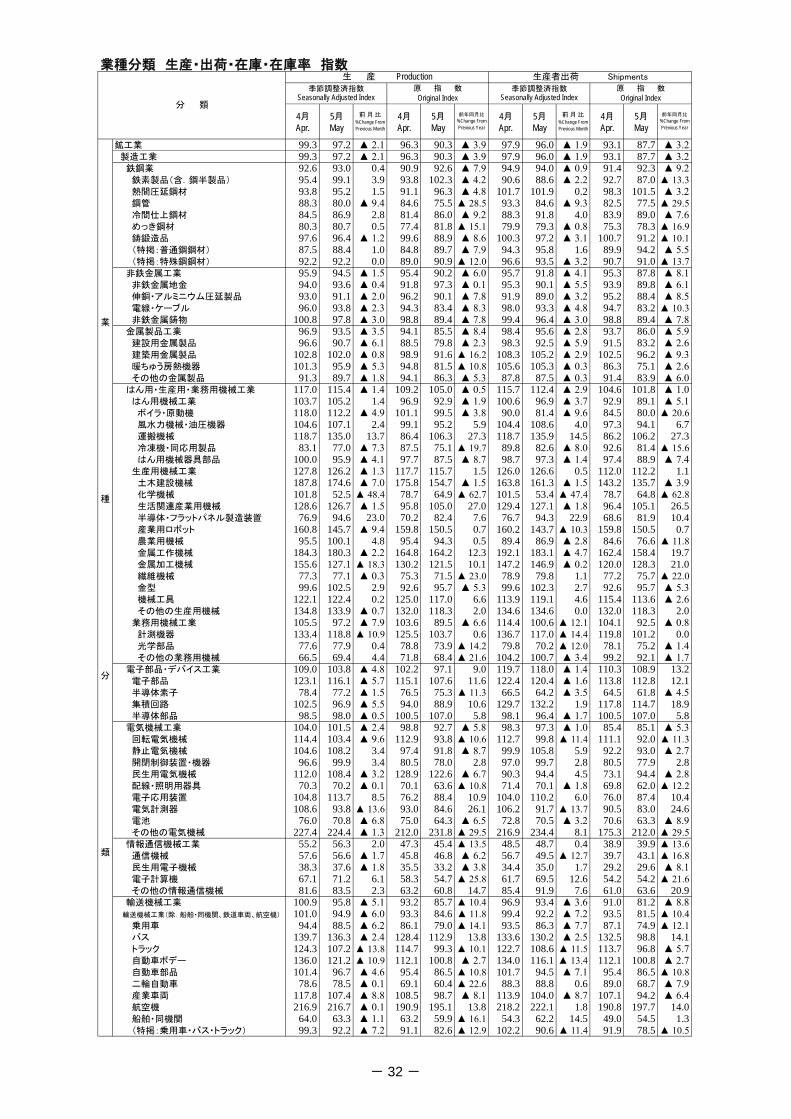
- 32 -
業種分類 生産・出荷・在庫・在庫率 指数
4月 5月 4月 5月 4月 5月 4月 5月Apr. May Apr. May Apr. May Apr. May
鉱工業 99.3 97.2 ▲ 2.1 96.3 90.3 ▲ 3.9 97.9 96.0 ▲ 1.9 93.1 87.7 ▲ 3.2 製造工業 99.3 97.2 ▲ 2.1 96.3 90.3 ▲ 3.9 97.9 96.0 ▲ 1.9 93.1 87.7 ▲ 3.2 鉄鋼業 92.6 93.0 0.4 90.9 92.6 ▲ 7.9 94.9 94.0 ▲ 0.9 91.4 92.3 ▲ 9.2 鉄素製品(含.鋼半製品) 95.4 99.1 3.9 93.8 102.3 ▲ 4.2 90.6 88.6 ▲ 2.2 92.7 87.0 ▲ 13.3 熱間圧延鋼材 93.8 95.2 1.5 91.1 96.3 ▲ 4.8 101.7 101.9 0.2 98.3 101.5 ▲ 3.2 鋼管 88.3 80.0 ▲ 9.4 84.6 75.5 ▲ 28.5 93.3 84.6 ▲ 9.3 82.5 77.5 ▲ 29.5 冷間仕上鋼材 84.5 86.9 2.8 81.4 86.0 ▲ 9.2 88.3 91.8 4.0 83.9 89.0 ▲ 7.6 めっき鋼材 80.3 80.7 0.5 77.4 81.8 ▲ 15.1 79.9 79.3 ▲ 0.8 75.3 78.3 ▲ 16.9 鋳鍛造品 97.6 96.4 ▲ 1.2 99.6 88.9 ▲ 8.6 100.3 97.2 ▲ 3.1 100.7 91.2 ▲ 10.1 (特掲:普通鋼鋼材) 87.5 88.4 1.0 84.8 89.7 ▲ 7.9 94.3 95.8 1.6 89.9 94.2 ▲ 5.5 (特掲:特殊鋼鋼材) 92.2 92.2 0.0 89.0 90.9 ▲ 12.0 96.6 93.5 ▲ 3.2 90.7 91.0 ▲ 13.7 非鉄金属工業 95.9 94.5 ▲ 1.5 95.4 90.2 ▲ 6.0 95.7 91.8 ▲ 4.1 95.3 87.8 ▲ 8.1 非鉄金属地金 94.0 93.6 ▲ 0.4 91.8 97.3 ▲ 0.1 95.3 90.1 ▲ 5.5 93.9 89.8 ▲ 6.1 伸銅・アルミニウム圧延製品 93.0 91.1 ▲ 2.0 96.2 90.1 ▲ 7.8 91.9 89.0 ▲ 3.2 95.2 88.4 ▲ 8.5 電線・ケーブル 96.0 93.8 ▲ 2.3 94.3 83.4 ▲ 8.3 98.0 93.3 ▲ 4.8 94.7 83.2 ▲ 10.3 非鉄金属鋳物 100.8 97.8 ▲ 3.0 98.8 89.4 ▲ 7.8 99.4 96.4 ▲ 3.0 98.8 89.4 ▲ 7.8 金属製品工業 96.9 93.5 ▲ 3.5 94.1 85.5 ▲ 8.4 98.4 95.6 ▲ 2.8 93.7 86.0 ▲ 5.9 建設用金属製品 96.6 90.7 ▲ 6.1 88.5 79.8 ▲ 2.3 98.3 92.5 ▲ 5.9 91.5 83.2 ▲ 2.6 建築用金属製品 102.8 102.0 ▲ 0.8 98.9 91.6 ▲ 16.2 108.3 105.2 ▲ 2.9 102.5 96.2 ▲ 9.3 暖ちゅう房熱機器 101.3 95.9 ▲ 5.3 94.8 81.5 ▲ 10.8 105.6 105.3 ▲ 0.3 86.3 75.1 ▲ 2.6 その他の金属製品 91.3 89.7 ▲ 1.8 94.1 86.3 ▲ 5.3 87.8 87.5 ▲ 0.3 91.4 83.9 ▲ 6.0 はん用・生産用・業務用機械工業 117.0 115.4 ▲ 1.4 109.2 105.0 ▲ 0.5 115.7 112.4 ▲ 2.9 104.6 101.8 ▲ 1.0 はん用機械工業 103.7 105.2 1.4 96.9 92.9 ▲ 1.9 100.6 96.9 ▲ 3.7 92.9 89.1 ▲ 5.1 ボイラ・原動機 118.0 112.2 ▲ 4.9 101.1 99.5 ▲ 3.8 90.0 81.4 ▲ 9.6 84.5 80.0 ▲ 20.6 風水力機械・油圧機器 104.6 107.1 2.4 99.1 95.2 5.9 104.4 108.6 4.0 97.3 94.1 6.7 運搬機械 118.7 135.0 13.7 86.4 106.3 27.3 118.7 135.9 14.5 86.2 106.2 27.3 冷凍機・同応用製品 83.1 77.0 ▲ 7.3 87.5 75.1 ▲ 19.7 89.8 82.6 ▲ 8.0 92.6 81.4 ▲ 15.6 はん用機械器具部品 100.0 95.9 ▲ 4.1 97.7 87.5 ▲ 8.7 98.7 97.3 ▲ 1.4 97.4 88.9 ▲ 7.4 生産用機械工業 127.8 126.2 ▲ 1.3 117.7 115.7 1.5 126.0 126.6 0.5 112.0 112.2 1.1 土木建設機械 187.8 174.6 ▲ 7.0 175.8 154.7 ▲ 1.5 163.8 161.3 ▲ 1.5 143.2 135.7 ▲ 3.9 化学機械 101.8 52.5 ▲ 48.4 78.7 64.9 ▲ 62.7 101.5 53.4 ▲ 47.4 78.7 64.8 ▲ 62.8 生活関連産業用機械 128.6 126.7 ▲ 1.5 95.8 105.0 27.0 129.4 127.1 ▲ 1.8 96.4 105.1 26.5 半導体・フラットパネル製造装置 76.9 94.6 23.0 70.2 82.4 7.6 76.7 94.3 22.9 68.6 81.9 10.4 産業用ロボット 160.8 145.7 ▲ 9.4 159.8 150.5 0.7 160.2 143.7 ▲ 10.3 159.8 150.5 0.7 農業用機械 95.5 100.1 4.8 95.4 94.3 0.5 89.4 86.9 ▲ 2.8 84.6 76.6 ▲ 11.8 金属工作機械 184.3 180.3 ▲ 2.2 164.8 164.2 12.3 192.1 183.1 ▲ 4.7 162.4 158.4 19.7 金属加工機械 155.6 127.1 ▲ 18.3 130.2 121.5 10.1 147.2 146.9 ▲ 0.2 120.0 128.3 21.0 繊維機械 77.3 77.1 ▲ 0.3 75.3 71.5 ▲ 23.0 78.9 79.8 1.1 77.2 75.7 ▲ 22.0 金型 99.6 102.5 2.9 92.6 95.7 ▲ 5.3 99.6 102.3 2.7 92.6 95.7 ▲ 5.3 機械工具 122.1 122.4 0.2 125.0 117.0 6.6 113.9 119.1 4.6 115.4 113.6 ▲ 2.6 その他の生産用機械 134.8 133.9 ▲ 0.7 132.0 118.3 2.0 134.6 134.6 0.0 132.0 118.3 2.0 業務用機械工業 105.5 97.2 ▲ 7.9 103.6 89.5 ▲ 6.6 114.4 100.6 ▲ 12.1 104.1 92.5 ▲ 0.8 計測機器 133.4 118.8 ▲ 10.9 125.5 103.7 0.6 136.7 117.0 ▲ 14.4 119.8 101.2 0.0 光学部品 77.6 77.9 0.4 78.8 73.9 ▲ 14.2 79.8 70.2 ▲ 12.0 78.1 75.2 ▲ 1.4 その他の業務用機械 66.5 69.4 4.4 71.8 68.4 ▲ 21.6 104.2 100.7 ▲ 3.4 99.2 92.1 ▲ 1.7 電子部品・デバイス工業 109.0 103.8 ▲ 4.8 102.2 97.1 9.0 119.7 118.0 ▲ 1.4 110.3 108.9 13.2 電子部品 123.1 116.1 ▲ 5.7 115.1 107.6 11.6 122.4 120.4 ▲ 1.6 113.8 112.8 12.1 半導体素子 78.4 77.2 ▲ 1.5 76.5 75.3 ▲ 11.3 66.5 64.2 ▲ 3.5 64.5 61.8 ▲ 4.5 集積回路 102.5 96.9 ▲ 5.5 94.0 88.9 10.6 129.7 132.2 1.9 117.8 114.7 18.9 半導体部品 98.5 98.0 ▲ 0.5 100.5 107.0 5.8 98.1 96.4 ▲ 1.7 100.5 107.0 5.8 電気機械工業 104.0 101.5 ▲ 2.4 98.8 92.7 ▲ 5.8 98.3 97.3 ▲ 1.0 85.4 85.1 ▲ 5.3 回転電気機械 114.4 103.4 ▲ 9.6 112.9 93.8 ▲ 10.6 112.7 99.8 ▲ 11.4 111.1 92.0 ▲ 11.3 静止電気機械 104.6 108.2 3.4 97.4 91.8 ▲ 8.7 99.9 105.8 5.9 92.2 93.0 ▲ 2.7 開閉制御装置・機器 96.6 99.9 3.4 80.5 78.0 2.8 97.0 99.7 2.8 80.5 77.9 2.8 民生用電気機械 112.0 108.4 ▲ 3.2 128.9 122.6 ▲ 6.7 90.3 94.4 4.5 73.1 94.4 ▲ 2.8 配線・照明用器具 70.3 70.2 ▲ 0.1 70.1 63.6 ▲ 10.8 71.4 70.1 ▲ 1.8 69.8 62.0 ▲ 12.2 電子応用装置 104.8 113.7 8.5 76.2 88.4 10.9 104.0 110.2 6.0 76.0 87.4 10.4 電気計測器 108.6 93.8 ▲ 13.6 93.0 84.6 26.1 106.2 91.7 ▲ 13.7 90.5 83.0 24.6 電池 76.0 70.8 ▲ 6.8 75.0 64.3 ▲ 6.5 72.8 70.5 ▲ 3.2 70.6 63.3 ▲ 8.9 その他の電気機械 227.4 224.4 ▲ 1.3 212.0 231.8 ▲ 29.5 216.9 234.4 8.1 175.3 212.0 ▲ 29.5 情報通信機械工業 55.2 56.3 2.0 47.3 45.4 ▲ 13.5 48.5 48.7 0.4 38.9 39.9 ▲ 13.6 通信機械 57.6 56.6 ▲ 1.7 45.8 46.8 ▲ 6.2 56.7 49.5 ▲ 12.7 39.7 43.1 ▲ 16.8 民生用電子機械 38.3 37.6 ▲ 1.8 35.5 33.2 ▲ 3.8 34.4 35.0 1.7 29.2 29.6 ▲ 8.1 電子計算機 67.1 71.2 6.1 58.3 54.7 ▲ 25.8 61.7 69.5 12.6 54.2 54.2 ▲ 21.6 その他の情報通信機械 81.6 83.5 2.3 63.2 60.8 14.7 85.4 91.9 7.6 61.0 63.6 20.9 輸送機械工業 100.9 95.8 ▲ 5.1 93.2 85.7 ▲ 10.4 96.9 93.4 ▲ 3.6 91.0 81.2 ▲ 8.8 輸送機械工業(除.船舶・同機関、鉄道車両、航空機) 101.0 94.9 ▲ 6.0 93.3 84.6 ▲ 11.8 99.4 92.2 ▲ 7.2 93.5 81.5 ▲ 10.4 乗用車 94.4 88.5 ▲ 6.2 86.1 79.0 ▲ 14.1 93.5 86.3 ▲ 7.7 87.1 74.9 ▲ 12.1 バス 139.7 136.3 ▲ 2.4 128.4 112.9 13.8 133.6 130.2 ▲ 2.5 132.5 98.8 14.1 トラック 124.3 107.2 ▲ 13.8 114.7 99.3 ▲ 10.1 122.7 108.6 ▲ 11.5 113.7 96.8 ▲ 5.7 自動車ボデー 136.0 121.2 ▲ 10.9 112.1 100.8 ▲ 2.7 134.0 116.1 ▲ 13.4 112.1 100.8 ▲ 2.7 自動車部品 101.4 96.7 ▲ 4.6 95.4 86.5 ▲ 10.8 101.7 94.5 ▲ 7.1 95.4 86.5 ▲ 10.8 二輪自動車 78.6 78.5 ▲ 0.1 69.1 60.4 ▲ 22.6 88.3 88.8 0.6 89.0 68.7 ▲ 7.9 産業車両 117.8 107.4 ▲ 8.8 108.5 98.7 ▲ 8.1 113.9 104.0 ▲ 8.7 107.1 94.2 ▲ 6.4 航空機 216.9 216.7 ▲ 0.1 190.9 195.1 13.8 218.2 222.1 1.8 190.8 197.7 14.0 船舶・同機関 64.0 63.3 ▲ 1.1 63.2 59.9 ▲ 16.1 54.3 62.2 14.5 49.0 54.5 1.3 (特掲:乗用車・バス・トラック) 99.3 92.2 ▲ 7.2 91.1 82.6 ▲ 12.9 102.2 90.6 ▲ 11.4 91.9 78.5 ▲ 10.5
業
種
分
類
季節調整済指数Seasonally Adjusted Index
原 指 数Original Index
分 類
生 産 Production 生産者出荷 Shipments
前 月 比%Change FromPrevious Month
前年同月比
%Change FromPrevious Year
前 月 比%Change FromPrevious Month
前年同月比
%Change FromPrevious Year
季節調整済指数Seasonally Adjusted Index
原 指 数Original Index
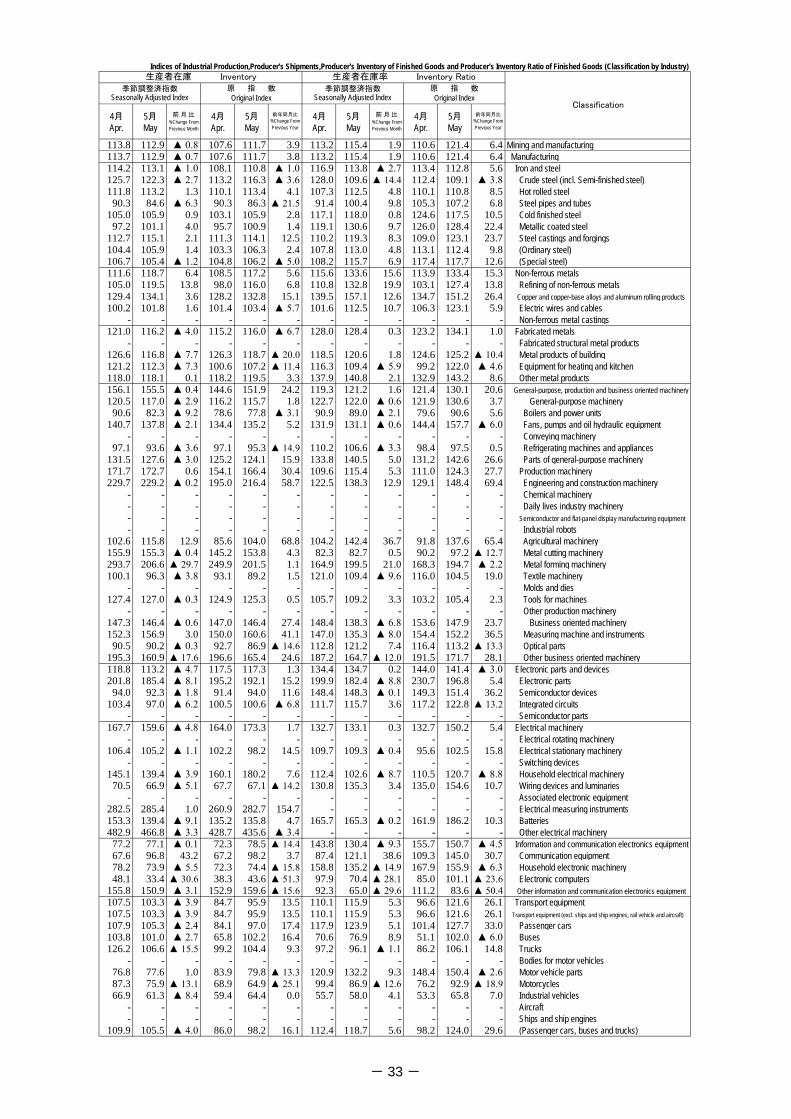
- 33 -
Indices of Industrial Production,Producer's Shipments,Producer's Inventory of Finished Goods and Producer's Inventory Ratio of Finished Goods (Classification by Industry)
4月 5月 4月 5月 4月 5月 4月 5月Apr. May Apr. May Apr. May Apr. May
113.8 112.9 ▲ 0.8 107.6 111.7 3.9 113.2 115.4 1.9 110.6 121.4 6.4 Mining and manufacturing113.7 112.9 ▲ 0.7 107.6 111.7 3.8 113.2 115.4 1.9 110.6 121.4 6.4 Manufacturing114.2 113.1 ▲ 1.0 108.1 110.8 ▲ 1.0 116.9 113.8 ▲ 2.7 113.4 112.8 5.6 Iron and steel125.7 122.3 ▲ 2.7 113.2 116.3 ▲ 3.6 128.0 109.6 ▲ 14.4 112.4 109.1 ▲ 3.8 Crude steel (incl. Semi-finished steel)111.8 113.2 1.3 110.1 113.4 4.1 107.3 112.5 4.8 110.1 110.8 8.5 Hot rolled steel
90.3 84.6 ▲ 6.3 90.3 86.3 ▲ 21.5 91.4 100.4 9.8 105.3 107.2 6.8 Steel pipes and tubes105.0 105.9 0.9 103.1 105.9 2.8 117.1 118.0 0.8 124.6 117.5 10.5 Cold finished steel
97.2 101.1 4.0 95.7 100.9 1.4 119.1 130.6 9.7 126.0 128.4 22.4 Metallic coated steel112.7 115.1 2.1 111.3 114.1 12.5 110.2 119.3 8.3 109.0 123.1 23.7 Steel castings and forgings104.4 105.9 1.4 103.3 106.3 2.4 107.8 113.0 4.8 113.1 112.4 9.8 (Ordinary steel)106.7 105.4 ▲ 1.2 104.8 106.2 ▲ 5.0 108.2 115.7 6.9 117.4 117.7 12.6 (Special steel)111.6 118.7 6.4 108.5 117.2 5.6 115.6 133.6 15.6 113.9 133.4 15.3 Non-ferrous metals105.0 119.5 13.8 98.0 116.0 6.8 110.8 132.8 19.9 103.1 127.4 13.8 Refining of non-ferrous metals129.4 134.1 3.6 128.2 132.8 15.1 139.5 157.1 12.6 134.7 151.2 26.4 Copper and copper-base alloys and aluminum rolling products100.2 101.8 1.6 101.4 103.4 ▲ 5.7 101.6 112.5 10.7 106.3 123.1 5.9 Electric wires and cables
- - - - - - - - - - - - Non-ferrous metal castings121.0 116.2 ▲ 4.0 115.2 116.0 ▲ 6.7 128.0 128.4 0.3 123.2 134.1 1.0 Fabricated metals
- - - - - - - - - - - - Fabricated structural metal products126.6 116.8 ▲ 7.7 126.3 118.7 ▲ 20.0 118.5 120.6 1.8 124.6 125.2 ▲ 10.4 Metal products of building121.2 112.3 ▲ 7.3 100.6 107.2 ▲ 11.4 116.3 109.4 ▲ 5.9 99.2 122.0 ▲ 4.6 Equipment for heating and kitchen118.0 118.1 0.1 118.2 119.5 3.3 137.9 140.8 2.1 132.9 143.2 8.6 Other metal products156.1 155.5 ▲ 0.4 144.6 151.9 24.2 119.3 121.2 1.6 121.4 130.1 20.6 General-purpose, production and business oriented machinery120.5 117.0 ▲ 2.9 116.2 115.7 1.8 122.7 122.0 ▲ 0.6 121.9 130.6 3.7 General-purpose machinery
90.6 82.3 ▲ 9.2 78.6 77.8 ▲ 3.1 90.9 89.0 ▲ 2.1 79.6 90.6 5.6 Boilers and power units140.7 137.8 ▲ 2.1 134.4 135.2 5.2 131.9 131.1 ▲ 0.6 144.4 157.7 ▲ 6.0 Fans, pumps and oil hydraulic equipment
- - - - - - - - - - - - Conveying machinery97.1 93.6 ▲ 3.6 97.1 95.3 ▲ 14.9 110.2 106.6 ▲ 3.3 98.4 97.5 0.5 Refrigerating machines and appliances
131.5 127.6 ▲ 3.0 125.2 124.1 15.9 133.8 140.5 5.0 131.2 142.6 26.6 Parts of general-purpose machinery171.7 172.7 0.6 154.1 166.4 30.4 109.6 115.4 5.3 111.0 124.3 27.7 Production machinery229.7 229.2 ▲ 0.2 195.0 216.4 58.7 122.5 138.3 12.9 129.1 148.4 69.4 Engineering and construction machinery
- - - - - - - - - - - - Chemical machinery- - - - - - - - - - - - Daily lives industry machinery- - - - - - - - - - - - Semiconductor and flat-panel display manufacturing equipment- - - - - - - - - - - - Industrial robots
102.6 115.8 12.9 85.6 104.0 68.8 104.2 142.4 36.7 91.8 137.6 65.4 Agricultural machinery155.9 155.3 ▲ 0.4 145.2 153.8 4.3 82.3 82.7 0.5 90.2 97.2 ▲ 12.7 Metal cutting machinery293.7 206.6 ▲ 29.7 249.9 201.5 1.1 164.9 199.5 21.0 168.3 194.7 ▲ 2.2 Metal forming machinery100.1 96.3 ▲ 3.8 93.1 89.2 1.5 121.0 109.4 ▲ 9.6 116.0 104.5 19.0 Textile machinery
- - - - - - - - - - - - Molds and dies127.4 127.0 ▲ 0.3 124.9 125.3 0.5 105.7 109.2 3.3 103.2 105.4 2.3 Tools for machines
- - - - - - - - - - - - Other production machinery147.3 146.4 ▲ 0.6 147.0 146.4 27.4 148.4 138.3 ▲ 6.8 153.6 147.9 23.7 Business oriented machinery152.3 156.9 3.0 150.0 160.6 41.1 147.0 135.3 ▲ 8.0 154.4 152.2 36.5 Measuring machine and instruments
90.5 90.2 ▲ 0.3 92.7 86.9 ▲ 14.6 112.8 121.2 7.4 116.4 113.2 ▲ 13.3 Optical parts195.3 160.9 ▲ 17.6 196.6 165.4 24.6 187.2 164.7 ▲ 12.0 191.5 171.7 28.1 Other business oriented machinery118.8 113.2 ▲ 4.7 117.5 117.3 1.3 134.4 134.7 0.2 144.0 141.4 ▲ 3.0 Electronic parts and devices201.8 185.4 ▲ 8.1 195.2 192.1 15.2 199.9 182.4 ▲ 8.8 230.7 196.8 5.4 Electronic parts
94.0 92.3 ▲ 1.8 91.4 94.0 11.6 148.4 148.3 ▲ 0.1 149.3 151.4 36.2 Semiconductor devices103.4 97.0 ▲ 6.2 100.5 100.6 ▲ 6.8 111.7 115.7 3.6 117.2 122.8 ▲ 13.2 Integrated circuits
- - - - - - - - - - - - Semiconductor parts167.7 159.6 ▲ 4.8 164.0 173.3 1.7 132.7 133.1 0.3 132.7 150.2 5.4 Electrical machinery
- - - - - - - - - - - - Electrical rotating machinery106.4 105.2 ▲ 1.1 102.2 98.2 14.5 109.7 109.3 ▲ 0.4 95.6 102.5 15.8 Electrical stationary machinery
- - - - - - - - - - - - Switching devices145.1 139.4 ▲ 3.9 160.1 180.2 7.6 112.4 102.6 ▲ 8.7 110.5 120.7 ▲ 8.8 Household electrical machinery
70.5 66.9 ▲ 5.1 67.7 67.1 ▲ 14.2 130.8 135.3 3.4 135.0 154.6 10.7 Wiring devices and luminaries- - - - - - - - - - - - Associated electronic equipment
282.5 285.4 1.0 260.9 282.7 154.7 - - - - - - Electrical measuring instruments153.3 139.4 ▲ 9.1 135.2 135.8 4.7 165.7 165.3 ▲ 0.2 161.9 186.2 10.3 Batteries482.9 466.8 ▲ 3.3 428.7 435.6 ▲ 3.4 - - - - - - Other electrical machinery
77.2 77.1 ▲ 0.1 72.3 78.5 ▲ 14.4 143.8 130.4 ▲ 9.3 155.7 150.7 ▲ 4.5 Information and communication electronics equipment67.6 96.8 43.2 67.2 98.2 3.7 87.4 121.1 38.6 109.3 145.0 30.7 Communication equipment78.2 73.9 ▲ 5.5 72.3 74.4 ▲ 15.8 158.8 135.2 ▲ 14.9 167.9 155.9 ▲ 6.3 Household electronic machinery48.1 33.4 ▲ 30.6 38.3 43.6 ▲ 51.3 97.9 70.4 ▲ 28.1 85.0 101.1 ▲ 23.6 Electronic computers
155.8 150.9 ▲ 3.1 152.9 159.6 ▲ 15.6 92.3 65.0 ▲ 29.6 111.2 83.6 ▲ 50.4 Other information and communication electronics equipment107.5 103.3 ▲ 3.9 84.7 95.9 13.5 110.1 115.9 5.3 96.6 121.6 26.1 Transport equipment107.5 103.3 ▲ 3.9 84.7 95.9 13.5 110.1 115.9 5.3 96.6 121.6 26.1 Transport equipment (excl. ships and ship engines, rail vehicle and aircraft)
107.9 105.3 ▲ 2.4 84.1 97.0 17.4 117.9 123.9 5.1 101.4 127.7 33.0 Passenger cars103.8 101.0 ▲ 2.7 65.8 102.2 16.4 70.6 76.9 8.9 51.1 102.0 ▲ 6.0 Buses126.2 106.6 ▲ 15.5 99.2 104.4 9.3 97.2 96.1 ▲ 1.1 86.2 106.1 14.8 Trucks
- - - - - - - - - - - - Bodies for motor vehicles76.8 77.6 1.0 83.9 79.8 ▲ 13.3 120.9 132.2 9.3 148.4 150.4 ▲ 2.6 Motor vehicle parts87.3 75.9 ▲ 13.1 68.9 64.9 ▲ 25.1 99.4 86.9 ▲ 12.6 76.2 92.9 ▲ 18.9 Motorcycles66.9 61.3 ▲ 8.4 59.4 64.4 0.0 55.7 58.0 4.1 53.3 65.8 7.0 Industrial vehicles
- - - - - - - - - - - - Aircraft- - - - - - - - - - - - Ships and ship engines
109.9 105.5 ▲ 4.0 86.0 98.2 16.1 112.4 118.7 5.6 98.2 124.0 29.6 (Passenger cars, buses and trucks)
生産者在庫率 Inventory Ratio
前年同月比
%Change FromPrevious Year
季節調整済指数Seasonally Adjusted Index
原 指 数Original Index
季節調整済指数Seasonally Adjusted Index
Classification前 月 比
%Change FromPrevious Month
原 指 数Original Index
前 月 比%Change FromPrevious Month
前年同月比
%Change FromPrevious Year
生産者在庫 Inventory
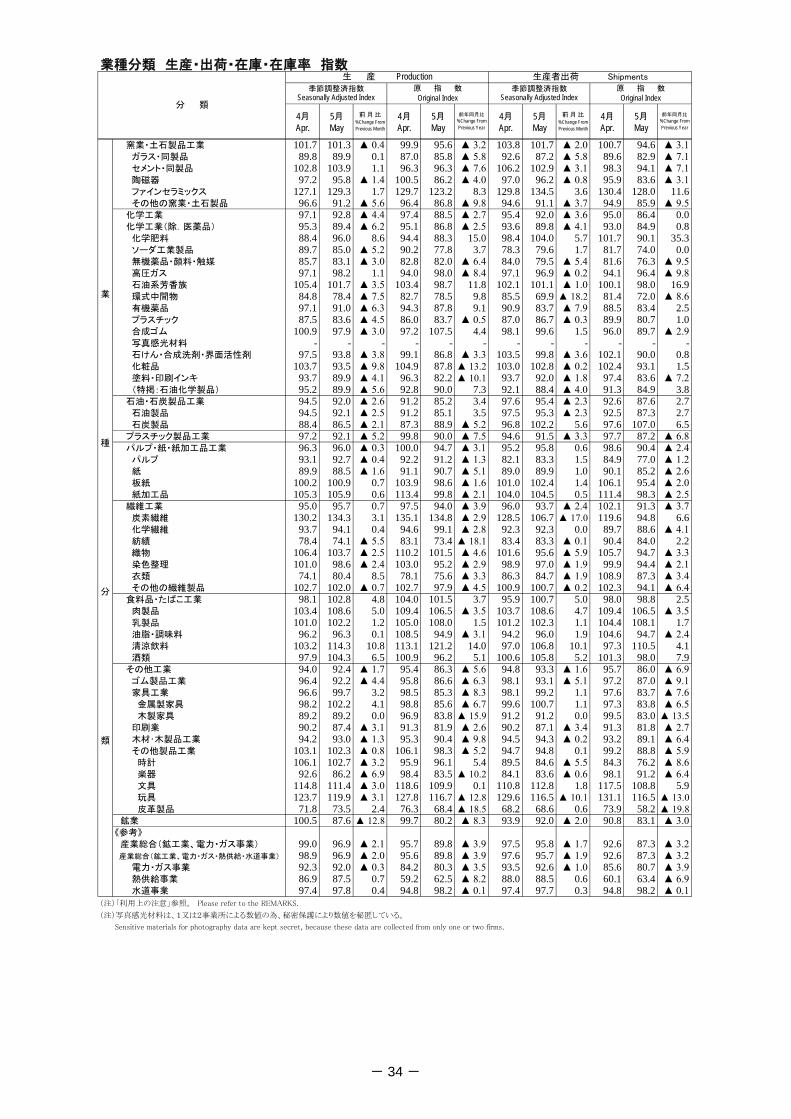
- 34 -
業種分類 生産・出荷・在庫・在庫率 指数
4月 5月 4月 5月 4月 5月 4月 5月Apr. May Apr. May Apr. May Apr. May
季節調整済指数Seasonally Adjusted Index
原 指 数Original Index
分 類
生 産 Production 生産者出荷 Shipments
前 月 比%Change FromPrevious Month
前年同月比
%Change FromPrevious Year
前 月 比%Change FromPrevious Month
前年同月比
%Change FromPrevious Year
季節調整済指数Seasonally Adjusted Index
原 指 数Original Index
窯業・土石製品工業 101.7 101.3 ▲ 0.4 99.9 95.6 ▲ 3.2 103.8 101.7 ▲ 2.0 100.7 94.6 ▲ 3.1 ガラス・同製品 89.8 89.9 0.1 87.0 85.8 ▲ 5.8 92.6 87.2 ▲ 5.8 89.6 82.9 ▲ 7.1 セメント・同製品 102.8 103.9 1.1 96.3 96.3 ▲ 7.6 106.2 102.9 ▲ 3.1 98.3 94.1 ▲ 7.1 陶磁器 97.2 95.8 ▲ 1.4 100.5 86.2 ▲ 4.0 97.0 96.2 ▲ 0.8 95.9 83.6 ▲ 3.1 ファインセラミックス 127.1 129.3 1.7 129.7 123.2 8.3 129.8 134.5 3.6 130.4 128.0 11.6 その他の窯業・土石製品 96.6 91.2 ▲ 5.6 96.4 86.8 ▲ 9.8 94.6 91.1 ▲ 3.7 94.9 85.9 ▲ 9.5 化学工業 97.1 92.8 ▲ 4.4 97.4 88.5 ▲ 2.7 95.4 92.0 ▲ 3.6 95.0 86.4 0.0 化学工業(除.医薬品) 95.3 89.4 ▲ 6.2 95.1 86.8 ▲ 2.5 93.6 89.8 ▲ 4.1 93.0 84.9 0.8 化学肥料 88.4 96.0 8.6 94.4 88.3 15.0 98.4 104.0 5.7 101.7 90.1 35.3 ソーダ工業製品 89.7 85.0 ▲ 5.2 90.2 77.8 3.7 78.3 79.6 1.7 81.7 74.0 0.0 無機薬品・顔料・触媒 85.7 83.1 ▲ 3.0 82.8 82.0 ▲ 6.4 84.0 79.5 ▲ 5.4 81.6 76.3 ▲ 9.5 高圧ガス 97.1 98.2 1.1 94.0 98.0 ▲ 8.4 97.1 96.9 ▲ 0.2 94.1 96.4 ▲ 9.8 石油系芳香族 105.4 101.7 ▲ 3.5 103.4 98.7 11.8 102.1 101.1 ▲ 1.0 100.1 98.0 16.9 環式中間物 84.8 78.4 ▲ 7.5 82.7 78.5 9.8 85.5 69.9 ▲ 18.2 81.4 72.0 ▲ 8.6 有機薬品 97.1 91.0 ▲ 6.3 94.3 87.8 9.1 90.9 83.7 ▲ 7.9 88.5 83.4 2.5 プラスチック 87.5 83.6 ▲ 4.5 86.0 83.7 ▲ 0.5 87.0 86.7 ▲ 0.3 89.9 80.7 1.0 合成ゴム 100.9 97.9 ▲ 3.0 97.2 107.5 4.4 98.1 99.6 1.5 96.0 89.7 ▲ 2.9 写真感光材料 - - - - - - - - - - - - 石けん・合成洗剤・界面活性剤 97.5 93.8 ▲ 3.8 99.1 86.8 ▲ 3.3 103.5 99.8 ▲ 3.6 102.1 90.0 0.8 化粧品 103.7 93.5 ▲ 9.8 104.9 87.8 ▲ 13.2 103.0 102.8 ▲ 0.2 102.4 93.1 1.5 塗料・印刷インキ 93.7 89.9 ▲ 4.1 96.3 82.2 ▲ 10.1 93.7 92.0 ▲ 1.8 97.4 83.6 ▲ 7.2 (特掲:石油化学製品) 95.2 89.9 ▲ 5.6 92.8 90.0 7.3 92.1 88.4 ▲ 4.0 91.3 84.9 3.8 石油・石炭製品工業 94.5 92.0 ▲ 2.6 91.2 85.2 3.4 97.6 95.4 ▲ 2.3 92.6 87.6 2.7 石油製品 94.5 92.1 ▲ 2.5 91.2 85.1 3.5 97.5 95.3 ▲ 2.3 92.5 87.3 2.7 石炭製品 88.4 86.5 ▲ 2.1 87.3 88.9 ▲ 5.2 96.8 102.2 5.6 97.6 107.0 6.5 プラスチック製品工業 97.2 92.1 ▲ 5.2 99.8 90.0 ▲ 7.5 94.6 91.5 ▲ 3.3 97.7 87.2 ▲ 6.8 パルプ・紙・紙加工品工業 96.3 96.0 ▲ 0.3 100.0 94.7 ▲ 3.1 95.2 95.8 0.6 98.6 90.4 ▲ 2.4 パルプ 93.1 92.7 ▲ 0.4 92.2 91.2 ▲ 1.3 82.1 83.3 1.5 84.9 77.0 ▲ 1.2 紙 89.9 88.5 ▲ 1.6 91.1 90.7 ▲ 5.1 89.0 89.9 1.0 90.1 85.2 ▲ 2.6 板紙 100.2 100.9 0.7 103.9 98.6 ▲ 1.6 101.0 102.4 1.4 106.1 95.4 ▲ 2.0 紙加工品 105.3 105.9 0.6 113.4 99.8 ▲ 2.1 104.0 104.5 0.5 111.4 98.3 ▲ 2.5 繊維工業 95.0 95.7 0.7 97.5 94.0 ▲ 3.9 96.0 93.7 ▲ 2.4 102.1 91.3 ▲ 3.7 炭素繊維 130.2 134.3 3.1 135.1 134.8 ▲ 2.9 128.5 106.7 ▲ 17.0 119.6 94.8 6.6 化学繊維 93.7 94.1 0.4 94.6 99.1 ▲ 2.8 92.3 92.3 0.0 89.7 88.6 ▲ 4.1 紡績 78.4 74.1 ▲ 5.5 83.1 73.4 ▲ 18.1 83.4 83.3 ▲ 0.1 90.4 84.0 2.2 織物 106.4 103.7 ▲ 2.5 110.2 101.5 ▲ 4.6 101.6 95.6 ▲ 5.9 105.7 94.7 ▲ 3.3 染色整理 101.0 98.6 ▲ 2.4 103.0 95.2 ▲ 2.9 98.9 97.0 ▲ 1.9 99.9 94.4 ▲ 2.1 衣類 74.1 80.4 8.5 78.1 75.6 ▲ 3.3 86.3 84.7 ▲ 1.9 108.9 87.3 ▲ 3.4 その他の繊維製品 102.7 102.0 ▲ 0.7 102.7 97.9 ▲ 4.5 100.9 100.7 ▲ 0.2 102.3 94.1 ▲ 6.4 食料品・たばこ工業 98.1 102.8 4.8 104.0 101.5 3.7 95.9 100.7 5.0 98.0 98.8 2.5 肉製品 103.4 108.6 5.0 109.4 106.5 ▲ 3.5 103.7 108.6 4.7 109.4 106.5 ▲ 3.5 乳製品 101.0 102.2 1.2 105.0 108.0 1.5 101.2 102.3 1.1 104.4 108.1 1.7 油脂・調味料 96.2 96.3 0.1 108.5 94.9 ▲ 3.1 94.2 96.0 1.9 104.6 94.7 ▲ 2.4 清涼飲料 103.2 114.3 10.8 113.1 121.2 14.0 97.0 106.8 10.1 97.3 110.5 4.1 酒類 97.9 104.3 6.5 100.9 96.2 5.1 100.6 105.8 5.2 101.3 98.0 7.9 その他工業 94.0 92.4 ▲ 1.7 95.4 86.3 ▲ 5.6 94.8 93.3 ▲ 1.6 95.7 86.0 ▲ 6.9 ゴム製品工業 96.4 92.2 ▲ 4.4 95.8 86.6 ▲ 6.3 98.1 93.1 ▲ 5.1 97.2 87.0 ▲ 9.1 家具工業 96.6 99.7 3.2 98.5 85.3 ▲ 8.3 98.1 99.2 1.1 97.6 83.7 ▲ 7.6 金属製家具 98.2 102.2 4.1 98.8 85.6 ▲ 6.7 99.6 100.7 1.1 97.3 83.8 ▲ 6.5 木製家具 89.2 89.2 0.0 96.9 83.8 ▲ 15.9 91.2 91.2 0.0 99.5 83.0 ▲ 13.5 印刷業 90.2 87.4 ▲ 3.1 91.3 81.9 ▲ 2.6 90.2 87.1 ▲ 3.4 91.3 81.8 ▲ 2.7 木材・木製品工業 94.2 93.0 ▲ 1.3 95.3 90.4 ▲ 9.8 94.5 94.3 ▲ 0.2 93.2 89.1 ▲ 6.4 その他製品工業 103.1 102.3 ▲ 0.8 106.1 98.3 ▲ 5.2 94.7 94.8 0.1 99.2 88.8 ▲ 5.9 時計 106.1 102.7 ▲ 3.2 95.9 96.1 5.4 89.5 84.6 ▲ 5.5 84.3 76.2 ▲ 8.6 楽器 92.6 86.2 ▲ 6.9 98.4 83.5 ▲ 10.2 84.1 83.6 ▲ 0.6 98.1 91.2 ▲ 6.4 文具 114.8 111.4 ▲ 3.0 118.6 109.9 0.1 110.8 112.8 1.8 117.5 108.8 5.9 玩具 123.7 119.9 ▲ 3.1 127.8 116.7 ▲ 12.8 129.6 116.5 ▲ 10.1 131.1 116.5 ▲ 13.0 皮革製品 71.8 73.5 2.4 76.3 68.4 ▲ 18.5 68.2 68.6 0.6 73.9 58.2 ▲ 19.8 鉱業 100.5 87.6 ▲ 12.8 99.7 80.2 ▲ 8.3 93.9 92.0 ▲ 2.0 90.8 83.1 ▲ 3.0《参考》
産業総合(鉱工業、電力・ガス事業) 99.0 96.9 ▲ 2.1 95.7 89.8 ▲ 3.9 97.5 95.8 ▲ 1.7 92.6 87.3 ▲ 3.2 産業総合(鉱工業、電力・ガス・熱供給・水道事業) 98.9 96.9 ▲ 2.0 95.6 89.8 ▲ 3.9 97.6 95.7 ▲ 1.9 92.6 87.3 ▲ 3.2 電力・ガス事業 92.3 92.0 ▲ 0.3 84.2 80.3 ▲ 3.5 93.5 92.6 ▲ 1.0 85.6 80.7 ▲ 3.9 熱供給事業 86.9 87.5 0.7 59.2 62.5 ▲ 8.2 88.0 88.5 0.6 60.1 63.4 ▲ 6.9 水道事業 97.4 97.8 0.4 94.8 98.2 ▲ 0.1 97.4 97.7 0.3 94.8 98.2 ▲ 0.1
(注)「利用上の注意」参照。 Please refer to the REMARKS.
(注)写真感光材料は、1又は2事業所による数値の為、秘密保護により数値を秘匿している。
Sensitive materials for photography data are kept secret, because these data are collected from only one or two firms.
業
種
分
類
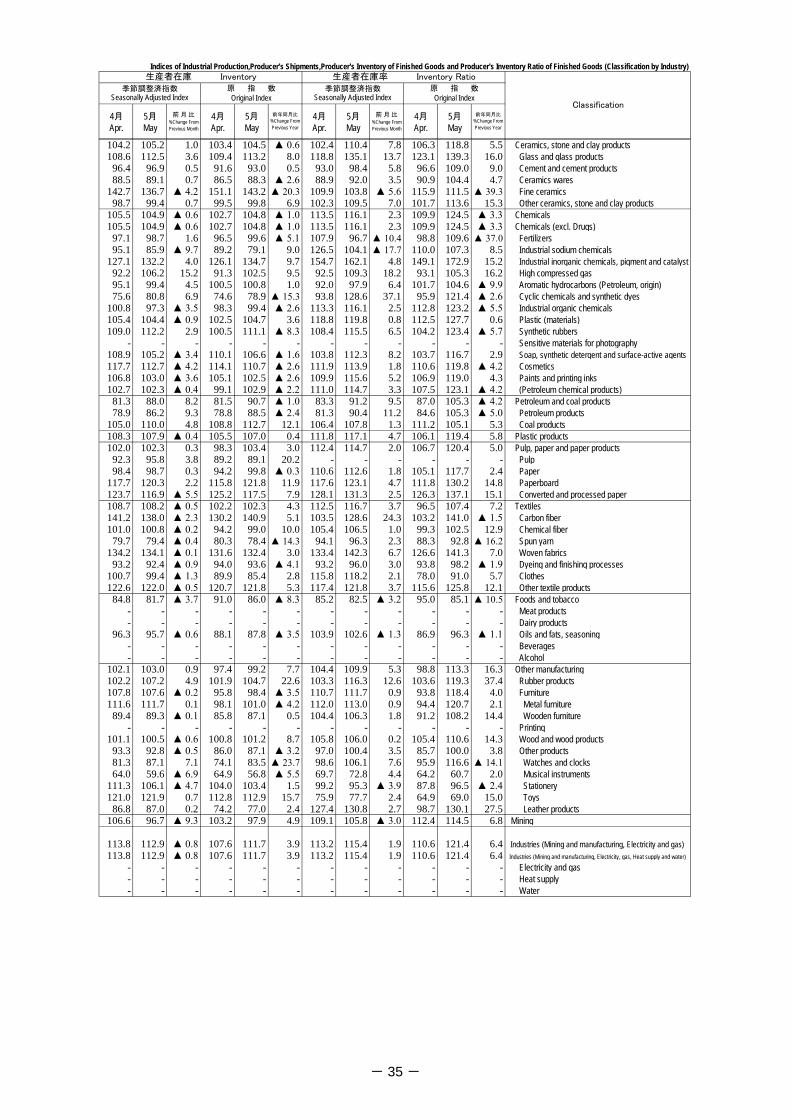
- 35 -
Indices of Industrial Production,Producer's Shipments,Producer's Inventory of Finished Goods and Producer's Inventory Ratio of Finished Goods (Classification by Industry)
4月 5月 4月 5月 4月 5月 4月 5月Apr. May Apr. May Apr. May Apr. May
生産者在庫率 Inventory Ratio
前年同月比
%Change FromPrevious Year
季節調整済指数Seasonally Adjusted Index
原 指 数Original Index
季節調整済指数Seasonally Adjusted Index
Classification前 月 比
%Change FromPrevious Month
原 指 数Original Index
前 月 比%Change FromPrevious Month
前年同月比
%Change FromPrevious Year
生産者在庫 Inventory
104.2 105.2 1.0 103.4 104.5 ▲ 0.6 102.4 110.4 7.8 106.3 118.8 5.5 Ceramics, stone and clay products108.6 112.5 3.6 109.4 113.2 8.0 118.8 135.1 13.7 123.1 139.3 16.0 Glass and glass products
96.4 96.9 0.5 91.6 93.0 0.5 93.0 98.4 5.8 96.6 109.0 9.0 Cement and cement products88.5 89.1 0.7 86.5 88.3 ▲ 2.6 88.9 92.0 3.5 90.9 104.4 4.7 Ceramics wares
142.7 136.7 ▲ 4.2 151.1 143.2 ▲ 20.3 109.9 103.8 ▲ 5.6 115.9 111.5 ▲ 39.3 Fine ceramics98.7 99.4 0.7 99.5 99.8 6.9 102.3 109.5 7.0 101.7 113.6 15.3 Other ceramics, stone and clay products
105.5 104.9 ▲ 0.6 102.7 104.8 ▲ 1.0 113.5 116.1 2.3 109.9 124.5 ▲ 3.3 Chemicals105.5 104.9 ▲ 0.6 102.7 104.8 ▲ 1.0 113.5 116.1 2.3 109.9 124.5 ▲ 3.3 Chemicals (excl. Drugs)
97.1 98.7 1.6 96.5 99.6 ▲ 5.1 107.9 96.7 ▲ 10.4 98.8 109.6 ▲ 37.0 Fertilizers95.1 85.9 ▲ 9.7 89.2 79.1 9.0 126.5 104.1 ▲ 17.7 110.0 107.3 8.5 Industrial sodium chemicals
127.1 132.2 4.0 126.1 134.7 9.7 154.7 162.1 4.8 149.1 172.9 15.2 Industrial inorganic chemicals, pigment and catalyst92.2 106.2 15.2 91.3 102.5 9.5 92.5 109.3 18.2 93.1 105.3 16.2 High compressed gas95.1 99.4 4.5 100.5 100.8 1.0 92.0 97.9 6.4 101.7 104.6 ▲ 9.9 Aromatic hydrocarbons (Petroleum, origin)75.6 80.8 6.9 74.6 78.9 ▲ 15.3 93.8 128.6 37.1 95.9 121.4 ▲ 2.6 Cyclic chemicals and synthetic dyes
100.8 97.3 ▲ 3.5 98.3 99.4 ▲ 2.6 113.3 116.1 2.5 112.8 123.2 ▲ 5.5 Industrial organic chemicals105.4 104.4 ▲ 0.9 102.5 104.7 3.6 118.8 119.8 0.8 112.5 127.7 0.6 Plastic (materials)109.0 112.2 2.9 100.5 111.1 ▲ 8.3 108.4 115.5 6.5 104.2 123.4 ▲ 5.7 Synthetic rubbers
- - - - - - - - - - - - Sensitive materials for photography108.9 105.2 ▲ 3.4 110.1 106.6 ▲ 1.6 103.8 112.3 8.2 103.7 116.7 2.9 Soap, synthetic detergent and surface-active agents117.7 112.7 ▲ 4.2 114.1 110.7 ▲ 2.6 111.9 113.9 1.8 110.6 119.8 ▲ 4.2 Cosmetics106.8 103.0 ▲ 3.6 105.1 102.5 ▲ 2.6 109.9 115.6 5.2 106.9 119.0 4.3 Paints and printing inks102.7 102.3 ▲ 0.4 99.1 102.9 ▲ 2.2 111.0 114.7 3.3 107.5 123.1 ▲ 4.2 (Petroleum chemical products)
81.3 88.0 8.2 81.5 90.7 ▲ 1.0 83.3 91.2 9.5 87.0 105.3 ▲ 4.2 Petroleum and coal products78.9 86.2 9.3 78.8 88.5 ▲ 2.4 81.3 90.4 11.2 84.6 105.3 ▲ 5.0 Petroleum products
105.0 110.0 4.8 108.8 112.7 12.1 106.4 107.8 1.3 111.2 105.1 5.3 Coal products108.3 107.9 ▲ 0.4 105.5 107.0 0.4 111.8 117.1 4.7 106.1 119.4 5.8 Plastic products102.0 102.3 0.3 98.3 103.4 3.0 112.4 114.7 2.0 106.7 120.4 5.0 Pulp, paper and paper products
92.3 95.8 3.8 89.2 89.1 20.2 - - - - - - Pulp98.4 98.7 0.3 94.2 99.8 ▲ 0.3 110.6 112.6 1.8 105.1 117.7 2.4 Paper
117.7 120.3 2.2 115.8 121.8 11.9 117.6 123.1 4.7 111.8 130.2 14.8 Paperboard123.7 116.9 ▲ 5.5 125.2 117.5 7.9 128.1 131.3 2.5 126.3 137.1 15.1 Converted and processed paper108.7 108.2 ▲ 0.5 102.2 102.3 4.3 112.5 116.7 3.7 96.5 107.4 7.2 Textiles141.2 138.0 ▲ 2.3 130.2 140.9 5.1 103.5 128.6 24.3 103.2 141.0 ▲ 1.5 Carbon fiber101.0 100.8 ▲ 0.2 94.2 99.0 10.0 105.4 106.5 1.0 99.3 102.5 12.9 Chemical fiber
79.7 79.4 ▲ 0.4 80.3 78.4 ▲ 14.3 94.1 96.3 2.3 88.3 92.8 ▲ 16.2 Spun yarn134.2 134.1 ▲ 0.1 131.6 132.4 3.0 133.4 142.3 6.7 126.6 141.3 7.0 Woven fabrics
93.2 92.4 ▲ 0.9 94.0 93.6 ▲ 4.1 93.2 96.0 3.0 93.8 98.2 ▲ 1.9 Dyeing and finishing processes100.7 99.4 ▲ 1.3 89.9 85.4 2.8 115.8 118.2 2.1 78.0 91.0 5.7 Clothes122.6 122.0 ▲ 0.5 120.7 121.8 5.3 117.4 121.8 3.7 115.6 125.8 12.1 Other textile products
84.8 81.7 ▲ 3.7 91.0 86.0 ▲ 8.3 85.2 82.5 ▲ 3.2 95.0 85.1 ▲ 10.5 Foods and tobacco- - - - - - - - - - - - Meat products- - - - - - - - - - - - Dairy products
96.3 95.7 ▲ 0.6 88.1 87.8 ▲ 3.5 103.9 102.6 ▲ 1.3 86.9 96.3 ▲ 1.1 Oils and fats, seasoning- - - - - - - - - - - - Beverages- - - - - - - - - - - - Alcohol
102.1 103.0 0.9 97.4 99.2 7.7 104.4 109.9 5.3 98.8 113.3 16.3 Other manufacturing102.2 107.2 4.9 101.9 104.7 22.6 103.3 116.3 12.6 103.6 119.3 37.4 Rubber products107.8 107.6 ▲ 0.2 95.8 98.4 ▲ 3.5 110.7 111.7 0.9 93.8 118.4 4.0 Furniture111.6 111.7 0.1 98.1 101.0 ▲ 4.2 112.0 113.0 0.9 94.4 120.7 2.1 Metal furniture
89.4 89.3 ▲ 0.1 85.8 87.1 0.5 104.4 106.3 1.8 91.2 108.2 14.4 Wooden furniture- - - - - - - - - - - - Printing
101.1 100.5 ▲ 0.6 100.8 101.2 8.7 105.8 106.0 0.2 105.4 110.6 14.3 Wood and wood products93.3 92.8 ▲ 0.5 86.0 87.1 ▲ 3.2 97.0 100.4 3.5 85.7 100.0 3.8 Other products81.3 87.1 7.1 74.1 83.5 ▲ 23.7 98.6 106.1 7.6 95.9 116.6 ▲ 14.1 Watches and clocks64.0 59.6 ▲ 6.9 64.9 56.8 ▲ 5.5 69.7 72.8 4.4 64.2 60.7 2.0 Musical instruments
111.3 106.1 ▲ 4.7 104.0 103.4 1.5 99.2 95.3 ▲ 3.9 87.8 96.5 ▲ 2.4 Stationery121.0 121.9 0.7 112.8 112.9 15.7 75.9 77.7 2.4 64.9 69.0 15.0 Toys
86.8 87.0 0.2 74.2 77.0 2.4 127.4 130.8 2.7 98.7 130.1 27.5 Leather products106.6 96.7 ▲ 9.3 103.2 97.9 4.9 109.1 105.8 ▲ 3.0 112.4 114.5 6.8 Mining
113.8 112.9 ▲ 0.8 107.6 111.7 3.9 113.2 115.4 1.9 110.6 121.4 6.4 Industries (Mining and manufacturing, Electricity and gas)113.8 112.9 ▲ 0.8 107.6 111.7 3.9 113.2 115.4 1.9 110.6 121.4 6.4 Industries (Mining and manufacturing, Electricity, gas, Heat supply and water)
- - - - - - - - - - - - Electricity and gas- - - - - - - - - - - - Heat supply- - - - - - - - - - - - Water
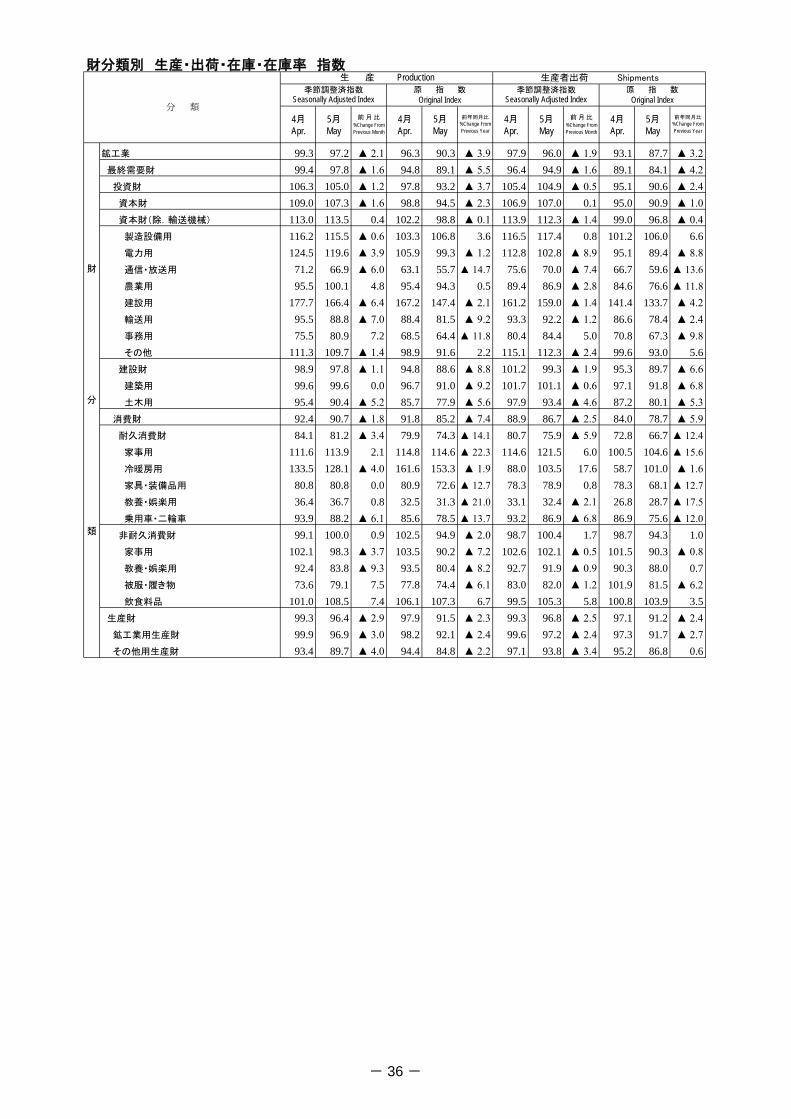
- 36 -
財分類別 生産・出荷・在庫・在庫率 指数
4月 5月 4月 5月 4月 5月 4月 5月Apr. May Apr. May Apr. May Apr. May
鉱工業 99.3 97.2 ▲ 2.1 96.3 90.3 ▲ 3.9 97.9 96.0 ▲ 1.9 93.1 87.7 ▲ 3.2 最終需要財 99.4 97.8 ▲ 1.6 94.8 89.1 ▲ 5.5 96.4 94.9 ▲ 1.6 89.1 84.1 ▲ 4.2 投資財 106.3 105.0 ▲ 1.2 97.8 93.2 ▲ 3.7 105.4 104.9 ▲ 0.5 95.1 90.6 ▲ 2.4 資本財 109.0 107.3 ▲ 1.6 98.8 94.5 ▲ 2.3 106.9 107.0 0.1 95.0 90.9 ▲ 1.0 資本財(除.輸送機械) 113.0 113.5 0.4 102.2 98.8 ▲ 0.1 113.9 112.3 ▲ 1.4 99.0 96.8 ▲ 0.4 製造設備用 116.2 115.5 ▲ 0.6 103.3 106.8 3.6 116.5 117.4 0.8 101.2 106.0 6.6 電力用 124.5 119.6 ▲ 3.9 105.9 99.3 ▲ 1.2 112.8 102.8 ▲ 8.9 95.1 89.4 ▲ 8.8 通信・放送用 71.2 66.9 ▲ 6.0 63.1 55.7 ▲ 14.7 75.6 70.0 ▲ 7.4 66.7 59.6 ▲ 13.6 農業用 95.5 100.1 4.8 95.4 94.3 0.5 89.4 86.9 ▲ 2.8 84.6 76.6 ▲ 11.8 建設用 177.7 166.4 ▲ 6.4 167.2 147.4 ▲ 2.1 161.2 159.0 ▲ 1.4 141.4 133.7 ▲ 4.2 輸送用 95.5 88.8 ▲ 7.0 88.4 81.5 ▲ 9.2 93.3 92.2 ▲ 1.2 86.6 78.4 ▲ 2.4 事務用 75.5 80.9 7.2 68.5 64.4 ▲ 11.8 80.4 84.4 5.0 70.8 67.3 ▲ 9.8 その他 111.3 109.7 ▲ 1.4 98.9 91.6 2.2 115.1 112.3 ▲ 2.4 99.6 93.0 5.6 建設財 98.9 97.8 ▲ 1.1 94.8 88.6 ▲ 8.8 101.2 99.3 ▲ 1.9 95.3 89.7 ▲ 6.6 建築用 99.6 99.6 0.0 96.7 91.0 ▲ 9.2 101.7 101.1 ▲ 0.6 97.1 91.8 ▲ 6.8 土木用 95.4 90.4 ▲ 5.2 85.7 77.9 ▲ 5.6 97.9 93.4 ▲ 4.6 87.2 80.1 ▲ 5.3 消費財 92.4 90.7 ▲ 1.8 91.8 85.2 ▲ 7.4 88.9 86.7 ▲ 2.5 84.0 78.7 ▲ 5.9 耐久消費財 84.1 81.2 ▲ 3.4 79.9 74.3 ▲ 14.1 80.7 75.9 ▲ 5.9 72.8 66.7 ▲ 12.4 家事用 111.6 113.9 2.1 114.8 114.6 ▲ 22.3 114.6 121.5 6.0 100.5 104.6 ▲ 15.6 冷暖房用 133.5 128.1 ▲ 4.0 161.6 153.3 ▲ 1.9 88.0 103.5 17.6 58.7 101.0 ▲ 1.6 家具・装備品用 80.8 80.8 0.0 80.9 72.6 ▲ 12.7 78.3 78.9 0.8 78.3 68.1 ▲ 12.7 教養・娯楽用 36.4 36.7 0.8 32.5 31.3 ▲ 21.0 33.1 32.4 ▲ 2.1 26.8 28.7 ▲ 17.5 乗用車・二輪車 93.9 88.2 ▲ 6.1 85.6 78.5 ▲ 13.7 93.2 86.9 ▲ 6.8 86.9 75.6 ▲ 12.0 非耐久消費財 99.1 100.0 0.9 102.5 94.9 ▲ 2.0 98.7 100.4 1.7 98.7 94.3 1.0 家事用 102.1 98.3 ▲ 3.7 103.5 90.2 ▲ 7.2 102.6 102.1 ▲ 0.5 101.5 90.3 ▲ 0.8 教養・娯楽用 92.4 83.8 ▲ 9.3 93.5 80.4 ▲ 8.2 92.7 91.9 ▲ 0.9 90.3 88.0 0.7 被服・履き物 73.6 79.1 7.5 77.8 74.4 ▲ 6.1 83.0 82.0 ▲ 1.2 101.9 81.5 ▲ 6.2 飲食料品 101.0 108.5 7.4 106.1 107.3 6.7 99.5 105.3 5.8 100.8 103.9 3.5 生産財 99.3 96.4 ▲ 2.9 97.9 91.5 ▲ 2.3 99.3 96.8 ▲ 2.5 97.1 91.2 ▲ 2.4 鉱工業用生産財 99.9 96.9 ▲ 3.0 98.2 92.1 ▲ 2.4 99.6 97.2 ▲ 2.4 97.3 91.7 ▲ 2.7 その他用生産財 93.4 89.7 ▲ 4.0 94.4 84.8 ▲ 2.2 97.1 93.8 ▲ 3.4 95.2 86.8 0.6
前 月 比%Change FromPrevious Month
前年同月比%Change FromPrevious Year
前 月 比%Change FromPrevious Month
前年同月比%Change FromPrevious Year
季節調整済指数Seasonally Adjusted Index
原 指 数Original Index
季節調整済指数Seasonally Adjusted Index
原 指 数Original Index
財
分
類
分 類
生 産 Production 生産者出荷 Shipments
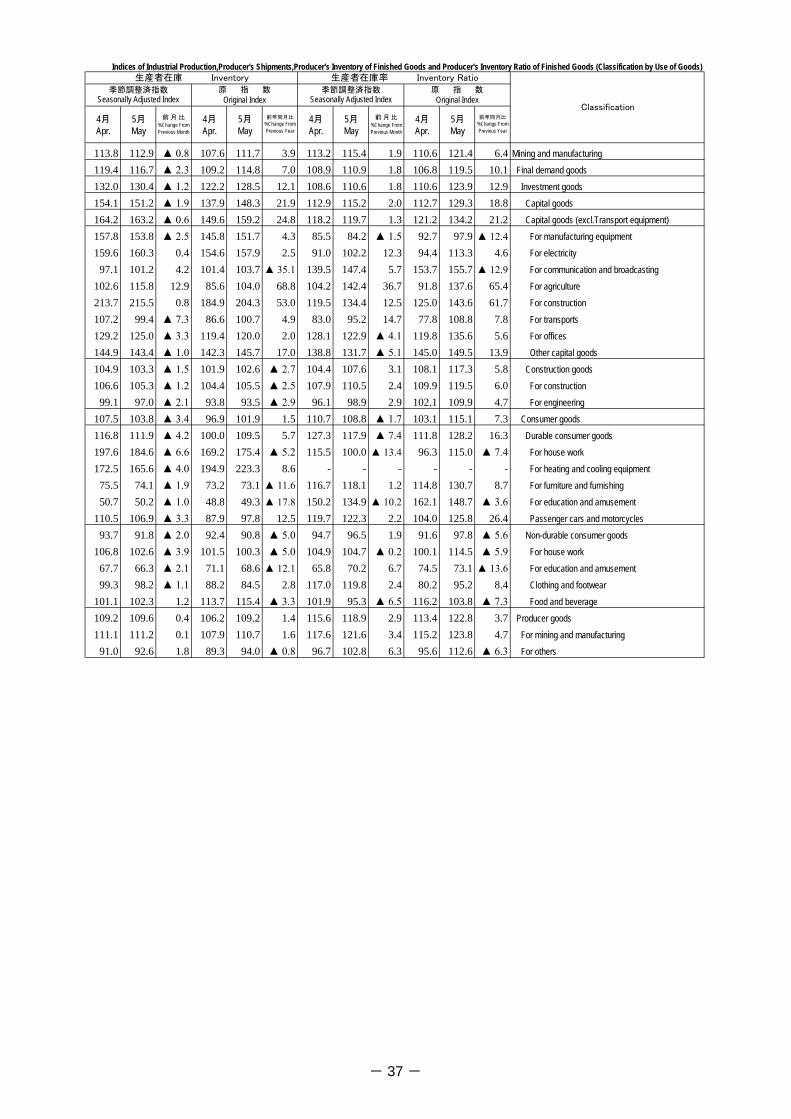
- 37 -
Indices of Industrial Production,Producer's Shipments,Producer's Inventory of Finished Goods and Producer's Inventory Ratio of Finished Goods (Classification by Use of Goods)
4月 5月 4月 5月 4月 5月 4月 5月Apr. May Apr. May Apr. May Apr. May
113.8 112.9 ▲ 0.8 107.6 111.7 3.9 113.2 115.4 1.9 110.6 121.4 6.4 Mining and manufacturing119.4 116.7 ▲ 2.3 109.2 114.8 7.0 108.9 110.9 1.8 106.8 119.5 10.1 Final demand goods132.0 130.4 ▲ 1.2 122.2 128.5 12.1 108.6 110.6 1.8 110.6 123.9 12.9 Investment goods154.1 151.2 ▲ 1.9 137.9 148.3 21.9 112.9 115.2 2.0 112.7 129.3 18.8 Capital goods164.2 163.2 ▲ 0.6 149.6 159.2 24.8 118.2 119.7 1.3 121.2 134.2 21.2 Capital goods (excl.Transport equipment)157.8 153.8 ▲ 2.5 145.8 151.7 4.3 85.5 84.2 ▲ 1.5 92.7 97.9 ▲ 12.4 For manufacturing equipment159.6 160.3 0.4 154.6 157.9 2.5 91.0 102.2 12.3 94.4 113.3 4.6 For electricity
97.1 101.2 4.2 101.4 103.7 ▲ 35.1 139.5 147.4 5.7 153.7 155.7 ▲ 12.9 For communication and broadcasting102.6 115.8 12.9 85.6 104.0 68.8 104.2 142.4 36.7 91.8 137.6 65.4 For agriculture213.7 215.5 0.8 184.9 204.3 53.0 119.5 134.4 12.5 125.0 143.6 61.7 For construction107.2 99.4 ▲ 7.3 86.6 100.7 4.9 83.0 95.2 14.7 77.8 108.8 7.8 For transports129.2 125.0 ▲ 3.3 119.4 120.0 2.0 128.1 122.9 ▲ 4.1 119.8 135.6 5.6 For offices144.9 143.4 ▲ 1.0 142.3 145.7 17.0 138.8 131.7 ▲ 5.1 145.0 149.5 13.9 Other capital goods104.9 103.3 ▲ 1.5 101.9 102.6 ▲ 2.7 104.4 107.6 3.1 108.1 117.3 5.8 Construction goods106.6 105.3 ▲ 1.2 104.4 105.5 ▲ 2.5 107.9 110.5 2.4 109.9 119.5 6.0 For construction
99.1 97.0 ▲ 2.1 93.8 93.5 ▲ 2.9 96.1 98.9 2.9 102.1 109.9 4.7 For engineering107.5 103.8 ▲ 3.4 96.9 101.9 1.5 110.7 108.8 ▲ 1.7 103.1 115.1 7.3 Consumer goods116.8 111.9 ▲ 4.2 100.0 109.5 5.7 127.3 117.9 ▲ 7.4 111.8 128.2 16.3 Durable consumer goods197.6 184.6 ▲ 6.6 169.2 175.4 ▲ 5.2 115.5 100.0 ▲ 13.4 96.3 115.0 ▲ 7.4 For house work172.5 165.6 ▲ 4.0 194.9 223.3 8.6 - - - - - - For heating and cooling equipment
75.5 74.1 ▲ 1.9 73.2 73.1 ▲ 11.6 116.7 118.1 1.2 114.8 130.7 8.7 For furniture and furnishing50.7 50.2 ▲ 1.0 48.8 49.3 ▲ 17.8 150.2 134.9 ▲ 10.2 162.1 148.7 ▲ 3.6 For education and amusement
110.5 106.9 ▲ 3.3 87.9 97.8 12.5 119.7 122.3 2.2 104.0 125.8 26.4 Passenger cars and motorcycles93.7 91.8 ▲ 2.0 92.4 90.8 ▲ 5.0 94.7 96.5 1.9 91.6 97.8 ▲ 5.6 Non-durable consumer goods
106.8 102.6 ▲ 3.9 101.5 100.3 ▲ 5.0 104.9 104.7 ▲ 0.2 100.1 114.5 ▲ 5.9 For house work67.7 66.3 ▲ 2.1 71.1 68.6 ▲ 12.1 65.8 70.2 6.7 74.5 73.1 ▲ 13.6 For education and amusement99.3 98.2 ▲ 1.1 88.2 84.5 2.8 117.0 119.8 2.4 80.2 95.2 8.4 Clothing and footwear
101.1 102.3 1.2 113.7 115.4 ▲ 3.3 101.9 95.3 ▲ 6.5 116.2 103.8 ▲ 7.3 Food and beverage109.2 109.6 0.4 106.2 109.2 1.4 115.6 118.9 2.9 113.4 122.8 3.7 Producer goods111.1 111.2 0.1 107.9 110.7 1.6 117.6 121.6 3.4 115.2 123.8 4.7 For mining and manufacturing
91.0 92.6 1.8 89.3 94.0 ▲ 0.8 96.7 102.8 6.3 95.6 112.6 ▲ 6.3 For others
前 月 比%Change FromPrevious Month
前年同月比%Change FromPrevious Year
Classification
季節調整済指数Seasonally Adjusted Index
原 指 数Original Index
季節調整済指数Seasonally Adjusted Index
原 指 数Original Index
前 月 比%Change FromPrevious Month
前年同月比%Change FromPrevious Year
生産者在庫率 Inventory Ratio生産者在庫 Inventory
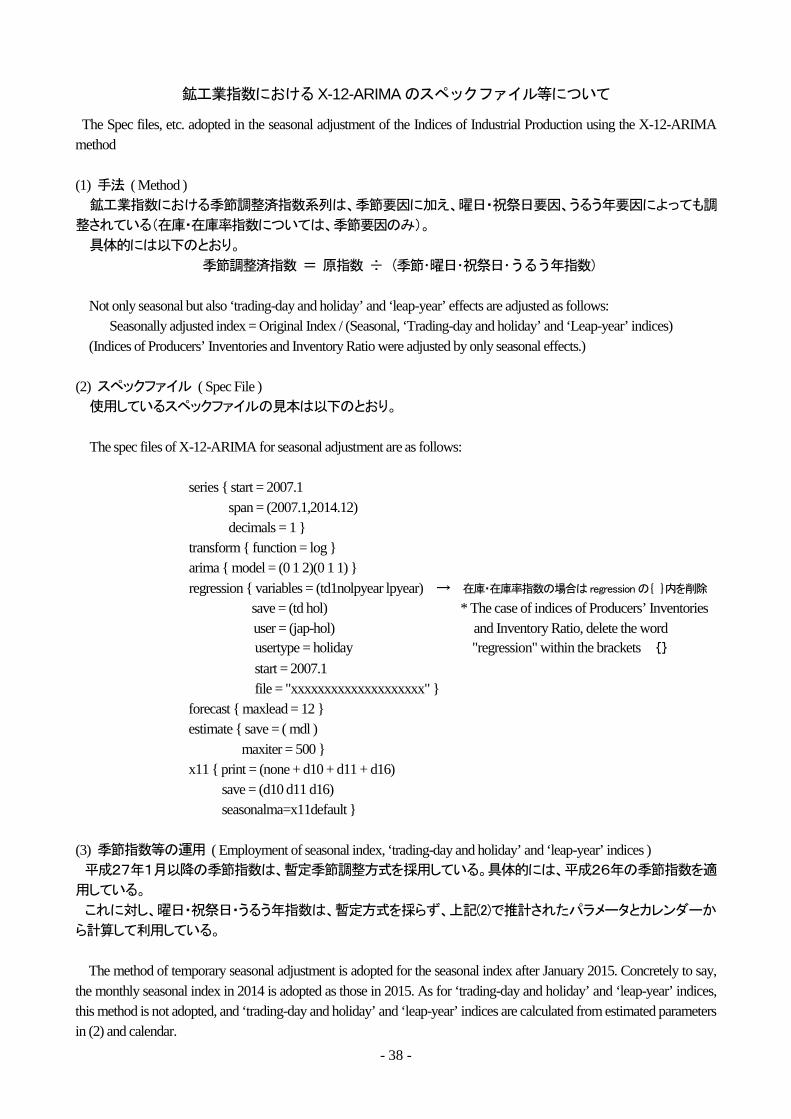
- 38 -
鉱工業指数におけるX-12-ARIMAのスペックファイル等について
The Spec files, etc. adopted in the seasonal adjustment of the Indices of Industrial Production using the X-12-ARIMA method (1) 手法 ( Method ) 鉱工業指数における季節調整済指数系列は、季節要因に加え、曜日・祝祭日要因、うるう年要因によっても調
整されている(在庫・在庫率指数については、季節要因のみ)。
具体的には以下のとおり。
季節調整済指数 = 原指数 ÷ (季節・曜日・祝祭日・うるう年指数)
Not only seasonal but also ‘trading-day and holiday’ and ‘leap-year’ effects are adjusted as follows:
Seasonally adjusted index = Original Index / (Seasonal, ‘Trading-day and holiday’ and ‘Leap-year’ indices) (Indices of Producers’ Inventories and Inventory Ratio were adjusted by only seasonal effects.) (2) スペックファイル ( Spec File ) 使用しているスペックファイルの見本は以下のとおり。
The spec files of X-12-ARIMA for seasonal adjustment are as follows:
series { start = 2007.1 span = (2007.1,2014.12) decimals = 1 } transform { function = log } arima { model = (0 1 2)(0 1 1) } regression { variables = (td1nolpyear lpyear) → 在庫・在庫率指数の場合は regressionの{ }内を削除
save = (td hol) * The case of indices of Producers’ Inventories user = (jap-hol) and Inventory Ratio, delete the word
usertype = holiday "regression" within the brackets {} start = 2007.1 file = "xxxxxxxxxxxxxxxxxxxx" } forecast { maxlead = 12 } estimate { save = ( mdl ) maxiter = 500 } x11 { print = (none + d10 + d11 + d16) save = (d10 d11 d16) seasonalma=x11default } (3) 季節指数等の運用 ( Employment of seasonal index, ‘trading-day and holiday’ and ‘leap-year’ indices ) 平成27年1月以降の季節指数は、暫定季節調整方式を採用している。具体的には、平成26年の季節指数を適
用している。
これに対し、曜日・祝祭日・うるう年指数は、暫定方式を採らず、上記(2)で推計されたパラメータとカレンダーか
ら計算して利用している。
The method of temporary seasonal adjustment is adopted for the seasonal index after January 2015. Concretely to say, the monthly seasonal index in 2014 is adopted as those in 2015. As for ‘trading-day and holiday’ and ‘leap-year’ indices, this method is not adopted, and ‘trading-day and holiday’ and ‘leap-year’ indices are calculated from estimated parameters in (2) and calendar.
- 39 -
(4) 異常値処理 ( Outlier detection ) 平成26年年間補正において、異常値が検出された系列と異常値処理を行った種別、年月は以下のとおり。
In the 2014 Annual revision , outlier–detected indices, type of outliers and period of outliers are as follows:
系 列 名 称 Type of index
異常値種別 Type of Outliers
処理年月 Period of Outliers
鉱 工 業 指 数 Production index
生 産 Production
TC 2011 03
March, 2011
出 荷 Shipments
LS 2009 01
January, 2009
LS 2011 03
March, 2011
LS 2011 06
June, 2011
在 庫 Inventories TC
2011 03 March, 2011
在 庫 率 Inventory ratio
- -
製 造 工 業 稼 働 率
・ 生 産 能 力 指 数 Operating ratio index, Production capacity index
稼 働 率 Operating ratio
LS 2011 03
March, 2011
AO 2011 04
April, 2011
製 造 工 業 生 産 予 測 指 数 Production forecast index
TC 2011 03
March, 2011 TC: temporary change
LS: level shift AO: additive outlier
これにより平成26年年間補正で修正した(2) のスペックファイルは以下のとおり。
<鉱工業生産指数の場合>
That is, the spec file modified for the 2014 Annual revision is as follows: <In the case of Production index>
regression { variables = (td1nolpyear lpyear tc2011.3)
- 40 -
平成22年基準 生産・出荷・在庫・在庫率指数 ウェイト表
分 類 生産(付) 出 荷 在 庫 在庫率 分 類 生産(付) 出 荷 在 庫 在庫率鉱工業 10000.0 10000.0 10000.0 9702.7 無機薬品・顔料・触媒 33.2 34.8 46.0 46.0 製造工業 9978.9 9985.7 9988.1 9690.8 高圧ガス 15.5 11.7 1.0 1.0 鉄鋼業 391.1 638.7 1382.7 1327.4 石油系芳香族 69.9 78.9 68.8 68.8 鉄素製品(含.鋼半製品) 91.5 56.0 561.0 505.7 環式中間物 68.3 68.4 63.5 63.5 熱間圧延鋼材 110.4 278.5 378.4 378.4 有機薬品 123.8 133.2 68.1 68.1 鋼管 13.2 44.8 104.6 104.6 プラスチック 162.8 196.2 544.8 544.8 冷間仕上鋼材 50.1 116.5 148.8 148.8 合成ゴム 46.4 45.7 169.8 169.8 めっき鋼材 36.1 80.3 103.7 103.7 写真感光材料 10.2 10.2 15.6 15.6 鋳鍛造品 89.8 62.6 86.2 86.2 石けん・合成洗剤・界面活性剤 99.9 72.1 50.8 50.8 (特掲:普通鋼鋼材) 149.5 336.3 488.8 488.8 化粧品 253.8 138.0 208.4 208.4 (特掲:特殊鋼鋼材) 60.3 183.8 246.7 246.7 塗料・印刷インキ 68.7 67.9 93.9 93.9 非鉄金属工業 232.5 322.5 306.5 306.5 医薬品 272.0 157.7 0.0 0.0 非鉄金属地金 55.8 101.0 113.4 113.4 (特掲:石油化学製品) 374.2 418.7 676.7 676.7 伸銅・アルミニウム圧延製品 65.3 93.0 95.2 95.2 石油・石炭製品工業 175.8 624.8 497.5 497.5 電線・ケーブル 50.6 75.5 97.9 97.9 石油製品 173.8 615.6 452.1 452.1 非鉄金属鋳物 60.8 53.0 0.0 0.0 石炭製品 2.0 9.2 45.4 45.4 金属製品工業 418.1 366.7 435.0 410.7 プラスチック製品工業 507.5 421.2 661.4 661.4 建設用金属製品 90.2 84.5 0.0 0.0 パルプ・紙・紙加工品工業 203.6 212.2 340.3 321.5 建築用金属製品 95.7 98.0 95.4 95.4 パルプ 33.7 5.2 18.8 0.0 暖ちゅう房熱機器 57.3 45.2 118.4 94.1 紙 77.6 111.6 255.1 255.1 その他の金属製品 174.9 139.0 221.2 221.2 板紙 28.8 40.1 61.0 61.0 はん用・生産用・業務用機械工業 1273.1 1085.6 1127.1 1082.5 紙加工品 63.5 55.3 5.4 5.4 はん用機械工業 418.6 360.2 244.1 244.1 繊維工業 183.4 133.4 421.3 421.3 ボイラ・原動機 97.5 83.0 24.5 24.5 炭素繊維 7.7 5.2 18.6 18.6 風水力機械・油圧機器 113.2 91.6 90.1 90.1 化学繊維 33.8 26.3 99.7 99.7 運搬機械 36.8 34.2 0.0 0.0 紡績 2.8 1.7 6.6 6.6 冷凍機・同応用製品 38.4 34.6 67.0 67.0 織物 37.2 16.1 48.6 48.6 はん用機械器具部品 132.7 116.8 62.5 62.5 染色整理 21.8 18.1 26.5 26.5 生産用機械工業 701.2 571.4 682.6 638.0 衣類 47.2 33.5 158.6 158.6 土木建設機械 106.5 125.8 276.6 276.6 その他の繊維製品 32.9 32.5 62.7 62.7 化学機械 17.8 13.3 0.0 0.0 食料品・たばこ工業 613.9 579.3 326.5 326.5 生活関連産業用機械 48.2 34.3 0.0 0.0 肉製品 40.6 35.0 0.0 0.0 半導体・フラットパネル製造装置 169.9 143.1 0.0 0.0 乳製品 78.2 85.3 0.9 0.9 産業用ロボット 57.9 39.5 0.0 0.0 水産製品 31.1 20.5 3.3 3.3 農業用機械 40.5 36.8 77.9 37.1 野菜・果実製品 24.8 17.1 0.0 0.0 金属工作機械 80.8 64.4 151.3 151.3 油脂・調味料 54.9 54.8 33.4 33.4 金属加工機械 21.7 16.1 5.8 2.0 その他の食料品 14.4 21.9 25.3 25.3 繊維機械 31.7 21.4 6.3 6.3 清涼飲料 166.6 123.7 109.7 109.7 金型 50.6 30.4 0.0 0.0 酒類 157.7 148.0 15.4 15.4 機械工具 60.7 33.9 164.7 164.7 たばこ 45.6 73.0 138.5 138.5 その他の生産用機械 14.9 12.4 0.0 0.0 その他工業 534.6 348.8 446.9 446.9 業務用機械工業 153.3 154.0 200.4 200.4 ゴム製品工業 161.0 126.7 141.2 141.2 計測機器 85.9 74.0 121.8 121.8 家具工業 67.3 54.7 100.9 100.9 光学部品 37.4 36.6 41.0 41.0 金属製家具 56.6 46.2 82.3 82.3 その他の業務用機械 30.0 43.4 37.6 37.6 木製家具 10.7 8.5 18.6 18.6 電子部品・デバイス工業 818.6 711.1 368.3 368.3 印刷業 197.1 68.1 0.0 0.0 電子部品 365.4 351.9 71.3 71.3 木材・木製品工業 58.4 57.4 126.4 126.4 半導体素子 72.5 58.9 54.6 54.6 その他製品工業 50.8 41.9 78.4 78.4 集積回路 333.3 254.9 242.4 242.4 時計 10.0 11.4 15.4 15.4 半導体部品 47.4 45.4 0.0 0.0 楽器 4.8 4.8 11.8 11.8 電気機械工業 667.7 570.5 371.0 235.6 文具 19.0 12.6 22.4 22.4 回転電気機械 102.1 77.2 0.0 0.0 玩具 7.9 4.8 9.5 9.5 静止電気機械 52.5 47.0 9.9 9.9 皮革製品 9.1 8.3 19.3 19.3 開閉制御装置・機器 140.3 120.2 0.0 0.0 鉱業 21.1 14.3 11.9 11.9 民生用電気機械 122.4 88.9 155.8 69.0 産業総合(鉱工業、電力・ガス) 10560.0 10692.9 10000.0 9702.7 配線・照明用器具 74.8 74.5 99.2 99.2 産業総合(鉱工業、電力・ガス・熱供給・水道事業) 10607.1 10837.4 10000.0 9702.7 電子応用装置 39.5 34.9 0.0 0.0 電力・ガス事業 560.0 692.9 0.0 0.0 電気計測器 57.2 40.7 2.5 0.0 熱供給事業 11.9 36.6 0.0 0.0 電池 58.8 68.7 57.5 57.5 水道事業 35.2 107.9 0.0 0.0 その他の電気機械 20.1 18.4 46.1 0.0 最終需要財 4949.5 4969.6 4449.8 4245.5 情報通信機械工業 453.4 489.5 234.2 234.2 投資財 2414.7 2280.8 2161.7 2105.4 通信機械 104.7 107.9 30.7 30.7 資本財 1851.0 1730.5 1224.0 1167.7 民生用電子機械 166.3 243.4 189.1 189.1 製造設備用 554.2 421.1 171.1 167.3 電子計算機 154.5 117.3 8.7 8.7 電力用 218.2 198.2 66.5 54.8 その他の情報通信機械 27.9 20.9 5.7 5.7 通信・放送用 59.5 41.9 11.7 11.7 輸送機械工業 1912.4 2218.9 1013.1 1013.1 農業用 40.5 36.8 77.9 37.1 輸送機械工業(除.船舶・同機関、鉄道車両、航空機) 1636.9 1962.6 1013.1 1013.1 建設用 118.8 132.7 311.0 311.0 乗用車 763.7 1064.1 782.0 782.0 輸送用 458.5 552.9 228.2 228.2 バス 17.9 25.0 17.3 17.3 事務用 171.2 143.2 110.1 110.1 トラック 132.8 182.7 142.1 142.1 その他 230.1 203.7 247.5 247.5 自動車ボデー 40.5 37.7 0.0 0.0 建設財 563.7 550.3 937.7 937.7 自動車部品 651.4 618.2 4.3 4.3 建築用 463.7 449.5 714.6 714.6 二輪自動車 13.8 18.2 52.8 52.8 土木用 100.0 100.8 223.1 223.1 産業車両 16.8 16.7 14.6 14.6 消費財 2534.8 2688.8 2288.1 2140.1 航空機 66.7 43.0 0.0 0.0 耐久消費財 1195.3 1523.1 1365.3 1217.3 船舶・同機関 189.9 197.2 0.0 0.0 家事用 64.9 53.9 146.7 109.8 鉄道車両 18.9 16.1 0.0 0.0 冷暖房用 63.9 46.6 111.1 0.0 (特掲:乗用車・バス・トラック) 914.4 1271.8 941.4 941.4 家具・装備品用 25.8 25.8 51.6 51.6 窯業・土石製品工業 315.8 221.6 643.2 624.3 教養・娯楽用 253.6 343.5 168.2 168.2 ガラス・同製品 128.0 74.4 200.9 200.9 乗用車・二輪車 787.1 1053.3 887.7 887.7 セメント・同製品 53.4 50.9 220.4 220.4 非耐久消費財 1339.5 1165.7 922.8 922.8 陶磁器 22.1 16.0 89.5 89.5 家事用 675.1 431.6 356.4 356.4 ファインセラミックス 66.5 42.2 66.1 47.2 教養・娯楽用 119.5 273.3 252.9 252.9 その他の窯業・土石製品 45.8 38.1 66.3 66.3 被服・履き物 56.3 41.8 177.9 177.9 化学工業 1277.4 1040.9 1413.1 1413.1 飲食料品 488.6 419.0 135.6 135.6 化学工業(除.医薬品) 1005.4 883.2 1413.1 1413.1 生産財 5050.5 5030.4 5550.2 5457.2 化学肥料 10.9 11.6 70.4 70.4 鉱工業用生産財 4603.0 4511.2 5053.1 4960.1 ソーダ工業製品 42.0 14.5 12.0 12.0 その他用生産財 447.5 519.2 497.1 497.1