
± 40 0Miles Type of Registered Boats - NMMA · Personal Watercraft Sailboats ... $56.0 $94.0...
8
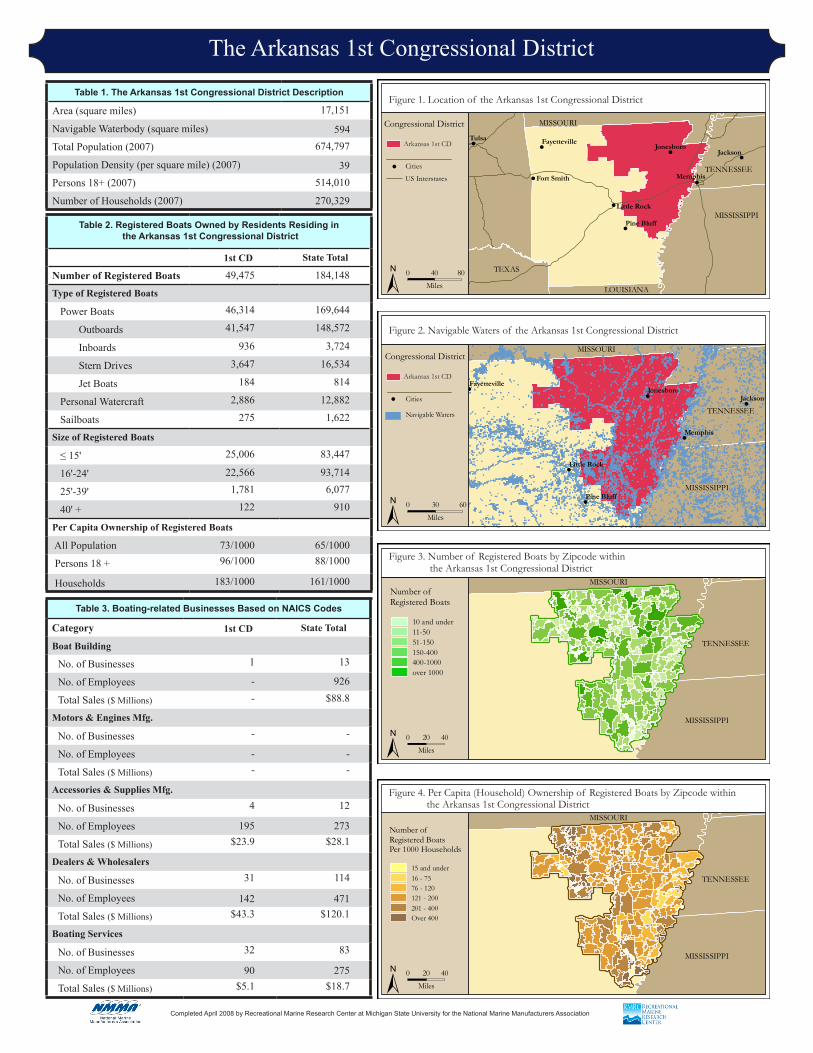
The Arkansas 1st Congressional District Area (square miles) Navigable Waterbody (square miles) Total Population (2007) Population Density (per square mile) (2007) Persons 18+ (2007) Number of Households (2007) Table 2. Registered Boats Owned by Residents Residing in State Total Number of Registered Boats Type of Registered Boats Power Boats Outboards Inboards Stern Drives Jet Boats Personal Watercraft Sailboats Size of Registered Boats ≤ 15' 16'-24' 25'-39' 40' + Per Capita Ownership of Registered Boats All Population Persons 18 + Households Table 3. Boating-related Businesses Based on NAICS Codes Category State Total Boat Building No. of Businesses No. of Employees Total Sales ($ Millions) Motors & Engines Mfg. No. of Businesses No. of Employees Total Sales ($ Millions) Accessories & Supplies Mfg. No. of Businesses No. of Employees Total Sales ($ Millions) Dealers & Wholesalers No. of Businesses No. of Employees Total Sales ($ Millions) Boating Services No. of Businesses No. of Employees Total Sales ($ Millions) Completed April 2008 by Recreational Marine Research Center at Michigan State University for the National Marine Manufacturers Association ! ! ! ! ! ! ! ! LOUISIANA MISSISSIPPI TEXAS TENNESSEE MISSOURI Pine Bluff Little Rock Fort Smith Memphis Jackson Fayetteville Tulsa Jonesboro ± 0 80 40 Miles ! ! ! ! ! MISSISSIPPI TENNESSEE MISSOURI Pine Bluff Little Rock Memphis Jackson Fayetteville Jonesboro ± 0 60 30 Miles MISSISSIPPI TENNESSEE MISSOURI ± 0 40 20 Miles MISSISSIPPI TENNESSEE MISSOURI ± 0 40 20 Miles 17,151 594 674,797 39 514,010 270,329 184,148 49,475 46,314 41,547 936 3,647 184 2,886 275 25,006 22,566 1,781 122 73/1000 96/1000 183/1000 169,644 148,572 3,724 16,534 814 12,882 1,622 83,447 93,714 6,077 910 65/1000 88/1000 161/1000 1 - - - - - 4 195 $23.9 31 142 $43.3 32 90 $5.1 13 926 $88.8 - - - 12 273 $28.1 114 471 $120.1 83 275 $18.7 Table 1. The Arkansas 1st Congressional District Description the Arkansas 1st Congressional District 1st CD 1st CD Cities ! Congressional District Navigable Waters Number of Registered Boats 10 and under 11-50 51-150 150-400 400-1000 over 1000 Number of Registered Boats Per 1000 Households 15 and under 16 - 75 76 - 120 121 - 200 201 - 400 Over 400 Cities US Interstates ! Congressional District Arkansas 1st CD Arkansas 1st CD Figure 2. Navigable Waters of the Arkansas 1st Congressional District Figure 1. Location of the Arkansas 1st Congressional District Figure 3. Number of Registered Boats by Zipcode within the Arkansas 1st Congressional District Figure 4. Per Capita (Household) Ownership of Registered Boats by Zipcode within the Arkansas 1st Congressional District
Transcript of ± 40 0Miles Type of Registered Boats - NMMA · Personal Watercraft Sailboats ... $56.0 $94.0...
The Arkansas 1st Congressional District
Area (square miles)
Navigable Waterbody (square miles)
Total Population (2007)
Population Density (per square mile) (2007)
Persons 18+ (2007)
Number of Households (2007)
Table 2. Registered Boats Owned by Residents Residing in
State Total
Number of Registered Boats Type of Registered Boats
Power Boats
Outboards
Inboards
Stern Drives
Jet Boats
Personal Watercraft
Sailboats Size of Registered Boats
≤ 15'
16'-24'
25'-39'
40' +
Per Capita Ownership of Registered Boats
All Population
Persons 18 +
Households
Table 3. Boating-related Businesses Based on NAICS Codes
Category State Total
Boat Building
No. of Businesses
No. of Employees
Total Sales ($ Millions)
Motors & Engines Mfg.
No. of Businesses
No. of Employees
Total Sales ($ Millions)
Accessories & Supplies Mfg.
No. of Businesses
No. of Employees
Total Sales ($ Millions)
Dealers & Wholesalers
No. of Businesses
No. of Employees
Total Sales ($ Millions)
Boating Services
No. of Businesses
No. of Employees
Total Sales ($ Millions)
Completed April 2008 by Recreational Marine Research Center at Michigan State University for the National Marine Manufacturers Association
!
!!
!
!!
!
!
LOUISIANA
MISSISSIPPI
TEXAS
TENNESSEE
MISSOURI
Pine Bluff
Little Rock
Fort Smith Memphis
JacksonFayettevilleTulsa
Jonesboro
± 0 8040
Miles
Cities
US Interstates
!
!
!
!
!
!
!
MISSISSIPPI
TENNESSEE
MISSOURI
Pine Bluff
Little Rock
Memphis
Jackson
FayettevilleJonesboro
± 0 6030
Miles
Congressional Districts
Cities!
MISSISSIPPI
TENNESSEE
MISSOURI
± 0 4020
Miles
MISSISSIPPI
TENNESSEE
MISSOURI
± 0 4020
Miles
17,151
594674,797
39514,010
270,329
184,14849,475
46,314
41,547
936
3,647
184
2,886
275
25,006
22,5661,781
122
73/100096/1000
183/1000
169,644
148,572
3,724
16,534
814
12,882
1,622
83,447
93,7146,077
910
65/100088/1000
161/1000
1
--
-
--
4
195$23.9
31
142$43.3
32
90$5.1
13
926$88.8
-
--
12
273$28.1
114
471$120.1
83
275$18.7
Table 1. The Arkansas 1st Congressional District Description
the Arkansas 1st Congressional District
1st CD
1st CD
Cities!
Congressional District
Navigable Waters
Number ofRegistered Boats
10 and under11-5051-150150-400400-1000over 1000
Number ofRegistered BoatsPer 1000 Households
15 and under16 - 7576 - 120121 - 200201 - 400Over 400
Cities
US Interstates
!
Congressional District
Arkansas 1st CD
Arkansas 1st CD
Figure 2. Navigable Waters of the Arkansas 1st Congressional District
Figure 1. Location of the Arkansas 1st Congressional District
Figure 3. Number of Registered Boats by Zipcode within the Arkansas 1st Congressional District
Figure 4. Per Capita (Household) Ownership of Registered Boats by Zipcode withinthe Arkansas 1st Congressional District

Boat Type and Size
Category Power<15’
Power16’ - 24’
Power25’ - 39’
Power40’+
Sail<15’
Sail16’ - 24’
Sail25’ - 39’
Sail40+ Total
Number of boats(Thousands of boats)
Annual craft spending($ per boat per year)
Total craft spending($ Millions)
Total boat days(Thousands of days)
Total trip spending($ per boat per year)
Total trip spending($ Millions)
Total craft & trip spending ($ Millions)
Table 4. Economic Significance of Trip Spending and Annual Craft Spending by Power and Sailboats Registered in the
Trip Spending
Annual Craft Spending Total
Direct Effects
Sales ($ Millions)
Jobs
Labor Income ($ Millions)
Value Added ($ Millions)
Total Effects
Sales ($ Millions)
Jobs
Labor Income ($ Millions)
Value Added ($ Millions)
Table 5. Economic Significance of Power and Sailboats Registered in the
Sector/Spending category
Sales($ Millions) Jobs Labor Income
($Millions)Value Added
($Millions)
Direct Effects
Lodging
Marina Services
Restaurant
Recreation & Entertainment
Repair & Maintenance
Insurance & Credit
Gas Service
Other Retail Trade
Wholesale Trade
Other Local Production of Goods
Total Direct Effects
Secondary Effects
Total Effects
Economic Significance of Boating
Completed April, 2008 by the Recreational Marine Research Center at Michigan State University for the National Marine Manufacturers Association
Table 3. Total Annual Craft Spending (not including purchases of boats) by Power and Sailboat Owners Registered in the
Category Total ($ Millions) Percentage
Slip
Loan Payments
Replacement Motors
Replacement Trailers
Insurance
Repairs
Accessories
Taxes
Total
Table 2. Total Spending on Boat Trips by Power and Sailboat Owners Registered in the Category Total ($ Millions) Percentage
Lodging
Marina services
Restaurant
Groceries
Boat fuel
Auto fuel
Repair & Maintenance
Marine supplies
Recreation & Entertainment
Shopping
Other services
Other goods
Total
$3.1
$6.3
$14.1
$14.0
$18.0
$14.6
--
$3.4
$2.5
-
$1.9
$78.0
4%
8%
18%
18%
23%
19%
--
4%
3%
-
2%
100%
$8.5
$20.2
$0.9
$0.2
$5.9
$12.8
$12.6
$2.7
$63.9
13%
32%
1%
0%
9%
20%
20%
4%
100%
$65.8
684.7
$19.7
$31.6
$176.6
1,456.4
$54.0
$91.2
$40.2
461.4
$15.6
$26.0
$101.9
916.1
$36.0
$60.0
$106.0
1,146.1
$35.3
$57.6
$278.4
2,372.4
$90.0
$151.2
$3.1$14.8
$14.1
$3.4
$12.8$7.2
$7.3
$10.4$6.9
$26.0
$106.0
$172.5$278.4
38.4190.6
278.7
43.2
159.652.6
86.5
194.544.4
57.7
1,146.1
1,226.32,372.4
$1.2$5.2
$4.8
$1.2
$4.7$3.1
$3.5
$5.1$3.0
$3.5
$35.3
$54.7$90.0
$2.2$9.3
$6.8
$2.1
$6.6$6.6
$5.5
$8.2$5.3
$5.0
$57.6
$93.6$151.2
22.1 22.4 1.7 0.1 0.1 0.1 0.1 0.0 46.6
$457.9 $1,655.6 $7,464.6 $25,299.0 $488.7 $1,830.2 $7,439.8 $18,328.8
$10.1 $37.1 $12.8 $3.0 $0.0 $0.3 $0.5 $0.1 $63.9
359.2 561.4 52.7 5.1 1.1 2.8 2.0 0.2 984.5
$935.9 $2,148.4 $4,574.4 $8,039.6 $1,009.7 $1,009.7 $1,963.9 $5,204.7
$20.6 $48.2 $7.9 $0.9 $0.1 $0.1 $0.1 $0.0 $78.0
$30.7 $85.3 $20.7 $3.9 $0.1 $0.4 $0.6 $0.1 $141.8
Table 1. Craft and Trip Expenses by Power and Sailboats Registered in the Arkansas 1st Congressional District
Arkansas 1st CD Arkansas 1st CD
Arkansas 1st CDArkansas 1st CD
The Arkansas 2nd Congressional District
Area (square miles)
Navigable Waterbody (square miles)
Total Population (2007)
Population Density (per square mile) (2007)
Persons 18+ (2007)
Number of Households (2007)
Table 2. Registered Boats Owned by Residents Residing in
State Total
Number of Registered Boats Type of Registered Boats
Power Boats
Outboards
Inboards
Stern Drives
Jet Boats
Personal Watercraft
Sailboats Size of Registered Boats
≤ 15'
16'-24'
25'-39'
40' +
Per Capita Ownership of Registered Boats
All Population
Persons 18 +
Households
Table 3. Boating-related Businesses Based on NAICS Codes
Category State Total
Boat Building
No. of Businesses
No. of Employees
Total Sales ($ Millions)
Motors & Engines Mfg.
No. of Businesses
No. of Employees
Total Sales ($ Millions)
Accessories & Supplies Mfg.
No. of Businesses
No. of Employees
Total Sales ($ Millions)
Dealers & Wholesalers
No. of Businesses
No. of Employees
Total Sales ($ Millions)
Boating Services
No. of Businesses
No. of Employees
Total Sales ($ Millions)
Completed April 2008 by Recreational Marine Research Center at Michigan State University for the National Marine Manufacturers Association
!
!!
!
!!
!
!
LOUISIANA
MISSISSIPPI
TEXAS
TENNESSEE
MISSOURI
Pine Bluff
Little Rock
Fort Smith Memphis
JacksonFayettevilleTulsa
Jonesboro
± 0 8040
Miles
Cities
US Interstates
!
!Little Rock
± 0 3015
Miles
Congressional Districts
Cities!
± 0 2010
Miles
± 0 2010
Miles
5,922
176708,220
117536,659
278,994
184,14840,946
37,326
31,712
920
4,459
235
3,174
446
19,264
19,7871,569
326
58/100076/1000
147/1000
169,644
148,572
3,724
16,534
814
12,882
1,622
83,447
93,7146,077
910
65/100088/1000
161/1000
3
25$5.8
-
--
3
23$0.9
27
82$16.7
13
29$1.7
13
926$88.8
-
--
12
273$28.1
114
471$120.1
83
275$18.7
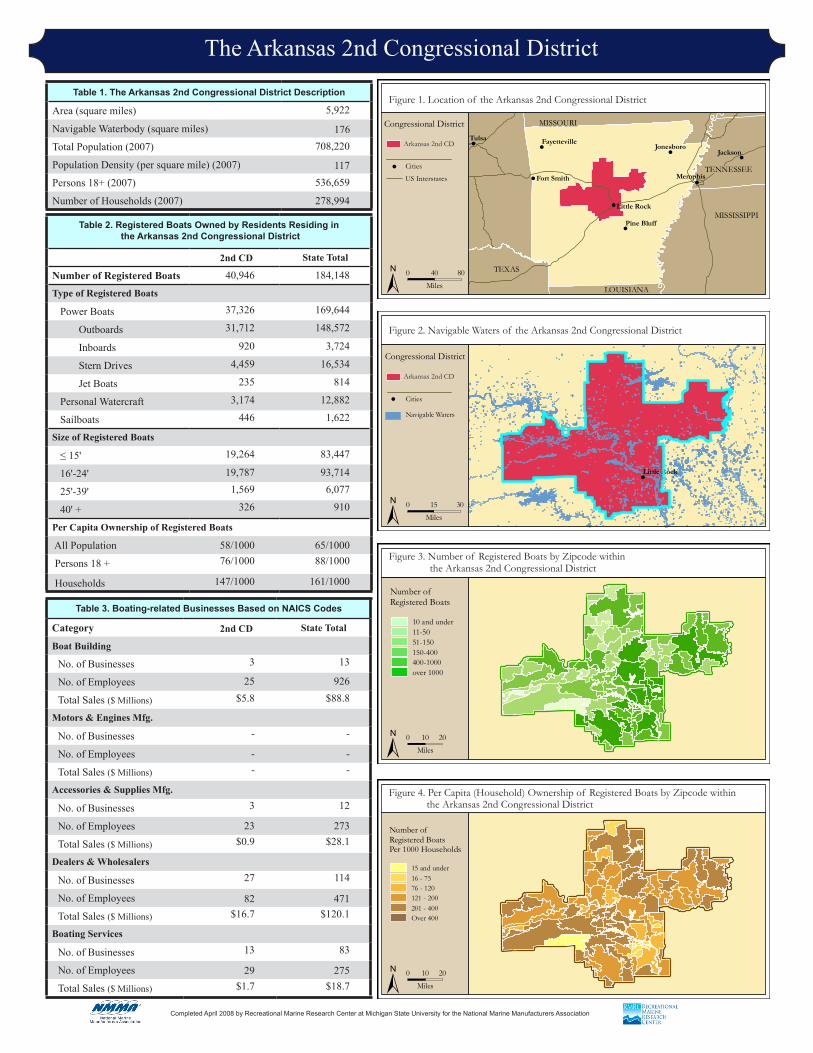
Table 1. The Arkansas 2nd Congressional District Description
the Arkansas 2nd Congressional District
2nd CD
2nd CD
Cities!
Congressional District
Navigable Waters
Number ofRegistered Boats
10 and under11-5051-150150-400400-1000over 1000
Number ofRegistered BoatsPer 1000 Households
15 and under16 - 7576 - 120121 - 200201 - 400Over 400
Cities
US Interstates
!
Congressional District
Arkansas 2nd CD
Arkansas 2nd CD
Figure 2. Navigable Waters of the Arkansas 2nd Congressional District
Figure 1. Location of the Arkansas 2nd Congressional District
Figure 3. Number of Registered Boats by Zipcode within the Arkansas 2nd Congressional District
Figure 4. Per Capita (Household) Ownership of Registered Boats by Zipcode withinthe Arkansas 2nd Congressional District

Boat Type and Size
Category Power<15’
Power16’ - 24’
Power25’ - 39’
Power40’+
Sail<15’
Sail16’ - 24’
Sail25’ - 39’
Sail40+ Total
Number of boats(Thousands of boats)
Annual craft spending($ per boat per year)
Total craft spending($ Millions)
Total boat days(Thousands of days)
Total trip spending($ per boat per year)
Total trip spending($ Millions)
Total craft & trip spending ($ Millions)
Table 4. Economic Significance of Trip Spending and Annual Craft Spending by Power and Sailboats Registered in the
Trip Spending
Annual Craft Spending Total
Direct Effects
Sales ($ Millions)
Jobs
Labor Income ($ Millions)
Value Added ($ Millions)
Total Effects
Sales ($ Millions)
Jobs
Labor Income ($ Millions)
Value Added ($ Millions)
Table 5. Economic Significance of Power and Sailboats Registered in the
Sector/Spending category
Sales($ Millions) Jobs Labor Income
($Millions)Value Added
($Millions)
Direct Effects
Lodging
Marina Services
Restaurant
Recreation & Entertainment
Repair & Maintenance
Insurance & Credit
Gas Service
Other Retail Trade
Wholesale Trade
Other Local Production of Goods
Total Direct Effects
Secondary Effects
Total Effects
Economic Significance of Boating
Completed April, 2008 by the Recreational Marine Research Center at Michigan State University for the National Marine Manufacturers Association
Table 3. Total Annual Craft Spending (not including purchases of boats) by Power and Sailboat Owners Registered in the
Category Total ($ Millions) Percentage
Slip
Loan Payments
Replacement Motors
Replacement Trailers
Insurance
Repairs
Accessories
Taxes
Total
Table 2. Total Spending on Boat Trips by Power and Sailboat Owners Registered in the Category Total ($ Millions) Percentage
Lodging
Marina services
Restaurant
Groceries
Boat fuel
Auto fuel
Repair & Maintenance
Marine supplies
Recreation & Entertainment
Shopping
Other services
Other goods
Total
$2.6
$5.5
$12.1
$12.1
$15.7
$12.2
--
$2.8
$2.1
-
$1.6
$66.8
4%
8%
18%
18%
23%
18%
--
4%
3%
-
2%
100%
$8.3
$19.4
$0.8
$0.2
$5.5
$11.9
$11.4
$2.6
$60.1
14%
32%
1%
0%
9%
20%
19%
4%
100%
$56.5
587.5
$16.9
$27.1
$151.8
1,250.4
$46.4
$78.3
$37.5
431.4
$14.5
$24.3
$95.1
855.8
$33.6
$56.0
$94.0
1,018.9
$31.4
$51.4
$246.8
2,106.1
$79.9
$134.3
$2.6$13.8
$12.1
$2.8
$11.9$6.8
$6.2
$9.2$6.0
$22.6
$94.0
$152.8$246.8
32.6177.8
240.1
36.2
148.949.0
73.9
171.738.7
50.3
1,018.9
1,087.22,106.1
$1.0$4.8
$4.1
$1.0
$4.4$2.9
$3.0
$4.5$2.6
$3.1
$31.4
$48.5$79.9
$1.9$8.7
$5.8
$1.8
$6.2$6.2
$4.7
$7.2$4.6
$4.3
$51.4
$82.9$134.3
16.0 19.6 1.4 0.3 0.1 0.2 0.1 0.0 37.8
$457.9 $1,655.6 $7,464.6 $25,299.0 $488.7 $1,830.2 $7,439.8 $18,328.8
$7.3 $32.4 $10.7 $8.1 $0.0 $0.4 $1.0 $0.1 $60.1
260.4 490.4 43.9 13.9 1.9 3.9 4.4 0.3 819.0
$935.9 $2,148.4 $4,574.4 $8,039.6 $1,009.7 $1,009.7 $1,963.9 $5,204.7
$15.0 $42.1 $6.5 $2.6 $0.1 $0.2 $0.3 $0.0 $66.8
$22.3 $74.5 $17.2 $10.6 $0.1 $0.6 $1.3 $0.2 $126.8
Table 1. Craft and Trip Expenses by Power and Sailboats Registered in the Arkansas 2nd Congressional District
Arkansas 2nd CD Arkansas 2nd CD
Arkansas 2nd CDArkansas 2nd CD
The Arkansas 3rd Congressional District
Area (square miles)
Navigable Waterbody (square miles)
Total Population (2007)
Population Density (per square mile) (2007)
Persons 18+ (2007)
Number of Households (2007)
Table 2. Registered Boats Owned by Residents Residing in
State Total
Number of Registered Boats Type of Registered Boats
Power Boats
Outboards
Inboards
Stern Drives
Jet Boats
Personal Watercraft
Sailboats Size of Registered Boats
≤ 15'
16'-24'
25'-39'
40' +
Per Capita Ownership of Registered Boats
All Population
Persons 18 +
Households
Table 3. Boating-related Businesses Based on NAICS Codes
Category State Total
Boat Building
No. of Businesses
No. of Employees
Total Sales ($ Millions)
Motors & Engines Mfg.
No. of Businesses
No. of Employees
Total Sales ($ Millions)
Accessories & Supplies Mfg.
No. of Businesses
No. of Employees
Total Sales ($ Millions)
Dealers & Wholesalers
No. of Businesses
No. of Employees
Total Sales ($ Millions)
Boating Services
No. of Businesses
No. of Employees
Total Sales ($ Millions)
Completed April 2008 by Recreational Marine Research Center at Michigan State University for the National Marine Manufacturers Association
!
!!
!
!!
!
!
LOUISIANA
MISSISSIPPI
TEXAS
TENNESSEE
MISSOURI
Pine Bluff
Little Rock
Fort Smith Memphis
JacksonFayettevilleTulsa
Jonesboro
± 0 8040
Miles
Cities
US Interstates
!
!
!OKLAHOMA
MISSOURI
Fort Smith
Fayetteville
± 0 2010
Miles
OKLAHOMA
MISSOURI
± 0 2010
Miles
OKLAHOMA
MISSOURI
± 0 2010
Miles
8,490
175770,621
89578,992
290,092
184,14841,650
37,507
31,651
1,068
4,562
226
3,557
586
14,076
26,0941,304
176
54/100072/1000
144/1000
169,644
148,572
3,724
16,534
814
12,882
1,622
83,447
93,7146,077
910
65/100088/1000
161/1000
8
866$80.8
-
--
2
25$1.7
31
99$16.4
19
44$2.5
13
926$88.8
-
--
12
273$28.1
114
471$120.1
83
275$18.7
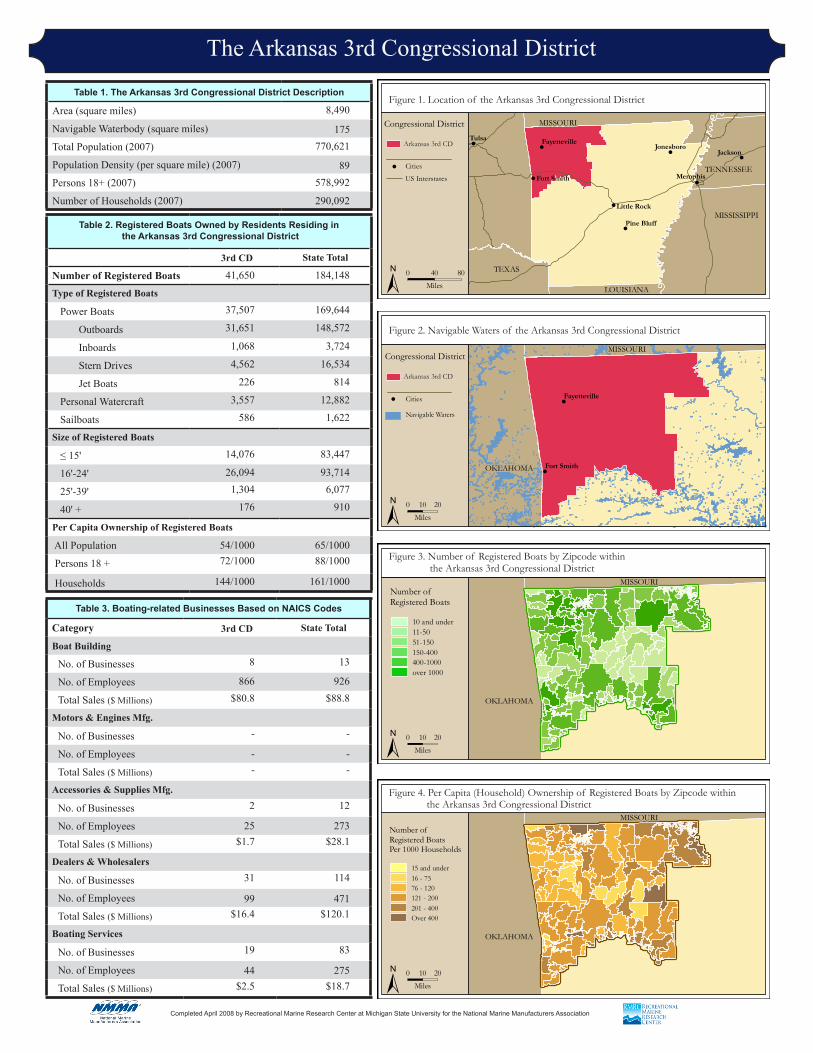
Table 1. The Arkansas 3rd Congressional District Description
the Arkansas 3rd Congressional District
3rd CD
3rd CD
Cities!
Congressional District
Navigable Waters
Number ofRegistered Boats
10 and under11-5051-150150-400400-1000over 1000
Number ofRegistered BoatsPer 1000 Households
15 and under16 - 7576 - 120121 - 200201 - 400Over 400
Cities
US Interstates
!
Congressional District
Arkansas 3rd CD
Arkansas 3rd CD
Figure 2. Navigable Waters of the Arkansas 3rd Congressional District
Figure 1. Location of the Arkansas 3rd Congressional District
Figure 3. Number of Registered Boats by Zipcode within the Arkansas 3rd Congressional District
Figure 4. Per Capita (Household) Ownership of Registered Boats by Zipcode withinthe Arkansas 3rd Congressional District
Boat Type and Size
Category Power<15’
Power16’ - 24’
Power25’ - 39’
Power40’+
Sail<15’
Sail16’ - 24’
Sail25’ - 39’
Sail40+ Total
Number of boats(Thousands of boats)
Annual craft spending($ per boat per year)
Total craft spending($ Millions)
Total boat days(Thousands of days)
Total trip spending($ per boat per year)
Total trip spending($ Millions)
Total craft & trip spending ($ Millions)
Table 4. Economic Significance of Trip Spending and Annual Craft Spending by Power and Sailboats Registered in the
Trip Spending
Annual Craft Spending Total
Direct Effects
Sales ($ Millions)
Jobs
Labor Income ($ Millions)
Value Added ($ Millions)
Total Effects
Sales ($ Millions)
Jobs
Labor Income ($ Millions)
Value Added ($ Millions)
Table 5. Economic Significance of Power and Sailboats Registered in the
Sector/Spending category
Sales($ Millions) Jobs Labor Income
($Millions)Value Added
($Millions)
Direct Effects
Lodging
Marina Services
Restaurant
Recreation & Entertainment
Repair & Maintenance
Insurance & Credit
Gas Service
Other Retail Trade
Wholesale Trade
Other Local Production of Goods
Total Direct Effects
Secondary Effects
Total Effects
Economic Significance of Boating
Completed April, 2008 by the Recreational Marine Research Center at Michigan State University for the National Marine Manufacturers Association
Table 3. Total Annual Craft Spending (not including purchases of boats) by Power and Sailboat Owners Registered in the
Category Total ($ Millions) Percentage
Slip
Loan Payments
Replacement Motors
Replacement Trailers
Insurance
Repairs
Accessories
Taxes
Total
Table 2. Total Spending on Boat Trips by Power and Sailboat Owners Registered in the Category Total ($ Millions) Percentage
Lodging
Marina services
Restaurant
Groceries
Boat fuel
Auto fuel
Repair & Maintenance
Marine supplies
Recreation & Entertainment
Shopping
Other services
Other goods
Total
$3.1
$5.6
$13.1
$13.4
$16.9
$13.6
--
$3.0
$2.1
-
$1.8
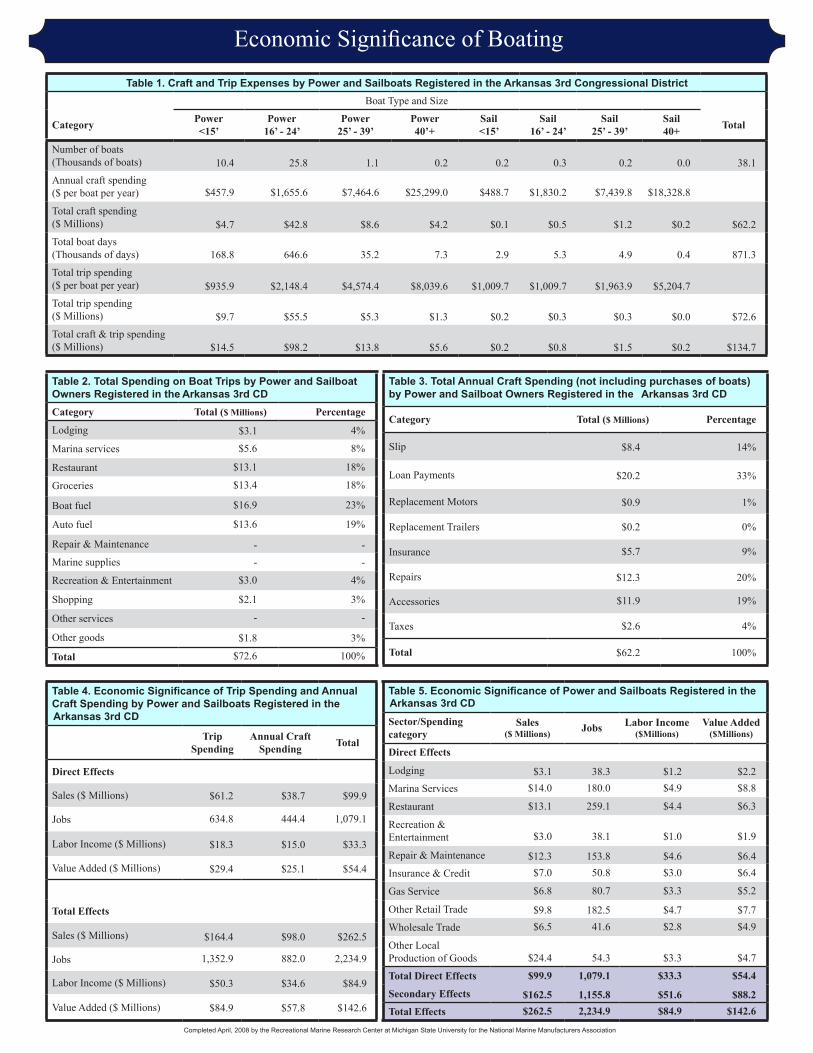
$72.6
4%
8%
18%
18%
23%
19%
--
4%
3%
-
3%
100%
$8.4
$20.2
$0.9
$0.2
$5.7
$12.3
$11.9
$2.6
$62.2
14%
33%
1%
0%
9%
20%
19%
4%
100%
$61.2
634.8
$18.3
$29.4
$164.4
1,352.9
$50.3
$84.9
$38.7
444.4
$15.0
$25.1
$98.0
882.0
$34.6
$57.8
$99.9
1,079.1
$33.3
$54.4
$262.5
2,234.9
$84.9
$142.6
$3.1$14.0
$13.1
$3.0
$12.3$7.0
$6.8
$9.8$6.5
$24.4
$99.9
$162.5$262.5
38.3180.0
259.1
38.1
153.850.8
80.7
182.541.6
54.3
1,079.1
1,155.82,234.9
$1.2$4.9
$4.4
$1.0
$4.6$3.0
$3.3
$4.7$2.8
$3.3
$33.3
$51.6$84.9
$2.2$8.8
$6.3
$1.9
$6.4$6.4
$5.2
$7.7$4.9
$4.7
$54.4
$88.2$142.6
10.4 25.8 1.1 0.2 0.2 0.3 0.2 0.0 38.1
$457.9 $1,655.6 $7,464.6 $25,299.0 $488.7 $1,830.2 $7,439.8 $18,328.8
$4.7 $42.8 $8.6 $4.2 $0.1 $0.5 $1.2 $0.2 $62.2
168.8 646.6 35.2 7.3 2.9 5.3 4.9 0.4 871.3
$935.9 $2,148.4 $4,574.4 $8,039.6 $1,009.7 $1,009.7 $1,963.9 $5,204.7
$9.7 $55.5 $5.3 $1.3 $0.2 $0.3 $0.3 $0.0 $72.6
$14.5 $98.2 $13.8 $5.6 $0.2 $0.8 $1.5 $0.2 $134.7
Table 1. Craft and Trip Expenses by Power and Sailboats Registered in the Arkansas 3rd Congressional District
Arkansas 3rd CD Arkansas 3rd CD
Arkansas 3rd CDArkansas 3rd CD

The Arkansas 4th Congressional District
Area (square miles)
Navigable Waterbody (square miles)
Total Population (2007)
Population Density (per square mile) (2007)
Persons 18+ (2007)
Number of Households (2007)
Table 2. Registered Boats Owned by Residents Residing in
State Total
Number of Registered Boats Type of Registered Boats
Power Boats
Outboards
Inboards
Stern Drives
Jet Boats
Personal Watercraft
Sailboats Size of Registered Boats
≤ 15'
16'-24'
25'-39'
40' +
Per Capita Ownership of Registered Boats
All Population
Persons 18 +
Households
Table 3. Boating-related Businesses Based on NAICS Codes
Category State Total
Boat Building
No. of Businesses
No. of Employees
Total Sales ($ Millions)
Motors & Engines Mfg.
No. of Businesses
No. of Employees
Total Sales ($ Millions)
Accessories & Supplies Mfg.
No. of Businesses
No. of Employees
Total Sales ($ Millions)
Dealers & Wholesalers
No. of Businesses
No. of Employees
Total Sales ($ Millions)
Boating Services
No. of Businesses
No. of Employees
Total Sales ($ Millions)
Completed April 2008 by Recreational Marine Research Center at Michigan State University for the National Marine Manufacturers Association
!
!!
!
!!
!
!
LOUISIANA
MISSISSIPPI
TEXAS
TENNESSEE
MISSOURI
Pine Bluff
Little Rock
Fort Smith Memphis
JacksonFayettevilleTulsa
Jonesboro
± 0 8040
Miles
Cities
US Interstates
!
!
!
!
!
LOUISIANA
MISSISSIPPI
TEXAS
Pine Bluff
Little Rock
Fort SmithMemphis
± 0 2010
Miles
Congressional Districts
Cities!
LOUISIANA
MISSISSIPPI
TEXAS
± 0 2010
Miles
LOUISIANA
MISSISSIPPI
TEXAS
± 0 2010
Miles
20,505
615665,776
32511,180
265,212
184,14851,969
48,397
43,571
799
3,858
169
3,257
315
25,037
25,2261,422
284
78/1000102/1000
196/1000
169,644
148,572
3,724
16,534
814
12,882
1,622
83,447
93,7146,077
910
65/100088/1000
161/1000
1
35$2.2
-
--
3
30$1.6
25
150$43.9
21
116$9.6
13
926$88.8
-
--
12
273$28.1
114
471$120.1
83
275$18.7
Table 1. The Arkansas 4th Congressional District Description
the Arkansas 4th Congressional District
4th CD
4th CD
Cities!
Congressional District
Navigable Waters
Number ofRegistered Boats
10 and under11-5051-150150-400400-1000over 1000
Number ofRegistered BoatsPer 1000 Households
15 and under16 - 7576 - 120121 - 200201 - 400Over 400
Cities
US Interstates
!
Congressional District
Arkansas 4th CD
Arkansas 4th CD
Figure 2. Navigable Waters of the Arkansas 4th Congressional District
Figure 1. Location of the Arkansas 4th Congressional District
Figure 3. Number of Registered Boats by Zipcode within the Arkansas 4th Congressional District
Figure 4. Per Capita (Household) Ownership of Registered Boats by Zipcode withinthe Arkansas 4th Congressional District

Boat Type and Size
Category Power<15’
Power16’ - 24’
Power25’ - 39’
Power40’+
Sail<15’
Sail16’ - 24’
Sail25’ - 39’
Sail40+ Total
Number of boats(Thousands of boats)
Annual craft spending($ per boat per year)
Total craft spending($ Millions)
Total boat days(Thousands of days)
Total trip spending($ per boat per year)
Total trip spending($ Millions)
Total craft & trip spending ($ Millions)
Table 4. Economic Significance of Trip Spending and Annual Craft Spending by Power and Sailboats Registered in the
Trip Spending
Annual Craft Spending Total
Direct Effects
Sales ($ Millions)
Jobs
Labor Income ($ Millions)
Value Added ($ Millions)
Total Effects
Sales ($ Millions)
Jobs
Labor Income ($ Millions)
Value Added ($ Millions)
Table 5. Economic Significance of Power and Sailboats Registered in the
Sector/Spending category
Sales($ Millions) Jobs Labor Income
($Millions)Value Added
($Millions)
Direct Effects
Lodging
Marina Services
Restaurant
Recreation & Entertainment
Repair & Maintenance
Insurance & Credit
Gas Service
Other Retail Trade
Wholesale Trade
Other Local Production of Goods
Total Direct Effects
Secondary Effects
Total Effects
Economic Significance of Boating
Completed April, 2008 by the Recreational Marine Research Center at Michigan State University for the National Marine Manufacturers Association
Table 3. Total Annual Craft Spending (not including purchases of boats) by Power and Sailboat Owners Registered in the
Category Total ($ Millions) Percentage
Slip
Loan Payments
Replacement Motors
Replacement Trailers
Insurance
Repairs
Accessories
Taxes
Total
Table 2. Total Spending on Boat Trips by Power and Sailboat Owners Registered in the Category Total ($ Millions) Percentage
Lodging
Marina services
Restaurant
Groceries
Boat fuel
Auto fuel
Repair & Maintenance
Marine supplies
Recreation & Entertainment
Shopping
Other services
Other goods
Total
$3.3
$6.7
$14.9
$15.1
$19.1
$15.6
--
$3.6
$2.6
-
$2.1
$83.0
4%
8%
18%
18%
23%
19%
--
4%
3%
-
2%
100%
$9.2
$22.2
$1.0
$0.2
$6.5
$13.8
$13.6
$3.0
$69.5
13%
32%
1%
0%
9%
20%
20%
4%
100%
$70.0
728.6
$21.0
$33.7
$187.9
1,550.1
$57.5
$97.1
$43.6
499.8
$16.9
$28.2
$110.3
992.2
$39.0
$65.0
$113.5
1,228.4
$37.9
$61.9
$298.3
2,542.3
$96.5
$162.1
$3.3$15.9
$14.9
$3.6
$13.8$7.9
$7.7
$11.2$7.4
$27.7
$113.5
$184.7$298.3
41.6204.6
296.1
45.7
173.057.5
92.0
208.747.5
61.8
1,228.4
1,313.92,542.3
$1.3$5.6
$5.1
$1.2
$5.1$3.4
$3.7
$5.4$3.2
$3.8
$37.9
$58.6$96.5
$2.4$10.0
$7.2
$2.2
$7.2$7.3
$5.9
$8.8$5.6
$5.3
$61.9
$100.2$162.1
21.7 25.1 1.4 0.3 0.1 0.2 0.1 0.0 48.7
$457.9 $1,655.6 $7,464.6 $25,299.0 $488.7 $1,830.2 $7,439.8 $18,328.8
$9.9 $41.5 $10.1 $7.1 $0.0 $0.3 $0.5 $0.1 $69.5
353.4 627.3 41.7 12.2 1.5 3.3 2.0 0.1 1,041.5
$935.9 $2,148.4 $4,574.4 $8,039.6 $1,009.7 $1,009.7 $1,963.9 $5,204.7
$20.3 $53.8 $6.2 $2.3 $0.1 $0.2 $0.1 $0.0 $83.0
$30.3 $95.3 $16.4 $9.4 $0.1 $0.5 $0.6 $0.1 $152.5
Table 1. Craft and Trip Expenses by Power and Sailboats Registered in the Arkansas 4th Congressional District
Arkansas 4th CD Arkansas 4th CD
Arkansas 4th CDArkansas 4th CD


