- oracle.com · 3 The following is intended to outline our general product direction. It is...
63
1
Transcript of - oracle.com · 3 The following is intended to outline our general product direction. It is...
1
<Insert Picture Here>
Tuning All Layers of the E-Business Suite – Part ILester Gutierrez, Senior Architect, EBS Applications PerformanceDeepak Bhatnagar, Senior Manager, EBS Applications Performance
3
The following is intended to outline our general product direction. It is intended for information purposes only, and may not be incorporated into any contract. It is not a commitment to deliver any material, code, or functionality, and should not be relied upon in making purchasing decisions.
The development, release, and timing of any features or functionality described for Oracle’s products remains at the sole discretion of Oracle.
4
5
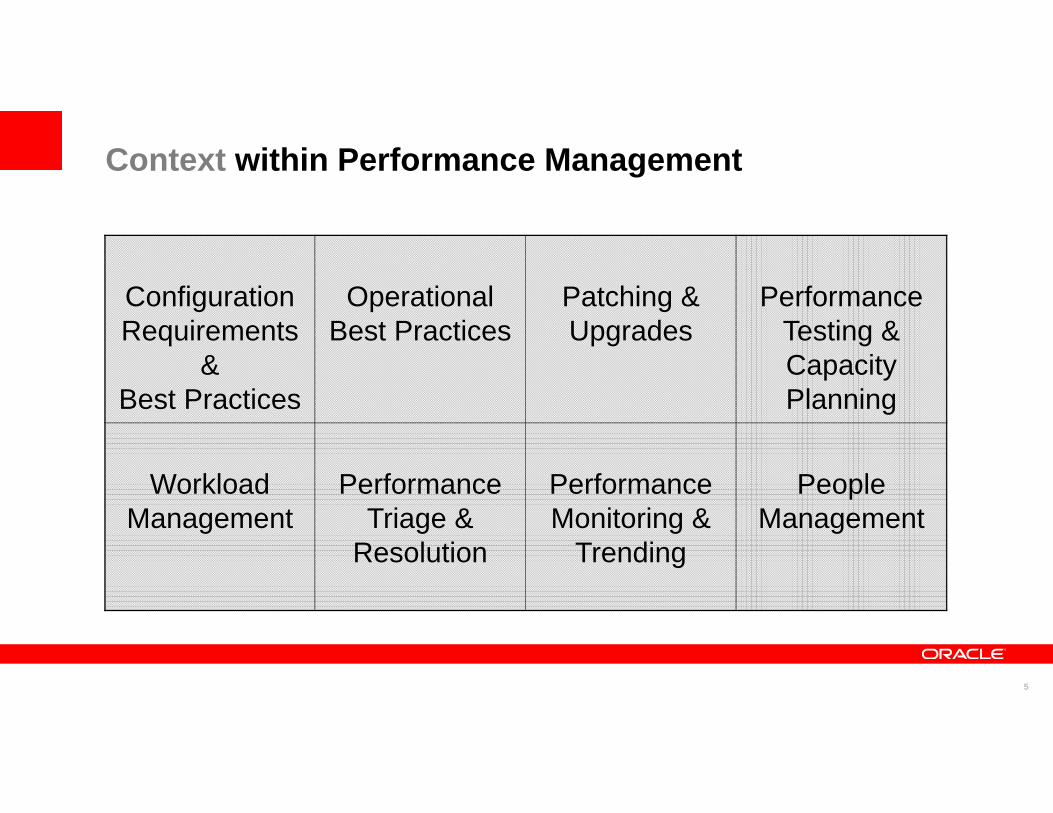
Context within Performance Management
Configuration Requirements
& Best Practices
Operational Best Practices
Patching & Upgrades
Performance Testing & Capacity Planning
Workload Management
Performance Triage &
Resolution
Performance Monitoring &
Trending
People Management
6
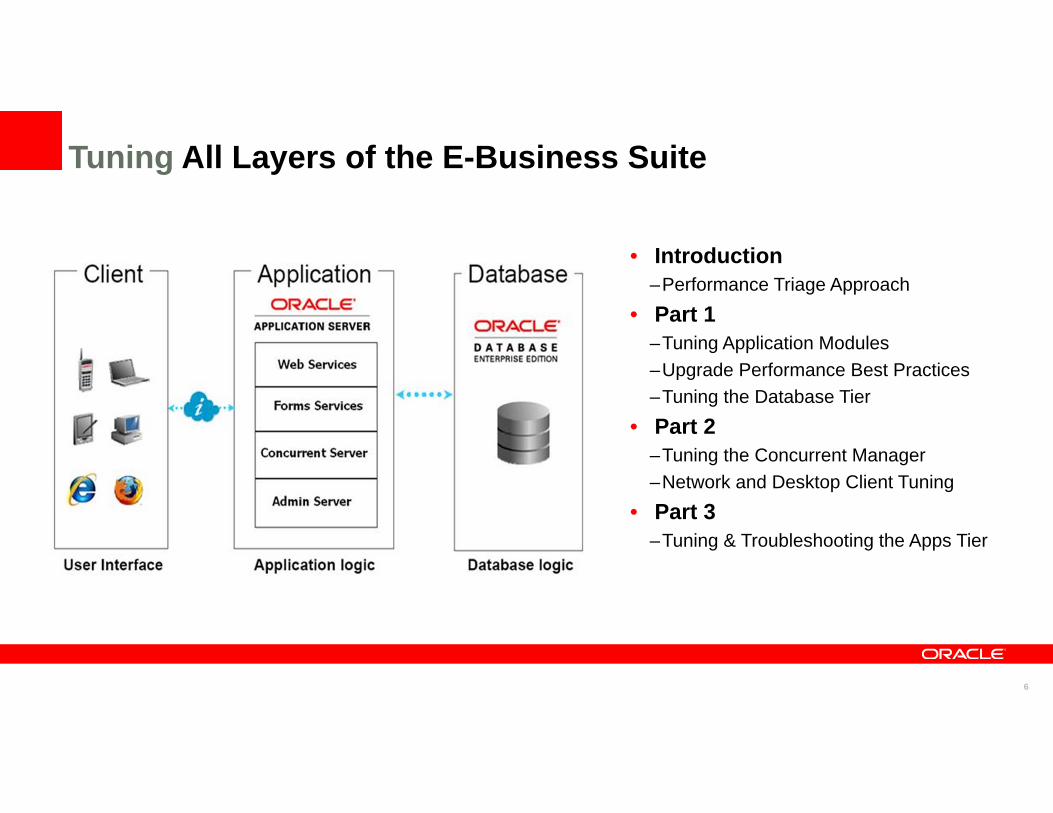
• Introduction–Performance Triage Approach
• Part 1–Tuning Application Modules–Upgrade Performance Best Practices–Tuning the Database Tier
• Part 2–Tuning the Concurrent Manager–Network and Desktop Client Tuning
• Part 3–Tuning & Troubleshooting the Apps Tier
Tuning All Layers of the E-Business Suite
77
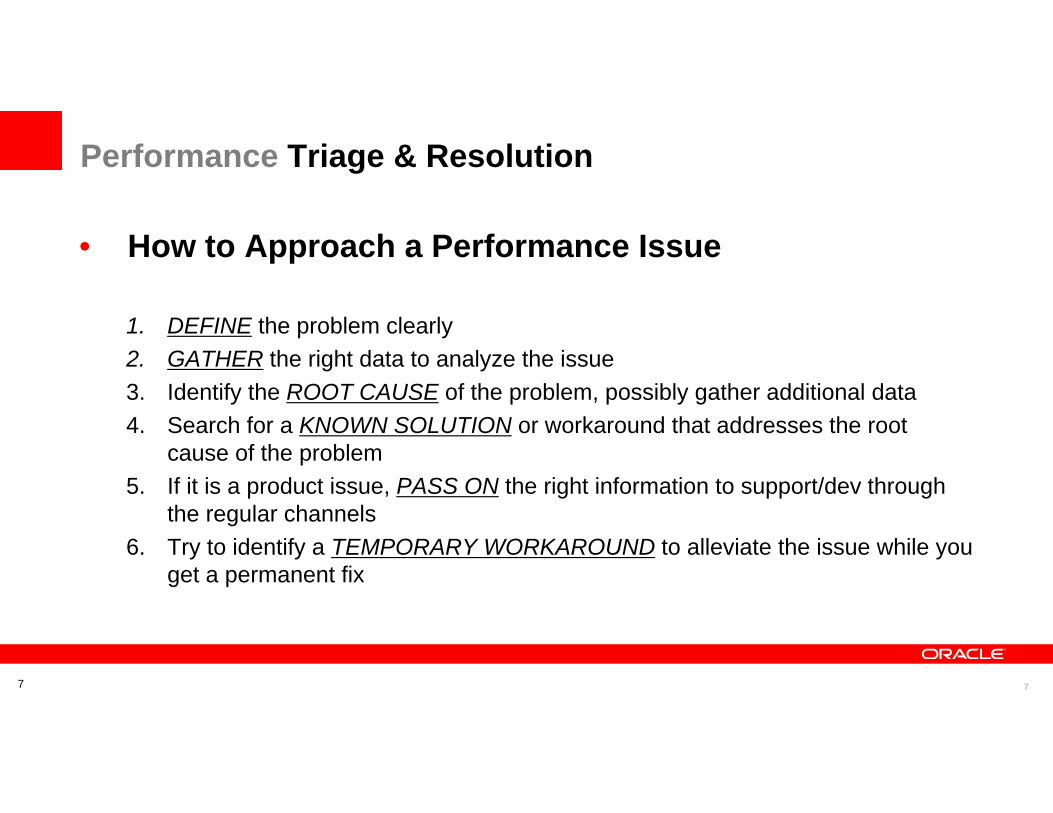
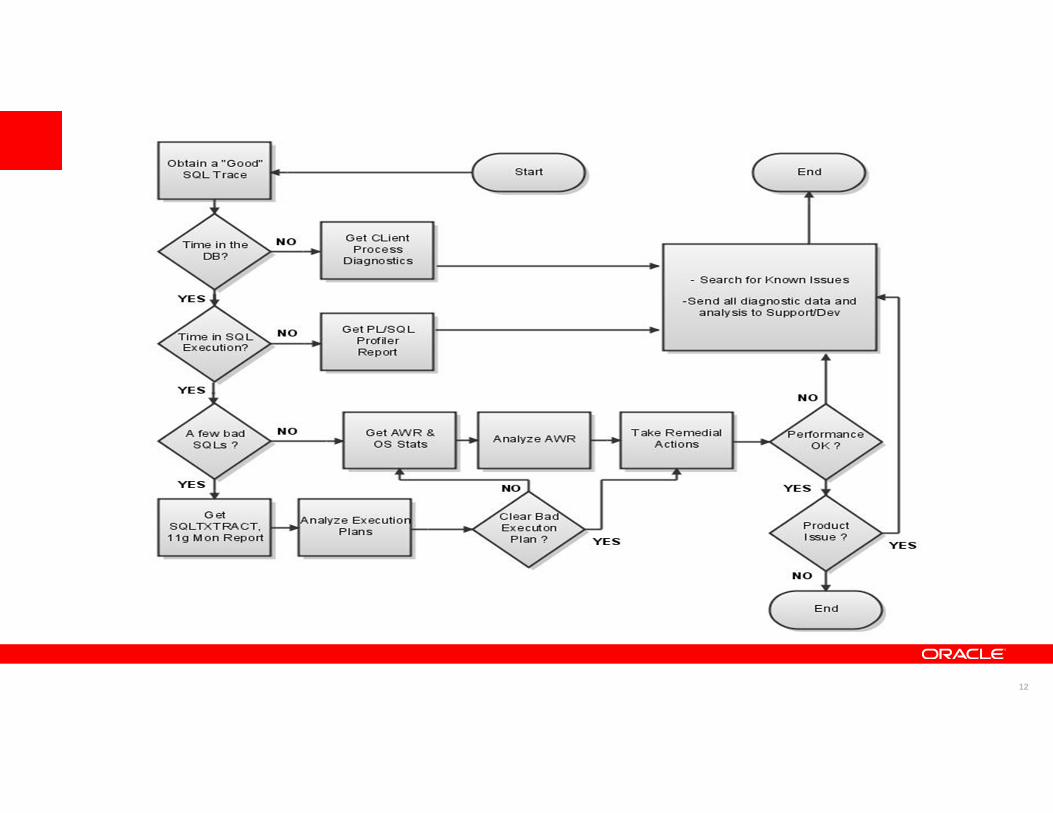
Performance Triage & Resolution
• How to Approach a Performance Issue
1. DEFINE the problem clearly2. GATHER the right data to analyze the issue3. Identify the ROOT CAUSE of the problem, possibly gather additional data4. Search for a KNOWN SOLUTION or workaround that addresses the root
cause of the problem5. If it is a product issue, PASS ON the right information to support/dev through
the regular channels6. Try to identify a TEMPORARY WORKAROUND to alleviate the issue while you
get a permanent fix
88
• Define• Get a clear understanding & quantitative definition of the issue
WhatWhere
WhenWhy
How
Performance Triage & Resolution
99
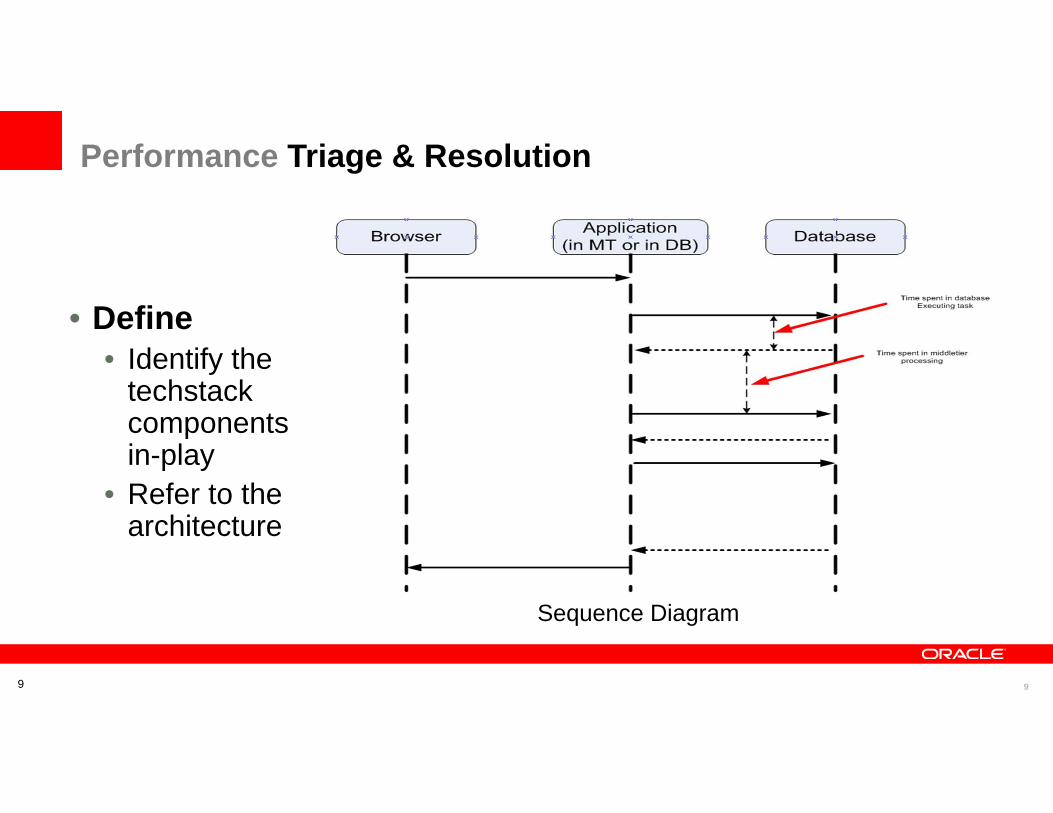
Sequence Diagram
• Define• Identify the
techstack components in-play
• Refer to the architecture
Performance Triage & Resolution
10
• Gather– ~ 80% of issues are DB processing related– If non-database (client side) processing occurs within the
flow, you may see DB wait events like• SQL*Net Message from client• TCP Socket%• PLSQL Lock Timer
– Keep a watchful eye on OS metrics and resource consumption in all 3 tiers
Performance Triage & Resolution
1111
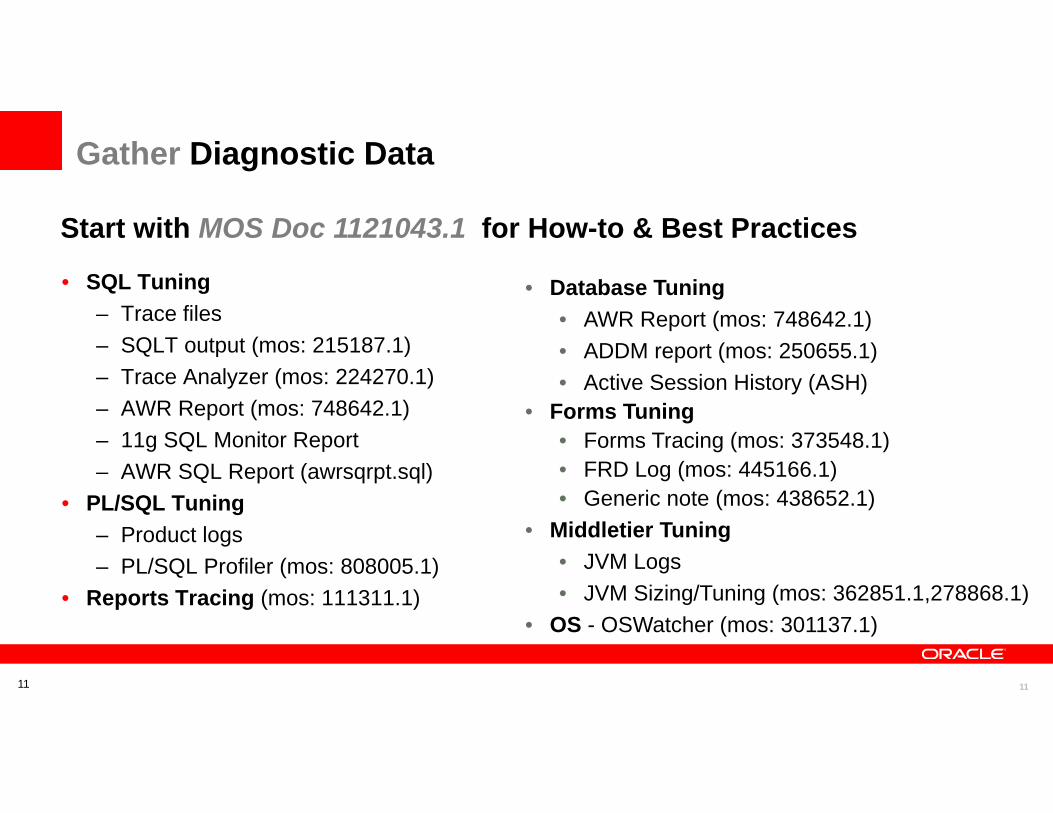
Gather Diagnostic Data
• SQL Tuning– Trace files– SQLT output (mos: 215187.1)– Trace Analyzer (mos: 224270.1)– AWR Report (mos: 748642.1)– 11g SQL Monitor Report – AWR SQL Report (awrsqrpt.sql)
• PL/SQL Tuning– Product logs– PL/SQL Profiler (mos: 808005.1)
• Reports Tracing (mos: 111311.1)
• Database Tuning• AWR Report (mos: 748642.1)• ADDM report (mos: 250655.1)• Active Session History (ASH)
• Forms Tuning• Forms Tracing (mos: 373548.1)• FRD Log (mos: 445166.1)• Generic note (mos: 438652.1)
• Middletier Tuning• JVM Logs• JVM Sizing/Tuning (mos: 362851.1,278868.1)
• OS - OSWatcher (mos: 301137.1)
Start with MOS Doc 1121043.1 for How-to & Best Practices
12
13
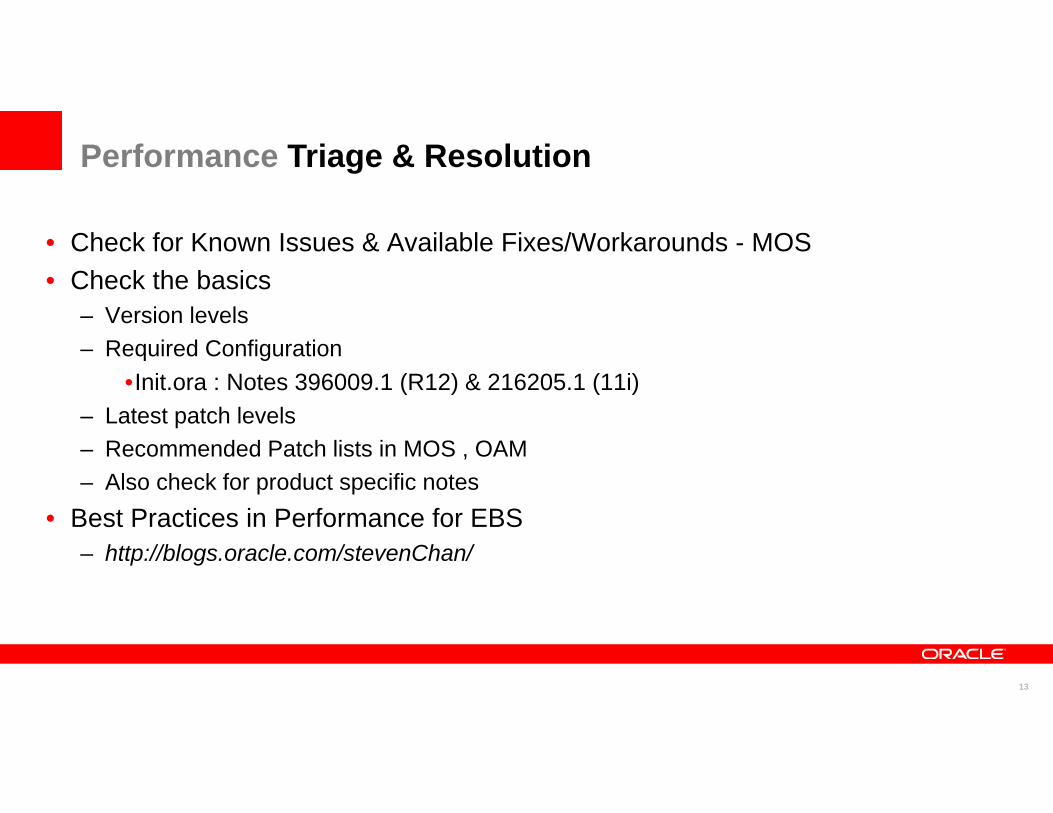
• Check for Known Issues & Available Fixes/Workarounds - MOS• Check the basics
– Version levels– Required Configuration
•Init.ora : Notes 396009.1 (R12) & 216205.1 (11i)– Latest patch levels– Recommended Patch lists in MOS , OAM– Also check for product specific notes
• Best Practices in Performance for EBS– http://blogs.oracle.com/stevenChan/
Performance Triage & Resolution
14
Tuning the Applications
15
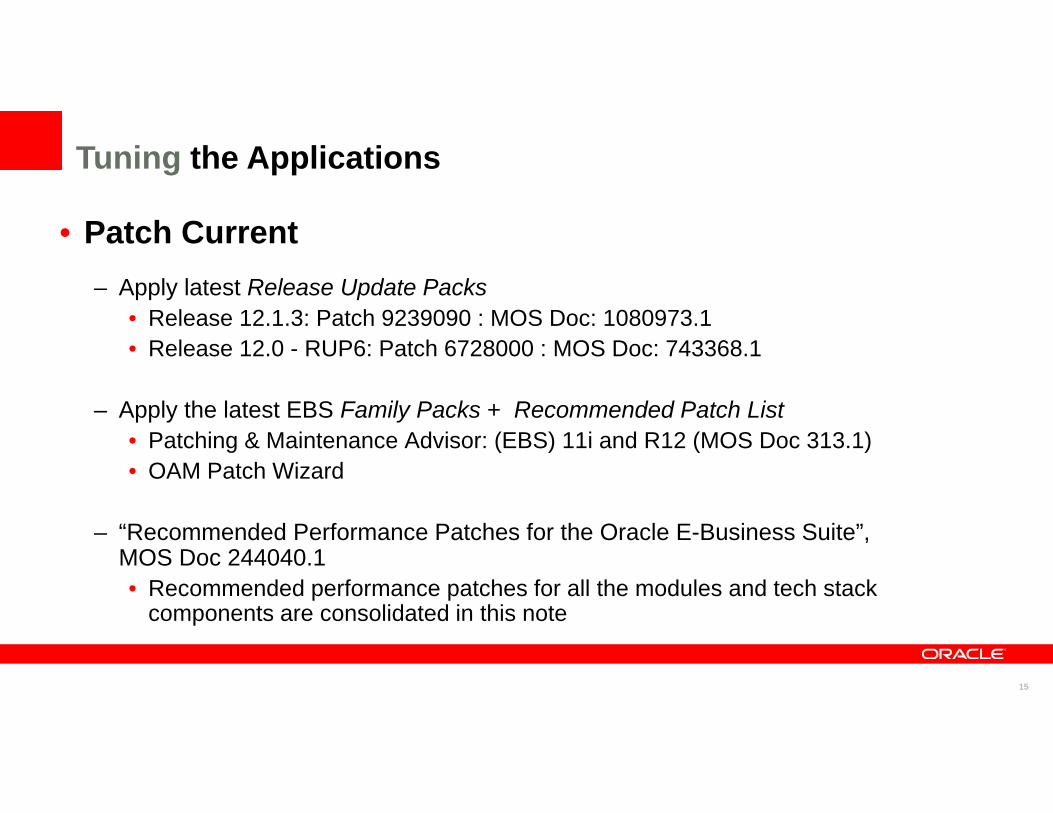
• Patch Current– Apply latest Release Update Packs
• Release 12.1.3: Patch 9239090 : MOS Doc: 1080973.1• Release 12.0 - RUP6: Patch 6728000 : MOS Doc: 743368.1
– Apply the latest EBS Family Packs + Recommended Patch List• Patching & Maintenance Advisor: (EBS) 11i and R12 (MOS Doc 313.1)• OAM Patch Wizard
– “Recommended Performance Patches for the Oracle E-Business Suite”, MOS Doc 244040.1• Recommended performance patches for all the modules and tech stack
components are consolidated in this note
Tuning the Applications
16
• Stay Current
– Upgrade techstack components to the latest certified levelsFor example (as of Aug/2011), for R12 => Database 11.2.0.2, Forms 10.1.2.3, OC4J 10.1.3.5, JDK 6, etc• http://blogs.oracle.com/stevenChan/resource/certifications.html
Tuning the Applications
17
• Performance Best Practices – Purge & Archive
• Implement a regular purge process including transient data as well as obsolete transactional data
• Purge old data before performing upgrades• Many documented standard programs available
– ~260 purge programs in R12• Purge Portal
– Purge programs can be configured, initiated and monitored• Set the execution frequency as well view history of purge
programs– R12: programs tagged with the “Purge” program type
Tuning the Applications
18
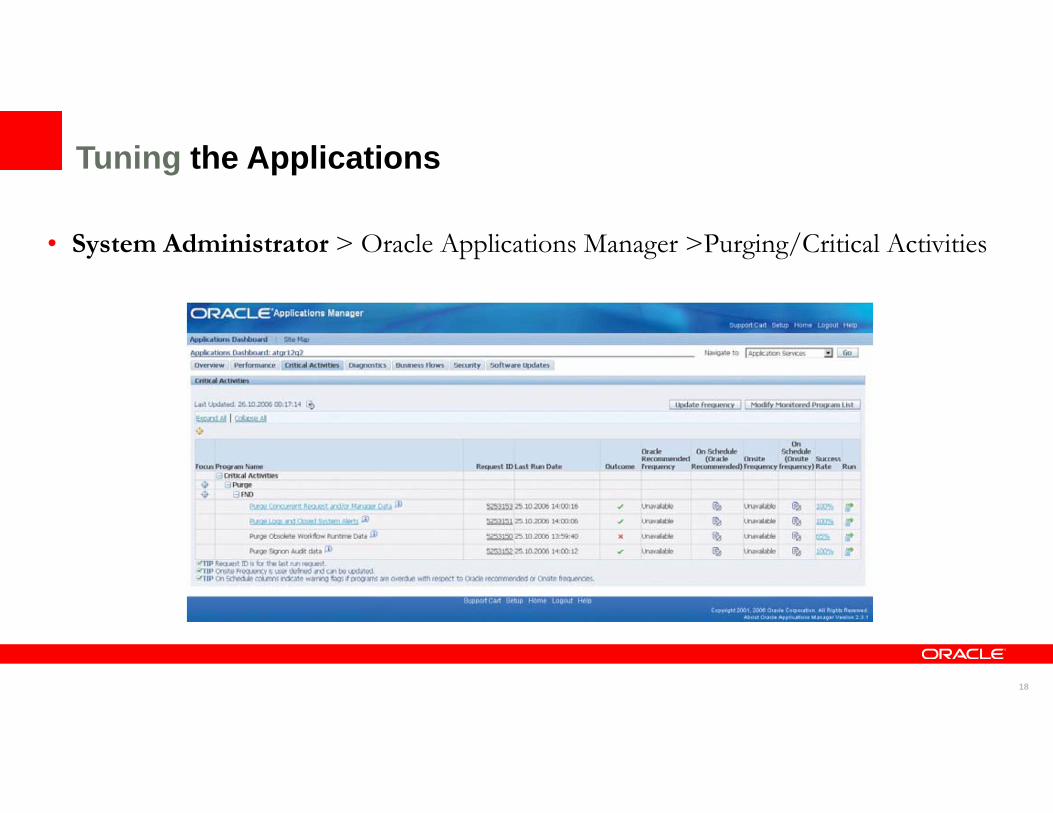
• System Administrator > Oracle Applications Manager >Purging/Critical Activities
Tuning the Applications
19
• Performance Best Practices– Logging• FND: Debug Log Enabled - Set it to ‘Yes’ (12.0 RUP3+, 12.1.x)
• FND: Debug Log Level - Set to Unexpected (Level=6)• Query FND_LOG_MESSAGES to check the logging traffic• With above profile configuration
– If the query shows a large number of rows being created, there could be exceptions and errors which need to be investigated
Tuning the Applications
20
Tuning the Applications
• Performance Best Practices– Workflow
• For background engines via Concurrent Manager, set the ‘Process Stuck’ parameter to ‘No’
– Identification of stuck workflows is resource intensive– Start a separate background engine to handle stuck/timed out
processes with a low frequency –i.e. once a day• Use deferred activities to improve online response times for flows
such as Scheduling, PO Document Approval, etc.• Purge runtime data (Conc Program: FNDWFPR)
– Can run by ITEM_TYPE– Monitor/Troubleshoot old workflows not properly closed– Purge frequently

21
Tuning the Applications
• Performance Best Practices– Workflow
• Run $FND_TOP/sql/wffngen.sql to translate the activity function calls into static calls
– Edit & add heavily used ITEM_TYPESitemtypeList_t (‘WFSTD’,’FNDFFWF’)
– Generates wffncal2b.pls in utl_file_dir to re-create pkg• Disable retention on Workflow Queues
– DBMS_AQADM.ALTER_QUEUE(queue_name=>:b1,retention_time=>0);
• Partition runtime tables for higher scalability – MOS Doc: 260884.1• For high volume batch processing in RAC use ITEM_TYPE to Node
affinity
22
• Performance Best Practices– Order Management
• R12 OM Performance Fixes & Configuration Options to speed up processing: MOS Docs 849060.1 & 130511.1
• Use streamlined workflows– Consider seeded workflow: “Line Flow Generic: Performance”– Removes unnecessary activities and sub-processes, reducing WF data significantly
• Use Deferred tax & credit check• For online booking speed, consider deferring scheduling –MOS Doc 421314.1• Configurator should be setup to use a separate pool of JVMs
Tuning the Applications
23
• Performance Best Practices– Order Management
• For online order entry, use the Quick Sales Order Form - OEXOETEL• Disable Debugging
–OM: Debug Level, set to 0 for OFF–QP: Debug Mode, set to Request Viewer Off–WSH: Debug Enabled, set to No–WSH: Debug Level, set to 0 for OFF
• Set “MRP: Calculate Supply Demand” to No–Only enable for a user session if detailed supply / demand data needs to be reviewed in an ATP Inquiry
Tuning the Applications
24
• Performance Best Practices– Financials• Account Analysis & Journal Entries Report – MOS Doc 983063.1– Troubleshoot & Tune XML generation – BI Publisher– Recommended Performance Fixes– Debug, Scalable Flags and Memory setting recommendations –OOM Issues
• Subledger Accounting & Accounting Hub - MOS Doc 791049.1– Recommended Performance Fixes– Custom Indexing guidelines– Optimize # of Processors, Processing Unit Size & Event Class ordering– Payables specific fixes in MOS Doc 1271365.1
Tuning the Applications
25
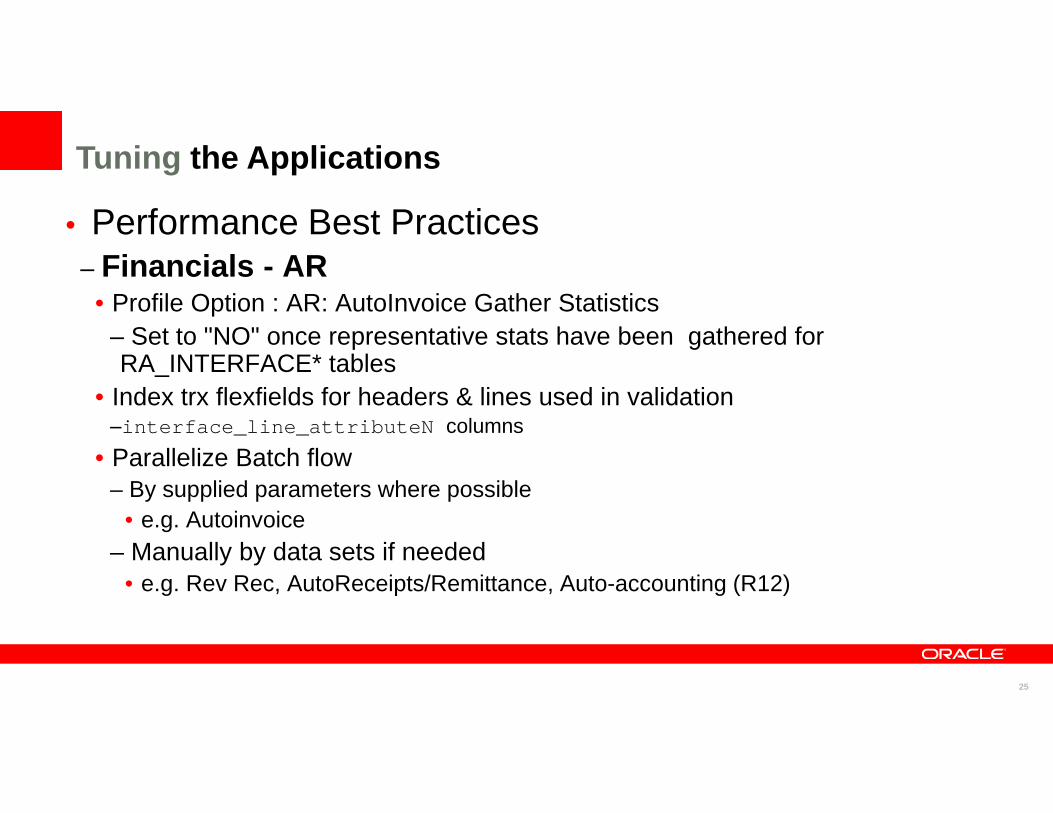
• Performance Best Practices– Financials - AR
• Profile Option : AR: AutoInvoice Gather Statistics – Set to "NO" once representative stats have been gathered for RA_INTERFACE* tables
• Index trx flexfields for headers & lines used in validation–interface_line_attributeN columns
• Parallelize Batch flow– By supplied parameters where possible
• e.g. Autoinvoice– Manually by data sets if needed
• e.g. Rev Rec, AutoReceipts/Remittance, Auto-accounting (R12)
Tuning the Applications
26
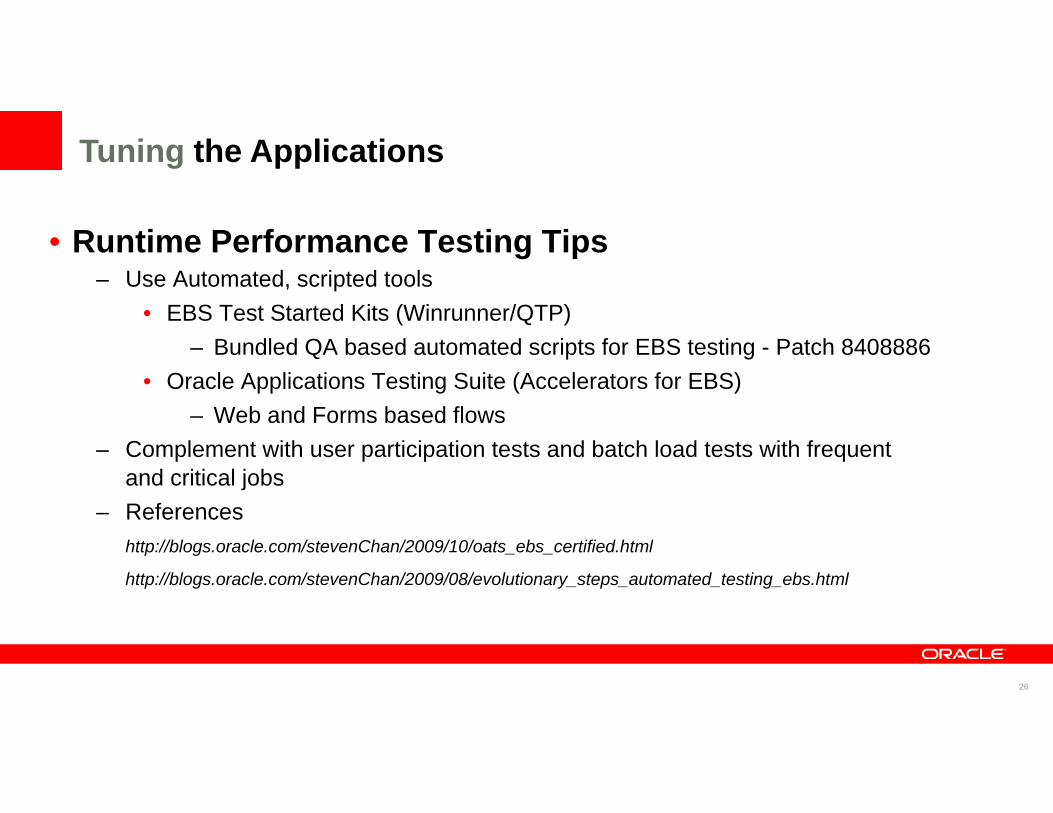
• Runtime Performance Testing Tips– Use Automated, scripted tools
• EBS Test Started Kits (Winrunner/QTP)– Bundled QA based automated scripts for EBS testing - Patch 8408886
• Oracle Applications Testing Suite (Accelerators for EBS) – Web and Forms based flows
– Complement with user participation tests and batch load tests with frequent and critical jobs
– Referenceshttp://blogs.oracle.com/stevenChan/2009/10/oats_ebs_certified.html
http://blogs.oracle.com/stevenChan/2009/08/evolutionary_steps_automated_testing_ebs.html
Tuning the Applications

27
Upgrade Performance Best Practices
28
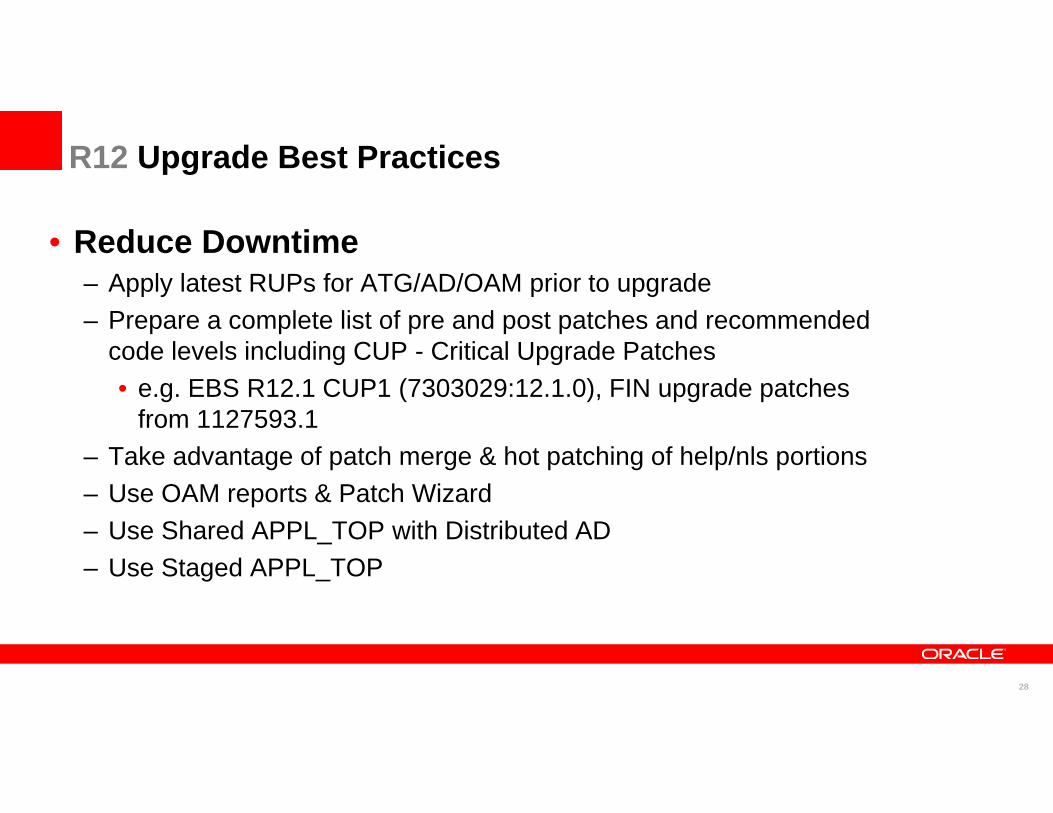
• Reduce Downtime– Apply latest RUPs for ATG/AD/OAM prior to upgrade– Prepare a complete list of pre and post patches and recommended
code levels including CUP - Critical Upgrade Patches• e.g. EBS R12.1 CUP1 (7303029:12.1.0), FIN upgrade patches
from 1127593.1 – Take advantage of patch merge & hot patching of help/nls portions– Use OAM reports & Patch Wizard– Use Shared APPL_TOP with Distributed AD– Use Staged APPL_TOP
R12 Upgrade Best Practices

29
• Reduce Downtime– Plan and execute pre-upgrade activities in separate windows
• Migrate to OATM• DB Upgrade• Steps described in "Downtime reduction" and “Upgrade By
Request” appendices E and G of the R12.1 upgrade guide• Other H/W and OS planned changes
– Purge Data aggressively and re-gather Statistics close to start of actual upgrade downtime
R12 Upgrade Best Practices
30
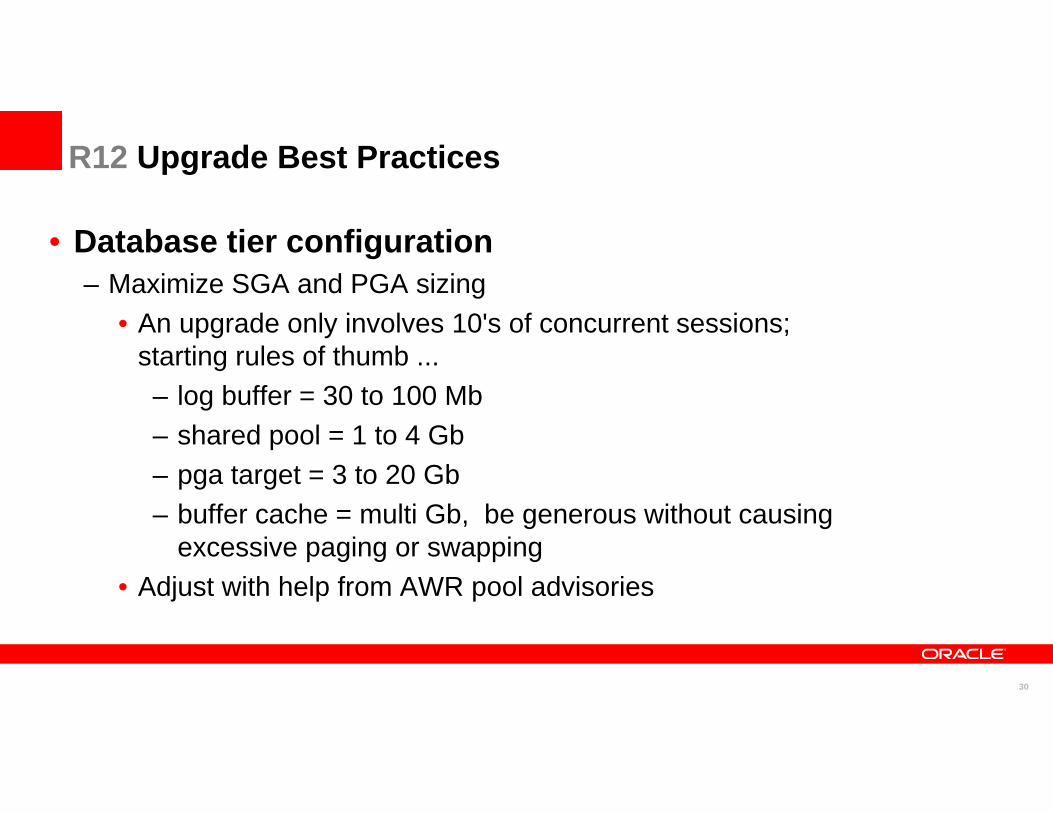
• Database tier configuration– Maximize SGA and PGA sizing
• An upgrade only involves 10's of concurrent sessions; starting rules of thumb ...– log buffer = 30 to 100 Mb– shared pool = 1 to 4 Gb– pga target = 3 to 20 Gb– buffer cache = multi Gb, be generous without causing
excessive paging or swapping• Adjust with help from AWR pool advisories
R12 Upgrade Best Practices

31
• Database tier configuration– Other upgrade specific init.ora changes
• If specified, remove db_file_multiblock_read_count – Maximize multiblock I/O sizes
• Set job_queue_processes = # of CPUS– adobjcmp.sql (Phases : plb+90 and last+63)
• Set parallel_max_servers = 2 X CPUs– Helps with large index creation, stats gathering and some
large upg+ phase jobs– Need to test with production-like DB server and I/O subsystem– Shutdown other RAC instances
R12 Upgrade Best Practices
32
• Batch size and #workers– Batch size
• 10K is suitable for most installs, you can test other values from 1K up to 100K if time allows
– # Workers• Starting rule-of-thumb is between 1 and 1.5 x #CPUs
– It is critical to do multiple rounds of testing, adjusting above settings to maximize server utilization, but constrained by factors such as
• Memory utilization (no swapping/ excessive paging)• CPU utilization (scale down if at 100%)• I/O response times (scale down if averages > 20 ms)
R12 Upgrade Best Practices
33
• Performance testing, monitoring and additional optimizations...
– Analyze long runners via timing report, ad_task_timing analysis – Mine ad_task_timing to identify low worker utilization due to
phasing waits and review responsible culprits– Review targeted AWR Instance and SQL reports
– awrrpt.sql and awrsqrpt.sql– Use My Oracle Support to check for known issues and
workarounds for the longest running jobs
R12 Upgrade Best Practices
34
Tuning the Database
35
Tuning the Database Tier – Configuration
• Ensure mandatory init.ora parameters are set correctly– MOS Docs 396009.1 & 216205.1 (R12 & 11i respectively)– Use AWR advisories to optimize SGA/PGA sizing
• Required Patches & Fixes/Workarounds for Known Issues– Recommended Performance Patches -MOS Doc 244040.1– Required Patching – Interoperability Notes
•11gR1 Certified with 11i and R12 – MOS Docs 452783.1 & 735276.1•11gR2 Certified with 11i – MOS Doc 881505.1•10gR2 Uptake patch bundle 8362683, MOS Doc 791049.1
36
Tuning the Database Tier – Configuration
• Use key Database features– Auto Memory Management
• Exception – Linux HugePages – MOS Doc 744769.1– System Managed Undo– Auto Segment Space Management– PL/SQL Native Compilation
• Convert to the OATM Tablespace Model– Consolidates # of Apps tablespaces from 400 to ~12
• MOS Doc 248857.1 – Best practices: LMT, ASSM, groups objects by size/type/access pattern– Migration utility can be used to migrate a schema at a time– Use AUTOALLOCATE extent sizes
37
Tuning the Database Tier – Disk IO
• I/O Optimization– Configure & verify direct IO is used if using file system datafiles
• Improves performance/scalability by simulating raw devices, avoiding file system cache traffic
– Ensure your IO subsystem can handle your peak IO load & IOPS • RAID, S.A.M.E. configs with sufficient spindles • Measure with ORION tool or in 11g
DBMS_RESOURCE_MANAGER.CALIBRATE_IO – MOS Doc 727062.1
– Reduce the IO workload• Tune expensive SQL• Trim the workload of unnecessary tasks• Do 3X less IO on average with 11g Advanced Compression Option
38
Tuning the Database Tier – Statistics Gathering• Use only FND_STATS or the Gather Schema / Table Statistics Concurrent
Programs– Rule-based optimizer (RBO) is no longer supported.– Do NOT USE the analyze or dbms_stats command directly. It is not supported, and
can result in sub-optimal plans– Gather Schema Statistics concurrent program is used fnd_stats does the
bookkeeping for the run. – We also recommend FND_STATS because of its support for histograms.
• Use the GATHER_AUTO option to gather incrementally
• Analyze all schemas at 10%, then specific objects at x%– Due to data skew, some tables benefit from higher sampling %– For 11g, can use value of zero (AUTO_SAMPLE_SIZE)
39
Tuning the Database Tier – Statistics Gathering
• Disable the 10g/11g automatic job to gather stats
• Consider locking stats for very volatile tables once a representative set is gathered– Some Interface tables– Other examples: ap_selected_invoices, wsh_pr_workers– Use FND_STATS.LOAD_XCLUD_TAB to skip the table
• Histograms can be seeded by calling to fnd_stats.load_histogram_cols.
• Do not gather statistics excessively on entire schemas or the entire database such as nightly or weekly
40
Tuning the Database Tier – Statistics Gathering
• FND_STATS now supports Database 11g Extended Stats. The Multi-Column Statistics statistics are used by Oracle to estimate the combined selectivity of the predicates.
• Multi-Column Stats can be seeded by calling FND_STATS.LOAD_EXTNSTATS_COLS. FND_STATS Schema/Table stats will take care of the gathering stats on Multi-Column stats.
• 11g Extended Stats FND_STATS Patch 9470196. Also, in patch set 9962815.
41
Tuning the Database Tier – Performance Management
• Establish baselines for different workloads–Use AWR baselines & diff reports•DBMS_WORKLOAD_REPOSITORY or Enterprise Manager•OS metrics with tools such as OS Watcher – MOS Doc 301137.1
–Timings/Traces for critical flows & concurrent programs
• Use 11g’s SQL Performance Analyzer (SPA) & SQL Plan Management features (SPM)–Change management performance impact–Stabilize execution plans as needed & quickly restore “good” plans while analysis and permanent solutions are found
42
Tuning the Database Tier - AWR
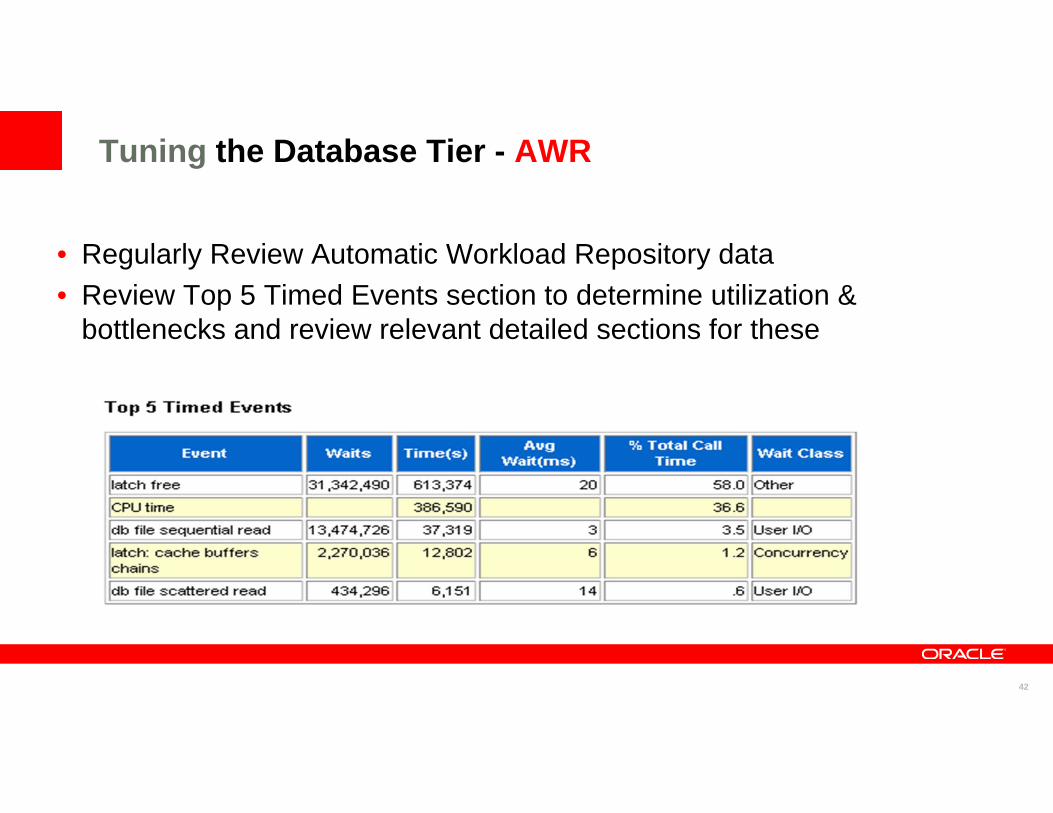
• Regularly Review Automatic Workload Repository data • Review Top 5 Timed Events section to determine utilization &
bottlenecks and review relevant detailed sections for these
43
Tuning the Database Tier - AWR
• For latch related waits– Often due to non-sharable SQL, sub-optimal SQL which performs full table
or full index scans, dynamic object creation/removal, etc.– Review the latch Statistics section to determine the hot latches– Trace some waiter and holder sessions to determine actual cause
• For I/O related waits– Review SQL sections by Logical/Physical reads and the Segment Statistics
sections by I/O
• For enqueue related or buffer busy waits– Review the following sections: enqueue, segment statistics by buffer busy
waits, row lock & ITL waits
44
Tuning the Database Tier - AWR
• Link AWR with ASH data– Map sessions & SQL to main bottlenecks – Query Active Session History (ASH) data – Enable tracing for a few of the sessions with heavy waits determine the actual
cause and SQL statements.– Review the Advisory sections in AWR to fine tune SGA & PGA– Correlate top SQL in AWR to business flows– Produce and review SQL AWR reports for top SQLs (awrsqrpt.sql)– Monitor OS Stats (included in 11g AWR)
• CPU and Memory Utilization & Paging, I/O statistics & response times

45
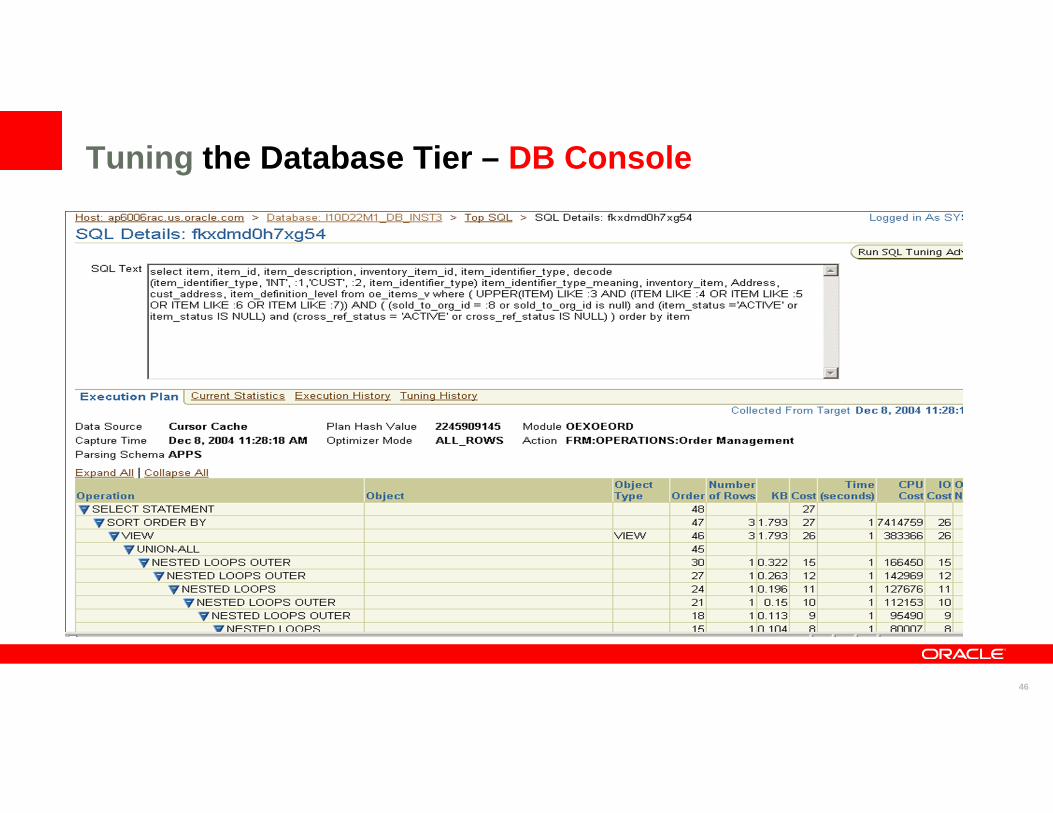
Tuning the Database Tier – DB Console
46
Tuning the Database Tier – DB Console
47
• If bottleneck is IO related...(db file sequential read, db file scattered read, log file sync, free buffer waits, etc...)– Tune Top SQL is always the first step– Maximize Memory availability, allocate generously to buffer cache, review
AWR advisories & monitor swapping & paging– Use ASM or alternatively use the SAME methodology for db files– IO Sub-system:
• RAID 10 still preferred most often for high end requirements Ideal avg. response times of < 10ms.
– Check for excessive/redundant indexing – Configure async IO, use quick IO technologies
Tuning the Database Tier –Common corrective actions to maximize scalability
48
• If the bottleneck is concurrency related(enq%, latch%, buffer busy%, etc )
– Use global hash-partitioned indexes for hot leaf blocks - Identify via AWR "Top logical IOs by Segment"
– Some of these waits are commonly caused by bad SQL execution plans– i.e. :latch: cache buffer chains, %buffer busy waits, read by other session
– Make sure to use ASSM and OATM tablespace model.– Increase INITRANS to alleviate ITL contention– Increase sequence caches– Work with support/consulting to evaluate if table/index partitioning will help – If the program allows, more frequent commits (batch size) can help by reducing the
CR (consistent read) work required
Tuning the Database Tier –Common corrective actions to maximize scalability
49
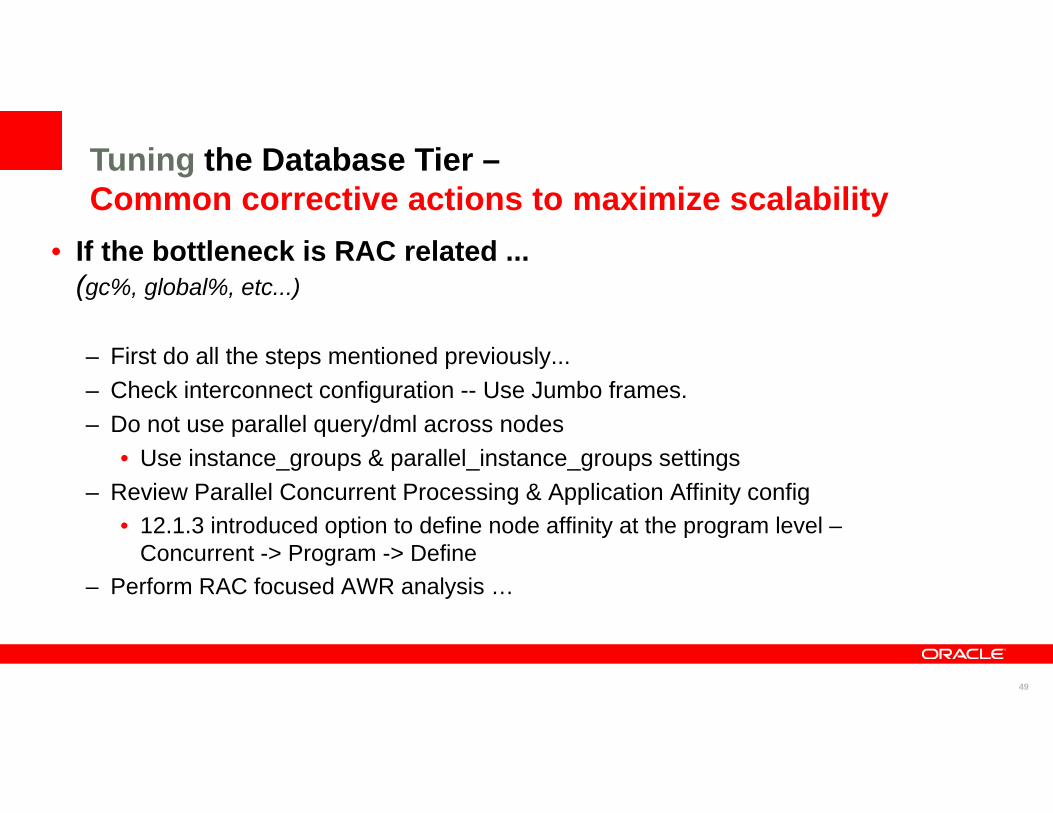
• If the bottleneck is RAC related ... (gc%, global%, etc...)
– First do all the steps mentioned previously...– Check interconnect configuration -- Use Jumbo frames.– Do not use parallel query/dml across nodes
• Use instance_groups & parallel_instance_groups settings– Review Parallel Concurrent Processing & Application Affinity config
• 12.1.3 introduced option to define node affinity at the program level –Concurrent -> Program -> Define
– Perform RAC focused AWR analysis …
Tuning the Database Tier –Common corrective actions to maximize scalability
50
Tuning the Database Tier –Common corrective actions to maximize scalability
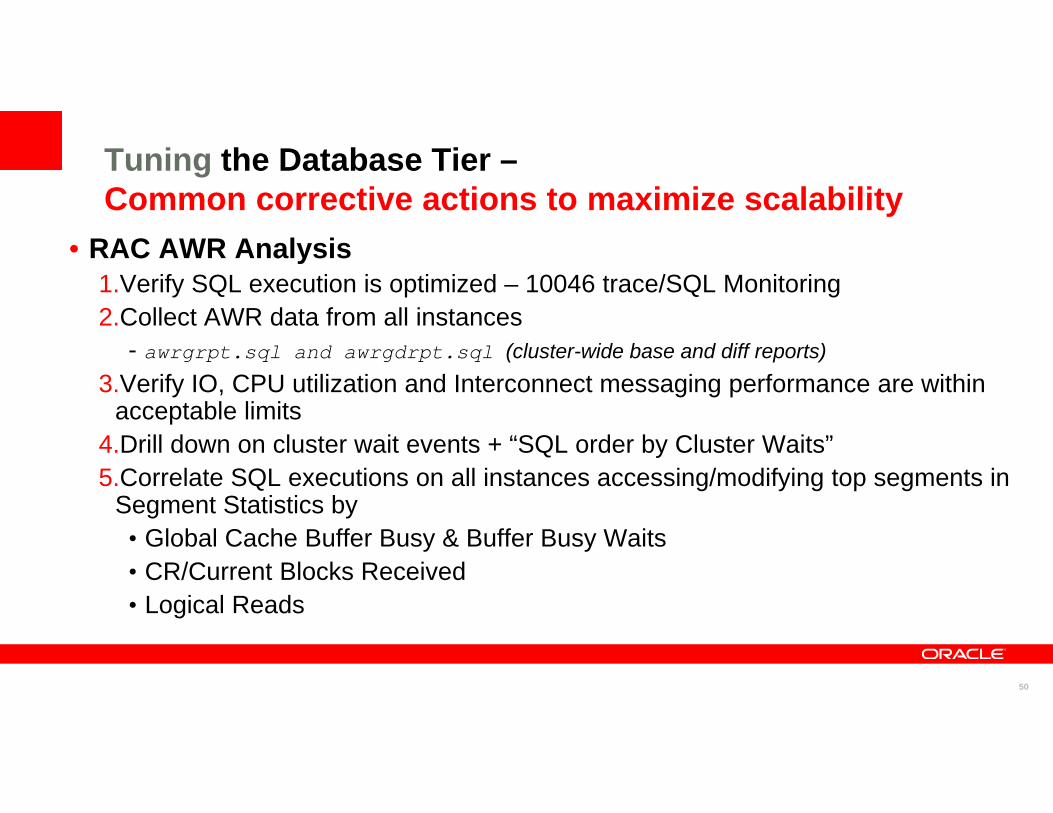
• RAC AWR Analysis1.Verify SQL execution is optimized – 10046 trace/SQL Monitoring2.Collect AWR data from all instances
- awrgrpt.sql and awrgdrpt.sql (cluster-wide base and diff reports)3.Verify IO, CPU utilization and Interconnect messaging performance are within
acceptable limits4.Drill down on cluster wait events + “SQL order by Cluster Waits”5.Correlate SQL executions on all instances accessing/modifying top segments in
Segment Statistics by• Global Cache Buffer Busy & Buffer Busy Waits• CR/Current Blocks Received • Logical Reads
51
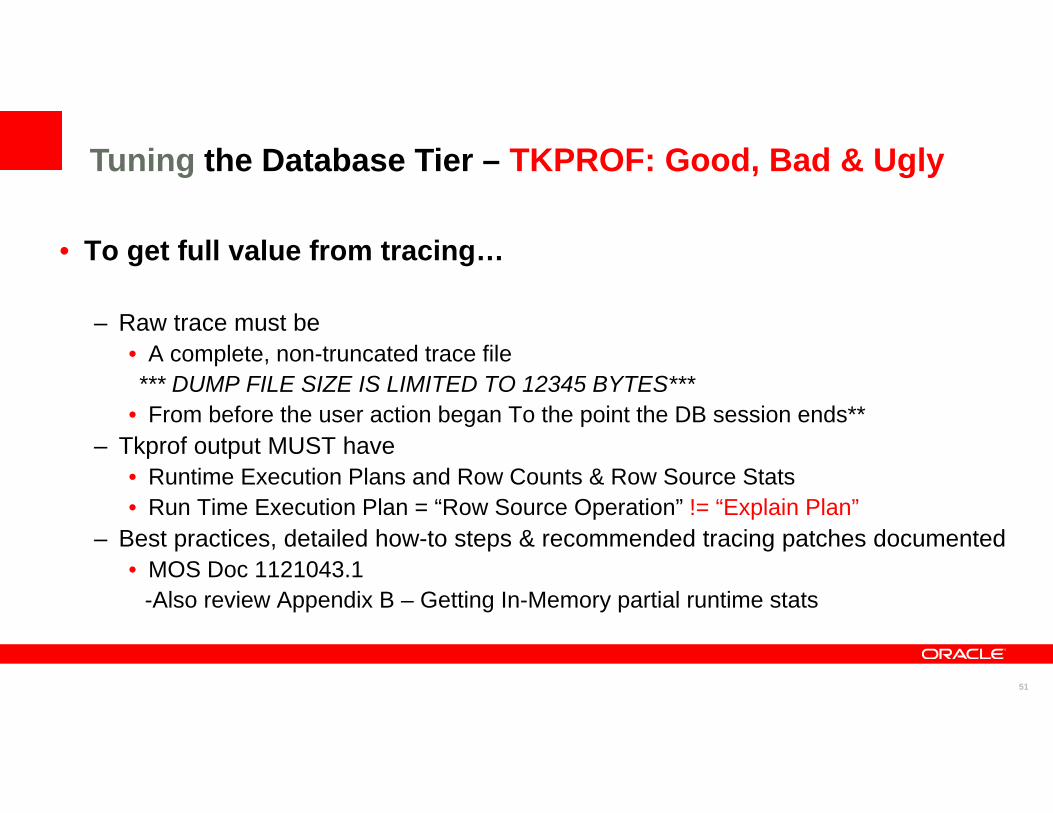
• To get full value from tracing…
– Raw trace must be• A complete, non-truncated trace file*** DUMP FILE SIZE IS LIMITED TO 12345 BYTES***
• From before the user action began To the point the DB session ends**– Tkprof output MUST have
• Runtime Execution Plans and Row Counts & Row Source Stats• Run Time Execution Plan = “Row Source Operation” != “Explain Plan”
– Best practices, detailed how-to steps & recommended tracing patches documented• MOS Doc 1121043.1
-Also review Appendix B – Getting In-Memory partial runtime stats
Tuning the Database Tier – TKPROF: Good, Bad & Ugly
52
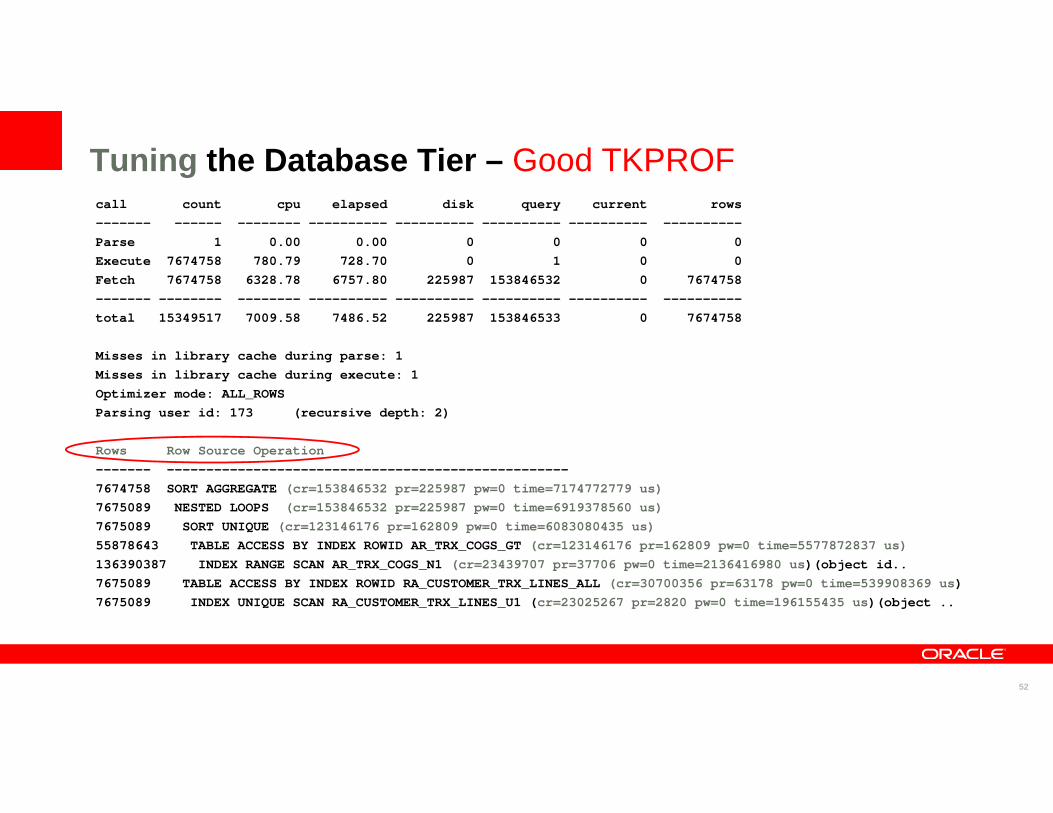
Tuning the Database Tier – Good TKPROFcall count cpu elapsed disk query current rows------- ------ -------- ---------- ---------- ---------- ---------- ----------Parse 1 0.00 0.00 0 0 0 0Execute 7674758 780.79 728.70 0 1 0 0Fetch 7674758 6328.78 6757.80 225987 153846532 0 7674758------- -------- -------- ---------- ---------- ---------- ---------- ----------total 15349517 7009.58 7486.52 225987 153846533 0 7674758
Misses in library cache during parse: 1Misses in library cache during execute: 1Optimizer mode: ALL_ROWSParsing user id: 173 (recursive depth: 2)
Rows Row Source Operation------- ---------------------------------------------------7674758 SORT AGGREGATE (cr=153846532 pr=225987 pw=0 time=7174772779 us)7675089 NESTED LOOPS (cr=153846532 pr=225987 pw=0 time=6919378560 us)7675089 SORT UNIQUE (cr=123146176 pr=162809 pw=0 time=6083080435 us)55878643 TABLE ACCESS BY INDEX ROWID AR_TRX_COGS_GT (cr=123146176 pr=162809 pw=0 time=5577872837 us)136390387 INDEX RANGE SCAN AR_TRX_COGS_N1 (cr=23439707 pr=37706 pw=0 time=2136416980 us)(object id.. 7675089 TABLE ACCESS BY INDEX ROWID RA_CUSTOMER_TRX_LINES_ALL (cr=30700356 pr=63178 pw=0 time=539908369 us)7675089 INDEX UNIQUE SCAN RA_CUSTOMER_TRX_LINES_U1 (cr=23025267 pr=2820 pw=0 time=196155435 us)(object ..
53
Tuning the Database Tier
• Why upgrade EBS to
– Internal tests show 10-20% improvement in EBS batch & reporting workloads– Significant RAC Performance improvements– Oracle internal’s production EBS system on 11gR1;
•11gR2 scheduled for the summer– Lower cost with Advanced compression, better/automated diagnostics,
lower-risk upgrade with SPM/RAT/SPA …– Best Practices/Tips white papers
•twp_upgrading_10g_to_11g_what_to_expect_from_optimizer.pdf •http://www.oracle.com/us/solutions/benchmark/apps-benchmark/
54
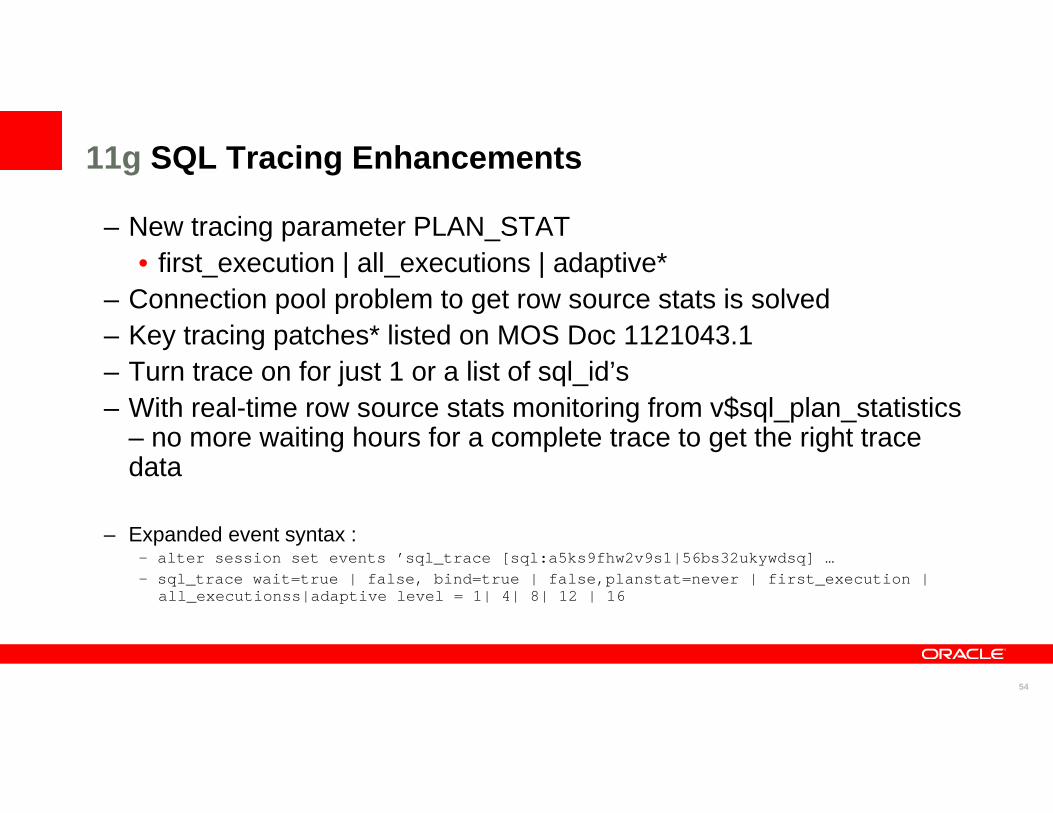
11g SQL Tracing Enhancements
– New tracing parameter PLAN_STAT • first_execution | all_executions | adaptive*
– Connection pool problem to get row source stats is solved– Key tracing patches* listed on MOS Doc 1121043.1– Turn trace on for just 1 or a list of sql_id’s– With real-time row source stats monitoring from v$sql_plan_statistics
– no more waiting hours for a complete trace to get the right trace data
– Expanded event syntax :- alter session set events ’sql_trace [sql:a5ks9fhw2v9s1|56bs32ukywdsq] … - sql_trace wait=true | false, bind=true | false,planstat=never | first_execution |
all_executionss|adaptive level = 1| 4| 8| 12 | 16

55
11g Automatic SQL Monitoring & Tuning
56
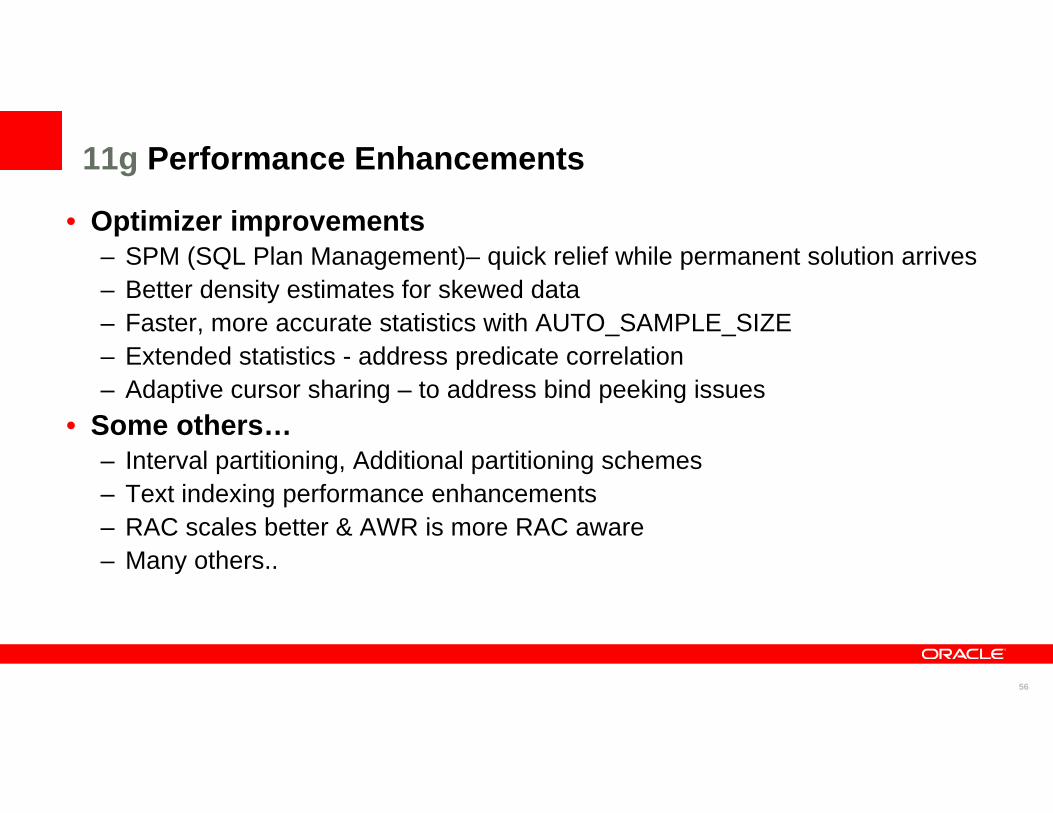
11g Performance Enhancements
• Optimizer improvements– SPM (SQL Plan Management)– quick relief while permanent solution arrives– Better density estimates for skewed data– Faster, more accurate statistics with AUTO_SAMPLE_SIZE– Extended statistics - address predicate correlation– Adaptive cursor sharing – to address bind peeking issues
• Some others…– Interval partitioning, Additional partitioning schemes– Text indexing performance enhancements– RAC scales better & AWR is more RAC aware– Many others..
57
References
58
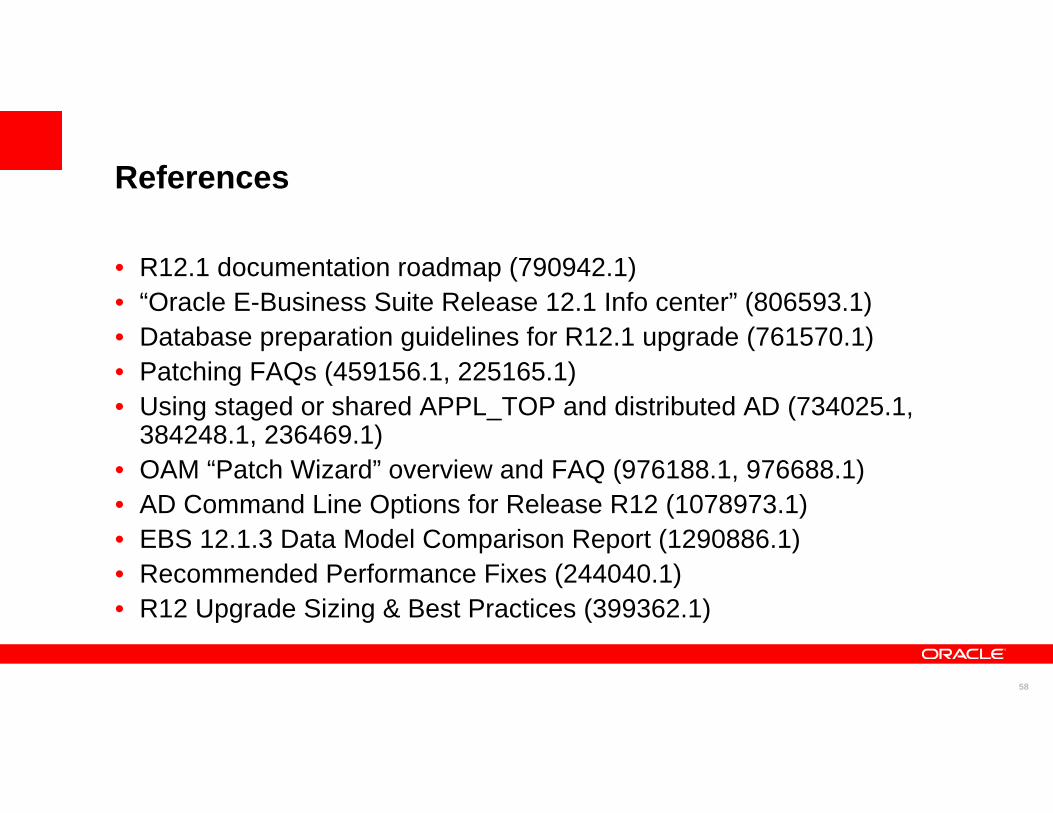
References
• R12.1 documentation roadmap (790942.1)• “Oracle E-Business Suite Release 12.1 Info center” (806593.1)• Database preparation guidelines for R12.1 upgrade (761570.1)• Patching FAQs (459156.1, 225165.1)• Using staged or shared APPL_TOP and distributed AD (734025.1,
384248.1, 236469.1)• OAM “Patch Wizard” overview and FAQ (976188.1, 976688.1)• AD Command Line Options for Release R12 (1078973.1)• EBS 12.1.3 Data Model Comparison Report (1290886.1)• Recommended Performance Fixes (244040.1)• R12 Upgrade Sizing & Best Practices (399362.1)

59
Oracle Products Available Online
Oracle Store
Buy Oracle license and support online today at
oracle.com/store
60
61

62

63