
Michael C Campbell HHS Public Access 1,4 Jibril B Hirbo1,3 ...

GERMINATION, GROWTH, FLOWER PRODUCTION AND QUALITY OF BUTTERFLY
PEA (CLITORIA TERNATEA): A PLANT WITH A UNIQUE PH-DEPENDENT SENSORY
QUALITY
By
SEAN MICHAEL CAMPBELL
A DISSERTATION PRESENTED TO THE GRADUATE SCHOOL
OF THE UNIVERSITY OF FLORIDA IN PARTIAL FULFILLMENT
OF THE REQUIREMENTS FOR THE DEGREE OF
DOCTOR OF PHILOSOPHY
UNIVERSITY OF FLORIDA
2020

© 2020 Sean Michael Campbell

To my family and friends for helping to support me along the way

4
ACKNOWLEDGMENTS
I thank my parents for all of their love and support, and all my family and friends for
helping me along the way. I also thank Dr. Brian Pearson for being a mentor and role model, and
the rest of my graduate committee for their guidance in this accomplishment.
5
TABLE OF CONTENTS
page
ACKNOWLEDGMENTS ...............................................................................................................4
LIST OF TABLES ...........................................................................................................................8
LIST OF FIGURES .........................................................................................................................9
ABSTRACT ...................................................................................................................................11
CHAPTER
1 A HORTICULTURAL REVIEW OF BUTTERFLY PEA (CLITORIA TERNATEA)
BOTANY, GROWING ENVIRONMENT, SEED GERMINATION, AND
CULTIVATION .....................................................................................................................13
Botany .....................................................................................................................................16
Leaves ..............................................................................................................................16
Flowers ............................................................................................................................17
Pods and Seeds ................................................................................................................18
Roots ................................................................................................................................19
Growing Environment ............................................................................................................20
Seed Germination ...................................................................................................................21
Seed Moisture Content ....................................................................................................22
Scarification .....................................................................................................................23
Temperature .....................................................................................................................24
Cultivation ..............................................................................................................................26
Planting and Harvest Date ...............................................................................................27
Light ................................................................................................................................29
Planting Density ..............................................................................................................30
Soil ...................................................................................................................................31
Soil Moisture Content ......................................................................................................33
Rooting Hormone ............................................................................................................35
Fertilization ......................................................................................................................36
Nitrogen Fixation .............................................................................................................38
Natural Enemies ..............................................................................................................38
Butterfly Pea (Clitoria ternatea) Flower Extract (BPFE) and Its Use as a pH-Dependent
Natural Colorant ..................................................................................................................39
Color-Changing Anthocyanin .........................................................................................40
Extraction ........................................................................................................................41
Storage and Processing ....................................................................................................43
Antioxidant and Other Benefits .......................................................................................45
Conclusion ..............................................................................................................................45
2 INFLUENCE OF SUBSTRATE TYPE AND TEMPERATURE ON GERMINATION
OF BUTTERFLY PEA...........................................................................................................59

6
Materials and Methods ...........................................................................................................61
Seed .................................................................................................................................61
Substrate Type .................................................................................................................61
Substrate Temperature .....................................................................................................62
Germination Parameters ..................................................................................................62
Experimental Design .......................................................................................................63
Results.....................................................................................................................................64
Temperature and Humidity ..............................................................................................64
Germination Parameters ..................................................................................................64
Discussion ...............................................................................................................................66
Conclusions.............................................................................................................................67
3 INFLUENCE OF SUBSTRATE TEMPERATURE AND SEED SCARIFICATION ON
GERMINATION OF BUTTERFLY PEA (CLITORIA TERNATEA). ...................................73
Materials and Methods ...........................................................................................................74
Seed Scarification ............................................................................................................74
Substrate ..........................................................................................................................74
Substrate Temperature .....................................................................................................75
Germination Parameters ..................................................................................................76
Experimental Design .......................................................................................................77
Results.....................................................................................................................................77
Discussion ...............................................................................................................................79
Conclusion ..............................................................................................................................80
4 GROWING STRUCTURE AND ITS EFFECT ON FLOWER PRODUCTION IN
BUTTERFLY PEA (CLITORIA TERNATEA) .......................................................................87
Materials and Methods ...........................................................................................................88
Plant Propagation .............................................................................................................88
Growing Structures ..........................................................................................................90
Data Collection and Analysis ..........................................................................................91
Results and Discussion ...........................................................................................................92
Conclusion ..............................................................................................................................94
5 INFLUENCE OF FERTILIZATION AND IRRIGATION ON GROWTH
CHARACTERISTICS AND FLOWER PRODUCTION IN BUTTERFLY PEA
(CLITORIA TERNATEA) ........................................................................................................99
Materials and Methods .........................................................................................................100
Butterfly pea (Clitoria ternatea) ...................................................................................100
Irrigation ........................................................................................................................102
Fertilization ....................................................................................................................102
Konica Minolta SPAD-502Plus Hand-Held Meter .......................................................102
Soil Volumetric Water Content .....................................................................................103
Data Collection ..............................................................................................................103
UV/Visible Spectrophotometric Anthocyanin Analysis ...............................................104
7
Statistical Analysis ........................................................................................................105
Results and Discussion .........................................................................................................105
Fertilization ....................................................................................................................106
Irrigation ........................................................................................................................108
Conclusion ............................................................................................................................111
6 EVALUATION OF SUBSTRATE COMPOSITION AND EXOGENOUS HORMONE
APPLICATION ON VEGETATIVE PROPAGULE ROOTING SUCCESS OF
INDUSTRIAL HEMP (CANNABIS SATIVA) ......................................................................115
Materials and Methods .........................................................................................................118
Hemp cultivar ................................................................................................................118
Substrate ........................................................................................................................118
Rooting hormone ...........................................................................................................119
Experimental design ......................................................................................................120
Rooting Phenotypes .......................................................................................................120
Statistical Analysis ........................................................................................................121
Results...................................................................................................................................122
Hemp cultivar ................................................................................................................122
Substrate ........................................................................................................................123
Rooting hormone ...........................................................................................................123
Substrate-by-cultivar interaction ...................................................................................123
Hormone-by-cultivar interaction ...................................................................................124
Discussion .............................................................................................................................125
Variation in hemp cultivar rooting response .................................................................125
Substrate selection can have a major effect on rooting response ..................................127
Application of a rooting hormone substantially increased rooting versus a control .....128
Conclusion ............................................................................................................................128
7 SUMMARY ..........................................................................................................................135
Propagation ...........................................................................................................................136
Growing Structure ................................................................................................................137
Fertilization and Irrigation ....................................................................................................138
C. ternatea Cultivation .........................................................................................................140
LIST OF REFERENCES .............................................................................................................141
BIOGRAPHICAL SKETCH .......................................................................................................151

8
LIST OF TABLES
Table page
2-1 Recorded substrate temperature (°F), vented humidity dome interior temperature (°F)
and humidity (%) for trials 1, 2 and 3 of the 70, 80, and 90 °F (21.1, 26.7, and 32.2
°C) substrate temperature treatments. ................................................................................69
2-2 Germination parameters for the substrate temperature (70, 80 and 90 °F) independent
variables, the rockwool and soilless substrate (SS) independent variables and the
temperature × substrate interaction effect for butterfly pea seeds. ....................................70
3-1 Recorded substrate temperature (°F), vented humidity dome interior temperature (°F)
and humidity (%) for experimental trials 1 and 2 of the 70, 75 and 80 °F (21.1, 23.9
and 26.7 °C) substrate temperature treatments. .................................................................82
3-2 Germination parameters for the 70, 75 and 80 °F (21.1, 23.9 and 26.7 °C) substrate
temperature (°F) independent variables, the scarified, scarified and soaked and
control seed scarification independent variables and the substrate temperature (°F) by
seed scarification interaction effect for butterfly pea (Clitoria ternatea) seeds. ...............83
4-1 Mean flower count, wet weight (g) and dry weight (g) for the growing structure
independent variable. .........................................................................................................96
5-1 Means ± standard errors and significance levels for the height (cm), nodes (#),
flowers (#) and SPAD index-value parameters of the fertilization independent
variable, irrigation independent variable and the fertilization × irrigation interaction
effect. ...............................................................................................................................112
5-2 Means ± standard errors, significance levels, and graphical representation of the
delphinidin-3-glucoside (mg/mL) content of the fertilization independent variable,
irrigation independent variable, and the fertilization × irrigation interaction effect
treatment groups...............................................................................................................114

9
LIST OF FIGURES
Figure page
1-1 Butterfly pea (C. ternatea) flower, leaves, and vine in an open-sided rainout shelter
in Apopka, FL ....................................................................................................................47
1-2 Butterfly pea (C. ternatea) growing in Apopka, FL. .........................................................48
1-3 Butterfly pea (C. ternatea) leaf ..........................................................................................49
1-4 Butterfly pea (C. ternatea) flower colors ...........................................................................49
1-5 Butterfly pea (C. ternatea) seeds and pods ........................................................................50
1-6 Butterfly pea (C. ternatea) roots ........................................................................................51
1-7 Butterfly pea (C. ternatea) global distribution map...........................................................52
1-8 Butterfly pea (C. ternatea) North America distribution map ............................................53
1-9 Butterfly pea (C. ternatea) radical and seedling. ...............................................................54
1-10 36-count plug trays of germinated butterfly pea (C. ternatea) seedlings on the final
day of experimental Trial 1 ................................................................................................55
1-11 Butterfly pea (C. ternatea) growing along vertical and horizontal support trellis in an
open-sided rainout shelter in Apopka, FL..........................................................................56
1-12 The four main forms of anthocyanins at varying pH .........................................................57
1-13 Butterfly pea (C. ternatea) flower extract at normal, lowered, and raised pH ..................57
1-14 Butterfly pea (C. ternatea) flower extracted in different solvents .....................................58
2-1 Butterfly pea (C. ternatea) propagation from seed. ...........................................................69
2-2 36-count plug trays of germinated butterfly pea (C. ternatea) seedlings on the final
day of experimental Trial 1. ...............................................................................................71
2-3 Germinability of butterfly pea (C. ternatea) seeds for experimental trials 1, 2, and 3
of the substrate type and substrate temperature treatments ...............................................72
3-1 Butterfly pea (C. ternatea) propagation from seed. ...........................................................82
3-2 Overhead view of germinated butterfly pea (C. ternatea) seeds on the final days of
experimental trials 1 and 2 .................................................................................................84

10
3-3 Germinability (%) of butterfly pea (C. ternatea) seeds for the substrate temperature
and seed scarification independent variable treatments. ....................................................85
3-4 Germinability (%) of butterfly pea (C. ternatea) seeds for the substrate temperature
and seed scarification interaction effect .............................................................................86
4-1 Butterfly pea (C. ternatea) flowers ....................................................................................96
4-2 Visual representation, field image, and number of days to flower for the growing
structure independent variable. ..........................................................................................97
4-3 Mean flower count, wet weight (g) and dry weight (g) for the growing structure
independent variable. .........................................................................................................98
5-1 Soil volumetric water content (VWC). ............................................................................113
6-1 Cross section, dry bulk density (Db), sphagnum peat moss content (%) and pH for
the four experimental substrates ......................................................................................130
6-2 Overhead and schematic view of a 72-count cell-pack tray ............................................131
6-3 Root number, length (cm), and mass (mg) for the substrate, hormone, and cultivar
independent variables for industrial hemp (Cannabis sativa) vegetative cuttings ..........132
6-4 Visual representation of root number, length (cm), and mass (mg) for the substrate-
by-cultivar and hormone-by-cultivar interactions for industrial hemp (Cannabis
sativa) vegetative cuttings................................................................................................133
6-5 Visual representation of root number for the substrate-by-cultivar interaction for
industrial hemp (Cannabis sativa) vegetative cuttings. ...................................................134
11
Abstract of Dissertation Presented to the Graduate School
of the University of Florida in Partial Fulfillment of the
Requirements for the Degree of Doctor of Philosophy
GERMINATION, GROWTH, FLOWER PRODUCTION AND QUALITY OF BUTTERFLY
PEA (CLITORIA TERNATEA): A PLANT WITH A UNIQUE PH-DEPENDENT SENSORY
QUALITY
By
Sean Michael Campbell
December 2020
Chair: Brian J. Pearson
Cochair: S. Chris Marble
Major: Horticultural Sciences
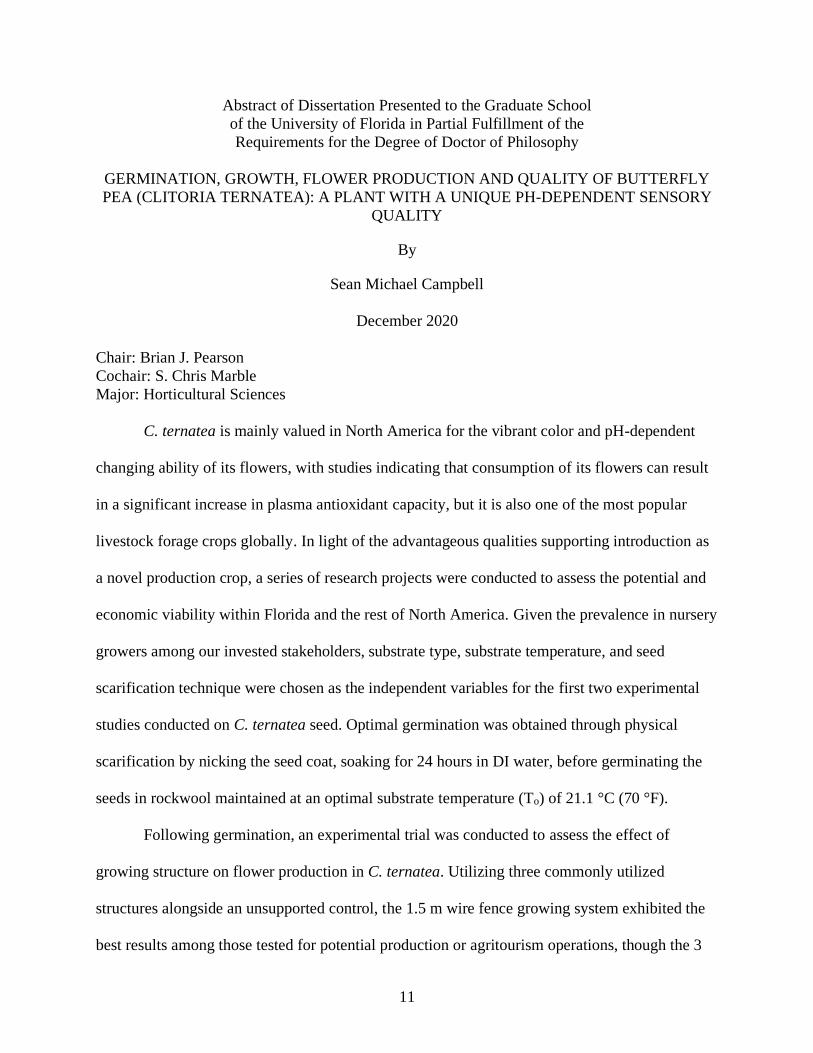
C. ternatea is mainly valued in North America for the vibrant color and pH-dependent
changing ability of its flowers, with studies indicating that consumption of its flowers can result
in a significant increase in plasma antioxidant capacity, but it is also one of the most popular
livestock forage crops globally. In light of the advantageous qualities supporting introduction as
a novel production crop, a series of research projects were conducted to assess the potential and
economic viability within Florida and the rest of North America. Given the prevalence in nursery
growers among our invested stakeholders, substrate type, substrate temperature, and seed
scarification technique were chosen as the independent variables for the first two experimental
studies conducted on C. ternatea seed. Optimal germination was obtained through physical
scarification by nicking the seed coat, soaking for 24 hours in DI water, before germinating the
seeds in rockwool maintained at an optimal substrate temperature (To) of 21.1 °C (70 °F).
Following germination, an experimental trial was conducted to assess the effect of
growing structure on flower production in C. ternatea. Utilizing three commonly utilized
structures alongside an unsupported control, the 1.5 m wire fence growing system exhibited the
best results among those tested for potential production or agritourism operations, though the 3

12
m short trellis is a suitable alternative if required by growing environment constraints. Low
fertilization rates should be employed to maximize C. ternatea growth, development, and flower
yield, with more work needed to assess the effect on flower quality. Finally, irrigation should be
applied in a deficit to boost plant growth and stimulate synthesis and accumulation of secondary
plant metabolites like del-3-glu.
Given these parameters, it is the authors opinion that C. ternatea would make an
appropriate production crop and should be adopted in Florida as well as other comparable
growing environments within North America. The cultivation methods recommend should be
utilized to maximize plant and flower yield and placed within existing crop rows or alongside
buildings the structures recommended allow for easily manicured and maintained plants with
ample access for untrained pickers, two crucial elements for any agritourism operation. Although
loosely related to research on butterfly pea given its medicinal applications, research on
propagation of hemp (Cannabis sativa) was investigated and included in this dissertation as it
was conducted during the course of the author’s research program.

13
CHAPTER 1
A HORTICULTURAL REVIEW OF BUTTERFLY PEA (CLITORIA TERNATEA) BOTANY,
GROWING ENVIRONMENT, SEED GERMINATION, AND CULTIVATION
Primarily associated in the United States with its flowers and their application as a pH-
dependent natural colorant (Figure 1-1), butterfly pea (Clitoria ternatea) (CT) is an herbaceous
perennial, leguminous twiner of the Fabaceae family and Faboideae subfamily (Barik et al.,
2007; Morris, 2009). Referred to as butterfly pea in North America and Australia (Bakhashwain
and Elfeel, 2011; Hutasoit, 2018), it is similarly known by different names dependent on the
region. CT is “Asian pigeonwings” (ITIS, 2020), “bluebell vine”, “blue-pea”, “cordofan-pea”,
and “Darwin-pea” in English speaking countries. Within Europe and the Americas, it goes by
“honte” in French, “blaue klitorie” in German, “himmelsärt” in Swedish, and “azulejo”,
“conchitas”, “papito”, “zapatico de la reina”, “zapotillo” in Spanish. Across the Asian continent
it is “die dou” in transcribed Chinese, “clitória”, “clitória-azul” (GRIN, 2020), “blue-pea”, or
“cunha” in Portuguese (Nadzirah et al., 2018), “pokok bunga talang” in Malaysian (Mahmad and
Taha, 2018; Nadzirah et al., 2018), “pokindong” in the Philippines, “kokkattan” in Tamil,
“Aparajita” in Bengali, and “shankapushpi” or “aparajit” in Hindi (Nadzirah et al., 2018;
Shobharani and Sundareswaran, 2018; Suma et al., 2019), “butter fly bean” in Saudi Arabia (Al-
Zamanan et al., 2016); and “kordofan pea” in Sudan (Bakhashwain and Elfeel, 2011; Nadzirah et
al., 2018).
CT was originally described as Clitoria ternatea L. by Carl Linnaeus in his book ‘Species
Plantarum’, published 1 May 1753 (IPNI, 2020). Genus name Clitoria (klih-TOH-ree-uh tern-
AH-tee-uh) (Extension, 2020) is likely from the Greek word “kleitoris” referring to the flowers
resemblance to female anatomy (Benda, 2020) and species name ternatea for the island of
Ternate in the Molucca archipelago of Indonesia where Linnaeus first provided the description.
CT has also historically been classified in the genus Centrosema for the Greek “kentron”,

14
meaning a prickle, spur, or sharp point, and “sema”, a signal. This is reference to the spurred
standard petal (Oguis et al., 2019); both Clitoria and Centrosema are sub-tribe Clitorinae and
share distinctive 180° downward rotated flowers (Duncan, 2017). Amos Eaton also attempted to
change the genus to Vexellaria in his 1817 ‘Manual of Botany for the Eastern States’ but was
unsuccessful (Fantz, 2000).
CT is one of the most important forage legumes in southeast Asia, China, Sudan, the East
and West Indies, and South and Central America (Morsy and Awadalla, 2017). Regardless, the
geographic origin of the species is still contested as some publications report it being native to
Central America, Mexico, and the Caribbean while others claim it originally emerged in or
around the Indian Ocean. It’s classified as a popular ornamental naturalized prior to 1871 in
Hawaii, and in 1881 CT first appeared in herbarium collections in St. Thomas, followed by
Puerto Rico in 1885, Jamaica in 1900, Bahamas in 1903, Cuba in 1904 and the Dominican
Republic in 1910 (Rojas-Sandoval, 2018). Presently naturalized populations of CT can be found
in tropical and subtropical climates globally (Mukherjee et al., 2008; Oguis et al., 2019).
Three primary subgenera are currently recognized within Clitoria, with Clitoria ternatea
L. being the holotype (Oguis et al., 2019). Clitoria ternatea L. has two direct children: Clitoria
ternatea var. pleniflora Fantz and Clitoria ternatea var. ternatea L. (ITIS, 2020), categorized by
zygomorphic flowers or flowers with five uniform petals, respectively (Shamnad, 2020). Having
been cataloged by systematic biologists of the Agricultural Research Service (ARS) of the
United States Department of Agriculture (USDA) on 8 October 1988, there are 59 accessions
currently available within the National Plant Germplasm System (NPGS) of the Germplasm
Resource Information Network (GRIN, 2020; Morris, 2009).

15
CT flowers are commonly light blue, dark blue, white, or mauve (Kazuma et al., 2003)
due to elevated anthocyanin concentrations (Pham Tri Nhut et al., 2019), a class of flavonoids
possessing biological activities (Poh, 2019). The flowers bloom nearly year-round under ideal
conditions (Park and Knox, 2016) and contrary to the common name, are not butterfly attractors.
Instead, CT is named for the flower’s winged shape (Morsy and Awadalla, 2017; Rojas-
Sandoval, 2018). Fresh CT flowers, dried flowers, or extracts of the flower petals are
traditionally used as a non-toxic and environmentally conscious natural plant pigment (Mahmad
and Taha, 2018), responsible for the blue color of Malaysian dishes ‘‘nasi kerabu” and ‘‘kuih
tekan” (Siti Azima et al., 2017). In Thailand, the flowers are served as a hot or iced tea called
“dok nam anchan” (Marpaung et al., 2020) or the extract is dried and mixed with sugar to form
“un-chan juice powder” (Wiboonsirikul, 2019).
Naturally derived and with a longer shelf life and greater ease of use than other blue
colorants (Siti Azima et al., 2017), CT flower extracts maintain their blue-purple color at neutral
and acidic condtions while many anthocyanins are unstable and lose their color (Mahmad and
Taha, 2018; Marpaung et al., 2020). Anthocyanin extracts are also water soluble with high color
density and chroma, important characteristics for incorporation into aqueous food systems
(Marpaung and Pramesthi, 2020; Siti Azima et al., 2017). Further, recent health concerns
associated with consumption (Chu et al., 2016; McCann et al., 2007) and use (Pham T. N. et al.,
2020) of synthetic food colorants will likely further popularize the use of CT in food and
beverage preparation (Siti Azima et al., 2017). This is evident in the United States, where
increased interest in this plant and its applications as a pH-dependent food colorant,
nutraceutical, cosmetic, and environmentally friendly insecticide have already been documented
(Oguis et al., 2019; Simonson, 2016).

16
Botany
CT is primarily cultivated as an ornamental perennial climber (Mukherjee et al., 2008),
trailer, or scrambler (Rojas-Sandoval, 2018) capable of growing 3 to 5 meters (10 to 15 feet)
vertically and 1 to 2 meters (3 to 6 feet) horizontally (Garden, 2020) (Figure 1-2A). Once
established, growth is primarily from the apices of the main axis and axillary branches with
minimal new shoots emerging from ground level (Rojas-Sandoval, 2018). The stems and
branches are green, terete, and pubescent (Aye and Lin, 2020) and behave as fine twining bines
(Suma et al., 2019), meaning they climb vertically by encircling a support (Figure 1-2B). CT
spirals in a counterclockwise direction, a characteristic of the species, and if made to encircle in
the opposite direction it will unwind and possible be damaged. Supports commonly include
suspended wires, lattices (Park and Knox, 2016), fences posts (Oguis et al., 2019), trellises, and
other vertical or horizontal structures (Rojas-Sandoval, 2018). Mentioned previously, the
Clitoria and Centrosema genera are closely related and therefore commonly confused. While
both exhibit the delicately stemmed, twining growth habit, there are variations between them that
will be discussed further in following chapters (Duncan, 2017).
Leaves
CT has green imparipinnate leaves that are 6 - 13 cm long (Mukherjee et al., 2008) with 5
- 7 leaflets on each side of a common axis (Aye and Lin, 2020; Suma et al., 2019) (Figure 1-3).
This is a major deviation from the Centrosema genus which has trifoliate leaves (Duncan, 2017).
Leaflets are 2 - 5 cm long by 2 - 4 cm wide and entire along the margin with emarginate tips
(Oguis et al., 2019) and a cylindrical, ovate, or oblong shape (Aye and Lin, 2020; Mukherjee et
al., 2008). Both the lower and upper epidermis of the leaflets are pubescent and consist of single
layers of cells coated by a thick cuticle and trichome outgrowths (Aye and Lin, 2020; Mukherjee
et al., 2008; Oguis et al., 2019). CT leaves are also a source of the glycosides Clitorin,

17
kaempferol-3-glucoside, kaempferol-3-rutinoide, and kaempferol-3-neohesperidoside (Suma et
al., 2019).
Flowers
CT produces bisexual (Aye and Lin, 2020), solitary, axillary, papilionaceous flowers
(Mukherjee et al., 2008). Flowers are 2 - 3 cm at anthesis (Aye and Lin, 2020) but upon maturity
average 2 - 4 cm wide and 5.5 cm long (Nadzirah et al., 2018). Pedicles are cylindric, pubescent,
pale green in color (Aye and Lin, 2020), 4 - 9 mm in length (Nadzirah et al., 2018), and attached
to a tubular calyx formed from five petals fused at two thirds of their length (Oguis et al., 2019).
The corolla is comprised of five free petals: one standard broadly obovate banner approximately
4 - 4.5 cm by 3 - 3.5 cm, two wrinkled wings that are typically half the length of the banner (2
cm by 1.3 cm), and two white keels that function in protecting reproductive organs. Double-
headed versions of the flower also exist with an additional banner. CT flowers are diadelphous,
with stamens consisting of 10 filaments, 9 fused and 1 unattached. Filaments are filiform,
pubescent, and a yellow green color with a pollen-bearing white anther consisting of four lobes.
The superior and monocarpellary ovary bears 10 ovules and is topped by a long, thick, and
curved style with a bent tip (Aye and Lin, 2020; Oguis et al., 2019). The flowers are
cleistogamous but are visited by insects in the wild, primarily bees, and therefore some
outcrossing does occur (Rojas-Sandoval, 2018).
CT flowers are typically associated as deep blue to purple but can also exhibit white,
mauve, purple, or light blue colors (Mukherjee et al., 2008; Nadzirah et al., 2018) (Figure 1-4).
In Sri Lanka, white and blue flowers are known by the common names “ela-katarolu” and “nil-
katarolu”, respectively. Lakshan et al. (2020) assessed three different colored CT flower
accessions: white flowers with normal keel petals (WSPF), blue flowers with normal keel petals
(BSPF), and blue flowers with enlarged keel petals (BMPF). They found that the enlarged blue

18
flower experimental group had the maximal total phenolic content (TPC) (31.88 mg GAE eq./g
dry weight) and total flavonoid content (TFC) (15.96 mg quercetin eq./g dry weight). Ferric
reducing antioxidant power (FRAP) was significantly lower in white flowers (10.66 mg trol eq./g
dry weight) than for normal blue flowers (14.56 mg trol eq./g dry weight) and enlarged blue
flowers (18.50 mg trol eq./g dry weight), while 2,2-diphenyl-1-picrylhydrazyl (DPPH) radical
scavenging activity was significantly higher in normal blue flowers (11.97 mg trol. eq./g dry
weight) than in enlarged blue or white flowers. Lastly, white flowers had significantly higher
mean phosphorous (P) content (4.65 mg/g); normal blue (43.12 mg/g) and white flowers (42.35
mg/g) had significantly higher nitrogen (N) content; and normal blue flowers had a significantly
higher mean protein content (26.95%) than enlarged blue or white flowers (Lakshan et al., 2020).
Shamnad (2020) further assessed differences in color by evaluating seven experimental
groups, four variants within Clitoria ternatea var. ternatea, termed as ‘single’, ‘single light blue’,
single white’, and ‘single violet’; and three within Clitoria ternatea var. pleniflora Fantz, ‘double
blue’, ‘double pink’, and ‘double white’. They determined that four variants had preferential
qualities among the seven: ‘light blue’ had the highest protein content (18.2 g) as well as
appreciable concentrations of β-carotene, phosphorus, and iron; ‘violet’ and ‘double white’
contained the largest carbohydrate content (7.1 g) along with protein, calcium, and phosphorus;
and ‘double pink’ had the highest β-carotene (0.45 g) content in addition to carbohydrates,
calcium, phosphorus, and iron (Shamnad, 2020).
Pods and Seeds
CT pods mature in 8 - 10 weeks after flowering, starting bright green and senescing to a
mottled brown upon dehydration (Rojas-Sandoval, 2018). They are typically 4 - 13 cm long and
0.9 - 1.2 cm wide with thickened margins and a flattened, linear-oblong shape (Nadzirah et al.,
2018). Pods are nearly straight but with a slight curve, and narrow but tapered to a point (Aye

19
and Lin, 2020; Mukherjee et al., 2008; Oguis et al., 2019). Clitoria pods also tend to be larger,
flatter, and narrower than those in Centrosema (Duncan, 2017). CT pods desiccate in dry
conditions and upon maturity will dehiscence, or shatter (Morris, 2009; Nadzirah et al., 2018),
releasing the 6 - 11 seeds contained within (Figure 1-5).
Seeds are 5 - 7 mm long and 3 - 4 mm wide; mottled, shiny, and yellow brown to black in
color; oval, subglobose, or reniform in shape; have a glabrous surface; and have a caloric content
of around 500 cal./100 g (Aye and Lin, 2020; Mukherjee et al., 2008; Nadzirah et al., 2018;
Oguis et al., 2019). They are relatively heavy when compared to other medicinal plant species,
with a mean weight of 5.8 g/100 seeds and an average of 17,279 seeds/kg (Mishra et al., 2006).
The main phytoconstituents within the seeds are taraxerol and taraxerone (Suma et al., 2019). CT
is typically heavy seeding, producing between 6 and 3,400 total seeds per plant. Therefore, the
primary propagation method is by seed (Morris, 2009). However, harvested seed tends to remain
hard seeded for an extended period and can require pre-treatment before sowing, primarily
though physical or chemical scarification.
Roots
CT has an extensive deep root system (Rojas-Sandoval, 2018) characterized by a stout
taproot that bears the one to multiple purple-green, wiry, and glaucous stems (Mukherjee et al.,
2008) with few branches and multiple slender, lateral roots (Suma et al., 2019). The horizontal
root can grow to depths of greater than 2 m (Mukherjee et al., 2008) and enables the plant to
withstand droughts of up to 8 months (Rojas-Sandoval, 2018). Roots have a woody exterior and
white interior with few lenticles that form transverse cracks (Figure 1-6) (Mukherjee et al.,
2008). This extensive root system also contains carbohydrates, proteins, starches, and flavonoids
(Suma et al., 2019), and is slightly bitter in taste when fresh (Mukherjee et al., 2008).

20
Growing Environment
CT prefers native tropical and subtropical grassland and scrub environments (Alderete-
Chavez et al., 2011) within zones 11 to 12 (Garden, 2020) with elevations from sea level to 1600
- 1800 m (Rojas-Sandoval, 2018) and mean annual temperatures from 15 - 28 °C (59 - 82.4 °F)
(Poh, 2019). It is a short day C3 plant that grows advantageously in full sun but is also
moderately shade tolerant (Mahfouz et al., 2019). Individual plants are capable of living for
several years, dying back in the winter in sub-optimal temperatures but rebounding from seed or
root, and can grow into large vines and stands if left undisturbed (Park and Knox, 2016; Rojas-
Sandoval, 2018). High variability exists for reported CT water needs. It exhibits drought
tolerance and is capable of growing in dry and semiarid environments with annual rainfall of 400
- 1,500 mm/year (Suma et al., 2019), 500 - 900 mm/year but capable of withstanding a minimum
of 400 mm for a period up to 5 - 6 months (Poh, 2019; Rojas-Sandoval, 2018), or summer and
annual rainfall of 18 inches and 54 inches/year, respectively (Duncan, 2017). Regardless, CT
requires copious amounts of water with sufficient drainage (Extension, 2020) and will tolerate
short term flooding, but is sensitive to waterlogging and cannot survive “wet feet” for extended
periods (Duncan, 2017; Suma et al., 2019).
With high palatability to livestock animals, accelerated regrowth following grazing, and
elevated yields compared to other legumes, CT was introduced widely across Africa, Asia,
Australia, and Central and South America as a forage crop and to improve natural grasslands in
areas that had been extensively farmed. Once introduced, CT spread rapidly though seed
production and can inhabit native ecosystems. Having escaped cultivation in Australia, it can be
found occupying roadsides, disturbed woodlands and grasslands, and the edges of bodies of
water. This is similar to Hawaii where it is often cultivated as an ornamental, and in Central

21
America where is has become naturalized alongside roads, pastures, and other disturbed sites at
elevations ranging from sea level to 650 m (Figure 1-7) (Rojas-Sandoval, 2018).
Within North America CT ranges from New Jersey south to Arkansas and Kentucky and
from Texas east to Florida (Austin, 2004), is considered uncommon in the Southeast portion of
the country (Benda, 2020), and grows well in Northern and Central Florida but with marginal
growth in the South (Park and Knox, 2016). Figure 1-8 shows distribution of introduced
accessions in North America. It commonly occurs in dry or rocky woodlands (Benda, 2020) and
is classified as a non-native facultative upland (FACU) with the National Wetland Plant List
(NWPL), meaning that it has a 67 - 99% estimated probability of occurring in a non-wetland but
can occasionally be found in wetlands (1 - 33% estimated probability) (AFP, 2020). Invasive.org
is a joint project encompassing the University of Georgia - Center for Invasive Species and
Ecosystem Health, the USDA Animal and Plant Health Inspection Service, the USDA Forest
Service, the USDA Identification Technology Program, and the USDA National Institute of
Food and Agriculture. They compared CT to other species considered invasive and found no
reference listing CT as invasive in North America (Invasive.org, 2018).
Seed Germination
CT is a heavy seeder with between 6 and 3,400 total seeds per plant reported from an
assay of 19 varying accessions, leading to germination from seed as the primary method of
propagation (Morris, 2009). It exhibits epigeal germination with radicals and seedlings emerging
within 48 - 72 hours and 3 - 6 days, respectively (Figure 1-9) (Rojas-Sandoval, 2018). Seed
germination viability and percentage are influenced by a variety of internal factors like seed coat
and embryo characteristics or the presence of inhibitors, and further by external factors like
temperature, light, moisture content, etc. (Shobharani and Sundareswaran, 2018). A significant
problem in CT propagation though is poor germinability and stunted seedling vigor caused by

22
poor water and oxygen penetration (Das M. et al., 2019); impermeability to the embryo due to a
thick waxy seed coat is common in the legume family and can cause retarded and inconsistent
seed germination that can have significant effects on commercial production operations
(Makasana et al., 2016; Shobharani and Sundareswaran, 2018).
Seed Moisture Content
Das et al. (2017) determined that the inherent moisture content of butterfly pea seeds is
6.8%, and while that can be altered to between 5% and 12% with no negative effects,
germinability was maximized at 10% seed moisture content. In 2019, Das et al. (2017) expanded
on the experiment using the same moisture content treatments: decreased to 5%, a control
treatment of approximately 6.8%, and increased to between 10 - 12%, but storing samples at
temperature treatments of -20, 20 and 30 °C for a duration of one year (Das M. et al., 2019).
Both the treated and control seeds exhibited an increase in germinability following six months,
indicating the presence of physical dormancy. This is supported by Mullick and Chatterji (1967)
who found that while freshly harvested butterfly pea seeds would not absorb water and
germinate, storing the seeds for a six month period increased germination capacity by 15 - 20%.
Das et al. (2019) also determined that the increase in moisture content to between 10 - 12%
resulted in an increase in germinability and seedling vigor from 3 months to experiment
conclusion at one year in the samples stored at -20 °C and 20 °C, with those stored at 20 °C
exhibiting the highest germinability, lowest mean germination time and highest vigor index (Das
M. et al., 2019).
Shobharani and Sundareswaran (2018) similarly assessed moisture content by soaking
seeds in cold water for periods of 12, 24, 36, and 48 hours and hot water at 60 °C and 80 °C for
periods of 2, 4, 6, 8, and 10 minutes before drying at room temperature under shade. Both the
cold water treatment for 48 hours (76%) and the 80 °C hot water treatment for 4 minutes (80%)

23
increased germinability over the control (65%), but the hot water treatment also increased
development of hard (11%) and dead (7%) seeds. This is likely due to embryonic injury
(Shobharani and Sundareswaran, 2018).
Alternatively, Sushmita and Deeksha (2017) soaked seeds in distilled water (control) and
increasing concentrations of a polyethylene glycol (PEG) solution (1, 5, 10, 15, 20 and 25%) for
12 hours at 25 ± 2 ̊Ϲ in order to create an osmotically induced water stress. They determined: (1)
PEG treatment decreased the water potential gradient between the seeds and the surrounding
media, resulting in reduced germination with increasing PEG percentage. The exception was that
germinability was maximized at 10% and 20% PEG (42.5%) in comparison to the control (40%);
(2) maximum shoot length was observed in the 25% PEG (6.5 cm) treatment followed by the
control (6.4 cm); (3) shoot length was highest in the control group (2.5 cm) followed by 20%
PEG group (1.9 cm); (4) fresh weight was also highest in the control (260 mg) followed by 20%
PEG (250 mg). They concluded that drought stress in CT reduced overall plant growth,
specifically in germinability, shoot and root length, and fresh weight (Sushmita and Deeksha,
2017).
Scarification
Several methods exist for increasing permeability of the seed coat but is most often
accomplished through scarification, or a compromising of the seed coat (Makasana et al., 2016).
Nagar and Meena (2015) found that either physical (abrasion with sandpaper) or chemical
(soaking in sulfuric acid) scarification methods can increase germination in CT seeds by 70.5%
versus a control. Similarly, Mishra et al. (2006) reported that mechanical scarification of CT seed
through removal of the seed tip with shears significantly increased the germinability (54%) and
germination speed (1.44 days) over the untreated control (24%, 1.5 days).

24
In the same study by Shobharani and Sundareswaran (2018) listed above, seeds were
treated with sulfuric acid (H2SO4) at concentrations of 100 and 200 ml/kg of seed and for periods
of five and ten minutes before being washed and dried under shade. The 200 ml/kg H2SO4
treatment applied for five minutes resulted in the highest germinability (91%), germination speed
(5.0 days), root length (19.5 cm), shoot length (12.2 cm), dry matter production (DMP) (401.0
mg/10 seedling-1), and vigor index (2879) as per ISTA (2013) when compared to the control
(65% germinability, 3.0 day germination speed, 11.8 cm root length, 10.6 cm shoot length, 268.3
mg/10 seedling-1 dry matter production (DMP), and 1447 vigor index). Higher germination is
likely due to a disruption of the pectin and lignin constituents of the epidermal layer, weakening
the seed coat and making it more permeable to water and oxygen. Contact with the H2SO4
beyond five minutes was deemed harmful as it increased the percentage of dead seeds and
abnormal seedlings (Shobharani and Sundareswaran, 2018). The was confirmed by Nagar and
Meena (2015) who found that H2SO4 treatment for ten minutes increased abnormal seedlings by
3.3% versus physical scarification and by Makasana et al. (2016) who reported that H2SO4
treatment can result in seedling damage and ultimately in yellowing of the cotyledons.
Temperature
Substrate temperature during germination, primarily expressed as the optimal
germination temperature (To), is another relevant environmental factor capable of having a
substantial impact on germination capacity and rate. Research examining the influence of To on
germination success has been evaluated for CT; however, conflicting observations over the exact
value appear in literature with publications listing To as single temperatures, 30 °C
(Selvamaleeswaran et al., 2011), and as temperature ranges, 24 - 28 °C (McDonald, 2002) and 24
- 32 °C (Oguis et al., 2019).

25
Deriving these values, Selvamaleeswaran et al. (2011) reported that exposing CT seed to
temperature treatments of 16, 28, 30 and 35 °C resulted in 56%, 60%, 65%, and 20%
germinability, respectively, indicating a To of 30 °C and a drastic reduction in germination at 35
°C. This reduction was likely due to thermoinhibition, or the inability of seeds to germinate at
lowered or elevated temperatures. Similarly, McDonald (2002) evaluated CT seed germination at
temperatures ranging from 8 to 44 °C. Peak germination was observed between 24 and 28 °C
with a rapid decrease in germinability above or below that range, and thermoinhibition at the
highest imposed temperature treatment (≥ 40 °C). Mean germination rate followed a similar
trend, increasing proportionally with substrate temperature from 8 to 28 °C, maximizing at To of
32 °C, then declining between 36 and 40 °C. Differences in observations reported by
Selvamaleeswaran et al. (2011) and McDonald (2002) were likely caused by their use of cotton
and paper, respectively, as germination media. In their study, Das M. et al. (2019) found that CT
seeds that had been increased to between 10 and 12% moisture content had higher germinability
and vigor from three months post treatment to the study’s conclusion at one year when stored at -
20 and 20 °C. Alternatively, seeds stored at 30 °C had higher germinability and a shorter mean
germination time for the first six months of treatment but declined significantly thereafter (Das
M. et al., 2019).
Recent research examined the influence of rockwool (Grodan, Roermond, The
Netherlands) and a commercial soilless substrate mix (30% pine bark, 48% peat, 10% perlite,
and 12% vermiculite; Fafard 4P; Sun Gro Horticulture, Agawam, MA) as well as 21.1, 26.7 and
32.2 °C (70, 80, and 90 °F) applied treatments to assess the effect of substrate type and
temperature on CT seed germination. The rockwool substrate treatment had significantly higher
mean germination capacity (G) (91.67%), mean germination time (MT) (2.07 days), the

26
coefficient of variation of the germination time (CVt) (23.63%), and mean germination rate (MR)
(0.49 d-1) when compared to the commercial soilless substrate mix (G = 83.64%, MT = 1.77
days, CVt = 33.39%, and MR = 0.58 d-1). G values of 70 °F (92.6%), 80 °F (88.4%), and 90 °F
(81.9%) for the substrate temperature treatment groups lacked significance but indicated a trend
of decreasing germination with increasing temperature in the 70 - 90 °F range. This was further
supported by the significant MT, CVt, and MR values for the 70 °F (MT = 2.16 days, CVt =
20.44%, and MR = 0.47 d-1), 80 °F (MT = 1.89 days, CVt = 27.40%, and MR = 0.54 d-1), and 90
°F (MT = 1.70 days, CVt = 37.70%, and MR = 0.60 d-1) treatments. Results indicate that CT seed
germination under these parameters can be maximized in rockwool substrate type at 70 °F
substrate temperature (Figure 1-10) (Campbell et al., 2020).
Cultivation
CT is primarily considered an ornamental crop because of its attractive flowers and their
ability to function as a pH dependent natural colorant; however, it is also valued for its qualities
as a cover and forage crop (Mahfouz et al., 2020; Rojas-Sandoval, 2018). Plant growth,
development, and metabolic profiles (Nadzirah et al., 2018) are significantly affected by abiotic
and biotic stressors such as light, temperature, drought, and invasive organisms (Sushmita and
Deeksha, 2017) as well as production factors like planting and harvest date, plant density, and
application of hormones or inoculants (Mahfouz et al., 2019). Considerable variability in
responses to these characteristics has been observed among CT accessions (Morris, 2009).
As a cover crop CT is also grown for green manure, rotational grazing, as a protein bank,
for hay and silage production (Rojas-Sandoval, 2018), and is often planted alongside wheat,
maize, and sorghum to increase soil fertility and improve current and subsequent crop yields
(Mahfouz et al., 2020). Early growth is rapid in warm and moist environments and continues at a
near constant pace in ideal conditions, capable of forming a uniform ground cover within four to

27
six weeks when planted at a density of 4 plants/m² (Figure 1-11) (Rojas-Sandoval, 2018). CT is
capable of yielding between 6 and 15 tons/acre of dry matter when under drought conditions and
ideal conditions, respectively, with approximately 700 pounds/acre of seed. Flowers and pods
develop at varying rates and stage due to CTs indeterminate nature and therefore their harvest is
highly variable (Duncan, 2017). Once established, CT displays a competitive advantage to
weeds, though if a pure stand is desired it’s recommended to provide some weed control during
establishment and after cutting, mowing, or grazing (Morris, 2009).
As a forage crop, CT is considered one of the earliest and highest producing forage
legumes in tropical regions where animal production is an important aspect of local economies.
It can be cut up to eight times per year at intervals of 45 days (Shamnad, 2020) with
recommendations that plants be cut at 10 cm above the grounds surface and be allowed 25 days
of regrowth (Morris, 2009). It exhibits exceptional regrowth following grazing or cutting and has
a high nutritive value with thin stems and large leaves. It is highly palatable by livestock with
cattle, goats, and sheep preferring it over most other tropical forage legumes. CT has high leaf
protein content, lower acid digestible fiber, is non-toxic and causes minimal bloat, making it
optimal for fresh forage or hay and silage (Mahfouz et al., 2020; Rojas-Sandoval, 2018).
Planting and Harvest Date
Optimal planting and harvest date ensures that the plants developmental stages align with
suitable climatic conditions. This can have significant impact on the growth, development, and
yield. Optimal planting and harvest date is dependent on cultivar, growing region, and growing
season (Mahfouz et al., 2019). Jelantik et al. (2019) investigated the yield and nutritive value of
CT harvested at 60, 75, and 90 days after planting (DAP) at a density of 18 plants per 3 m2 plot.
Total production was not significantly affected but did increase proportionally with DAP at
5,186, 6,848, and 7,781 ton/ha dry matter for the 60, 75, and 90 DAP treatments, respectively.
28
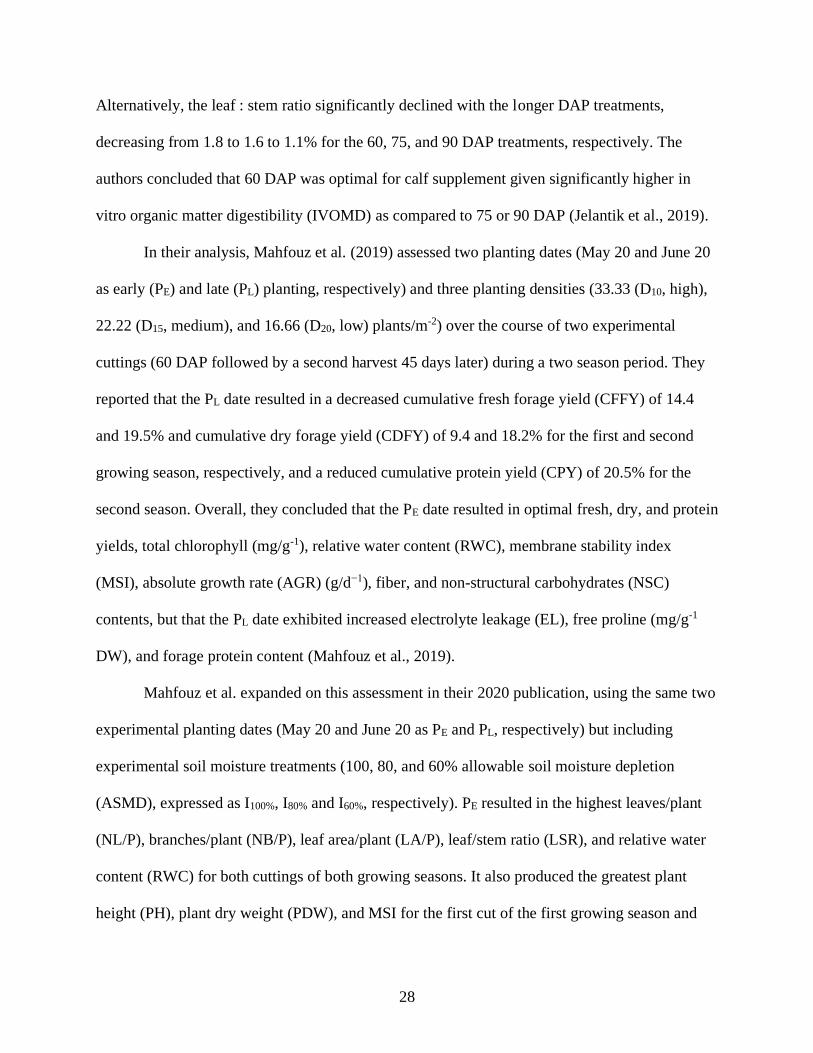
Alternatively, the leaf : stem ratio significantly declined with the longer DAP treatments,
decreasing from 1.8 to 1.6 to 1.1% for the 60, 75, and 90 DAP treatments, respectively. The
authors concluded that 60 DAP was optimal for calf supplement given significantly higher in
vitro organic matter digestibility (IVOMD) as compared to 75 or 90 DAP (Jelantik et al., 2019).
In their analysis, Mahfouz et al. (2019) assessed two planting dates (May 20 and June 20
as early (PE) and late (PL) planting, respectively) and three planting densities (33.33 (D10, high),
22.22 (D15, medium), and 16.66 (D20, low) plants/m-2) over the course of two experimental
cuttings (60 DAP followed by a second harvest 45 days later) during a two season period. They
reported that the PL date resulted in a decreased cumulative fresh forage yield (CFFY) of 14.4
and 19.5% and cumulative dry forage yield (CDFY) of 9.4 and 18.2% for the first and second
growing season, respectively, and a reduced cumulative protein yield (CPY) of 20.5% for the
second season. Overall, they concluded that the PE date resulted in optimal fresh, dry, and protein
yields, total chlorophyll (mg/g-1), relative water content (RWC), membrane stability index
(MSI), absolute growth rate (AGR) (g/d−1), fiber, and non-structural carbohydrates (NSC)
contents, but that the PL date exhibited increased electrolyte leakage (EL), free proline (mg/g-1
DW), and forage protein content (Mahfouz et al., 2019).
Mahfouz et al. expanded on this assessment in their 2020 publication, using the same two
experimental planting dates (May 20 and June 20 as PE and PL, respectively) but including
experimental soil moisture treatments (100, 80, and 60% allowable soil moisture depletion
(ASMD), expressed as I100%, I80% and I60%, respectively). PE resulted in the highest leaves/plant
(NL/P), branches/plant (NB/P), leaf area/plant (LA/P), leaf/stem ratio (LSR), and relative water
content (RWC) for both cuttings of both growing seasons. It also produced the greatest plant
height (PH), plant dry weight (PDW), and MSI for the first cut of the first growing season and

29
for both cuts of the second growing season. The authors concluded that reductions in growth and
development parameters were likely attributed to the later planting date; later planting from PE to
PL caused a reduction in the vegetative growing period and the amount of photosynthetically
active radiation (PAR) absorbed by the plant. PAR plays a vital role in plant growth and
development, and a reduction can result in a deceleration of the plants assimilation rate and
ultimately a decrease in dry matter accumulation. This is particularly relevant in climates where
the later growing period encroaches on a fall season with reduced temperature and solar radiation
(Mahfouz et al., 2020).
Light
Light is the main energy source for plants through photosynthetic production and therefore
has a significant impact on growth and development through light quantity, quality, and
photoperiod. Light quantity refers to the light’s intensity and is defined as the total amount
received by the plant. Quality is related to the wavelength and color of the light, primarily within
the range of PAR. Both light quantity and quality can be affected by environmental or
managerial factors such as shading from competing vegetation, location in a greenhouse, use of
shade cloth, etc. Alternatively, photoperiod is the duration light is received by plants and is
directly related to geographic latitude, at its maximum in the summer and minimum in winter.
Combined, these three factors encompass the total amount of light available to the plant, with
direct relation to the amount of photosynthetic processes the plant is able to undertake (Nadzirah
et al., 2018). Given its diverse range and environmental conditions, CT prefers to be grown in
full sunlight but is categorized as moderately shade tolerant (Poh, 2019; Rojas-Sandoval, 2018).
Given its qualities as a nitrogen fixating forage legume capable of improving soil fertility
(Mahfouz et al., 2020), there has been expressed interest in using CT to remediate previously
over-farmed agricultural areas. Hutasoit (2018) assessed the productivity of three legumes

30
alongside CT as forage and cover crops integrated into an oil palm plantation, including Arachis
glabrata, Stylosanthes guianensis, and Chamaecrista rotundifolia. CT had significantly higher
dry matter yield among the legumes tested, 16.15 versus 2.65 tons/ha/year for C. rotundifolia,
likely due to increased biomass accumulation through accelerated propagation. The author noted
that dry matter yields derived for this study were lower than previous literature, but was
attributed to the inclusion of shade from competing vegetation; solar intensity at ground level in
oil palm plantations can be 50% that of full sun intensity, and CT indicated higher tolerance to
being grown in shade than the other legumes included, likely due to having the largest average
leaf width. Crude protein (CP) content was also highest in CT at 17.84%. Given its optimal
nutritional quality and biomass production the author concluded that CT has potential to be
utilized as a cover crop in intercropping and rehabilitating land under horticultural production
(Hutasoit, 2018).
Planting Density
Another production factor relevant to the growth and development, planting density can
significantly affect quantitative and qualitative parameters pertinent to CT cultivation as an
ornamental and forage crop. Planting density is directly related to the amount of PAR individual
plants intercept and therefore optimal density should be constructed to ensure each plant absorbs
the highest proportion possible, resulting in increased overall yields. In the study described
above, Mahfouz et al. (2019) assessed two planting dates (May 20 and June 20 as early (PE) and
late (PL) planting, respectively) and three planting densities over the course of two experimental
cuttings (60 days after planting (DAP) followed by a second harvest 45 days later) during a two
season period. Planting densities were classified as high (D10) (33.33 plants/m-2 or 10 cm per side
for hills between plant rows), medium (D15) (22.22 plants/m-2 or 15 cm per side), and low (D20)
(16.66 plants/m-2 or 20 cm per side).

31
CT responded significantly to the varying plant densities; leaves/plant (NL/P),
branches/plant (NB/P), plant dry weight (PDW), total chlorophyll, relative water content (RWC),
electrolyte leakage (EL), free proline, and absolute growth rate (AGR) all increased as the
density was decreased from D10 (high) or D15 (medium) to D20 (low). Alternatively, plant height
(PH), leaf area index (LAI), leaf/stem ratio (LSR), and membrane stability index (MSI) were
increased as the density was raised, with the D10 treatment yielding the highest cumulative fresh
forage yield (CFFY) (23.3 and 23.1 tonnes/ha-1), cumulative dry forage yield (CDFY) (7.5 and
7.4 tonnes/ha-1) and cumulative protein yield (CPY) (1.55 and 1.39 tonnes/ha-1) for the two
growing seasons, respectively. The authors concluded that a high planting density (D10) is
optimal for producing the greatest forage yield and nutritive value (Mahfouz et al., 2019).
Soil
CT is adapted to a diverse range of soil types within its disparate growing environments
(Morris, 2009; Poh, 2019; Rojas-Sandoval, 2018). Three primary factors contribute to this
adaptability, notably soil pH, soil aeration/compaction, and soil salinity. Nutrients needed by the
plant for growth and development are absorbed by plant roots, with solubility and availability of
individual nutrients highly dependent on soil pH. Highly acidic soil can contain elevated
concentrations of iron, manganese, and aluminum which can be toxic, while alkaline soils reduce
nutrient bioavailability and can result in plant nutrient deficiencies. Soil acidity can also
influence microorganism activity, further affecting available nutrients. Therefore, an optimal pH
range of 6 - 7 is recommended for most plants (Nadzirah et al., 2018) while CT is commonly
cultivated in soils ranging from pH 5.5 to 8.9 (Poh, 2019).
Soil porosity is defined as the amount of space between soil particles and directly
influences the movement of air and liquid within soils. Low soil porosity can substantially
reduce the exchange of oxygen for carbon dioxide within soils and can become limiting for

32
proper root respiration. This can lead to stunted and abnormal root growth, poor root penetration
and development, and decreased microbial activity. Combined, these factors can significantly
affect nutrient bioavailability and absorption and lead to disease development (Nadzirah et al.,
2018). CT has adapted to a wide range of soil types and densities while being introduced
globally and can withstand calcareous soils, sandy soils, deep alluvial loams, and heavy clays,
which is partially responsible for the species ability to tolerate both excess rainfall and drought
conditions (Morris, 2009; Rojas-Sandoval, 2018).
Saline soil conditions are commonly formed as a result of mineral accumulation in
response to evaporation of soil moisture. This most commonly occurs in arid and semiarid
environments. Plant response to salinity is classified by two phases; first stomatal closure and
leaf expansion inhibition followed by a build-up of ions to toxic concentrations in the shoot.
Overall, it can impact physiological, morphological, and biochemical processes that cause
reductions in yield and eventually total plant death (Nadzirah et al., 2018). Given its widespread
distribution, CT has adapted to grow successfully in a wide range of soil salinities. Historically
CT has exhibited low to moderate tolerance to soil salinity, capable of growing up to 50% of its
maximum potential at an ECe of 6.4 dS m−1 (Mahfouz et al., 2020; Rojas-Sandoval, 2018; Suma
et al., 2019).
Confirming this, Sevanayak et al. (2020) exposed CT seeds to varying concentrations (0
(distilled water control), 4, 8, 12 and 16 dS m-1) of salts (NaCl, Na2SO4, MgCl2, and CaSO4) to
assess germination and early growth. They reported that final germination percentage, seed
viability index, seedling and root length, and seedling fresh and dry weight were significantly
affected by all experimental treatments. Seed germination decreased proportionately with
increasing salt concentrations from the control (61.3%) through the 4, 8, 12 and 16 dS m-1

33
treatments at 60%, 46.7%, 37.3%, and 25.3%, respectively. A similar trend was observed in the
seed viability index with values of 677.1 cm, 533.1 cm, 254.8 cm, 131 cm, and 53.2 cm,
respectively (Sevanayak et al., 2020).
Soil Moisture Content
Soil moisture content (SMC) is a measure of the amount of available water in the soil and
is of great importance to agricultural producers (Nadzirah et al., 2018). Drought stress is one of
the most significant environmental stressors limiting crop production worldwide, increasing in
severity with rising global temperatures and causing substantial agricultural losses. It affects
physiological and developmental processes in plants, resulting in stomatal closure, osmotic
stress, and consequently a reduction in transpiration, chlorophyll content, and photosynthesis
(Sushmita and Deeksha, 2017). Importance of SMC begins at seed germination; if SMC falls
below the threshold and dry conditions occur within six days of planting, the seeds may not
survive. Available water is also crucial for cell turgidity, growth, and enlargement. The amount
of available water needed is highly dependent on crop type, environmental conditions, and plant
morphology with some species exhibiting greater drought tolerance than others (Nadzirah et al.,
2018).
Similar to other legumes, CT is sensitive to water deficit stress. Sushmita and Deeksha
(2017) exposed CT seed to varying intensities of drought stress and found that maximum
germination was observed under moderate drought stress with a 6.25% increase over the control.
Shoot length, root length, and fresh weight also improved under severe drought stress with
increases of 1.6%, 2.4%, and 3.8%, respectively, over the control (Sushmita and Deeksha, 2017).
Given that soil moisture content can be managed through irrigation applications, assessing how it
can be most effectively applied can be highly significant to CT growth, development, and yield.
34
Taha and Khair (2014) tested three irrigation regimes at intervals of 7 (optimal), 14 (low
stress), and 21 (high stress) days over the course of two experimental seasons. The authors
calculated CT’s water application efficiency (WAE) by dividing the calculated water
requirements by the quantities of water applied and for the 2007 and 2008 seasons, reported
WAE percentages of 84 and 68%, 85 and 77%, and 84 and 90% for the every 7, 14, and 21 day
irrigation rates, respectively. Dry matter yield (DMY) for the 7 (5.5 tons/ha), 14 (4.8 tons/ha),
and 21 (4.9 tons/ha) day irrigation rates were statistically similar and exhibited water
productivity values of 0.92, 0.88, and 1.04 kg/m3, respectively. Water productivity is defined as
the weight of dry matter in one hectare divided by water applied. With no significance between
treatments, the authors concluded that differences were negligible and the 21-day (high stress)
treatment was the economically appropriate choice (Taha and Khair, 2014).
Similarly, Mahfouz et al. assessed three irrigation rates using two experimental cuts over
the span of two growing seasons in their (2020) study previously described in the planting dates
section, categorized as I100% (100% of the calculated allowable soil moisture depletion (ASMD)
replenished through irrigation), I80% (80% ASMD replenished), and I60% (60% ASMD
replenished). CT exposure to drought stress (I60%) resulted in decreases in plant growth, water
status, total chlorophyll, relative water content (RWC), membrane stability index (MSI)), forage
fiber, and yield (cumulative dry forage yield (CDFY) and cumulative protein yield (CPY)) but
increased the leaf/stem ratio (LSR), forage protein content, and water use efficiency (WUE).
Alternatively, fully irrigated plants of the I100% treatment group exhibited the highest leaves/plant
(NL/P), leaf area/plant (LA/P), and plant dry weight (PDW). The I100% treatment level provided
the highest CT forage quality and yield overall and is considered preferable under conditions
with abundant water, especially when combined with an early planting date (PE), but the
35
moderate (I80%) treatment lever could be utilized under water scarcity with comparable yield and
quality (Mahfouz et al., 2020).
Rooting Hormone
Auxins are a class of phytohormones classified by their role in plant growth and
development. Auxins can be applied exogenously to improve rooting where rooting success is
highly dependent on auxin type utilized, compound formulation and concentration, and species
and cultivar. Valued for their extensive utilization history and consistent rooting response,
indole-3-butryic acid (IBA), indole-3-propionic acid (IPA), and 1-naphthalenacetic acid (NAA)
are common auxins utilized in commercial propagation of plants (Boyer and Graves, 2009;
Ludwig-Müller, 2000). Barik et al. (2007) augmented a half-strength MS medium with varying
concentrations of hormones encompassing 0.25, 0.5, and 1.0 mg L−1 of IBA (1.42 - 4.90 μM),
IPA (1.32–5.29 μM), NAA (1.34–5.31 μM), respectively, and a hormone free control to assess
the effect on axillary shoot proliferation in CT.
After 30 days post culture, the hormone free control failed to induce roots from exercised
shoots and therefore inclusion of an auxin in the medium was deemed essential. Among
experimental treatments, a 0.25 mg l −1 IBA application was most effective, inducing 84.8% of
CT shoots into forming roots and with an average of 5.1 roots, 9.7 cm root length, after 21 days
of culture. IBA treatments exhibited better rooting than IPA or NAA at similar concentrations
with 0.25 mg L−1 IBA (84.8%), 0.25 mg L−1 IPA (66.6%), and 0.25 mg L−1 NAA (57.5%), and
rooting decreased with increasing concentration among all three auxins; 0.25 mg L−1 IPA
(66.6%), 0.5 mg L−1 IPA (60.6%), and 1.0 mg L−1 IPA (42.4%). High concentrations of 1.0 mg
L−1 IBA and NAA resulted in callus formation at the shoot base and no rooting was observed.
36
Fertilization
Application of supplemental nutrients, or fertilization, is a widespread practice in
agriculture and horticultural plant production operations to meet the requirements of the crop,
increasing yield and facilitating cultivation in otherwise unsuitable conditions. This is commonly
accomplished through the use of supplemental fertilization, primarily chemical, organic, and
biofertilizers. Chemical fertilizers are any of a category of non-organic fertilizers consisting of
nitrate, phosphate, ammonium, and potassium salts. They carry multiple advantages including
synthetically optimal nutrient concentrations, higher plant bioavailability, and at a cheaper
expense; however, overuse of chemical fertilization can result in water pollution, soil
acidification, loss of soil fertility, and irreparable damage to the crop. Alternatively, organic
fertilizers are derived from vegetable compost and human and animal manure. Being naturally
sourced, their nutrient composition is highly variable, and on average is lower than organic
fertilizers with a slower rate of bioavailability. This slower rate of nutrient availability is
beneficial though; organic fertilizers can contribute to the residual nitrogen (N) and phosphorus
(P) content of the soil, reducing N leaching and P fixation, suppressing disease, increasing root
growth, and stimulating soil biological activity (Nadzirah et al., 2018).
Bakhashwain and Elfeel (2011) assessed CT as affected by different fertilization
treatments: granular NPK fertilizer (18-18-5 + 1.5 MgO), urea (46), diammonium phosphate
(DAP 18-46-0), and an untreated control. They concluded that fertilization had a significant
effect on plant performance and that the granular NPK (10.62 tons/ha dry yield) significantly
increased CT productivity, followed by pure nitrogen applied as urea (9.4 tons/ha), the
diammonium phosphate (8.41 tons/ha), and the untreated control (6.89 tons/ha). Fertilization also
significantly affected forage quality; the granular NPK and diammonium phosphate treatments
exhibited the highest protein and fiber contents followed by urea, and the granular NPK

37
increased the magnesium (Mg), calcium (Ca), and potassium (K) uptake in plant leaves. Finally,
fertilization application had a significant effect on leaf area index (LAI) versus the untreated
control but with less variability between experimental treatments. This is consistent to previous
literature detailing the effect of supplemental nitrogen on dry matter yield and quality
(Bakhashwain and Elfeel, 2011).
Supporting these conclusions, Al-Zamanan et al. (2016) noted that a gradual increase in
plant height and maximum forage production was correlated in CT with increasing dosage of
nitrogen application (0 kg N/ha, 200 kg N/ha, and 400 kg N/ha). Ultimately, they concluded that
the difference in increase observed from application of 200 kg N/ha to that of 400 kg N/ha was
insignificant enough to make the 200 kg N/ha dosage the economically appropriate choice (Al-
Zamanan et al., 2016). Morsy and Awadalla (2017) similarly found that an experimental
application of 30 kg P2O5 significantly increased plant height (88.14 and 91.95 cm), leaves/plant
(64.46 and 83.83), branches/plant (9.11 and 11.31) and plants/m-2 (94.77 and 103.67) when
compared with the untreated control and 60 kg P2O5 treatments for the 1st and 2nd experimental
cut, respectively. The 30 kg P2O5 application treatment also significantly affected forage yield,
increasing fresh forage by 11.38% and 9.45% and 7.03% and 6.50% versus the untreated control
and 60 kg P2O5 application treatments, respectively, and dry forage by 13.33% and 9.02% and
7.84% and 6.21% for the untreated control and 60 kg P2O5 fed-1 application treatments,
respectively. The authors concluded that 30 kg P2O5 application had a better phosphorus
agronomic efficiency (PAE), was significantly more efficient than the 60 kg P2O5 application
treatment, and therefore is the preferred phosphorous fertilization application (Morsy and
Awadalla, 2017).
38
Nitrogen Fixation
Widely introduced to agroforestry systems globally (Oguis et al., 2019), CT can be
utilized for its ability to increase soil fertility and improve yield of subsequent crops (Morsy and
Awadalla, 2017). This is accomplished through its use as a cover crop, green manure crop, and
through atmospheric N2 fixation (Mahfouz et al., 2020; Rojas-Sandoval, 2018). CT roots produce
large nodules for nitrogen fixation (Oguis et al., 2019) and soil nutrient absorption is highly
dependent on the plants ability to modify the pH of the rhizosphere through exudation of organic
acid anions, liberating essential nutrients in more bioavailable forms. Alderete-Chavez et al.
(2011) examined CTs potential to incorporate nitrogen and phosphorous and improve overall soil
fertility. Analysis showed that organic matter (OM; 6.05 to 9.91%), nitrogen (N; 0.3 to 0.48%),
phosphorous (P; 2 to 10.2 mg/g-1), and potassium (K; 0.06 to 0.16 mg/g-1) levels were higher in
soil where CT was cultivated versus a control, comparatively. Increases were highest at 180 days
after planting (DAP) with higher potassium concentrations in the soil post-cultivation. The
authors concluded that CT commonly increased soil mineral content during growth and therefore
improved soil fertility but was highly conditional on cultivation methods (Alderete-Chavez et al.,
2011). Similarly, as a nitrogen-fixing legume CT has a symbiotic relationship with Rhizobium
bacteria and has been cultivated successfully alongside Andropogon gayanus, Cenchrus ciliaris,
Chloris gayana, Dichanthium aristatum, Digitaria eriantha, Megathyrsus maximum, Pennisetum
purpureum, and Sorghum bicolor (Rojas-Sandoval, 2018).
Natural Enemies
CT is tolerant to most serious pest and disease problems with some exceptions (Morris,
2009). Spider mites and whiteflies have been reported in North America while grasshoppers and
leaf-eating caterpillars have been recorded causing crop damage in Australia and Costa Rica. CT
is affected by anthracnose as well as fungal leaf diseases, including Cercospora, Colletotrichum,

39
Oidium, and Rhizoctonia, with Rhizoctonia microsclerotia and Corticium solani reported under
wet conditions in Central America and Africa. It is also vulnerable to the Meloidgyne incognita
root nematode species (Garden, 2020; Rojas-Sandoval, 2018).
CT is also susceptible to viral infection. The clitoria chlorosis virus (CICV) has been
reported in Western Australia and results in chlorosis but without other apparent symptoms.
Clitoria virus Y (CIVY) in Australia exhibits mosaic symptoms on the plant while clitoria yellow
mottle virus (CliYMV) from Northern Australia results in seedlings with chlorotic lesions
followed by leaf tip mottling and mosaic. Within the African continent, clitoria yellow vein virus
(CYVV) in Kenya exhibits systemic vein chlorosis, cowpea chlorotic mottle virus (CCMV) from
Nigeria causes bright yellow mosaic symptoms that occasionally cover the entire leaflet, and
peanut stunt virus (PSV) from Sudan is characterized by green-yellow mottling (Sastry et al.,
2019).
Butterfly Pea (Clitoria ternatea) Flower Extract (BPFE) and Its Use as a pH-Dependent
Natural Colorant
Few traits are as important to the appearance and quality of foods as color; from the deep
red of a ripe apple to the electric blue of a sports drink, color is often one of the first sensory
qualities of a product that the consumer encounters. Because of this, food manufacturers often
add synthetic dyes to their products to simulate or improve desired colors, but research has
shown these dyes can be harmful to humans (Chu et al., 2016) and result in hyperactivity in
children (McCann et al., 2007).
Because of these concerns, there has been growing interest in the discovery and use of
natural colorants, among which blues are rare and tend to be sensitive to processing and storage
conditions (Chu et al., 2016). Extracts of the flowers of the butterfly pea (Clitoria ternatea) can
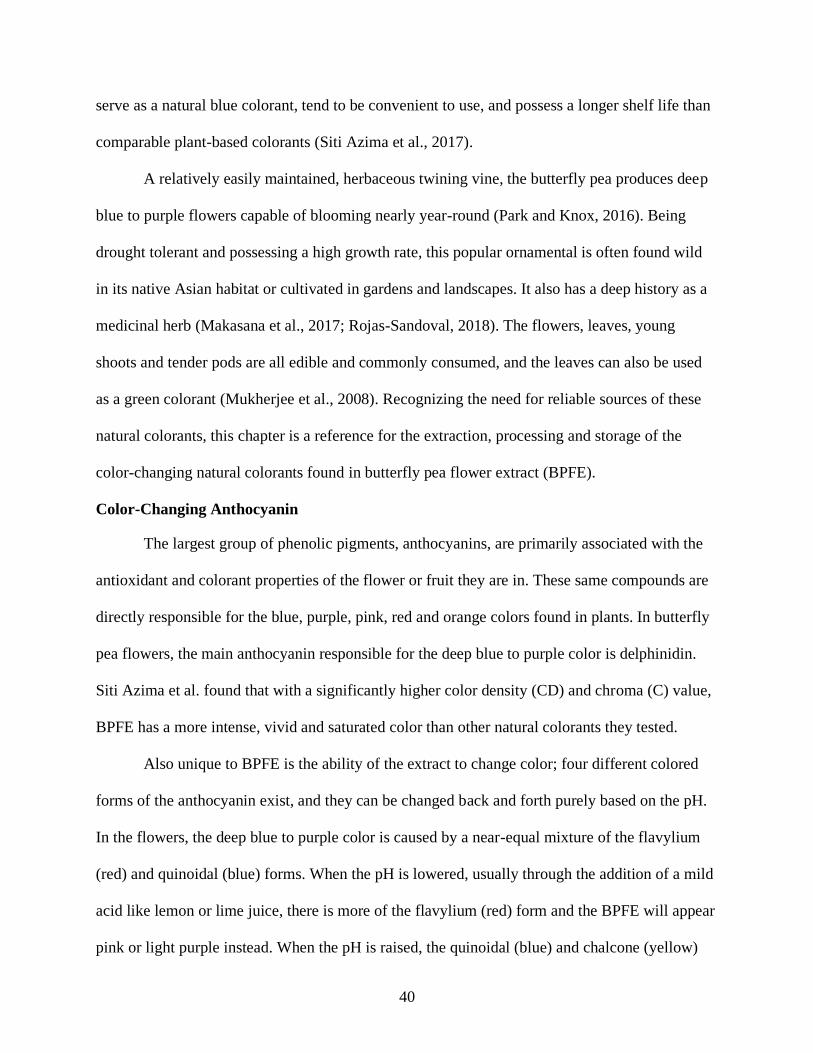
40
serve as a natural blue colorant, tend to be convenient to use, and possess a longer shelf life than
comparable plant-based colorants (Siti Azima et al., 2017).
A relatively easily maintained, herbaceous twining vine, the butterfly pea produces deep
blue to purple flowers capable of blooming nearly year-round (Park and Knox, 2016). Being
drought tolerant and possessing a high growth rate, this popular ornamental is often found wild
in its native Asian habitat or cultivated in gardens and landscapes. It also has a deep history as a
medicinal herb (Makasana et al., 2017; Rojas-Sandoval, 2018). The flowers, leaves, young
shoots and tender pods are all edible and commonly consumed, and the leaves can also be used
as a green colorant (Mukherjee et al., 2008). Recognizing the need for reliable sources of these
natural colorants, this chapter is a reference for the extraction, processing and storage of the
color-changing natural colorants found in butterfly pea flower extract (BPFE).
Color-Changing Anthocyanin
The largest group of phenolic pigments, anthocyanins, are primarily associated with the
antioxidant and colorant properties of the flower or fruit they are in. These same compounds are
directly responsible for the blue, purple, pink, red and orange colors found in plants. In butterfly
pea flowers, the main anthocyanin responsible for the deep blue to purple color is delphinidin.
Siti Azima et al. found that with a significantly higher color density (CD) and chroma (C) value,
BPFE has a more intense, vivid and saturated color than other natural colorants they tested.
Also unique to BPFE is the ability of the extract to change color; four different colored
forms of the anthocyanin exist, and they can be changed back and forth purely based on the pH.
In the flowers, the deep blue to purple color is caused by a near-equal mixture of the flavylium
(red) and quinoidal (blue) forms. When the pH is lowered, usually through the addition of a mild
acid like lemon or lime juice, there is more of the flavylium (red) form and the BPFE will appear
pink or light purple instead. When the pH is raised, the quinoidal (blue) and chalcone (yellow)

41
forms are both present, leading to a green color. This is commonly achieved through the addition
of the spice saffron due to its alkalinity (Chu et al., 2016). This relationship is demonstrated in
Figure 1-12, with examples in Figure 1-13.
Extraction
In order to utilize the BPFE, the natural colorant must first be extracted from the plant
material. A variety of factors affect the overall extractable yield, or the percentage of desired
compounds that are derived from original plant material, but the primary ones are the choice of
solvent or liquid medium, extraction temperature, extraction duration and the ratio of extractable
solids (flowers) to solvent volume. Various procedures exist for the extraction of plant material,
and traditionally direct addition of a powdered form of the dried flowers into food is most
common. For the purposes of this publication, only procedures that can be safely performed at
home on either fresh or dried flowers and that yield an edible liquid extract will be discussed.
At its most basic, plant extraction involves separation of desired portions of the plant
material from the inactive or undesired components, primarily through the use of a liquid
solvent. In their study looking at extraction parameters on the quality of BPFE, Makasana et al.
found that maximum solvent extraction efficiency was achieved by using a hybrid solvent,
specifically alcohol mixed into water. Increased contact between the surface area of the plant
material and the solvent is caused by a swelling of the plant matrix by the water, which increases
the extractability of the alcohol. At 40% (80 proof), 50% (100 proof) and 75.5% (151 proof)
alcohol by volume (ABV) respectively, vodka and other higher-proof spirits make appropriate
solvents fitting these criteria, depending on the desired final application. High-concentration
alcohol, such as 95% (190 proof) grain alcohol, should be avoided because it does not contain
enough water to be an effective solvent. For a non-alcoholic alternative, pure water (0% ABV)
may be used (Figure 1-14).

42
Extraction temperature is also an important factor affecting extractable yield, and by
assessing a range of different temperatures, the authors were able to determine that extractable
yield gradually increases as the temperature is raised from 100°F (~40°C) to 175°F (~80°C),
with a maximum at 175°F (~80°C) before declining at higher temperatures. The increase in
extraction with increasing temperature is likely due to increased molecular agitation; addition of
heat results in more energy, and as the molecules move around more in response to the increased
energy, they are more likely to come in contact with the solvent and thus be extracted. Above
175°F (~80°C), the compounds being extracted are damaged by heat, decreasing overall yield.
Also, ethanol will boil and vaporize at 173°F (~78°C), which can cause the proportion of alcohol
to water to become reduced. Therefore, in order to maximize extractable yield, temperatures up
to 170°F (~77°C) should be used.
Extraction duration, or more specifically the amount of time the plant material is left in the
solvent, is the next important consideration when discussing BPFE extraction efficiency and
maximizing extractable yield. Extraction durations of 15 to 150 minutes were tested. Sixty
minutes was found to be optimal. Extractions < 60 minutes produced lower extract yield,
whereas extractions > 60 minutes led to decreased BPFE quality.
The final consideration when performing BPFE extraction is the ratio of extractable solids to
solvent, more commonly referred to as the solid-to-liquid ratio. This is important primarily
because it ensures that both ingredients, the butterfly pea flowers as well as the extractable
solvent, are used in the most efficient way possible. Studying the extraction process using a
series of solid-to-liquid ratios expressed as grams per milliliter (g/mL) from 1:5 to 1:30, or 1 g of
flowers to 5 mL of the solvent for 1:5, the authors concluded that the extractable yield increased
as the solid-to-liquid ratio was lowered from 1:5 to 1:20 g/mL. As the amount of solvent

43
compared to plant material is increased, the solvent’s ability to dissolve the plant material is
improved, which maximizes the extractable yield. Below 1:20 g/mL the extractable yield no
longer increases, so the extra use of solvent makes these solid-to-liquid ratios less efficient and
therefore more expensive.
Overall, it is recommended that in order to maximize extractable yield from fresh or dried
butterfly pea flowers and yield an edible liquid extract (BPFE) that can be safely produced at
home, a hybrid solvent of alcohol in water (i.e., 40% ABV (80 proof) vodka) should be used at
170°F (~77°C) for a duration of 60 minutes and at a solid-to-liquid ratio of 1:20 g/mL (Makasana
et al., 2017). While this procedure will produce a BPFE with the highest levels of color-
containing compounds, this will often be too strong for most applications, requiring too much
acid to be added before the color will change. If this is the case, dilute the BPFE with more
solvent until it reaches the desired color and concentration. It should also be noted that when
using commercially available spirits as the solvent, some alcohol will likely be consumed in the
process and should be done so responsibly and in accordance with state and federal laws.
Storage and Processing
Once the BPFE has been produced with a maximized extractable yield, several variables
affect storage and processing. Given recent concerns about the use of synthetic food colors and
their effect on human health, natural blue colorants such as BPFE have become popular
alternatives for food manufacturers. Unfortunately, thermal and pH conditions that natural blue
colorants are exposed to during storage and processing often cause them to change colors or
flavors in a way that makes them unusable. BPFE tends to be stable to these conditions while
maintaining its bright color.
Anthocyanins, such as those found in the BPFE, are sensitive to high heat. Storage of
these compounds at elevated temperatures leads to increased concentrations of chalcone

44
(yellow), resulting in a faded brown color. This is commonly observed in red wine, another
potent source of anthocyanin. Butterfly pea flower extract, on the other hand, has a significantly
higher color density (CD) than other natural colorants tested, likely because of high amounts of
certain pigment (color) compounds. It is these pigments that also give BPFE its stability during
storage and processing in high temperatures.
As presented earlier, BPFE and its associated anthocyanins are heavily influenced by pH
of the surrounding solution, primarily when it comes to the color of the extract. At its normal pH
(6.0–8.0) the deep blue to purple color is caused by a near equal mixture of the flavylium (red)
and quinoidal (blue) forms of anthocyanin, but going outside of that normal pH range can cause
undesired color changes in the finished product. Flour commonly contains bleaching agents such
as benzoyl peroxide, which can oxidize and discolor certain anthocyanins, making them unusable
in most baked goods. This color change is measured as the indices of polymeric color (PC), or
the stability of the colorant towards bisulphite reaction. With a higher PC than other natural
colorants tested, BPFE shows strong potential for being used in applications where it is exposed
to storage and processing pH changes (Siti Azima et al., 2017).
While discussing the effects of storage and processing conditions on the color and quality
of BPFE, it is also important to mention the potential protective properties of sucrose, a.k.a.
sugar. When sugar is added to the BPFE at its normal pH and heat is applied, the sucrose
molecules take up space in the mixture, binding to the water molecules. The less water that is
available, the less damage the heat can do to the anthocyanin. Therefore, the more sugar added,
the less water available, and the less damage done. This same principle can be applied to pH
changes, though sugar’s protective ability is less effective for pH extremes than temperature.
While the addition of sugar does help maintain the BPFE at its normal pH and associated deep

45
blue to purple color, it is not strong enough to prevent it from changing to pink or green at lower
or higher pHs, respectively. So, while it does not completely prevent changes, addition of sugar
to BPFE can help preserve its color and quality during storage and processing conditions (Chu et
al., 2016).
Antioxidant and Other Benefits
When talking about consuming any plant-based extract, it is also important to discuss the
different benefits and effects the associated compounds can have. A major issue for dental
health, Streptococcus mutans is a primary cause of dental problems due to its ability to colonize
on teeth and form plaque, leading to the development of oral diseases. When applied to these
bacteria, a low dose (0.06 mg/ml) of BPFE effectively inhibited up to 70% of their growth,
showing it has antibacterial capability (Yanti et al., 2018).
A natural part of the metabolic process, the body produces damaging byproducts in the
form of reactive oxygen species, or ROS. While normal in regular amounts, excess quantities of
these ROS can lead to cancer, cardiovascular disease, diabetes, aging and other ailments.
Compounds with antioxidant properties such as anthocyanins have been found to eliminate these
ROS, helping to prevent or delay the associated effects (Makasana et al., 2017). Furthermore, it
has been shown that consuming small quantities of BPFE can significantly increase the body’s
natural antioxidant ability, known as plasma antioxidant capacity. When consumed in the
presence of sugar, BPFE has been shown to improve post-meal glucose and insulin levels, and
diabetic rats that were then fed the BPFE for three weeks had significantly lower serum sugar
levels afterwards (Chusak et al., 2018; Mukherjee et al., 2008).
Conclusion
Recent trends towards enhanced public awareness in the environmental implications of
food, beverages, cosmetics and pharmaceuticals coupled with health concerns associated with
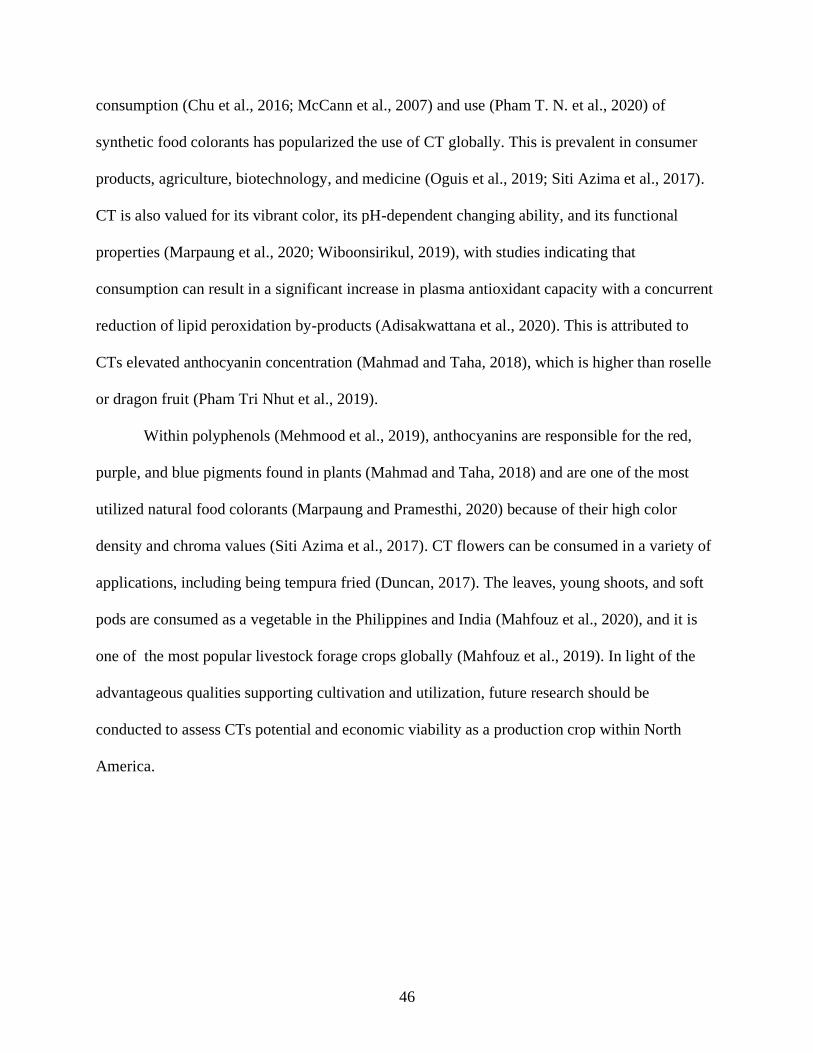
46
consumption (Chu et al., 2016; McCann et al., 2007) and use (Pham T. N. et al., 2020) of
synthetic food colorants has popularized the use of CT globally. This is prevalent in consumer
products, agriculture, biotechnology, and medicine (Oguis et al., 2019; Siti Azima et al., 2017).
CT is also valued for its vibrant color, its pH-dependent changing ability, and its functional
properties (Marpaung et al., 2020; Wiboonsirikul, 2019), with studies indicating that
consumption can result in a significant increase in plasma antioxidant capacity with a concurrent
reduction of lipid peroxidation by-products (Adisakwattana et al., 2020). This is attributed to
CTs elevated anthocyanin concentration (Mahmad and Taha, 2018), which is higher than roselle
or dragon fruit (Pham Tri Nhut et al., 2019).
Within polyphenols (Mehmood et al., 2019), anthocyanins are responsible for the red,
purple, and blue pigments found in plants (Mahmad and Taha, 2018) and are one of the most
utilized natural food colorants (Marpaung and Pramesthi, 2020) because of their high color
density and chroma values (Siti Azima et al., 2017). CT flowers can be consumed in a variety of
applications, including being tempura fried (Duncan, 2017). The leaves, young shoots, and soft
pods are consumed as a vegetable in the Philippines and India (Mahfouz et al., 2020), and it is
one of the most popular livestock forage crops globally (Mahfouz et al., 2019). In light of the
advantageous qualities supporting cultivation and utilization, future research should be
conducted to assess CTs potential and economic viability as a production crop within North
America.

47
Figure 1-1. Butterfly pea (C. ternatea) flower, leaves, and vine in an open-sided rainout shelter
in Apopka, FL. Photo credit: Sean M. Campbell, UF/IFAS.
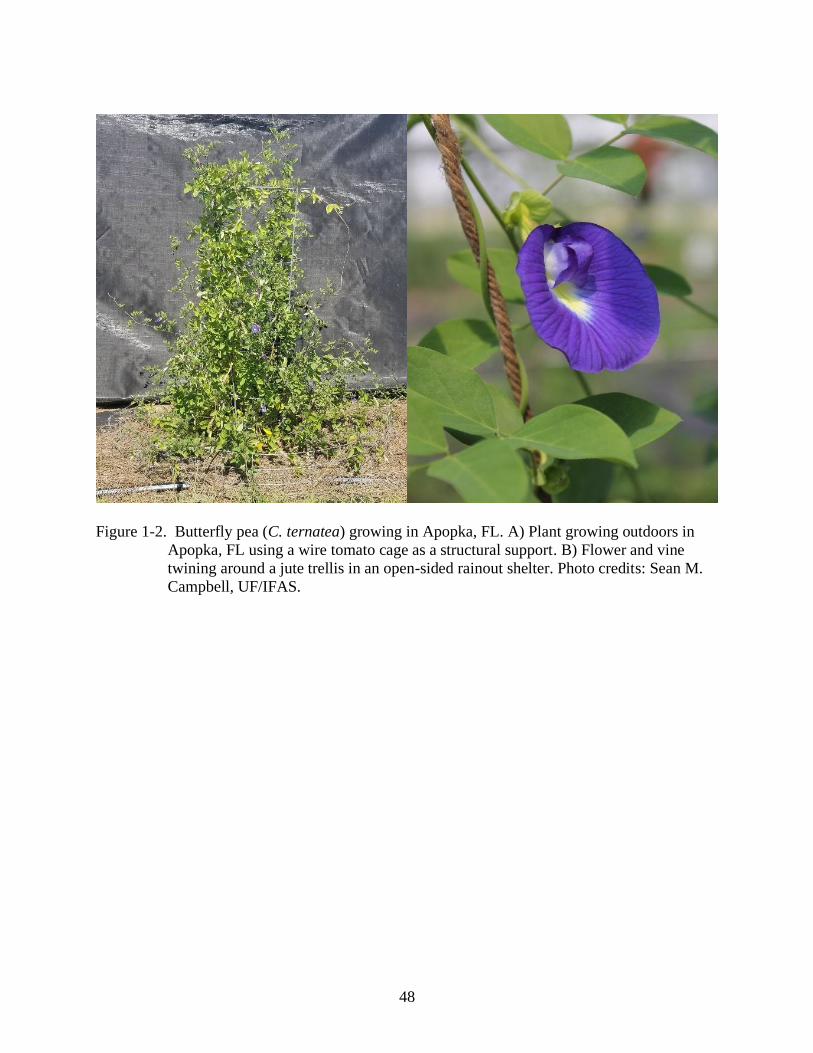
48
Figure 1-2. Butterfly pea (C. ternatea) growing in Apopka, FL. A) Plant growing outdoors in
Apopka, FL using a wire tomato cage as a structural support. B) Flower and vine
twining around a jute trellis in an open-sided rainout shelter. Photo credits: Sean M.
Campbell, UF/IFAS.

49
Figure 1-3. Butterfly pea (C. ternatea) leaf. A) Five leaflets. B) Seven leaflets. Photo credits:
Sean M. Campbell, UF/IFAS.
Figure 1-4. Butterfly pea (C. ternatea) flower colors. A) Deep blue to purple single headed. B)
Deep blue to purple double headed. C) Light blue single headed. D) Light blue double
headed. E) White single headed. F) White double headed. G) Mauve single headed.
H) Mauve double headed. Seed: AmeriSeed, Lompoc, CA. Photo credits: Sean M.
Campbell, UF/IFAS.
(A) (B)
(A) (B) (C) (D)
(E) (F) (G) (H)

50
Figure 1-5. Butterfly pea (C. ternatea) seeds and pods. A) Pods through progression from bright
green upon maturity, to mottled brown upon senescence, and finally dehiscence, or
shattering. B) Seeds transitioning from mottled green to black as they traverse the
same developmental stages. Photo credits: Sean M. Campbell, UF/IFAS.
(A)
(B)

51
Figure 1-6. Butterfly pea (C. ternatea) roots. A) Three-weeks old. B) Three-month old plant,
featuring the stout taproot with few branches and multiple slender, lateral roots. Photo
credits: Sean M. Campbell, UF/IFAS.
(A)
(B)

52
Figure 1-7. Butterfly pea (C. ternatea) global distribution map. Photo credit: Compiled by the
Global Mapper project within the Discover Life (https://www.discoverlife.org/)
program of the National Biological Information Infrastructure (http://www.nbii.gov).

53
Figure 1-8. Butterfly pea (C. ternatea) North America distribution map. Based on vouchered
plant specimens from wild populations; Cultivated occurrences are not mapped.
Photo credit: Natural Resources Conservation Service www.nrcs.usda.gov.

54
Figure 1-9. Butterfly pea (C. ternatea) radical and seedling. A) Radical emerging from the seed
coat in rockwool substrate. B) Seedling with cotyledon and developing foliage leaves.
Photo credits: Sean M. Campbell, UF/IFAS.
(A) (B)

55
Figure 1-10. 36-count plug trays of germinated butterfly pea (C. ternatea) seedlings on the final
day of experimental Trial 1. Three each for the rockwool and soilless substrate
treatments, of the 70, 80, and 90 °F (21.1, 26.7, and 32.2 °C; (°F - 32) ÷ 1.8 = °C)
substrate temperature treatments. 23 September 2018. Photo credits: Sean M.
Campbell, UF/IFAS.
70 °F 80 °F 90 °F R
ock
wool
Soil
less
subst
rate

56
Figure 1-11. Butterfly pea (C. ternatea) growing along vertical and horizontal support trellis in
an open-sided rainout shelter in Apopka, FL. Photo credit: Sean M. Campbell,
UF/IFAS.

57
Figure 1-12. The four main forms of anthocyanins at varying pH. Photo credit: (Chu et al.,
2016).
Figure 1-13. Butterfly pea (C. ternatea) flower extract at normal, lowered, and raised pH. A)
Lowered pH (saffron, green). B) Normal pH (blue). C) Raised pH (lime, purple).
Photo credit: Sean M. Campbell, UF/IFAS.
A)
B)
C)
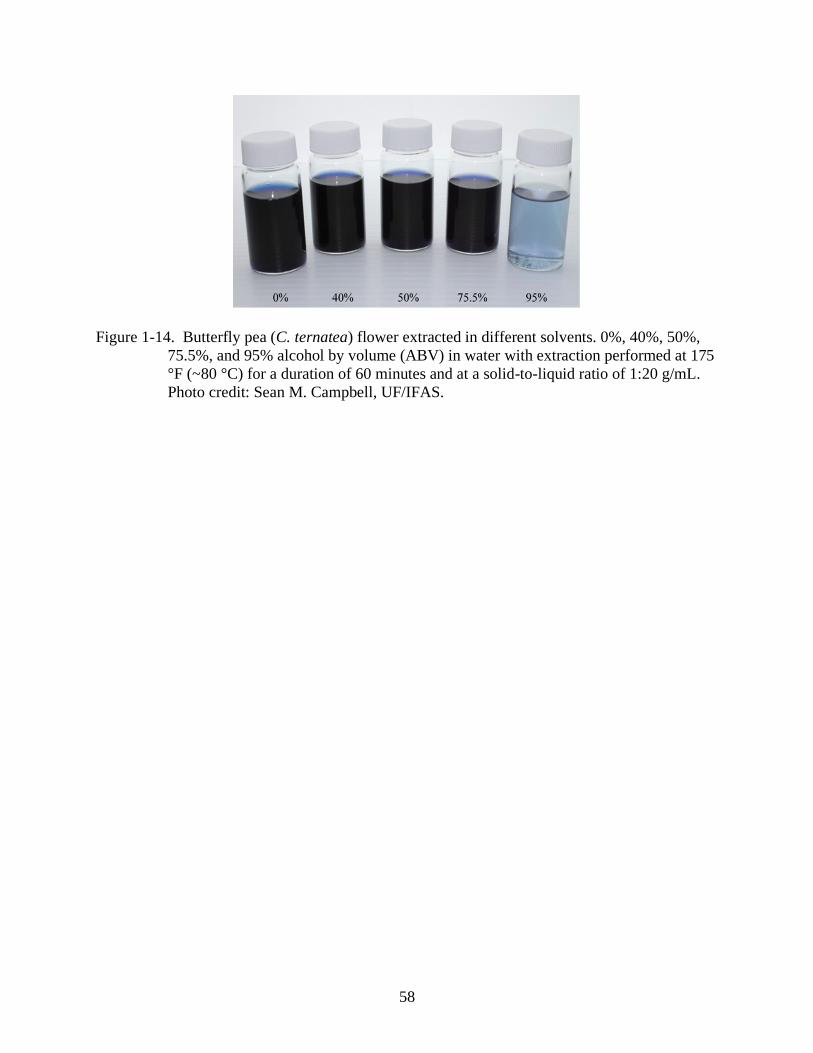
58
Figure 1-14. Butterfly pea (C. ternatea) flower extracted in different solvents. 0%, 40%, 50%,
75.5%, and 95% alcohol by volume (ABV) in water with extraction performed at 175
°F (~80 °C) for a duration of 60 minutes and at a solid-to-liquid ratio of 1:20 g/mL.
Photo credit: Sean M. Campbell, UF/IFAS.

59
CHAPTER 2
INFLUENCE OF SUBSTRATE TYPE AND TEMPERATURE ON GERMINATION OF
BUTTERFLY PEA
Originated in the Asian tropics, butterfly pea is a herbaceous, perennial leguminous
twiner that has become naturalized in the East and West Indies, South and Central America, and
India and China (Barik et al., 2007; Morris, 2009; Park and Knox, 2016). Flowers are deep blue
to purple, and once dried, butterfly pea flower extract can be used as a traditional food colorant
with a longer shelf life and greater ease of use than synthetic blue colorants (Siti Azima et al.,
2017). Recent health concerns associated with consumption of synthetic food colorants (Chu et
al., 2016; McCann et al., 2007) will likely further popularize the use of butterfly pea in food and
beverage preparation, especially in the United States where recent increased interest in this plant
and its applications have already been documented (Simonson, 2016).1
Butterfly pea is a heavy seeder, with between 6 and 3400 total seeds per plant produced
from an assay of 19 varying accessions of butterfly pea. This high seeding rate has led to
germination from seed as the primary method of propagation for butterfly pea (Figure 2-1)
(Morris, 2009). High levels of plant available water are important for butterfly pea seedlings,
with literature recommending field seeding following a rainfall event (650 - 1250 mm) and when
the possibility for a follow-up rain is likely (Collins and Grundy, 2005). More accurately, Das et
al. (2017) determined the inherent moisture content of butterfly pea seeds to be 6.8%, and while
that can be altered to between 5% and 12% with no negative effects, germinability was
maximized at 10% seed moisture content. This is often accomplished through scarification, or a
compromising of the seed coat. Nagar and Meena (2015) found that either physical (abrasion
1 Campbell, S.M., B.J. Pearson and S.C. Marble, 2020. Influence of Substrate Type and Temperature on
Germination of Butterfly Pea. HortTech. 30(3):398-403. https://doi.org/10.21273/HORTTECH04583-20

60
with sandpaper) or chemical (soaking in sulfuric acid) scarification methods can increase
germination by 70.5% versus a control (Makasana et al., 2016).
Research examining the influence of temperature on germination success has been
evaluated for butterfly pea; however, conflicting observations over the optimal germination
temperature (To) appear in literature. Selvamaleeswaran et al. (2011) found that exposing
butterfly pea seed to temperatures of 16, 28, 30 and 35 °C resulted in germinability rates of 56%,
60%, 65% and 20%, indicating a peak To of 30 °C and a drastic reduction in germination at 35
°C. This reduction was likely caused by thermoinhibition, or the inability of seeds to germinate
at elevated temperatures. Similarly, McDonald (2002) evaluated butterfly pea seed germination
at temperatures between 8 and 44 °C, with peak germination between 24 and 28 °C and a rapid
decrease in germinability above or below that range. Thermoinhibition was again observed at the
highest imposed temperature treatment (≥ 40 °C). Mean germination rate followed a similar
trend, increasing proportionally with increased substrate temperature from 8 to 28 °C,
maximizing at the To of 32 °C, then declining between 36 to 40 °C. Differences in observations
reported by Selvamaleeswaran et al. (2011) and McDonald (2002) were likely caused by their
use of cotton and paper, respectively, as germination media.
Given conflicting responses to imposed temperature treatments and a lack of research
examining seed germination in commonly utilized commercial media, research examining the
influence of substrate composition and temperature on germination of butterfly pea is needed for
commercial plant production. To address this need, six germination metrics were measured and
recorded for seed of butterfly pea in two varying common commercial germination media
subjected to one of three temperature treatments. Results from this work will provide plant

61
producers and growers with critical information necessary to successfully germinate butterfly
pea.
Materials and Methods
Seed
Three different trials were performed using the same experimental design, one each per
week across the span of three weeks beginning on 17 Sept. and ending on 8 Oct. 2018. For each
trial, 216 butterfly pea seeds were harvested from a single plant, grown in a 100 × 48 ft. gutter-
connected greenhouse with 30% light reducing polycarbonate paneling located in Apopka, FL
(lat. 28.64°N, long. 81.55°W). On 17 Sept., 24 Sept. and 1 Oct., day 0 per experimental trial,
seeds for each trial were scarified mechanically using a razor blade according to the procedure
described by Mackay (2001) before being soaked in deionized water (DI) water for 24 h.
Substrate Type
Two different substrate types were utilized for the experiment, soilless substrate mix
[30% pine bark, 48% peat, 10% perlite and 12% vermiculite; (Fafard 4P; Sun Gro Horticulture,
Agawam, MA)] and rockwool (Grodan, Roermond, The Netherlands). On 18 Sept., 25 Sept. and
2 Oct., day 1 per experimental trial, three 36-count soilless substrate plug trays were made by
cutting 72-count plug trays (1.5 inches long × 1.5 inches wide × 2.25 inches high) in half. The
trays were then filled with soilless substrate, and each plug was seeded with a single scarified
and soaked butterfly pea seed ~0.25 inch under the soils surface. Three 36-count rockwool cube
sheets were also prepared by cutting 98-count rockwool cube sheets (1.5 inch3), soaking them for
30 min in water adjusted to pH 5.5 using a pH down buffering solution (General Hydroponics,
Sebastopol, CA), and then seeding with the scarified and soaked butterfly pea seeds. The six
substrate sheets were placed into a propagation unit located within a laboratory environment.
62
Substrate Temperature
The propagation unit utilized in this experiment consisted of a multi-tier shelfed structure
(Compact SunLite 3-Tier Garden; Gardener's Supply Company, Burlington, VT), with each of
the three shelves equipped with a 7.5 inch vented humidity dome (HydroFarm, Petaluma, CA), a
10 × 20.75 inch heat mat (Vivosun, Shanghai, China), fluorescent lighting (T5; Sunblaster,
Langley, BC, Canada) and a mini thermo-hygrometer (Mondi, Vancouver, BC, Canada) to
measure environmental conditions within each dome. A digital hygrometer and temperature
monitor (AcuRite, Lake Geneva, WI) was placed on the exterior of the propagation unit to record
ambient environmental conditions, with mean temperatures and humidity of 73 °F (56%) and 73
°F (55.5%), respectively, for Trials 2 and 3 (data for Trial 1 was unavailable). Heating mats were
programmed to maintain substrate temperatures of 70, 80, and 90 °F for the three experimental
substrate temperature treatments imposed in the study. Top and side vents of the humidity domes
were fully closed to maintain a constant humidity level. Lights were positioned ~2 inches from
the top of the dome, providing illumination between 55 and 90 µmol·m-2·s-1 at the outer corners
and the center of the substrate sheet, respectively, throughout the duration of the experiment.
Each of the six substrate sheets had approximately 25 mL of water applied daily utilizing a
laboratory wash bottle (Thermo Fisher Scientific, Waltham, MA).
Germination Parameters
Six germination parameters were collected, calculated and reported throughout the
experiment per the procedures outlined by Ranal et al. (2009). These included: germination
capacity (G), mean germination time (MT), coefficient of variation of the germination time
(CVt), mean germination rate (MR), uncertainty of the germination process (U) and synchrony of
the germination process (Z). G, also referred to as germinability, is characterized as the binary
response of whether a fully formed cotyledon is visible above the substrate surface at the end of

63
observations (germinated/non germinated). That qualitative value was then converted into a
quantitative attribute, percentage (%), for the entire treatment group for statistical analysis and
reporting. MT is the mean of the germination time per day, weighted by the number of seeds
germinated per data measurement time interval (days). Mean germination time provided a
quantifiable assessment of the average amount of time necessary for maximum germination of an
experimental group. Use of the weighted mean for this measurement accounts for variance in the
number of seeds germinated per time interval. The CVt was a measurement of the variability in
relation to the MT, allowing for additional comparisons independent of the mean germination
time magnitude.
Calculated as the reciprocal of MT, the MR quantified germination rate increases and
decreases in relation to 1/MT rather than MT alone. U was a measurement of the degree of
uncertainty associated with the frequency and distribution of germination within an experimental
group. Since germination of only one seed can change U, this measurement value quantified the
degree of spread of germination as influenced by temporal factors. Conversely, Z represents the
degree of overlap that existed during germination and is only produced when two or more seeds
finished germination within the same time interval (Ranal et al., 2009).
Experimental Design
The experiment was organized as a 2 × 3 factorial in a completely randomized design,
with substrate type and substrate temperature assigned as independent variables. Three replicates
were cultivated for each treatment combination, one per experimental trial. Substrate temperature
(°F), vented humidity dome interior temperature (°F) and humidity (%), and ambient laboratory
temperature (°F) and humidity (%) were recorded daily for the portions of Trial 1 (20 – 23
Sept.), Trial 2 (26 Sept. – 1 Oct.) and Trial 3 (3 – 8 Oct.) where germination was taking place
(Table 2-1). Substrate temperatures (°F) for Trial 1 (a), Trail 2 (b) and Trail 3 (c) were

64
significant (P = <0.01), signified by the different significance letters. Germination parameters
were analyzed based on a collected response than reported as percentages, and a restricted
maximum likelihood mixed model analysis was performed on the data collected from the 36
germinated seeds per experimental trial (JMP® Pro 14; SAS Institute, Cary, NC) with post-hoc
mean separation tests performed using Tukey’s honest significant difference test by germination
trial with variance within treatment combination replicates defined as the random error term.
Statistical tests were considered significant if P ≤ 0.05.
Results
Temperature and Humidity
With some notable exceptions, the substrate temperature, vented humidity dome interior
temperature and humidity and ambient laboratory temperature and humidity were all consistent
within expectations, as measurements correlated positively with the increasing experimental
temperature treatments. While the mean interior temperature was higher for the 80 °F treatment
than the 70 °F for Trial 3, this measurement is considered secondary to substrate temperature,
which is a more accurate representation of the experimental treatment being applied. These
inconsistencies were likely caused by fluctuations in the activity of the heating mats, which are
attached to a controller which uses a thermometer placed into the substrate to regulate activation
and duration in order to maintain the desired substrate temperature.
Germination Parameters
No significant interactions existed between substrate temperature and type for any of the
six germination parameters, thus the main effects of substrate temperature and substrate type
were analyzed separately as independent factors (Table 2-2). Differences for germination
capacity (G) were observed for substrate type (P = 0.03), with rockwool (91.7%) resulting in
greater germination compared with the soilless substrate (83.6%). G values of 70 °F (92.6%), 80
65
°F (88.4%) and 90 °F (81.9%) for the substrate temperature treatment groups indicate no
significant difference, but that germination capacity was decreased with rising substrate
temperature (Table 2-2; Figure 2-2).
Similar trends were observed for the MT, CVt and MR parameters, with differences noted
among substrate temperature and substrate type treatments. The MT of the substrate temperature
treatments decreased as the temperature was raised from 70 °F (2.2 d) to 80 °F (1.9 d) to 90 °F
(1.7 d) with P = 0.01, while rockwool (2.1 d) had a slower germination rate than the soilless
substrate (1.8 d) treatment (P = 0.01). From this, a trend between higher MT values and
increased G values was noted, further reinforced by the MT values for the substrate temperature
by substrate type interaction effect; the 70 °F rockwool (2.3 d), 80 °F rockwool (2 d) and 70 °F
soilless substrate (2 d) experimental treatments had the highest G values at 98, 92 and 87%,
respectively.
Increased variation was observed within CVt values as the substrate temperature was
raised for the 70 °F (20.4%), 80 °F (27.4%) and 90 °F (37.7%) treatments (P < 0.01), while
substrate type affected the CVt values of the rockwool (23.6%) and soilless substrate (33.4%)
treatments with P = 0.01. This would indicate that lower levels of variation result in higher G
values, again supported by the CVt values for the substrate temperature by substrate type
interaction effect; the 80 °F rockwool (19.4%) and 70 °F rockwool (19.8%) treatments were the
most uniform, followed by 70 °F soilless substrate (21.1%).
Finally, as substrate temperature was increased so were the MR values for the 70 °F (0.47
d-1), 80 °F (0.53 d-1) and 90 °F (0.60 d-1) treatments (P = 0.03). Substrate type was similarly
affected for the rockwool (0.49 d-1) and soilless substrate (0.58 d-1) treatments (P = 0.03).
Following the same trend as MT, a longer germination time and resulting lower germination rate
66
exhibited the highest G values; the 70 °F rockwool (0.44 d-1) treatment combination had the
lowest germination rate, followed by 70 °F soilless substrate (0.49 d-1) and 80 °F rockwool (0.49
d-1).
While the uncertainty of the germination process (U) and the synchrony of the
germination process (G) responded similarly to treatments, observed trends offer insights into
factors influential to the germination of butterfly pea. Lower U values indicate that germination
was more concentrated in time; the rockwool and soilless substrate treatments had U values of
0.88 and 1.12, respectively, while higher Z value exhibited by rockwool (0.64) as compared to
the soilless substrate (0.54) treatment identified a higher degree of germination overlap. Similar
trends were observed for substrate temperature with U values of 0.82, 0.99 and 1.19 and Z values
of 0.66, 0.60 and 0.51 for the 70, 80 and 90 °F treatments, respectively.
Discussion
In the context of seed germination parameters, To is defined as the temperature at which
maximal G is observed. This is often achieved in the shortest MT and with the highest MR.
Reductions in seed G are observed when substrate temperature falls below (sub-optimal, < To) or
exceeds (supra-optimal, > To) the To at a rate proportional to the absolute value of the difference.
This occurs until either the lowest (base substrate temperature, Tb) or highest (ceiling substrate
temperature, Tc) temperatures where germination can proceed are reached, resulting in
thermoinhibition. While these phenological events and their underlying physiology are well
documented, there is some contest over the definition of To, primarily whether it’s a distinct
temperature or rather a range of temperatures (Watt and Bloomberg, 2012).
Four of the six germination parameters (G, MT, CVt and MR) were optimized when
seeds were germinated in rockwool, with a more consistent germinability when compared to
those germinated in soilless substrate. Our results indicate that rockwool is a superior

67
germination media to the soilless substrate mix for butterfly pea seeds, likely due to superior
porosity and water holding capacity of the rockwool, more consistency due to its manufacturing
process, a lack of competitive organisms, or a combination of the three factors (Allaire et al.,
2005). This also supports conclusions by Collins and Grundy (2005) that butterfly pea requires
high levels of available water during germination and seedling stages.
Similar trends with observed among for the substrate temperature independent variable,
with differences among three of the six germination parameters (MT, CVt and MR). Considering
the relationship theorized between G values and increasing substrate temperature, it can be
concluded that butterfly pea produces a higher percentage of viable, germinated seeds in a more
consistent amount of time and at a more consistent rate when substrate temperature is decreased
from 90 °F to 80 °F to 70 °F, respectively (Figure 2-3).
This is consistent with To values presented in the literature. McDonald (2002) concluded
that the To was between 24 °C and 28 °C, with G declining drastically at sub- or supra-optimal
temperatures. While our observed To is lower than values reported by McDonald (2002), the
temperature at which thermoinhibition occurred was similar. Differences in To values between
studies was likely due to the difference in substrates utilized; McDonald relied upon moist seed-
test filter paper in 9 cm petri dishes to achieve germination. In their review, Olle et al. (2012)
determined that when Grodan rockwool is saturated and then allowed to drain completely by
gravitational pull, the remaining slab will contain 5% rockwool fibers, 15% pore space and 80%
water. The authors concluded that this ratio of water, or nutrient solution, to air promotes
vigorous root growth.
Conclusions
Although faster germination and therefore a lowered MT is often desired to reduce
production time in commercial plant cultivation operations, this can lead to uneven or retarded

68
emergence and a lack of cultivation consistency. Given a high priority on uniformity, results
suggest commercial germination of butterfly pea is maximized when the rockwool substrate is
used at a substrate temperature of approximately 70 °F. This is further confirmed by G values for
the substrate temperature by substrate type interaction effects, where the 70 °F rockwool, 80 °F
rockwool and 70 °F soilless substrate treatment combinations exhibited the highest numbers of
viable, germinated seeds at 98%, 92% and 87%, respectively. While substrate temperature and
type were both shown to significantly influence germination success of butterfly pea, the
influence of other commercial production parameters not evaluated in this study may be
important.

69
Table 2-1. Recorded substrate temperature (°F), vented humidity dome interior temperature (°F)
and humidity (%) for trials 1, 2 and 3 of the 70, 80, and 90 °F (21.1, 26.7, and 32.2
°C) substrate temperature treatments.
Temperature
(°F) Treatment
Recorded Substrate
Temperature (°F)
Interior
Temperature (°F) Interior Humidity (%)
Trial
1
Trial
2
Trial
3
Trial
1
Trial
2
Trial
3
Trial
1
Trial
2
Trial
3
70 °Fz 75.7y 77.4 77.5 75.2 76.6 76.5 66.7 68.8 65.5
80 °F 80.6 80.8 80.6 75.7 76.6 75.6 67.7 71.0 69.2
90 °F 82.8 82.8 83.7 79.2 78.6 77 70.5 69.8 71.2 z (°F - 32) ÷ 1.8 = °C. y Mean of environmental parameters collected daily for Trial 1 (20 - 23 Sept.), Trial 2 (26
Sept. – 1 Oct.) and Trial 3 (3 – 8 Oct.).
Figure 2-1. Butterfly pea (C. ternatea) propagation from seed. A) Seed pods remaining on the
vine from the previous year’s growth. B) Seeds after being removed from the dried
seed pods described. C) Seven-day old butterfly pea seedlings in soilless substrate
under a vented humidity dome. Photo credits: Sean M. Campbell, UF/IFAS.
A) B) C)

70
Table 2-2. Germination parameters for the substrate temperature (70, 80 and 90 °F) independent
variables, the rockwool and soilless substrate (SS) independent variables and the
temperature × substrate interaction effect for butterfly pea seeds.
Temperature
(°F)z × Substrate
G (%)y MT (d) CVt (%) MR (d-1) U Z
P = 0.77x P = 0.93 P = 0.15 P = 0.65 P = 0.36 P = 0.17
70 °F Rockwool 98.15 a 2.29 a 19.82 a 0.44 a 0.79 a 0.64 a
70 °F SSw 87.04 a 2.04 a 21.06 a 0.49 a 0.84 a 0.68 a
80 °F Rockwool 91.67 a 2.04 a 19.42 a 0.49 a 0.74 a 0.73 a
80 °F SS 85.19 a 1.74 a 35.37 a 0.58 a 1.25 a 0.46 a
90 °F Rockwool 85.19 a 1.86 a 31.66 a 0.54 a 1.12 a 0.56 a
90 °F SS 78.70 a 1.54 a 43.74 a 0.67 a 1.27 a 0.46 a
Temperature (°F) P = 0.07 P = 0.01* P < 0.01* P = 0.03* P = 0.13 P = 0.19
70 °F 92.59 a 2.16 a 20.44 b 0.47 b 0.82 a 0.66 a
80 °F 88.43 a 1.89 ab 27.40 b 0.54 ab 0.99 a 0.60 a
90 °F 81.94 a 1.70 b 37.70 a 0.60 a 1.19 a 0.51 a
Substrate P = 0.03* P = 0.01* P = 0.01* P = 0.02* P = 0.11 P = 0.12
Rockwool 91.67 a 2.07 a 23.63 b 0.49 b 0.88 a 0.64 a
SS 83.64 b 1.77 b 33.39 a 0.58 a 1.12 a 0.54 a z (°F - 32) ÷ 1.8 = °C. y G = Mean germination capacity; MT = Mean germination time; CVt = Coefficient of
variation of the germination time; MR = Mean germination rate; U = Uncertainty of the germination process; Z =
Synchrony of the germination process. x * = Significance at P ≤ 0.05; means (n = 36 per experimental trial) within
column with the same letter are not significantly different (P ≤ 0.05; Tukey’s honest significant difference test).
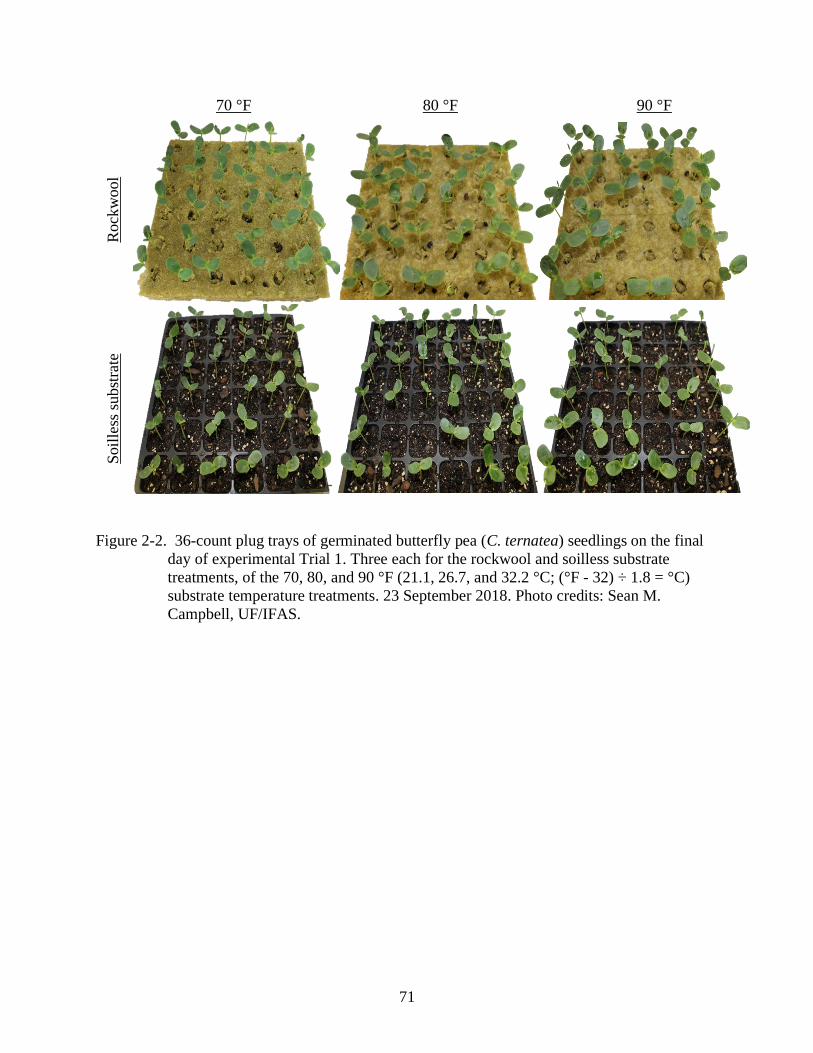
71
70 °F 80 °F 90 °F R
ock
wool
Soil
less
subst
rate
Figure 2-2. 36-count plug trays of germinated butterfly pea (C. ternatea) seedlings on the final
day of experimental Trial 1. Three each for the rockwool and soilless substrate
treatments, of the 70, 80, and 90 °F (21.1, 26.7, and 32.2 °C; (°F - 32) ÷ 1.8 = °C)
substrate temperature treatments. 23 September 2018. Photo credits: Sean M.
Campbell, UF/IFAS.
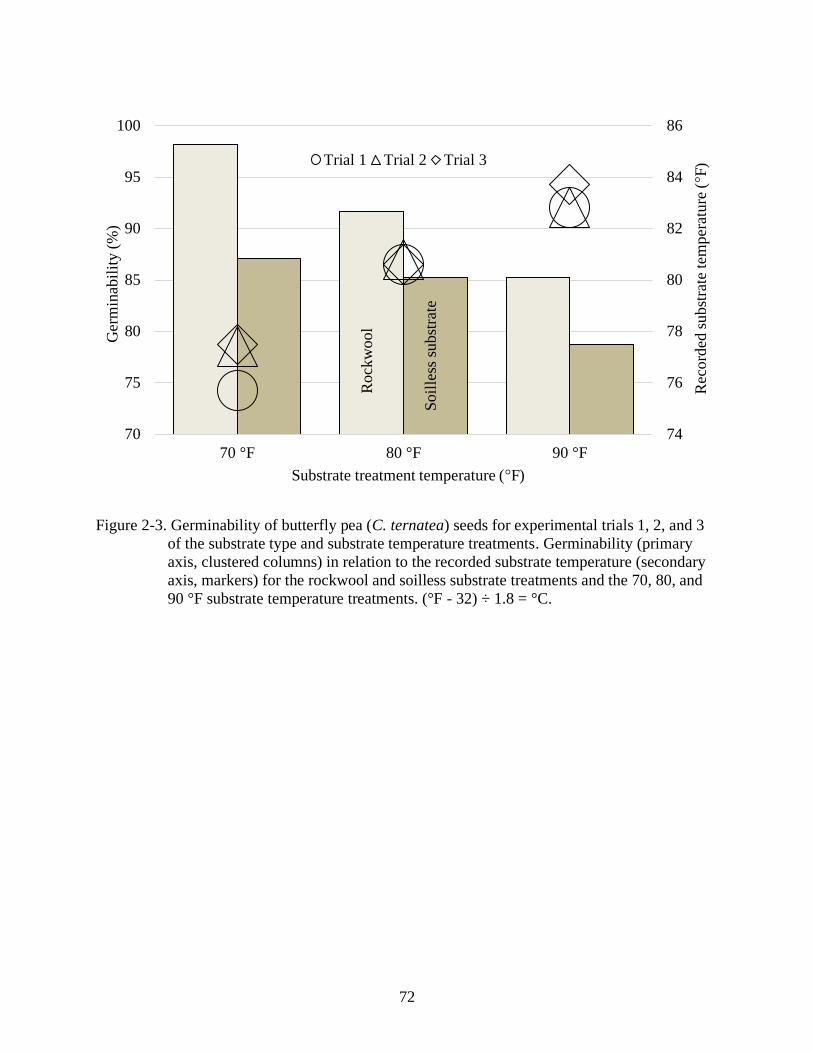
72
Figure 2-3. Germinability of butterfly pea (C. ternatea) seeds for experimental trials 1, 2, and 3
of the substrate type and substrate temperature treatments. Germinability (primary
axis, clustered columns) in relation to the recorded substrate temperature (secondary
axis, markers) for the rockwool and soilless substrate treatments and the 70, 80, and
90 °F substrate temperature treatments. (°F - 32) ÷ 1.8 = °C.
Rock
wool
Soil
less
subst
rate
74
76
78
80
82
84
86
70
75
80
85
90
95
100
70 °F 80 °F 90 °F
Rec
ord
ed s
ubst
rate
tem
per
ature
(°F
)
Ger
min
abil
ity (
%)
Substrate treatment temperature (°F)
Trial 1 Trial 2 Trial 3
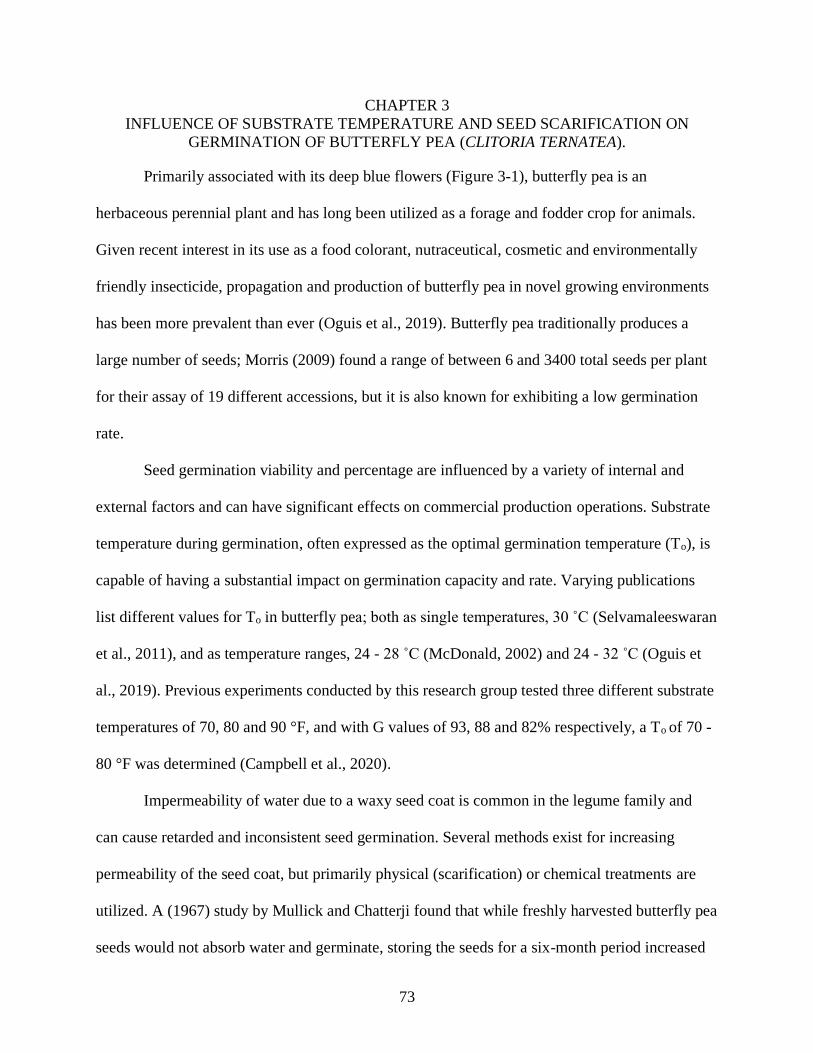
73
CHAPTER 3
INFLUENCE OF SUBSTRATE TEMPERATURE AND SEED SCARIFICATION ON
GERMINATION OF BUTTERFLY PEA (CLITORIA TERNATEA).
Primarily associated with its deep blue flowers (Figure 3-1), butterfly pea is an
herbaceous perennial plant and has long been utilized as a forage and fodder crop for animals.
Given recent interest in its use as a food colorant, nutraceutical, cosmetic and environmentally
friendly insecticide, propagation and production of butterfly pea in novel growing environments
has been more prevalent than ever (Oguis et al., 2019). Butterfly pea traditionally produces a
large number of seeds; Morris (2009) found a range of between 6 and 3400 total seeds per plant
for their assay of 19 different accessions, but it is also known for exhibiting a low germination
rate.
Seed germination viability and percentage are influenced by a variety of internal and
external factors and can have significant effects on commercial production operations. Substrate
temperature during germination, often expressed as the optimal germination temperature (To), is
capable of having a substantial impact on germination capacity and rate. Varying publications
list different values for To in butterfly pea; both as single temperatures, 30 ˚C (Selvamaleeswaran
et al., 2011), and as temperature ranges, 24 - 28 ˚C (McDonald, 2002) and 24 - 32 ˚C (Oguis et
al., 2019). Previous experiments conducted by this research group tested three different substrate
temperatures of 70, 80 and 90 °F, and with G values of 93, 88 and 82% respectively, a To of 70 -
80 °F was determined (Campbell et al., 2020).
Impermeability of water due to a waxy seed coat is common in the legume family and
can cause retarded and inconsistent seed germination. Several methods exist for increasing
permeability of the seed coat, but primarily physical (scarification) or chemical treatments are
utilized. A (1967) study by Mullick and Chatterji found that while freshly harvested butterfly pea
seeds would not absorb water and germinate, storing the seeds for a six-month period increased

74
germination capacity by 15 - 20%. Chemical treatment with sulfuric acid has been shown to be
effective in butterfly pea, but it can result in seedling damage, and ultimately in yellowing of the
resulting cotyledons (Makasana et al., 2016). Mishra et al. (2006) found that mechanical
scarification of butterfly pea seed through removal of the seed tip with shears resulted in a 30%
increase in germination capacity (G) over the control, while Mackay et al. (2001) increased
germination from < 5 to 97% in bush lupine (L. arboreus) by nicking the seed coat with a razor
blade. To aid in production of butterfly pea from seed, the influence of substrate temperature and
seed scarification technique on germination parameters in butterfly pea seed was assessed.
Materials and Methods
Seed Scarification
Two trials were performed of the same experimental design, one from 14 - 19 March and
one from 17 - 22 April 2019. For each trial, 252 butterfly pea seeds were harvested from a single
plant grown in a 100 × 48 ft. gutter-connected greenhouse with 30% light reducing
polycarbonate paneling, located in Apopka, FL (lat. 28.64°N, long. 81.55°W). On 14 March and
17 April the seeds for each experiment trial were treated with one of three experimental seed
scarification treatments described by Mackay (2001); either physical scarification with a small
nick to the seed coat using a razor blade (Scar.), physical scarification with the razor blade before
a 24 hour soak in deionized water (DI) water (S&S), and a control that wasn’t scarified or
soaked.
Substrate
Previous experiments conducted by this research group determined that rockwool
(Grodan, Inc., Roermond, Netherlands) exhibited a higher germination capacity than soilless
substrate at 92 and 84% respectively, and therefore rockwool was utilized for both trials
(Campbell et al., 2020). On 15 March and 18 April, eighteen 14-count rockwool cube sheets

75
were prepared by cutting 98-count cube (1.5 inch3) sheets into six pieces, discarding the excess.
These were soaked for 30 min. in water adjusted to pH 5.5 using a pH down buffering solution
(General Hydroponics Inc., Sebastopol, CA, United States) before a single butterfly pea seed was
seeded into each plug ~0.25 inch below the substrate surface. The eighteen substrate sheets were
then placed into a propagation unit, six per substrate temperature treatment, as described below.
Substrate Temperature
The propagation unit utilized in this experiment consists of a multi-tier shelfed structure
(Compact SunLite 3-Tier Garden; Gardener's Supply Company, Burlington, VT, United States),
with each of the three shelves equipped with a 7.5 inch vented humidity dome (HydroFarm,
Petaluma, CA, United States), 10 x 20.75 inch heat mat (Vivosun, ShangHai, China), fluorescent
lighting (T5; Sunblaster, Langley, BC, Canada) and a mini thermo-hygrometer (Mondi,
Vancouver, BC, Canada) to measure environmental conditions within each humidity dome. A
digital hygrometer and temperature monitor (AcuRite, Lake Geneva, WI, United States) was
placed on the exterior of the propagation unit to record ambient environmental conditions, with
mean temperatures and humidity of 72.3 °F (53%) and 72 °F (50%) for Trials 1 and 2,
respectively. Heating mats were programmed to maintain 70, 75, and 80 °F for the three
experimental substrate temperature treatments imposed in the study. Top and side vents of the
humidity domes were fully closed to maintain a constant humidity level. Lights were positioned
~2 inches from the top of the dome, providing illumination between 55 and 90 µmol·m-2·s-1 at
the outer corners and the center of the substrate sheet respectively throughout the duration of the
experiment, and were run continuously throughout the duration of the experiment. Each of the
substrate sheets had approximately 50 mL of water applied each day utilizing a laboratory wash
bottle (Thermo Fisher Scientific Inc., Waltham, MA).

76
Germination Parameters
Six germination parameters, as described by Ranal et al. (2009), were recorded and
calculated throughout the experiment. Germination capacity (G), also referred to as
germinability, is characterized as the binary response of whether a fully formed cotyledon is
visible above the substrate surface at the end of observations (germinated/non-germinated). That
qualitative value is then converted into a quantitative attribute, percentage (%) for the entire
treatment group, for statistical analysis and reporting. Mean germination time (MT) is the mean
of the germination time, weighted by the number of seeds germinated per data measurement time
interval (days). Mean germination time provides a quantifiable assessment of the average amount
of time necessary for maximum germination of an experimental group. Use of the weighted
mean for this measurement accounts for variance in the number of seeds germinated per time
interval. The coefficient of variation of germination time (CVt) is a measurement of the
variability in relation to the MT, allowing for additional comparisons independent of the mean
germination time magnitude.
Calculated as the reciprocal of the MT, the mean germination rate (MR) quantifies
germination rate increases and decreases in relation to 1/MT rather than MT alone. Uncertainty
of the germination process (U) is a measurement of the degree of uncertainty associated with the
frequency and distribution of germination within an experimental group. Since only one seed
germinating can change U, this measurement value quantifies the degree of spread of
germination as influenced by temporal factors. Conversely, the synchrony of the germination
process (Z) represents the degree of overlap that exists during germination and is only produced
when two or more seeds finish germination within the same time interval (Ranal et al., 2009).

77
Experimental Design
The experiment was organized as a 2 × 3 factorial in a completely randomized design,
with substrate temperature and seed scarification assigned as independent variables. Four
replicates were cultivated for each treatment combination, two per experimental trial, for a total
of 36 experimental units. Heating mat temperature (°F), vented humidity dome interior
temperature (°F) and humidity (%) and ambient laboratory temperature (°F) and humidity (%)
were recorded daily for the portions of the trial where active germination was taking place, a
total of six measurements each for Trial 1 (14 - 19 March) and Trial 2 (17 - 22 April) (Table 3-
1). Germination parameters were analyzed based on a collected response then reported as
percentages, and a restricted maximum likelihood mixed model analysis was performed on the
data collected from the 14 germinated seeds per experimental trial using JMP® Pro 14 (SAS;
Cary, NC) with post-hoc mean separation tests performed using Tukey’s honest significant
difference test by germination trial with variance within treatment combination replicates defined
as the random error term. Statistical tests were considered significant if P ≤ 0.05.
Results
No significance was observed within the substrate temperature and seed scarification
interaction effect, so the substrate temperature and seed scarification independent variables were
analyzed separately (Table 3-2). G values for the substrate temperature independent variable
lacked difference, but a negative relationship was observed between increasing substrate
temperature and the associated G values, with 54.8, 50.0 and 48.8% for the 70, 75 and 80 °F
treatments, respectively. Conversely, the scarified and soaked treatment exhibited a higher
germination capacity (80.9%) than the scarified (45.8%) and control (26.8%) groups for the seed
scarification independent variable (P < 0.01) (Figures 3-2 and 3-3). This is supported by the
substrate temperature by seed scarification interaction effect; the 70 °F S&S, 75 °F S&S, and 80

78
°F S&S treatments had maximal germination at 82.1%, 82.1% and 78.6% respectively (Figure 3-
4).
Differences were also observed within the MT and MR parameters for the substrate
temperature and seed scarification independent variables. MT values decreased with increasing
substrate temperature for the 70 (2.61 d), 75 (2.41 d), and 80 °F (2.04 d) substrate temperature
experimental treatments (P = 0.02), while the scarified and soaked (2.06 d) and the scarified
(2.48 d) treatment groups had lower MT values than the control (2.52 d) for the seed scarification
independent variable (P = 0.04). MT values for the interaction effect support these results; with
the exception of the 80 °F Control group (2.13 d), the 80 °F S&S (1.71 d), 75 °F S&S (2.20 d),
and 70 °F S&S (2.29 d) treatments had the shortest mean germination times.
The reciprocal to MT, MR values rose with the increasing substrate temperatures for the
70 (0.39 d-1), 75 (0.44 d-1) and 80 (0.52 d-1) substrate temperature treatments (P = 0.01).
Similarly, the scarified and soaked treatment group (0.51 d-1) had a faster germination rate than
the scarified (0.41 d-1) or control (0.42 d-1) groups for the seed scarification independent variable
(P = 0.02). Again, with the exception of the 80 °F Control treatment group, the 80 °F S&S (0.60
d-1), 75 °F S&S (0.49 d-1), and 70 °F S&S (0.44 d-1) had the highest mean germination rates.
The final germination parameters CVt, U and Z lacked significance. With an observed
increase in CVt values with increasing substrate temperature, the 70 °F (26.3%) treatment group
had less variability in germination than the 75 (32.9%) or 80 °F (35.8%) groups. This is less
consistent with the seed scarification independent variable, where the scarified (27.9%) treatment
group had more variability than the scarified and soaked (37.7%) or control (29.3%) groups.
Less association is found in the U and Z parameters; the only values consistent with the trends
observed among the other germination parameters are the Z values of the seed scarification

79
variable, with the scarified and soaked (0.47) group showing higher synchrony than the scarified
(0.40) or control (0.29) groups.
Discussion
With lower MT values and higher MR values representing a shorter duration and faster
rate for germination, differences observed in the MT and MR parameters of the substrate
temperature variable indicate that the 70 °F treatment group had a longer germination time and
slower germination rate than the 75 or 80 °F groups. Similarly, while substrate temperature
lacked significance in the G parameter, the 70 °F treatment produced the highest percentage of
viable seedlings followed by the 75 and 80 °F treatments. This To is slightly lower than those
found in published literature which is likely explained by differences in recording substrate vs.
air temperature measurements. While other publications measured the atmospheric temperature
and used that to make assumptions about the substrate, this publication used heating mats with
integrated thermostats to ensure consistent substrate temperatures (McDonald, 2002;
Selvamaleeswaran et al., 2011).
Differences were also observed for the G, MT and MR parameters of the seed
scarification variable; the scarified and soaked experimental treatment produced a higher
percentage of viable, germinated seeds than the scarified or the control treatment groups. The
scarified and soaked treatment group also had lower MT and higher MR values than the scarified
or control groups, indicating that germination was accomplished in a shorter time and at a faster
rate. This conclusion is more consistent with the published literature; it is well established that
butterfly pea seeds have a hard seed coat and require either dormancy or mechanical/chemical
scarification to promote germination (Oguis et al., 2019), with Mishra et al. (2006) reporting that
mechanical scarification in butterfly pea resulted in a 30% increase in G values over the control.

80
Considering MT is a quantifiable value relating to the average time for maximum germination,
theoretically more optimal germination conditions should result in a shorter germination period
and minimal MT value. As the reciprocal, optimal germination conditions should then also mean
a faster average germination rate and maximal MR value. However, when considered in the
context of the germination capacities, a different trend emerges, with a direct relationship
between increasing germination capacity and mean germination time and rate for the substrate
temperature variable and the inverse for the seed scarification variable. This is further supported
by the substrate temperature and seed scarification interaction effect; with the exception of the 80
°F Control (28.6%, 2.13 d) group, the 70 °F S&S (82.1%, 2.29 d), 75 °F S&S (82.1%, 2.20 d),
and 80 °F S&S (78.6%, 1.71 d) treatment groups had the highest G values and lowest MT values
respectively. Similarly, with the exception of the 80 °F Control (28.6%, 0.50 d-1) treatment
group, the 70 °F S&S (82.1%, 0.44 days-1), 75 °F S&S (82.1%, 0.49 days-1), and 80 °F S&S
(78.6%, 0.60 days-1) treatment groups had both the highest G and MR values.
Conclusion
With a surge of interest in butterfly pea use in a wide variety of applications, the need to
maximize germination viability of butterfly pea seeds during production has become increasingly
crucial. Considering the experimental variables of substrate temperature and seed scarification
independently, trends begin to emerge. While both variables had experimental treatments that
resulted in maximized germination capacities, they do so with opposite relationships to the MT
and MR parameters. The 70 °F substrate temperature independent variable reached maximal
germination (54.8%) at the highest mean germination time (2.61 d) and slowest mean
germination rate (0.39 d-1), with the scarified and soaked seed scarification treatment reached
maximal germination (80.9%) at the lowest mean germination time (2.06 days) and fastest mean
germination rate (0.51 d-1).

81
Regardless of these conflicting trends, it can be concluded that optimal germination can
be obtained in butterfly pea seeds through mechanical scarification by nicking the seed coat with
a razor blade before soaking the seed for 24 hours, and by germinating the seeds in rockwool
maintained at an optimal substrate temperature (To) of 70 °F. Future research will be conducted
to assess the effects of other environmental factors, in combination with substrate temperature
and seed scarification, on maximizing germination in butterfly pea.

82
Table 3-1. Recorded substrate temperature (°F), vented humidity dome interior temperature (°F)
and humidity (%) for experimental trials 1 and 2 of the 70, 75 and 80 °F (21.1, 23.9
and 26.7 °C) substrate temperature treatments.
Temperature (°F)y
Treatment
Recorded Substrate
Temperature (°F)
Interior
Temperature (°F) Interior Humidity (%)
Trial 1 Trial 2 Trial 1 Trial 2 Trial 1 Trial 2
70 °F 24.2x 24.8 23.6 25..3 62.8 54.7
75 °F 24.4 25 23.6 25.3 62.2 55.3
80 °F 26.8 26.2 75 25.6 63.3 59.3 z(°F - 32) ÷ 1.8 = °C. xMean of the six environmental parameters collected daily for Trial 1 (14 - 19 March) and
Trial 2 (17 - 22 April).
Figure 3-1. Butterfly pea (C. ternatea) propagation from seed. A) Seed pods remaining on the
vine from the previous year’s growth. B) Seeds after being removed from the dried
seed pods described. C) Seven-day old butterfly pea seedlings in soilless substrate
under a vented humidity dome. Photo credits: Sean M. Campbell, UF/IFAS.
A)
B) C)

83
Table 3-2. Germination parameters for the 70, 75 and 80 °F (21.1, 23.9 and 26.7 °C) substrate
temperature (°F) independent variables, the scarified, scarified and soaked and control
seed scarification independent variables and the substrate temperature (°F) by seed
scarification interaction effect for butterfly pea (Clitoria ternatea) seeds.
Temperature (°F)z
× Scarification
G (%)x MT (d) CVt (%) MR (d-1) U Z
P = 0.71w P = 0.79 P = 0.12 P = 0.77 P = 0.81 P = 0.75
70 °F Control 26.8 a 2.74 a 32.2 a 0.37 a 1.05 a 0.21 a
70 °F Scar. y 55.4 a 2.81 a 24.0 a 0.36 a 1.17 a 0.41 a
70 °F S&S 82.1 a 2.29 a 22.6 a 0.44 a 0.99 a 0.55 a
75 °F Control 25.0 a 2.68 a 26.3 a 0.39 a 0.91 a 0.32 a
75 °F Scar. 42.9 a 2.34 a 31.5 a 0.43 a 1.22 a 0.36 a
75 °F S&S 82.1 a 2.20 a 40.8 a 0.49 a 1.40 a 0.35 a
80 °F Control 28.6 a 2.13 a 29.4 a 0.50 a 1.02 a 0.34 a
80 °F Scar. 39.3 a 2.29 a 28.4 a 0.44 a 1.17 a 0.44 a
80 °F S&S 78.6 a 1.71 a 49.6 a 0.60 a 1.12 a 0.50 a
Temperature (°F) P = 0.53 P = 0.02* P = 0.14 P = 0.01* P = 0.84 P = 0.67
70 °F 54.8 a 2.61 b 26.3 a 0.39 b 1.07 a 0.66 a
75 °F 50.0 a 2.41 ab 32.9 a 0.44 b 1.18 a 0.60 a
80 °F 48.8 a 2.04 a 35.8 a 0.52 a 1.10 a 0.51 a
Scarification P < 0.01* P = 0.04* P = 0.12 P = 0.02* P = 0.54 P = 0.18
Control 26.8 c 2.52 b 29.3 a 0.42 b 0.99 a 0.29 a
Scar. 45.8 b 2.48 a 27.9 a 0.41 b 1.19 a 0.40 a
S&S 80.9 a 2.06 a 37.7 a 0.51 a 1.17 a 0.47 a z (°F - 32) ÷ 1.8 = °C. y Scar. = Scarified; S&S = Scarified and soaked. x G = Mean germination capacity; MT =
Mean germination time; CVt = Coefficient of variation of the germination time; MR = Mean germination rate; U =
Uncertainty of the germination process; Z = Synchrony of the germination process. w * = Significance at P ≤ 0.05;
means (n = 36 per experimental trial) within column with the same letter are not significantly different (P ≤ 0.05;
Tukey’s honest significant difference test).
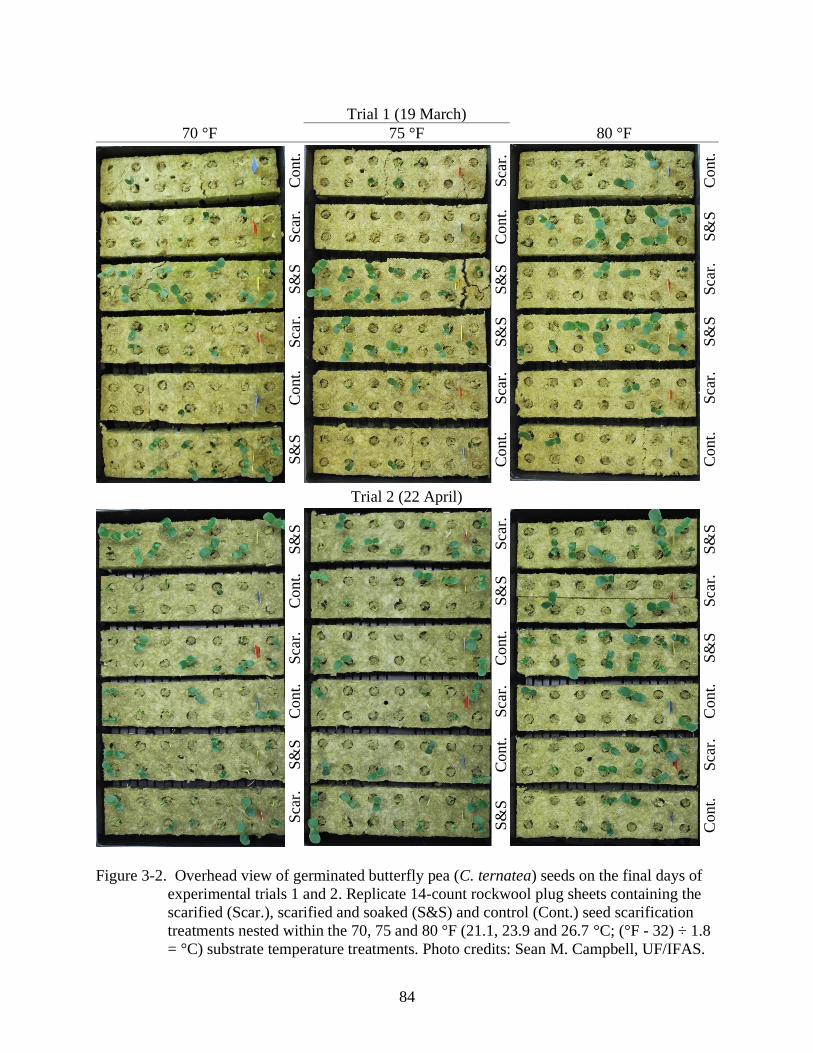
84
Figure 3-2. Overhead view of germinated butterfly pea (C. ternatea) seeds on the final days of
experimental trials 1 and 2. Replicate 14-count rockwool plug sheets containing the
scarified (Scar.), scarified and soaked (S&S) and control (Cont.) seed scarification
treatments nested within the 70, 75 and 80 °F (21.1, 23.9 and 26.7 °C; (°F - 32) ÷ 1.8
= °C) substrate temperature treatments. Photo credits: Sean M. Campbell, UF/IFAS.
Trial 1 (19 March)
70 °F 75 °F 80 °F
Cont.
Sca
r.
Cont.
Sca
r.
Cont.
S&
S
S&
S
S&
S
Sca
r.
Sca
r.
S&
S
S&
S
Cont.
Sca
r.
Sca
r.
S&
S
Cont.
Cont.
Trial 2 (22 April)
S&
S
S
car.
S&
S
Cont.
S&
S
Sca
r.
Sca
r.
Cont.
S&
S
Cont.
Sca
r.
Cont.
S&
S
Cont.
Sca
r.
Sca
r.
S&
S
Cont.

85
Figure 3-3. Germinability (%) of butterfly pea (C. ternatea) seeds for the substrate temperature
and seed scarification independent variable treatments. A) 70, 75, and 80 °F (21.1,
23.9 and 26.7 °C; (°F - 32) ÷ 1.8 = °C) substrate temperature independent variable
treatments. B) Scarified and soaked (S&S), scarified (Scar.), and control seed
scarification independent variable treatments.
54.8 50.0 48.840.0
42.0
44.0
46.0
48.0
50.0
52.0
54.0
56.0
58.0
60.0
70° 75° 80°
Ger
min
abil
ity (
%)
Substrate Temperature
A)
26.8 45.8 80.90.0
10.0
20.0
30.0
40.0
50.0
60.0
70.0
80.0
90.0
100.0
Control Scar. S&S
Ger
min
abil
ity (
%)
Seed Scarification
B)
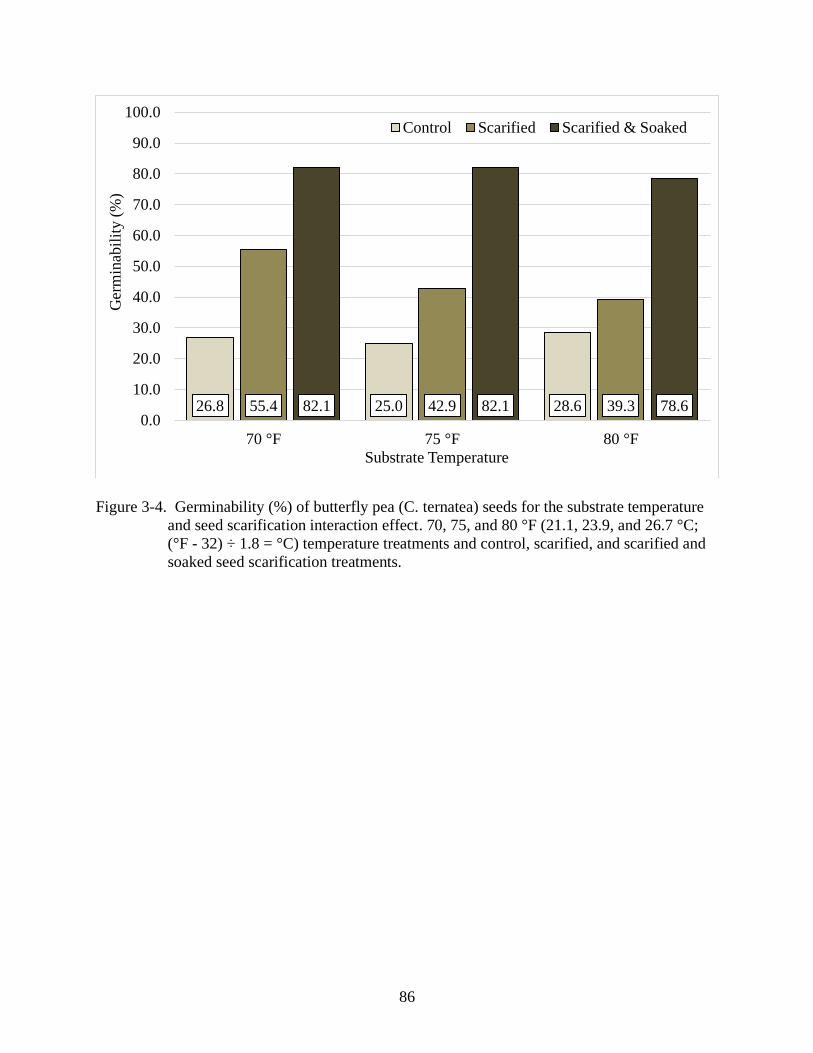
86
Figure 3-4. Germinability (%) of butterfly pea (C. ternatea) seeds for the substrate temperature
and seed scarification interaction effect. 70, 75, and 80 °F (21.1, 23.9, and 26.7 °C;
(°F - 32) ÷ 1.8 = °C) temperature treatments and control, scarified, and scarified and
soaked seed scarification treatments.
26.8 25.0 28.655.4 42.9 39.382.1 82.1 78.60.0
10.0
20.0
30.0
40.0
50.0
60.0
70.0
80.0
90.0
100.0
70 °F 75 °F 80 °F
Ger
min
abil
ity (
%)
Substrate Temperature
Control Scarified Scarified & Soaked
87
CHAPTER 4
GROWING STRUCTURE AND ITS EFFECT ON FLOWER PRODUCTION IN
BUTTERFLY PEA (CLITORIA TERNATEA)
With a warm humid climate and 100 million annual visitors, tourism contributes more
than $112 billion to state and local economies within Florida each year. Similar to trends
observed in other states, the number of farms in Florida featuring recreational or educational
experiences, also known as agritourism operations, rose from 281 in 2007 to 724 in 2012 (Henry
and Stofer, 2017; Rumble et al., 2018). Florida’s legislature defines agritourism as “any
agricultural related activity consistent with a bona fide farm, livestock operation, or ranch or in a
working forest which allows members of the general public, for recreational, entertainment, or
educational purposes, to view or enjoy activities.” In 2017, the Florida Department of
Agriculture and Consumer Services (FDACS) reported that the state had 172 farmers’ markets,
121 registered U-Pick farms, and 38 distilleries or wineries, all of which are included in that
definitional categorization (Rumble et al., 2018). Support for growth of agrotourism in Florida
was documented in a 2016 study that determined residents visiting agritourism operations
wanted to learn about the source, production, history and health of their food, i.e. nutrition and
food safety (Stofer and Rumble, 2018).
A perennial, herbaceous member of the Fabaceae family, butterfly pea has historically
been cultivated for forage animals. This is primarily due to its livestock palatability and
adaptability to different climates and growing conditions. As a nitrogen-fixating legume it’s
capable of increasing soil fertility, and as an ornamental it has been widely introduced to
agroforestry systems around the globe, often planted along fence rows as a structural support for
vertical growth (Morsy and Awadalla, 2017; Rojas-Sandoval, 2018). Recently, butterfly pea has
seen a rise in popularity due to literature elucidating its potential applications as a medicine and
pH-dependent natural food colorant (Oguis et al., 2019).
88
Butterfly pea flowers are commonly light blue, dark blue, white, or mauve, due to
differences in the chemical structure of the associated colored compounds (Figure 4-1). The wild
type utilized for this experiment features dark blue bilateral flowers, resulting primarily from the
elevated levels of an antioxidant, anthocyanins (Kazuma et al., 2003). These anthocyanins are
also responsible for butterfly pea flowers unique pH-dependent color changing ability, changing
their structure based on the pH of the environment. While blue at its native pH, an extract of the
butterfly pea flower will turn red and magenta under acidic conditions, as the modified chemical
structure of the anthocyanin begins to absorb these higher wavelengths of light in the color
spectrum. Alternatively, addition of a base will cause the extract to turn green as yellow and blue
wavelengths are absorbed. While this color change may be visually pleasing, use of an extract of
the butterfly pea flower as a natural food colorant could also have physical, biochemical and
nutritional implications (Kungsuwan et al., 2014; Oguis et al., 2019).
Given its ability to be utilized for both agricultural and tourism applications, the pH-
dependent natural colorant, butterfly pea, is an ideal candidate for widespread production and use
within Florida. With most of the value residing in the flowers, choosing the growing system that
results in the highest flower yield is crucial. Unfortunately, most available literature assessing
flower production and yield as a function of growing, trellis or training system is limited to
fruiting plants. This publication aims to further investigate this relationship, using three novel
growing structures and an unsupported control to assess their effect on flower count and mass in
butterfly pea.
Materials and Methods
Plant Propagation
Seeds used for the study were harvested from a single butterfly pea plant grown in a 30.5
x 14.6 m, 30% light reducing polycarbonate paneling, gutter-connected greenhouse located at the
89
UF/IFAS Mid-Florida Research and Education Center in Apopka, Florida, United States (latitude
28°38’ N, longitude 81°33’ W). On 28 February 2019, the seed coats were nicked with a razor
blade, scarifying the seeds according to the procedure outlined in Mackay et al. (2001). The
seeds were then soaked for 24 hours in deionized water to increase germinability, before each
was seeded ~1 cm under the substrate surface of a 98-count rockwool cube sheet (1.5 in3, 3.8
cm3; Grodan, Inc., Roermond, The Netherlands) that had been soaked in water adjusted to pH 5.5
using a pH down buffering solution (General Hydroponics Inc., Sebastopol, CA, United States)
for 30 minutes (Campbell et al., 2020).
The sheet was relocated on 29 February to a propagation unit comprised of a multi-tier
shelfed structure (Compact SunLite 3-Tier Garden; Gardener's Supply Company, Burlington,
VT, United States), each equipped with a 19 cm (7.5 in.) vented humidity dome (HydroFarm,
Petaluma, CA, United States), 25.4 x 52.7 cm (10 x 20.75 in.) heat mat (Vivosun, Shanghai,
China), T5 fluorescent light (Sunblaster, Langley, BC, Canada) and a mini thermo-hygrometer
(Mondi, Vancouver, BC, Canada) to measure environmental conditions within each humidity
dome. Ambient environmental conditions were recorded using a digital hygrometer and
temperature monitor (AcuRite, Lake Geneva, WI, United States) located on the exterior of the
propagation unit. The heating mats were set to maintain a substrate temperature of 25.5 °C (78
°F), with the vents of the humidity dome opened to three quarters. The T5 fluorescent lights were
positions ~2 in. from the top of the humidity domes and were left on continuously for 24 hours
of light, providing illumination between 55 and 90 µmol m-2 s-1 at the outer corners and the
center of the substrate sheet respectively throughout the duration of the experiment. Water was
applied by hand daily using a laboratory wash bottle (Thermo Fisher Scientific Inc., Waltham,
MA) to maintain adequate moisture. On 8 March, twenty germinated seedlings were transferred
90
to 15.2 cm (6 in) pots and placed in the 30.5 x 14.6 m greenhouse described above. The seedlings
were then watered by hand daily until they were transplanted to the field on 3 April.
Growing Structures
Three experimental growing structures, a 3 m (~10 ft.) short trellis, a 1.5 m (~5 ft.) wire
fence, and a tomato cage, in addition to an unsupported control, were utilized for this experiment
(Figure 4-2). The growing structures were implemented into a single row of the tall-trellis hop
production system at the Mid-Florida Research and Education Center, where a second
galvanized steel cable was suspended for this experiment at a height of 3 m. Woven
polypropylene ground cover (91 cm width; Imperial Builders & Supply, Inc., Apopka, FL, USA)
was installed along the center of the row for weed control, with plants sown directly into the soil
inside 30.5 cm wide squares placed every 3.6 m. Irrigation was applied using a micro-irrigation
spray stake (Green Medium Flow Spot-Spitter, 20 PSI; Primerus Products, LLC., Encinitas, CA,
United States) attached to 2.5 cm diameter polyethylene pipe (Imperial Builders & Supply, Inc.,
Apopka, FL, USA) installed along the base of the row. At a pressure of 20 PSI (0.19 gpm), these
stakes administer approximately one gallon of water per plant over the course of a five-minute
irrigation regiment (0.19 gpm x 5 minutes = ~1 gallon). Scotts Peters Professional 20-20-20
General Purpose water soluble fertilizer (The Scotts Company, Marysville, OH, USA) was
dispensed at a rate of 1:500 (0.2%) using a Dosatron D45RE15 fertilizer injector (Dosatron
International, Inc., Clearwater, FL, USA).
The 3 m short trellis design is consistent with traditional hops (Humulus lupulus)
production methods, where two jute twine strings (9.5 mm diameter; The Home Depot LLC.,
Atlanta, GA, USA) were suspended in a V pattern from the galvanized steel cable trellis hung 3
m above the soil surface and attached to the ground using 15.2 cm long galvanized staples
(Growers Supply, Dyersville, IA, USA; (Edwardson, 1952). Not consistent with the traditional

91
hop production method is the height; while the taller H. lupulus plants are grown on 6 m (20’)
trellises, 3 m was deemed more appropriate for butterfly pea. Similarly, the 1.5 m wire fence was
designed to replicate another popular vegetable production system, the flat or wall trellis (Elio et
al., 2005). The fence was constructed using 3.3 cm x 3.3 cm x 1.5 m (1.3 in. x 1.3 in. x 5 ft.) 14-
Gauge Powder Coated Steel Fence U-Posts placed approximately 1.5 m apart, with 1.5 x 15 m (5
in. x 50 ft.) 14-gauge galvanized steel welded wire garden fence (The Home Depot, Atlanta, GA)
suspended in between. The 137.2 cm (54 in.) galvanized tomato cages (Gilbert & Bennett,
Georgetown, CT) were purchased locally at a garden center and were sunk into the ground so
that ~1 m was left above the soil surface. To protect the young plants from predation, primarily
from a local gopher tortoise (Gopherus polyphemus) population, 15.2 cm (6 in.) fences were
constructed in a circle around each young plant using the galvanized steel wire fencing described
above. The unsupported control also received the 15.2 cm fence, but no other support.
Data Collection and Analysis
The number of days after transplanting (DAT) until the first mature flower, defined as
being fully opened, was recorded for each of the plants (Figure 4-2). Following first flower
maturity, all flowers with more than 1 cm of petal exposed were harvested from each plant, a
total of 17 times over eight weeks from 15 May to 10 July. Total flower count and wet weight (g)
were measured per plant before the flowers were placed into a 65 °C (150 °F) oven (Model 40
GC Lab Oven, Quincy Lab Inc., Chicago, IL) for 24 hours and dried until zero moisture was
present, defined as having consistent weight across three consecutive weighings. Flower count,
wet weight (g) and dry weight (g) are listed in Table 4-1. Statistical analysis of collected data
was performed using mixed model analysis in JMP® Pro 14 (SAS; Cary, NC) with post-hoc
mean separation tests performed using Tukey’s honest significant difference test by statistical rep
with variance within treatment combination replicates defined as the random error term.

92
Statistical tests were considered significant if P ≤ 0.05. The #7 1.5 m wire fence and the #12 3 m
short trellis experimental units died before experiment termination and therefore were excluded
from statistical analysis.
Results and Discussion
Statistical analysis of the number of DAT until the first mature flower revealed a lack of
significance between the three experimental growing structures and the unsupported control,
with the shortest and longest durations of 35 DAT and 55 DAT exhibited by a replicate within
the 1.5 m wire fence (plant #11) and the #15 tomato cage (plant #15) treatment groups,
respectively. The 3 m short trellis experimental treatment had the shortest mean duration at 40.25
DAT, followed by the unsupported control (42.8 DAT), the 1.5 m wire fence (43.75 DAT), and
the tomato cage (47 DAT), but otherwise little correlation was observed between individual
replicates (Figure 4-2).
When cultivated for its flowers, a low DAT interval for flower production is desirable
among growers. As a perennial plant, butterfly pea is not bound by seasonal constraints and will
continue vegetative growth and flowering as long as growing conditions are favorable, with
flowering eventually slowing as the plant becomes dominated by woody tissue. Periodic pruning
can help reduce this trend, removing woody tissue and encouraging new growth, but also
resulting in a period of deficit flower production. By having a shorter mean DAT to first mature
flower emergence, growers and producers can ensure less time between the first planting and
their first harvest, as well as between pruning’s and subsequent harvests (Williams, 2005). Given
the lack of difference among the mean DAT for the three experimental growing structures and
the unsupported control, it’s unlikely that this parameter has an appreciable effect on the
performance of the growing system.
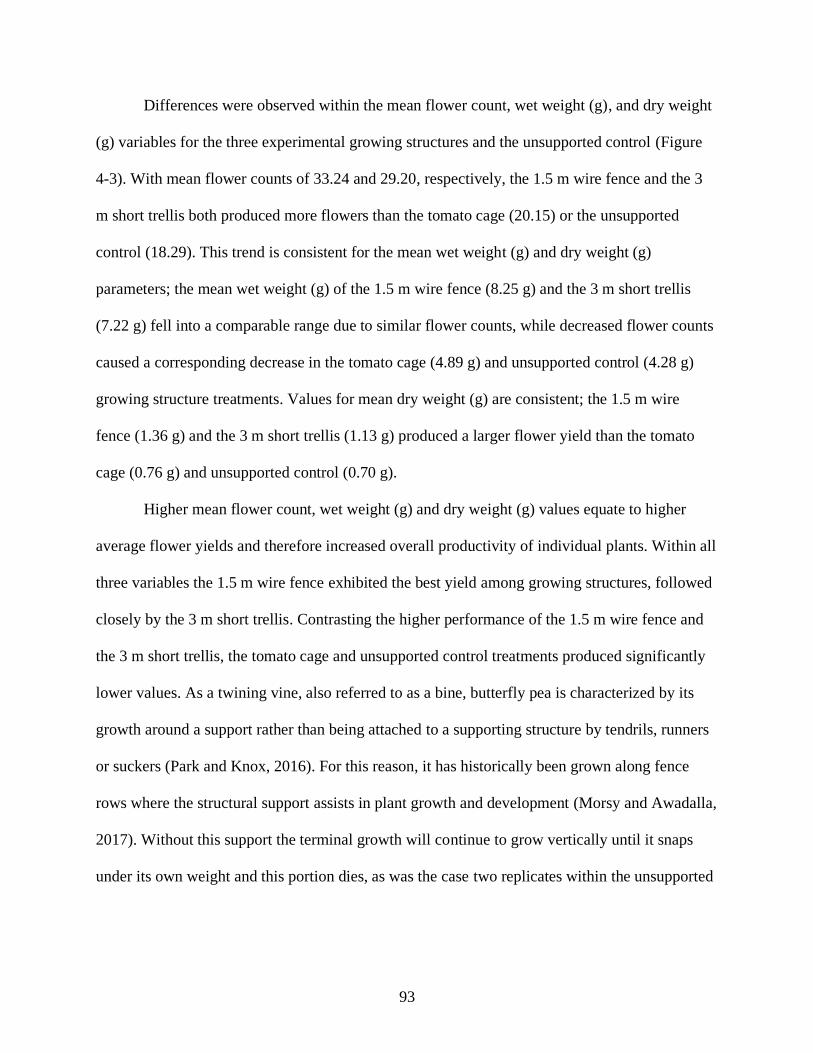
93
Differences were observed within the mean flower count, wet weight (g), and dry weight
(g) variables for the three experimental growing structures and the unsupported control (Figure
4-3). With mean flower counts of 33.24 and 29.20, respectively, the 1.5 m wire fence and the 3
m short trellis both produced more flowers than the tomato cage (20.15) or the unsupported
control (18.29). This trend is consistent for the mean wet weight (g) and dry weight (g)
parameters; the mean wet weight (g) of the 1.5 m wire fence (8.25 g) and the 3 m short trellis
(7.22 g) fell into a comparable range due to similar flower counts, while decreased flower counts
caused a corresponding decrease in the tomato cage (4.89 g) and unsupported control (4.28 g)
growing structure treatments. Values for mean dry weight (g) are consistent; the 1.5 m wire
fence (1.36 g) and the 3 m short trellis (1.13 g) produced a larger flower yield than the tomato
cage (0.76 g) and unsupported control (0.70 g).
Higher mean flower count, wet weight (g) and dry weight (g) values equate to higher
average flower yields and therefore increased overall productivity of individual plants. Within all
three variables the 1.5 m wire fence exhibited the best yield among growing structures, followed
closely by the 3 m short trellis. Contrasting the higher performance of the 1.5 m wire fence and
the 3 m short trellis, the tomato cage and unsupported control treatments produced significantly
lower values. As a twining vine, also referred to as a bine, butterfly pea is characterized by its
growth around a support rather than being attached to a supporting structure by tendrils, runners
or suckers (Park and Knox, 2016). For this reason, it has historically been grown along fence
rows where the structural support assists in plant growth and development (Morsy and Awadalla,
2017). Without this support the terminal growth will continue to grow vertically until it snaps
under its own weight and this portion dies, as was the case two replicates within the unsupported

94
control treatment group on 23 May and 8 July, respectively. Apical growth continues
horizontally, but this reduction in vertical growth will severely limit flower yield.
While all three experimental growing structures offered vertical support for the plant to
grow around, they did so at different heights and with varying amounts of horizontal growing
area. Assuming a height and width of 1.5 m, the 1.5 m wire fence experimental growing system
had an average growing surface area of A = height × width = 1.5 m × 1.5 m = 2.25 m2. This is
five times the surface area of the second highest performing growing structure, the 3 m short
trellis, which assuming a width of 0.3 m between jute strings where they attach to the galvanized
steel cable, would only have A = (height × base) / 2 = (3 × 0.3 m) / 2 = 0.45 m2. This is also
approximately three times the surface area of the tomato cage, which with an average radius of
0.2 m for the upper ring; A = π × radius (radius + sqrt (height2 + radius2)) = π × 0.2 m (0.2 m +
sqrt ((1 m)2 + (0.3 m)2)) = 0.77 m2. These calculations were made for the surface area of the 1.5
m wire fence and 3 m short trellis, in this case the eastern facing side, but for the entire area of
the tomato cage.
Conclusion
In their 2019 Beverage Trend Predictions, the Imbibe beverage development firm stated
that “butterfly pea flower tea will be the rising star of 2019 because it is high in antioxidants and
naturally changes color from blue to purple when acidity is added to it” (McHugh, 2018). With a
strong and growing agritourism industry in the state along with several qualities making butterfly
pea an ideal candidate for production, the authors conclude that the 1.5 m wire fence
experimental growing system should be used to maximize butterfly pea flower yield, with the 3
m short trellis as a close alternative. This is likely due to the increase in average growing surface
area, providing vertical support to prevent from plant collapse while maximizing the amount of
exposed leaf tissue. Placed within the rows of existing crops or alongside of buildings, these

95
structures allow for an easily manicured and maintained plant with ample access for untrained
pickers, two crucial elements for any U-Pick type operation. Moreover, as a legume, companion
planting with butterfly is likely to enhance nitrogen availability to nearby plants. Once harvested,
the flowers can be arranged as an ornamental, used in the production of food, beverages, alcohol,
etc., or extracted for their color changing, antioxidant compounds.

96
Table 4-1. Mean flower count, wet weight (g) and dry weight (g) for the growing structure
independent variable.
ZMean ± Standard Error, means within column with the same letter are not significantly different (P ≤ 0.05; Tukey’s
honest significant difference test).
Figure 4-1. Butterfly pea (C. ternatea) flowers. A) Flower grown in an open-sided rainout
shelter in Apopka, FL. B) Harvested flowers ready to be dried. Photo credits: Sean M.
Campbell.
Growing Structure Flower Count Wet Weight (g) Dry Weight (g)
P Value - 0.0007* P Value - 0.0005* P Value - 0.0009*
3 m Short Trellis 29.2 ± 3.9 abZ 7.2 ± 1.0 ab 1.13 ± 0.1 ab
1.5 m Wire Fence 33.2 ± 4.8 a 8.2 ± 1.2 a 1.36 ± 0.2 a
Tomato Cage 20.1 ± 3.3 b 4.9 ± 0.8 bc 0.76 ± 0.1 b
Unsupported Control 18.3 ± 2.1 b 4.3 ± 0.5 c 0.70 ± 0.1 b
A) B)

97
3 m Short Trellis
1.5 m Wire Fence
Tomato Cage
Unsupported Control
Figure 4-2. Visual representation, field image, and number of days to flower for the growing
structure independent variable. Five experimental replicates were used per treatment
and means were not significantly different with a p Value of 0.7499 (Tukey’s honest
significant difference test).
51
36
38
Dead
36
40.2
0 20 40 60
1
5
8
12
19
Mean
Days Until First Flower
51
Dead
35
38
51
43.7
3
7
11
18
20
Mean
51
53
37
55
39
47
2
9
13
15
16
Mean
37
48
52
39
38
42.8
4
6
10
14
17
Mean

98
Figure 4-3. Mean flower count, wet weight (g) and dry weight (g) for the growing structure
independent variable.
33.2 29.2 20.1 18.30
10
20
30
40
Flo
wer
Count
8.2 7.2 4.9 4.30
2
4
6
8
10
Wet
Wei
ght
(g)
1.36 1.13 0.76 0.70
0.5
1
1.5
Wire
Fence
Short
Trellis
Tomato
Cage
Unsp.
Control
Dry
Wei
ght
(g)
Growing Structure Treatments

99
CHAPTER 5
INFLUENCE OF FERTILIZATION AND IRRIGATION ON GROWTH CHARACTERISTICS
AND FLOWER PRODUCTION IN BUTTERFLY PEA (CLITORIA TERNATEA)
Butterfly pea (Clitoria ternatea) is an herbaceous perennial, leguminous twiner of the
Fabaceae family and Faboideae subfamily. While it is one of the most important forage legumes
in southeast Asia, China, Sudan, the East and West Indies, and South and Central America, it is
primarily associated in the United States with its flowers and their application as a pH-dependent
natural colorant (Barik et al., 2007; Morris, 2009; Morsy and Awadalla, 2017). C. ternatea
flowers are commonly light blue, dark blue, white, or mauve due to elevated anthocyanin
concentrations, a class of flavonoids possessing biological activities (Kazuma et al., 2003; Pham
Tri Nhut et al., 2019; Poh, 2019). The flowers bloom nearly year-round under ideal conditions
and flowers are traditionally used fresh, dried, or extracted as a non-toxic and environmentally
conscious natural plant pigment (Mahmad and Taha, 2018; Park and Knox, 2016). Malaysian
dishes “nasi kerabu” and “kuih tekan” are examples of prepared foods (Siti Azima et al., 2017),
while in Thailand the flowers are served as a hot or iced tea called “dok nam anchan” (Marpaung
et al., 2020) or the extract is dried and mixed with sugar to form “un-chan juice powder”
(Wiboonsirikul, 2019). Further, recent health concerns associated with consumption (Chu et al.,
2016; McCann et al., 2007) and use (Pham T. N. et al., 2020) of synthetic food colorants will
likely further popularize the use of CT in food and beverage preparation (Siti Azima et al.,
2017). This is evident in the United States, where increased interest in this plant and its
applications as a pH-dependent food colorant, nutraceutical, cosmetic, and environmentally
friendly insecticide have already been documented (Oguis et al., 2019; Simonson, 2016).
Upon introduction of a novel crop into production, vital cultivation methodologies are
often assessed at publicly funded institutions, saving growers and producer’s valuable time and
resources. In Florida, where sandy soils with minimal water and nutrient holding capacity are

100
common, a significant concern with outdoor commercial crop production is the proper
application and management of appropriate fertilization and irrigation. More specifically,
ensuring that plant needs are sufficiently met to maximize plant growth and development but not
excessively to the point where valuable resources are squandered or groundwater is
contaminated. This is commonly achieved through performing field trials to determine ideal
application rates and through conducting investigations that examine relationships between
nutrient applications and plant nutrient uptake. This can be accomplished through quantification
of plant chlorophyll content using an established extraction and analytical technique or through
the development and use of a nondestructive technique, such as a light absorbance methods using
a Konica Minolta SPAD-502Plus hand-held meter.
This research was conducted to better understand the influence of irrigation and nutrient
management on butterfly pea growth, flowering, and chlorophyll content. This information will
also assist growers in resource management and may serve as a foundation for future best
management practice development.
Materials and Methods
Butterfly pea (Clitoria ternatea)
C. ternatea seeds were harvested from a single plant grown in a 30.5 x 14.6 m gutter-
connected greenhouse with 30% light reducing polycarbonate paneling located in Apopka,
Florida, United States (latitude 28°38’ N, longitude 81°33’ W) from seed acquired from an
online seed vendor (Amazon.com, Inc., Seattle, WA). On 17 September 2018 the seeds were
scarified by nicking the seed coat with a razor blade according to the procedure outlined in
Mackay et al. (2001), placed in a beaker and soaked in deionized water for 24 hours, before
being seeded into 98-count rockwool cube sheets (1.53 inch, 3.83 cm) (Grodan, Inc., Roermond,

101
The Netherlands) that had been soaked for 30 minutes in water that had been adjusted to pH 5.5
using a pH down buffering solution (General Hydroponics Inc., Sebastopol, CA).
The rockwool sheets were then place into a propagation unit consisting of a multi-tier
shelfed structure (Compact SunLite 3-Tier Garden; Gardener's Supply Company, Burlington,
VT) with each of the three shelves equipped with a 19 cm (7.5 in.) vented humidity dome
(HydroFarm, Petaluma, CA), 25.4 x 52.7 cm (10 x 20.75 in.) heat mat (Vivosun, ShangHai,
China), fluorescent lighting (T5; Sunblaster, Langley, BC, Canada) and a mini thermo-
hygrometer (Mondi, Vancouver, BC, Canada) to measure environmental conditions within each
humidity dome. A digital hygrometer and temperature monitor (AcuRite, Lake Geneva, WI) was
placed on the exterior of the propagation unit to record ambient environmental conditions.
Heating mats were programmed to maintain 26.7 °C (80 °F), and the top and side vents of the
humidity domes were fully closed to maintain a constant humidity level. Lights were positioned
~2 in. from the top of the dome and operated for 24 hours per day. Each rockwool cube had
approximately 5 mL of water applied each day utilizing a laboratory wash bottle (Thermo Fisher
Scientific Inc., Waltham, MA).
On 24 September the germinated seedlings were transferred to 15.2 cm (6 in.) pots and
moved to the greenhouse described above where they were irrigated by hand daily, and on 16
October they were transplanted into the rows of an 18.3 × 30.5 m (60 × 100 ft.) open-sided
rainout shelter also located in Apopka, Florida with the walls remaining open until forecasts of
air temperatures below 40 °F necessitated their closure on 5 December. On 13 November, eighty
C. ternatea reps were trimmed down to a uniform vine height along the trellis of 6 - 65 cm by
removing axillary growths to leave only a single apical vine according to the procedures outlined
by Kondo and Higuchi (2012).

102
Irrigation
The irrigation independent variable was separated into two schedules, both utilizing the
same irrigation application rate, but with one group receiving irrigation daily and the other
receiving it every 3rd day. Daily irrigation applications were randomly applied to rows one, three,
four, seven and nine within the open-sided rainout shelter. Irrigation was applied every 3rd day to
rows two, five, six, eight and ten. Irrigation treatments were initiated on 16 October when the C.
ternatea plants were transplanted to the open-sided rainout shelter. At a pressure of 20 PSI
(0.19gpm), the Green Medium Flow Spot-Spitter Spray Stakes (Primerus Products, LLC,
Encinitas, CA) stakes applied approximately one gallon of water per plant over the course of a
five-minute irrigation regiment (0.19 gal./min. x 5 minutes = ~1 gal.).
Fertilization
The high, medium, low, and control fertilizer rates was applied as 65, 45, 24, and 0 g of
Osmocote Plus 15-9-12, 5 - 6 Month, Controlled Release Fertilizer (Everris NA Inc., Dublin,
OH) per plant, respectively, on 14 November. These correspond to the Osmocote recommended
dosages for the high, medium, and low fertilization rates in a 7.6 L (2 gal.) container. Fertilizer
was top dressed by hand around the base of the plant to be watered in with the next scheduled
irrigation event. A second dose was applied on 27 February following the same treatment rates.
Konica Minolta SPAD-502Plus Hand-Held Meter
A relatively affordable device for smaller producers, the Konica Minolta SPAD-502Plus
Hand-Held Meter generates a SPAD index-value by using two light-emitting diodes at red (650
nm) and infrared (940 nm) wavelengths. This SPAD index-value can then be compared to a user
derived calibration curve to determine the approximate chlorophyll concentration of the leaf, a
crucial indicator of leaf N content, leaf photosynthetic capacity, and overall plant health. While
laboratory-based methods for leaf chlorophyll determination are popular in commercial
103
production operations to assess optimal fertilization, the methods generally involve pigment
extraction in an organic solvent and therefore are destructively derived. The SPAD-502Plus
allows growers and producers to collect important plant nutritional information rapidly and non-
destructively in the field, allowing them to adjust fertilization regimes in real time. Use of the
SPAD-502Plus to assess leaf chlorophyll concentration has been widely established in scientific
literature, but with variability amongst species, likely caused by leaf structural differences (Ling
et al., 2011).
Three replicate SPAD index-values were taken per plant using the SPAD-502Plus on 11
November 2018 as well as 3, 9, and 16 January 2019 to determine the approximate chlorophyll
concentration of the leaf. Measurements were taken on three different leaflets of the same leaf,
midway between the midrib and the leaf margin according to the procedures outlined in
Markwell et al., (1995). C. ternatea leaflets lack prominent leaf veins and therefore their
avoidance was not a concern.
Soil Volumetric Water Content
Three Decagon EM50 Data Loggers (Decagon, Pullman, WA) were installed in the open-
sided rainout shelter to measure volumetric water content (VWC, %) of the soil surrounding the
plants, with one in row seven measuring the daily irrigation experimental treatment and two
located in rows six and ten measuring the every 3rd day irrigation treatment. Each EM50 Data
Logger was equipped with five EC-5 Moisture Meters, each buried within the soil surrounding
the root mass of a plant within that row, for a total of 5 and 10 replications for the daily and
every 3rd day irrigation regiments, respectively.
Data Collection
The experiment was organized as a 4 × 2 factorial in a completely randomized design,
with fertilization rate and irrigation schedule assigned as independent variables. Ten replicates
104
were cultivated for each treatment combination for a total of eighty experimental units. From 14
November to 15 January, plant growth index (PGI) parameters including plant height (cm), node
count, and flower count were recorded on a weekly basis for a total of 10 measurements. Flowers
were also simultaneously harvested during the weekly data collection and were stored at 0 °C (32
°F) for further analysis.
UV/Visible Spectrophotometric Anthocyanin Analysis
Stored flowers from 14 November through 12 December were separated and used for
anthocyanin analysis. Of the ten experimental replicates per treatment combination, the flowers
of two were combined for a total of five replicate samples per treatment combination. Samples
were prepared for anthocyanin analysis according to the procedure described by Rodriguez-
Saona and Wrolstad (2001) wherein 5 g of flower material was chosen as a representative
sample, frozen using liquid nitrogen, and ground to a fine powder using a KitchenAid Blade
Coffee Grinder (Whirlpool Co., Benton Charter Township, MI). The fine powder was then
transferred to 50 mL sample tubes using 2 volumes of 10 mL acidified methanol, or 0.01% (v/v)
formic acid in methanol. Following maceration for 1 hour the samples were filtered through
Whatman no. 1 filter paper by vacuum suction using a Buchner funnel before being reextracted
with an additional volume of 10 mL acidified methanol. Filtrates were pooled and plant material
was discarded.
Samples were then analyzed per the AOAC Official Method 2005.02 - Total Monomeric
Anthocyanin Pigment Content of Fruit Juices, Beverages, Natural Colorants, and Wines pH
Differential Method as outlined in Lee et al., (2005). Two buffers of potassium chloride
(0.025M) and sodium acetate (0.4M) were formulated at pH 1.0 and pH 4.5, respectively.
Sample filtrates were pipetted into 10 mm lightpath, 1.5 mL capacity disposable plastic cuvettes
(Semimicro Style, Polystyrene; Thermo Fisher Scientific Inc., Waltham, MA) at a ratio of 1:4

105
sample to buffer, one cuvette each per pH 1.0 and pH 4.5, for a total of 1 mL. Cuvettes were
analyzed using a Thermo Scientific Evolution 201 UV-Visible Spectrophotometer (Thermo
Fisher Scientific Inc., Waltham, MA) at 520 and 700 nm. Monomeric anthocyanin pigments such
as those found in C. ternatea exhibit a pH-dependent color change; the colored oxonium form is
primarily present at pH 1.0 while the colorless hemiketal form predominates at pH 4.5, therefore
the difference in absorbance at 520 nm is proportional to the pigment concentration.
Results are expressed on a delphinidin-3-glucoside (del-3-glu, mg/L) equivalent basis
according to the following equation:
𝐴𝑛𝑡ℎ𝑜𝑐𝑦𝑎𝑛𝑖𝑛 𝐶𝑜𝑛𝑐𝑒𝑛𝑡𝑟𝑎𝑡𝑖𝑜𝑛 (𝑚𝑔/𝐿 ) =A × MW × DF × 103
ε × 1 (5-1)
where A = pH 1.0 (A520nm – A700nm) – pH 4.5 (A520nm – A700nm); MW (molecular weight) = 465.4
g/mol for del-3-glu (PubChem, 2020); DF = dilution factor, and with a sample to buffer ratio of
1:4, DF = 4; l = pathlength in cm; ε = 23,700 molar extinction coefficient, in L × mol–1 × cm–1
for del-3-glu (Kähkönen et al., 2003); and 103 = factor for conversion from g to mg.
Statistical Analysis
Statistical analysis of collected data was performed using mixed model analysis in JMP®
Pro 14 (SAS; Cary, NC) with post-hoc mean separation tests performed using Tukey’s honest
significant difference test by statistical rep with variance within treatment combination replicates
defined as the random error term. Statistical tests were considered significant if P ≤ 0.05.
Results and Discussion
Means, standard errors, and significance levels were analyzed for the four growth and
development parameters, namely the three PGI measurements of height (cm), node count, and
flower count, as well as the SPAD index-value, and are listed in Table 5-1. Values for the del-3-
glu concentration (mg/L) are similarly represented in Table 5-2. Both the fertilization and
106
irrigation independent variables exhibited significance in all four parameters as well as the del-3-
glu concentration for the irrigation independent variable, while the interaction effect between the
fertilization and irrigation independent variables lacked significance in all of the parameters
measured except for the flower count. Consequently, further analysis will primarily be given to
the independent variables rather than the interaction effect.
Fertilization
Within the fertilization independent variable all three of the PGI parameters measured
indicated that the low fertilization treatment exhibited the best growth and development. With a
mean height of 124.98 cm the next highest performing treatments were the medium and high
fertilization rates at 101.6 cm and 97.66 cm, respectively, followed by the control at 90.9 cm.
This trend among treatments is consistent in the flower count (#) parameter, where the low
fertilization (2.52) outperformed the high (1.82) and medium (1.70) treatments, which surpassed
the control (1.18). The node count (#) parameter exhibited a slightly different significance order,
but the low fertilization treatment (18.81) still performed better than the medium (17.23), high
(16.12), and control (15.93) treatments.
These results are consistent with those previously reported in the literature. In (2017),
Morsy and Awadalla assessed two experimental fertilization treatments of 30 and 60 kg P2O5 and
an untreated control on C. ternatea and reported that the 30 kg P2O5 dosage significantly
increased plant height (88.14 and 91.95 cm), leaves/plant (64.46 and 83.83), branches/plant (9.11
and 11.31), and plants/m-2 (94.77 and 103.67) for the 1st and 2nd experimental cut of the season,
respectively, when compared with the untreated control and 60 kg P2O5 treatments. Forage yield
was also significantly affected as the 30 kg P2O5 treatment increased fresh forage by 11.38 and
9.45% and 7.03 and 6.50% versus the untreated control and 60 kg P2O5 treatments, respectively,
and dry forage by 13.33 and 9.02% and 7.84 and 6.21% for the untreated control and 60 kg P2O5

107
treatments, respectively. Authors concluded that the 30 kg P2O5 had a better phosphorus
agronomic efficiency (PAE) than the 60 kg P2O5 treatment and therefore is the preferred
application (Morsy and Awadalla, 2017). Similarly, Al-Zamanan et al. (2016) noted that
increasing nitrogen application (0 kg N/ha, 200 kg N/ha, and 400 kg N/ha) was correlated with a
gradual increase in plant height and maximum forage production in C. ternatea. Ultimately, they
concluded that the difference from application of 200 kg N/ha to that of 400 kg N/ha was
insignificant, and that the 200 kg N/ha dosage the economically appropriate choice (Al-Zamanan
et al., 2016).
Alternatively, the high fertilizer treatment (44.41) exhibited the highest average SPAD
index-value followed by the medium (41.71), low (40.66), and control (32.43) treatments. The
SPAD index-value correlates to the relative chlorophyll content of the leaf and is an indirect
indicator of the leaf, and overall plant, N content. The Osmocote Plus 15-9-12, 5-6 Month,
Controlled Release Fertilizer used for the experimental treatments contains 15% N and
consequently the observed trend between increasing fertilization rate and SPAD index-value is
consistent with expectations.
Debaeke et al. noted similar results in their (2006) study, remarking that SPAD index-
values increased proportionally in the ‘Néodur’ wheat cultivar with increasing nitrogen
application (35, 215, 370 kg N ha, respectively). The authors also noted that regardless of the
amount of N applied, the SPAD index-value readings decreased steadily over the course of the
experiment until plateauing, with the exception of when additional N was applied at a later stage,
in which case the readings increased until anthesis (Debaeke et al., 2006). Swiader and Moore
(2002) also demonstrated this trend in processing pumpkins (Cucurbita moschata) where leaf
SPAD index-values significantly correlated with both fruit yield and leaf N concentrations.

108
Lacking significance, the del-3-glu concentration (mg/L) values similarly lacked a
discernable trend for the medium (15.59 mg/L), control (14.73 mg/L), high (13.61 mg/L), and
low (11.63 mg/L) fertilization rates. This is, however, somewhat consistent with the literature.
The carbon-nitrogen balance (CNB) theory states that plants allocate carbon, nitrogen, and other
nutrients to the production of secondary metabolites only after growth requirements are satiated.
When resource concentration is abundant, plant growth and development receive priority and
decrease the availability of carbon for secondary metabolism. When resource concentration is
low and growth is stunted, excess accumulated carbohydrates are diverted to carbon-based
secondary metabolite production. As a result, available N concentrations in excess of growth
requirements have been linked to production of nitrogen-based secondary metabolites such as
caffeine and reductions in carbon-based phenolics, notably anthocyanins and other antioxidants
(Heimler et al., 2017; Palumbo et al., 2007). Vashisth et al. noted this in their (2017) study on
peach cultivars, where they reported an overall increase in anthocyanin concentration, with a
corresponding increase in antioxidant capacity, with decreasing available N. Similarly, Heimler
et al. (2017) found that increasing nitrogen fertilization decreased anthocyanin content in vine
berries and that a combined application of nitrogen, potassium, and phosphorus resulted in
elevated total polyphenols in bush tea, but heavy potassium and phosphorus fertilization
negatively affected anthocyanin content in red cabbage (2017).
Irrigation
Drought stress is a common abiotic plant stressor responsible for significant crop loss
worldwide and is characterized as a reduction in soil plant available water to the point of causing
a water deficit to the plant (Akula and Ravishankar, 2011; Zandalinas et al., 2017). While some
changes to plant physiology in response to drought stress are easily identified, others may be
harder to pinpoint accurately, as stress factors like drought, elevated temperatures, and UV light

109
primarily exist in sequence or co-occurrence (Niinemets, 2016). In some plant species, such as
Eucalyptus, stress conditions can permanently alter plant phenotypes. This change, as presented
by McKiernan et al. (2016), may occur to assist the plant in preparing for future stress events.
The soil VWC values of the five EC-5 Moisture probes for the row receiving the daily
irrigation treatment and the two rows receiving the every 3rd day irrigation treatment were
averaged and are displayed in Figure 5-1. The observed trends from these averages were
consistent with those expected, as the VWC percentage of the daily irrigated row spiked on a
daily basis, starting at the highest value with the irrigation event and depressing over the course
of the day. Alternatively, the VWC percentages for the two every 3rd day irrigated rows spiked
and depressed over a three-day period, with a small daily rise and fall observed within. Statistical
analysis revealed a significant difference between the daily irrigated and every 3rd day irrigated
experimental treatments, with average VWC percentages of 6.44 and 3.51%, respectively.
At 110.38 cm height, 17.75 nodes, 1.94 flowers, and 40.97 SPAD index-value, the every
3rd day irrigation treatment exhibited maximal growth and development over the daily irrigated
group, with values of 95.79 cm, 16.15 nodes, 1.64 flowers, and 38.51 SPAD index-value,
respectively. This is further supported by the literature. Taha and Khair tested three irrigation
regimes on C. ternatea at intervals of 7 (optimal), 14 (low stress), and 21 days (high stress) over
the course of two experimental seasons in their (2014) study and found that dry matter yield
(DMY) for the 7 (5.5 tons/ha), 14 (4.8 tons/ha), and 21 day (4.9 tons/ha) irrigation rates were
statistically similar and exhibited comparable water application efficiency (WAE) and water
productivity (WP) values. With lack of significance between treatments, the authors concluded
that differences were negligible and the 21 day (high stress) treatment was the economically
appropriate choice (Taha and Khair, 2014).

110
Similarly, Mahfouz et al. (2020) assessed three irrigation rates categorized as I100% (100%
allowable soil moisture depletion (ASMD)), I80% (80% ASMD), and I60% (60% ASMD). C.
ternatea exposure to drought stress (I60%) resulted in decreases in plant growth, forage fiber, and
yield (cumulative dry forage yield (CDFY) and cumulative protein yield (CPY)) but increased
the leaf/stem ratio (LSR), forage protein content, and water use efficiency (WUE). Alternatively,
the fully irrigated plants of the I100% treatment group exhibited the highest leaves/plant (NL/P),
leaf area/plant (LA/P), and plant dry weight (PDW). The I100% treatment level provided the
highest CT forage quality and yield overall and is considered preferable under conditions with
abundant water, especially when combined with an early planting date (PE), but the moderate
(I80%) treatment lever could be utilized under water scarcity with comparable yield and quality
(Mahfouz et al., 2020).
Another significant response to the onset of drought and water stress is the buildup of
osmotica, or substances ranging from common plant compounds to crop specific polyphenols
that contribute to regulation of osmotic pressure in plant cells and can function as protective
agents (Fonseca et al., 2006; Niinemets, 2016; Selmar and Kleinwächter, 2013). Thus, duration
of drought stress, and/or recovery from previous drought stress events, are also critical factors
that influence synthesis of secondary plant metabolites. The every 3rd day irrigation treatment
exhibited significantly higher del-3-glu concentrations at 15.44 vs. 11.95 mg/L when compared
to the daily irrigated group. Griesser et al. observed increased concentrations in 85% of all
polyphenols tested in their (2015) study after long-term (6 - 8 days) drought stress conditions but
not short-term (3 - 5 days). Thus, it may be possible to infer duration of drought stress from the
presence and/or concentrations of secondary metabolic plant compounds (Griesser et al., 2015).

111
Conclusion
The carbon-nitrogen balance is touted as the most logical explanation surrounding the
associated change in plant growth, development, and secondary metabolite concentration due to
varying levels of available fertilization, but it is still a hypothesis. Palumbo et al. concluded that
their data both affirmed and contradicted the hypothesis; increased concentrations of caffeine
were observed with added nitrogen fertilization in both their 2007 and 2009 publications but
lacked the associated decrease in phenolics (2007; 2009). Jezek et al. (2018) theorized this to be
too simple a hypothesis, stating instead that anthocyanins are produced in a highly regulated
nutrient-specific manner, too complex to simply be a result of up-regulation of carbon-based
secondary metabolite production. Regardless of the explanation, the upregulation of secondary
metabolites in relation to fertilization is a very important concept that warrants further study and
review. With genomic sequencing becoming more readily available, genes for anthocyanin
synthesis in tomato, rice, and maize have already been discovered, resulting in new applications
between plant nutrients and desired secondary metabolites (Jezek et al., 2018).
Lack of clear consensus similarly exists amongst the scientific community as to why
secondary metabolites are produced in response to drought stress. However, the importance of
the relationship and the need for further study is recognized. Selmar and Kleinwächter (2013)
hypothesized that increased concentrations of secondary plant metabolites could be attributed to
stress induced reduction in biomass production with an unaffected secondary metabolite
synthesis rate. Conversely, Fonseca et al. (2006) theorized that a production system could be
developed to increase concentration of desired secondary metabolites without negatively
affecting growth or yield. Additional work is warranted amongst a vast array of plant species and
cultivars to better understand relationships between drought stress and secondary metabolite
production.

112
Table 5-1. Means ± standard errors and significance levels for the height (cm), nodes (#),
flowers (#) and SPAD index-value parameters of the fertilization independent
variable, irrigation independent variable and the fertilization × irrigation interaction
effect.
1Significance level letters, treatments not connected by the same letter are significantly different (P ≤ 0.05).
*Statistical analysis was performed using mixed model analysis in JMP® Pro 14 (SAS; Cary, NC) with post-hoc
mean separation tests performed using Tukey’s honest significant difference test by trial with variance within
treatment combination replicates defined as the random error term. Statistical tests were considered significant if P ≤
0.05.
Fertilizer x Irrigation
Interaction Effect
Height (cm) Nodes (#) Flowers (#) SPAD
P = 0.0621 P = 0.1466 P = 0.0212* P = 0.5692
Low - Every 3rd 125.98 ± 7.0 a1 19.22 ± 0.8 a 2.56 ± 0.3 a 42.25 ± 0.6 a
Low - Daily 123.73 ± 7.1 a 18.30 ± 0.8 a 2.48 ± 0.3 a 39.07 ± 0.7 a
Medium - Every 3rd 107.86 ± 7.0 a 17.83 ± 0.7 a 1.69 ± 0.2 b 42.52 ± 0.7 a
Medium - Daily 93.68 ± 7.7 a 16.47 ± 0.9 a 1.72 ± 0.2 b 40.84 ± 0.7 a
High - Every 3rd 106.52 ± 7.1 a 17.35 ± 0.8 a 2.26 ± 0.2 a 45.58 ± 1.0 a
High - Daily 87.38 ± 7.3 a 14.69 ± 0.8 a 1.31 ± 0.3 bc 43.33 ± 0.7 a
Control - Every 3rd 100.92 ± 6.7 a 16.56 ± 0.7 a 1.29 ± 0.2 bc 33.89 ± 0.6 a
Control - Daily 78.38 ± 6.7 a 15.14 ± 0.8 a 1.04 ± 0.2 c 30.97 ± 0.5 a
Fertilization P = < 0.0001* P = < 0.0001* P = < 0.0001* P = < 0.0001*
Low Fertilizer 124.98 ± 5.0 a 18.81 ± 0.6 a 2.52 ± 0.2 a 40.66 ± 0.5 b
Medium Fertilizer 101.60 ± 5.2 b 17.23 ± 0.6 b 1.70 ± 0.2 b 41.71 ± 0.5 b
High Fertilizer 97.66 ± 5.1 b 16.12 ± 0.6 c 1.82 ± 0.2 b 44.41 ± 0.6 a
Control Fertilizer 90.90 ± 4.8 c 15.93 ± 0.5 c 1.18 ± 0.1 c 32.43 ± 0.5 c
Irrigation P = < 0.0001* P = < 0.0001* P = 0.0098* P = < 0.0001*
Every 3rd Irrigation 110.38 ± 3.5 a 17.75 ± 0.4 a 1.94 ± 0.1 a 40.97 ± 0.4 a
Daily Irrigation 95.79 ± 3.7 b 16.15 ± 0.4 b 1.64 ± 0.1 b 38.51 ± 0.4 b

113
Figure 5-1. Soil volumetric water content (VWC). Measured by the five EC-5 Moisture probes
attached to each EM50 Data Logger and averaged for each of the rows with a
significant difference observed (P = < 0.0001) for the daily (6.44% VWC, a) and
every 3rd day (3.51% VWC, b) experimental irrigation treatments.
0
2
4
6
8
10
12
14
7/3
1
8/1
8/2
8/3
8/4
8/5
8/6
8/7
8/8
8/9
8/1
0
8/1
1
8/1
2
8/1
3
8/1
4
8/1
5
8/1
6
8/1
7
8/1
8
8/1
9
8/2
0
8/2
1
8/2
2
Volu
met
ric
Wat
er C
onte
nt
(VW
C)
% P1 - Daily P2 - Every 3rd P3 - Every 3rd
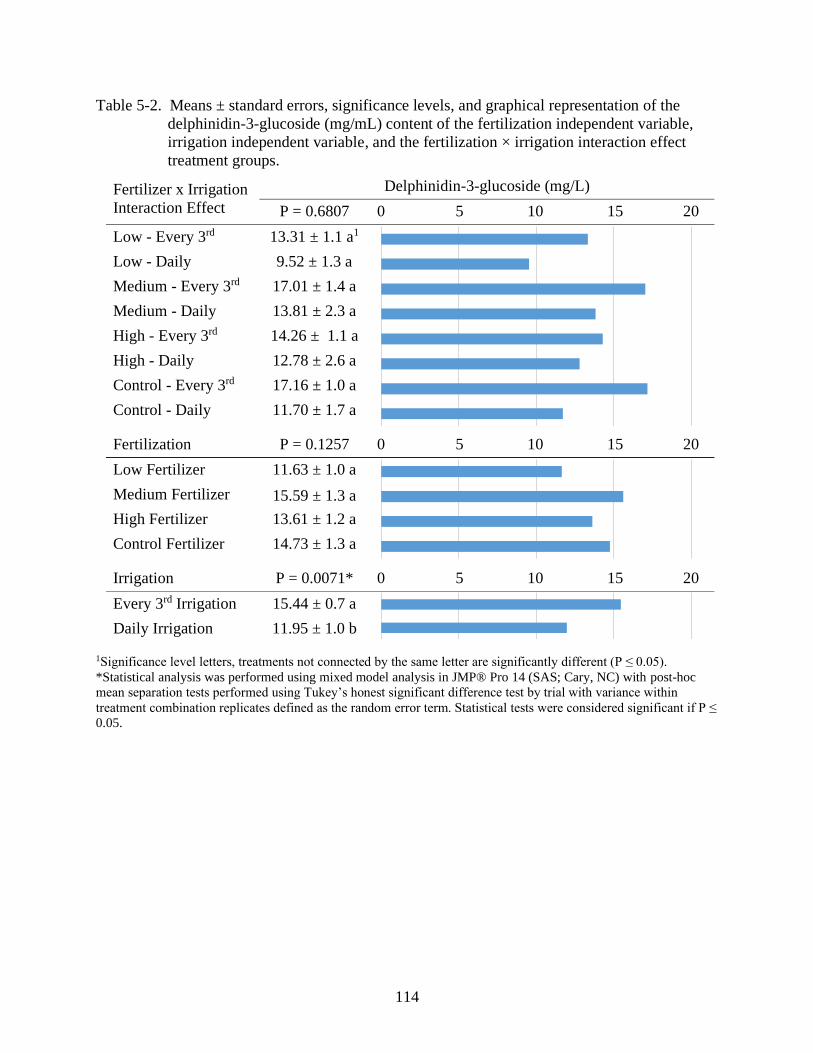
114
Table 5-2. Means ± standard errors, significance levels, and graphical representation of the
delphinidin-3-glucoside (mg/mL) content of the fertilization independent variable,
irrigation independent variable, and the fertilization × irrigation interaction effect
treatment groups.
1Significance level letters, treatments not connected by the same letter are significantly different (P ≤ 0.05).
*Statistical analysis was performed using mixed model analysis in JMP® Pro 14 (SAS; Cary, NC) with post-hoc
mean separation tests performed using Tukey’s honest significant difference test by trial with variance within
treatment combination replicates defined as the random error term. Statistical tests were considered significant if P ≤
0.05.
Fertilizer x Irrigation
Interaction Effect
Delphinidin-3-glucoside (mg/L)
P = 0.6807 0 5 10 15 20
Low - Every 3rd 13.31 ± 1.1 a1
Low - Daily 9.52 ± 1.3 a
Medium - Every 3rd 17.01 ± 1.4 a
Medium - Daily 13.81 ± 2.3 a
High - Every 3rd 14.26 ± 1.1 a
High - Daily 12.78 ± 2.6 a
Control - Every 3rd 17.16 ± 1.0 a
Control - Daily 11.70 ± 1.7 a
Fertilization P = 0.1257 0 5 10 15 20
Low Fertilizer 11.63 ± 1.0 a
Medium Fertilizer 15.59 ± 1.3 a
High Fertilizer 13.61 ± 1.2 a
Control Fertilizer 14.73 ± 1.3 a
Irrigation P = 0.0071* 0 5 10 15 20
Every 3rd Irrigation 15.44 ± 0.7 a
Daily Irrigation 11.95 ± 1.0 b
115
CHAPTER 6
EVALUATION OF SUBSTRATE COMPOSITION AND EXOGENOUS HORMONE
APPLICATION ON VEGETATIVE PROPAGULE ROOTING SUCCESS OF INDUSTRIAL
HEMP (CANNABIS SATIVA)
Passing of the Agriculture Improvement Act of the 2018 Farm Bill federally legalized
production and distribution of industrial hemp (Cannabis sativa having less than 0.3% delta-9
tetrahydrocannabinol (THC) in the United States (U.S.)). As a result, industrial hemp was
removed from the Controlled Substances Act (CSA) and research is eligible for federal funding
support under the Critical Agricultural Materials Act, with the U.S. Department of Agriculture
(USDA) designating it “of strategic and industrial importance” for research and development
(Congress, 2018; Lee M.J., 2019).
More research into potential food, beverage, and nutraceutical applications coupled with
new federal regulations has led to rapid growth of the U.S. industrial hemp industry over the past
several years. In 2017, the U.S. industrial hemp market was worth approximately $700 million,
with imports accounting for $67.3 million, thus categorizing industrial hemp as an agricultural
commodity. While U.S. hemp import values have declined from the record high $78.1 million in
2015, likely due to an increase in domestic production following the removal of prohibitions,
imports have increased steadily since totaling $5.7 million in 2005 (Johnson, 2018). Further, of
the $1.4 billion in hemp-based product sales in the U.S. for 2019, $813.2 million were attributed
to consumer sales of the cannabidiol (CBD), secondary metabolite, and its associated products.
These values are estimated to rise to $2.61 billion and $1.81 billion, respectively, by 2024
(Statista, 2020a; Statista, 2020b).
Unlike fiber and grain varieties, essential oil hemp is cultivated exclusively for
cannabinoid oil extraction and use. Similar to other secondary metabolic plant compounds,
cannabinoid quality and yield are strongly influenced by plant genetics. Currently, the genetic

116
makeup of most cannabis varieties is either unknown or suspect of being inaccurately reported
(Bailey et al., 2017). Along with highly variable cannabinoid production, a lack of genetic
uniformity of hemp challenges commercial production by resulting in non-uniform growth and
flowering response to photoperiod, neither of which is acceptable in high-volume, commercial
plant production. Propagation by seed is simple and cost-effective but lacks the consistency
required for commercial cultivation (Ball, 1998). While in-vitro propagation methods allow for
high genetic uniformity, it can be prohibitively expensive to initiate, requires specialized training
and equipment, and requires a lengthy duration of time before high plant volumes can be attained
(Caplan et al., 2018b). Asexual propagation guarantees production of female plants, an important
attribute for dioecious hemp where male plants inherently produce low levels of oil and, through
fertilization, can reduce oil production in female plants by as much as 75% (Potter, 2004).
Therefore, asexual vegetative propagation of hemp offers a reliable, cost-effective method for
hemp cultivators and plant producers.
To produce vegetative cuttings, meristems are removed from stock or “mother” plants
and placed into a substrate for root development. Propagules are placed within greenhouses and
provided frequent irrigation until root development has progressed sufficiently. Successful
rooting of vegetative cuttings can be influenced by an array of factors and include plant genetics,
rooting substrate composition, and exogenous applications of rooting hormones (Ball, 1998).
While recent publications have begun assessing some of these factors, limited refereed scientific
studies have focused on factors influential to propagule rooting success. Where propagative
information is made available, contributions are primarily sourced from cannabis-based website
opinions and user forums, thus there is a need for reliable, empirically derived information that
has examined factors influential in rooting success of oil-type hemp. To directly address this

117
need, specific objectives of this investigation were to examine the influence of four substrate
compositions and five exogenous plant rooting hormone compounds on rooting success of eight
vegetatively propagated industrial hemp cultivars. Results from this investigation will assist plant
producers in selection of substrate and rooting hormones for efficient and reliable rooting
success.
Soilless substrate is commonly a mix of organic and inorganic components blended for a
particular use or application. Components are chosen so that the resulting media will have ideal
physical and chemical properties, primarily an adequate air supply and a high available water
content, and commercial germination blends often contain high proportions of peat or coir to
facilitate high water retention characteristics. Peat is the remains of grasses, mosses, and sedges
that have partially decomposed, removing nutrients and lowering the pH but leaving the main
plant structure intact, and can be classified based upon degree of decomposition and horticultural
species. With a low dry bulk density (Db), the dry mass per unit volume of moist substrate,
sphagnum peat moss is commonly used in propagation (Papadopoulos et al., 2008; Raviv et al.,
2002).
An alternative, rockwool is 60% diabase (basalt rock), 20% limestone, and 20%
horticultural coke that has been spun at high speeds, under temperatures as high as 1600 °C, to
attain fibers of ~0.005 mm diameter. These fibers are mixed with additives such as phenolic
resins and wettings agents, binding them and lowering hydrophobicity, before being pressed into
slabs or blocks (Raviv et al., 2002). This carries multiple advantages over soil-based substrates;
(i) high temperatures required to manufacture rockwool render it biologically inert, and (ii) the
manufacturing process renders a very consistent substrate that possesses an ideal air to water
ratio for horticultural production, especially for seed germination (Allaire et al., 2005).
118
Auxins are a class of phytohormones classified by their role in plant growth and
development. Response of compound formulation and concentration on rooting success is
species and sometimes cultivar dependent. Moreover, maturity of individual vegetative
propagules and hormone application technique can influence propagule root development.
Valued for their extensive history of use and consistent rooting response, indole-3-butryic acid
(IBA) and 1-naphthalenacetic acid (NAA) are common auxins utilized in commercial
propagation of plants (Boyer and Graves, 2009; Ludwig-Müller, 2000).
Materials and Methods
Hemp cultivar
Eight “high-CBD” hemp cultivars including ‘ACDC (A)’, ‘Cherry (C)’, ‘Super CBD (D)’
(Ano CBD; Niceville, FL), ‘ACDC (M)’, ‘JL Baux (L)’ (Colorado Hemp Institute, LLC.;
Parachute, CO), ‘Cherry Wine (N)’, ‘Mother Earth (Q)’, and ‘Wife (P)’ (Lone Star Valley, LLC.;
Monte Vista, CO) were selected to serve as mother stock plant material. Mother stock plants
were cultivated in a greenhouse located in Apopka, Florida, United States (latitude 28°38’ N,
longitude 81°33’ W) using 1000 W metal halide lamps to maintain a photoperiod of 18 hr.
daylight to ensure plants remained vegetative. Cuttings were excised from apical growth points
and included four visible internodes below the leaf primordia. Leaves at the first node were
tipped, while all remaining leaves were removed (second through four nodes below the leaf
primordia), and a 45-degree cut was made below the fourth node to increase vascular tissue
surface area exposure.
Substrate
Four soilless substrates were selected based on their Db and water holding capacities,
which was mainly influenced by percentage peat. To contrast the high peat substrate, synthetic
Grodan rockwool substrate was also selected and used. PRO-MIX High Porosity (HP)
119
Mycorrhizae Growing Medium (Premier Tech Horticulture; Quakertown, PA) is 65 - 75%
sphagnum peat moss, horticultural grade perlite, dolomitic and calcitic limestone, a wetting
agent, and their novel MYCORRHIZAE™ mycorrhizal inoculum (Glomus intraradices). With
an average Db of 0.13 - 0.16 g/cm3, this mix was formulated as a general-purpose media for
young plant propagation (Figure 6-1) (Horticulture, 2020). Jolly Gardener Pro-Line C/20
(Oldcastle Lawn & Garden, Atlanta, GA) has a slightly higher sphagnum peat moss percentage
and average Db at 80% and 0.16 - 0.19 g/cm3, respectively. With 20% perlite as the only other
listed component, this formulation is advertised for hanging baskets, flowering and foliage
plants, and as a light-weight mix for seeds and cuttings (Gardener, 2020; Supply, 2020). Finally,
at 85%, Berger BM6 All-Purpose mix has the highest sphagnum peat moss content and a median
average Db of 0.14 - 0.18 g/cm3. This soilless substrate mix also contains dolomitic and calcitic
lime, a non-ionic wetting agent, a starter charge, and is advertised as having a higher drainage
capability well suited for crops demanding quicker dry down periods and less water retention in
the root environment (Berger). Stone Wool A-OK 1.5” Starter Plugs (Grodan; Roermond, The
Netherlands), hereafter referred to as Grodan rockwool, has a Db range of 0.05 - 0.1 g/cm3
derived from combining the values 0.05 - 0.06 g/cm3 (Bougoul et al., 2005) and 0.07 - 0.1 g/cm3
(Raviv et al., 2002) will be used as reference.
Rooting hormone
Five rooting hormone treatments were prepared according to manufacturer
recommendations and included: Hormidin 1 (H1, 1,000 ppm IBA); Hormidin 2 (H2, 3,000 ppm
IBA); 1:10 Dip ‘N Grow (DNG, 1,000 ppm IBA/500 ppm NAA); 1:5 Hormex (Hx, 500 ppm
NAA); and an untreated Control (Figure 6-2). H1 and H2 (OHP, Inc., Bluffton, SC) were applied
directly in their powdered form to the freshly cut portion of the internode. The DNG (Dip ’N
Grow Inc, Clackamas, OR) liquid concentrate was diluted to a 1:10 ratio with distilled water,

120
reducing it from the packaged 10,000 ppm IBA/5,000 ppm NAA to the desired 1,000 ppm
IBA/500 ppm NAA, before the cut portion of the cuttings internodes were dipped in for three to
five seconds. The Hx Vitamin B1 and Hormone (Hormex, Westlake Village, CA) liquid
concentrate was diluted to a 1:5 ratio with distilled water, reducing the packaged 2,400 ppm
NAA to the desired 500 ppm NAA, before propagules were soaked for a duration of 5 minutes.
Experimental design
The experiment was designed as a 4 × 5 × 8 split-split-plot, with the main plot of
substrate (Grodan Rockwool, PRO-MIX HP, Berger BM6, and Jolly Gardner Pro-Line C/20)
divided between two trials, the sub-plot of rooting hormone application (Hx, DNG, H2, H1, and
control), and the sub-sub-plot of eight hemp cultivars: ‘ACDC’ (A), ‘Super CBD’ (B), ‘Cherry’
(C), ‘JL Baux’ (L), ‘ACDC’ (M), ‘Cherry Wine’ (N), ‘Wife’ (P), and ‘Mother Earth’ (Q) (Figure
6-2). Each of the 160 treatment combinations was replicated six times, once per tray, for a total
of 960 experimental units.
Rooting Phenotypes
Eight days after sticking (DAS), trays were checked daily for visual signs of protruding
roots by both examining the bottom of the tray and by temporarily removing individual cells.
Propagules were harvested for analysis 12 DAS when more than 50% of all propagules had
visible root protrusion according to the procedure outlined by Caplan et al. (2018a). Substrate
was rinsed from rooted cutting prior to measurement collection using either water alone or in
combination with forceps. Propagules were placed onto a 20” box fan (Lasko; West Chester, PA)
and cellulose filter (3M; Saint Paul, MN) for approximately 5 min to remove surface moisture.
Roots were then removed from each propagule with a razor blade and recorded for total root
number, laid end to end and measured for length, and weighed to record total wet root mass.

121
Total wet root mass was taken as total dry root mass would have been below the ten thousandths
of a gram detection limit of the scale for multiple samples.
Statistical Analysis
Statistical analysis was conducted using JMP version 14 software (SAS Institute, Cary,
NC). In an attempt to normalize data, due to a substantial proportion of zero values within the
distribution, the root number, root length, and root mass response variables were transformed
using the cube root transformation (Eq.1).
𝑦′ = √𝑦3 [Eq.1]
The three-factor split-split plot model (Eq. 2) was fitted as follows: where µ is the grand mean;
𝑦′𝑖𝑗𝑘𝑙𝑚
= 𝜇 + 𝑇𝑚 + 𝑇𝑅𝑙𝑚 + 𝛼𝑖 + 𝛼𝑇𝑅𝑖𝑙𝑚 + 𝛽𝑗 + 𝛼𝛽𝑖𝑗 + 𝛼𝛽𝑇𝑅𝑖𝑗𝑙𝑚+
𝑛𝛾𝑘 + 𝛼𝛾𝑖𝑘 + 𝛽𝛾𝑗𝑘 + 𝛼𝛽𝛾𝑖𝑗𝑘 + 𝜀𝑖𝑗𝑘𝑙𝑚 [Eq. 2.]
𝑇𝑚 is the random trial effect; 𝑇𝑅𝑙𝑚 is the random trial-by-rep interaction; 𝛼𝑖 is the fixed, main
plot (substrate) effect; 𝛼𝑇𝑅𝑖𝑙𝑚 is the random, error term of the main plot (substrate); 𝛽𝑗 is the
fixed, sub-plot effect (hormone); 𝛼𝛽𝑖𝑗 is the fixed, substrate-by-hormone interaction effect;
𝛽𝑇𝑅𝑗𝑙𝑚 is the random, error term of the sub-plot (hormone) and substrate-by-hormone
interaction; 𝛾𝑘 is the fixed, sub-sub-plot (cultivar) effect; 𝛼𝛾𝑖𝑘 is the fixed, substrate-by-cultivar
interaction effect; 𝛽𝛾𝑗𝑘 is the fixed, hormone-by-cultivar interaction effect; 𝛼𝛽𝛾𝑖𝑗𝑘 is the fixed,
substrate-by-hormone-by-cultivar interaction effect; and 𝜀𝑖𝑗𝑘𝑙𝑚 is the residual random error term
for sub-sub-plot (cultivar), substrate-by-cultivar, hormone-by-cultivar, and substrate-by-
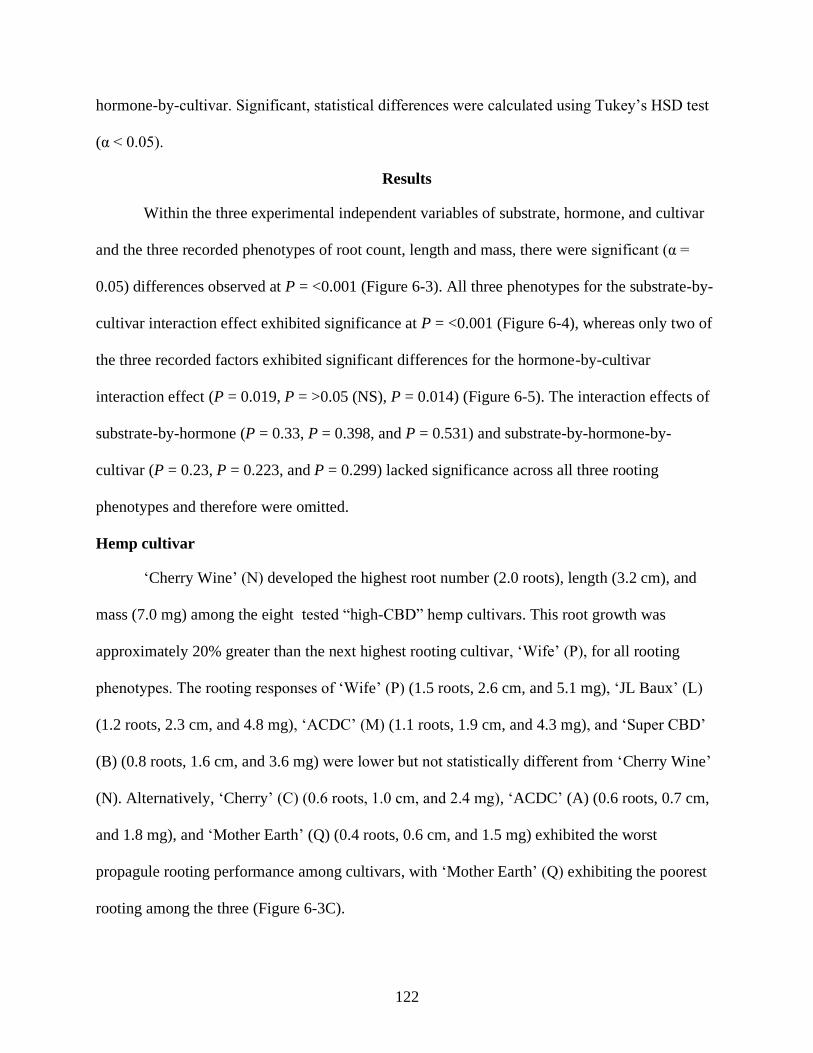
122
hormone-by-cultivar. Significant, statistical differences were calculated using Tukey’s HSD test
(α < 0.05).
Results
Within the three experimental independent variables of substrate, hormone, and cultivar
and the three recorded phenotypes of root count, length and mass, there were significant (α =
0.05) differences observed at P = <0.001 (Figure 6-3). All three phenotypes for the substrate-by-
cultivar interaction effect exhibited significance at P = <0.001 (Figure 6-4), whereas only two of
the three recorded factors exhibited significant differences for the hormone-by-cultivar
interaction effect (P = 0.019, P = >0.05 (NS), P = 0.014) (Figure 6-5). The interaction effects of
substrate-by-hormone (P = 0.33, P = 0.398, and P = 0.531) and substrate-by-hormone-by-
cultivar (P = 0.23, P = 0.223, and P = 0.299) lacked significance across all three rooting
phenotypes and therefore were omitted.
Hemp cultivar
‘Cherry Wine’ (N) developed the highest root number (2.0 roots), length (3.2 cm), and
mass (7.0 mg) among the eight tested “high-CBD” hemp cultivars. This root growth was
approximately 20% greater than the next highest rooting cultivar, ‘Wife’ (P), for all rooting
phenotypes. The rooting responses of ‘Wife’ (P) (1.5 roots, 2.6 cm, and 5.1 mg), ‘JL Baux’ (L)
(1.2 roots, 2.3 cm, and 4.8 mg), ‘ACDC’ (M) (1.1 roots, 1.9 cm, and 4.3 mg), and ‘Super CBD’
(B) (0.8 roots, 1.6 cm, and 3.6 mg) were lower but not statistically different from ‘Cherry Wine’
(N). Alternatively, ‘Cherry’ (C) (0.6 roots, 1.0 cm, and 2.4 mg), ‘ACDC’ (A) (0.6 roots, 0.7 cm,
and 1.8 mg), and ‘Mother Earth’ (Q) (0.4 roots, 0.6 cm, and 1.5 mg) exhibited the worst
propagule rooting performance among cultivars, with ‘Mother Earth’ (Q) exhibiting the poorest
rooting among the three (Figure 6-3C).

123
Substrate
Cuttings propagated in rockwool displayed the greatest rooting success for root number
(7.7 roots), length (9.5 cm), and mass (23.8 mg). This response was approximately 10-fold
greater than the next best performing substrate for all rooting phenotypes. Rooting success in
Berger BM6 (0.7 roots, 1.3 cm, and 2.7 mg) and PRO-MIX HP (0.59 roots, 1.6 cm, and 3.0 mg)
were statistically lower than rockwool but not statistically different from each another. Rooting
success was lowest in Pro-Line C/20 soilless substrate (< 0.1 roots, <0.1 cm, and <0.1 mg) which
equated to 0.12%, 0.21%, and 0.42% of rockwool’s performance (Figure 6-3A).
Rooting hormone
Root count, length, and mass of the rooting hormone sub-plot was insignificant between
hormone treatments but was significantly greater than the control. Application of H2 resulted in
the highest mean root mass at 6.2 mg, a 15.5-fold increase over the control (0.3 mg), followed by
Hx (6.0 mg) and DNG (5.8 mg). H2 (1.8 roots), DNG (1.6 roots), and Hx (1.5 roots) treatments
also resulted an increase in root number of approximately 18-, 16-, and 15-fold over the control
(0.1 roots), respectively. Application of Hx rooting hormone resulted in the greatest root length
value at 2.9 cm, a 17-fold increase over the control (0.2 cm), followed by the H2 (2.8 cm), and
DNG (2.6 cm) treatments. H1 had the least impact on rooting among the hormone treatments
(0.8 roots, 1.2 cm, and 2.9 mg) (Figure 6-3B).
Substrate-by-cultivar interaction
Of the eight cultivars, rooting phenotypes were maximized when rooted within rockwool
substrate, excluding ‘Super CBD’ (B) which performed best when propagated in Berger BM6.
Comparing other treatment combinations containing ‘Wife’ (P) against the best performing
treatment combination of Rockwool-by-Wife (P) (27.2 roots, 41.3 cm, and 84.6 mg) resulted in
reduced root numbers, lengths, and masses of 98, 96, and 98% for PRO-MIX HP-by-Wife (P)

124
(0.4 roots, 1.4 cm, and 2 mg); 99, 99, and 99% for Berger BM6-by-Wife (0.2 roots, 0.3 cm, and
0.7 mg); and >99, >99 and, >99% for Pro-Line C/20-by-Wife (P) (<0.1 roots, <0.1 cm, and <0.1
mg), respectively (Figure 6-4A). Conversely, of the nine lowest scoring treatment combinations,
eight contained Pro-Line C/20 potting mix. Average root numbers, lengths, and masses of <0.1
for the Pro-Line C/20-by-Cherry Wine (N), Pro-Line C/20-by-ACDC (M), Pro-Line C/20-by-
Super CBD (B), Pro-Line C/20-by-Cherry (C), Pro-Line C/20-by-Wife (P), and Pro-Line C/20-
by-Mother Earth (Q) combinations equated to reductions of >99% for all three rooting
phenotypes versus the highest scoring treatment combination of Rockwool-by-Wife (P) (27.2
roots, 41.3 cm, and 84.6 mg).
When the highest scoring treatment combination of Rockwool-by-Wife (P) (27.2 roots,
41.3 cm, and 84.6 mg) was compared to the other treatment combinations containing the
Rockwool substrate, decreased root numbers, lengths, and masses of 13, 22, and 19% for
Rockwool-by-Cherry Wine (N) (23.6 roots, 32.1 cm, and 68.1 mg); 47, 45, and 39% for
Rockwool-by-JL Baux (L) (14.5 roots, 22.8 cm, and 51.3 mg); 69, 75, and 69% for Rockwool-
by-Mother Earth (Q) (8.5 roots, 10.1 cm, and 26.4 mg); 78, 86, and 81% for Rockwool-by-
ACDC (A) (5.9 roots, 5.7 cm, and 15.6 mg); 82, 88, and 82% for Rockwool-by-ACDC (M) (4.9
roots, 5.1 cm, and 15.1 mg); 94, 97, and 95% for Rockwool-by-Cherry (C) (1.72 roots, 1.3 cm,
and 4.4 mg); and 98, 99, and 98% for Rockwool-by-Super CBD (B); 0.5 roots, 0.4 cm, and 1.8
mg) were observed.
Hormone-by-cultivar interaction
When comparing the four treatment combinations containing ‘Cherry Wine’ (N) against
the hormone-by-cultivar combination with the highest root number score, H2-by-Cherry Wine
(N) (4.5 roots) decreases in root number of 37% for H1-by-Cherry Wine (N) (2.8 roots); 38% for
DNG-by-Cherry Wine (2.8 roots); 55% for Hx-by-Cherry Wine (N) (2.0 roots); and 95%
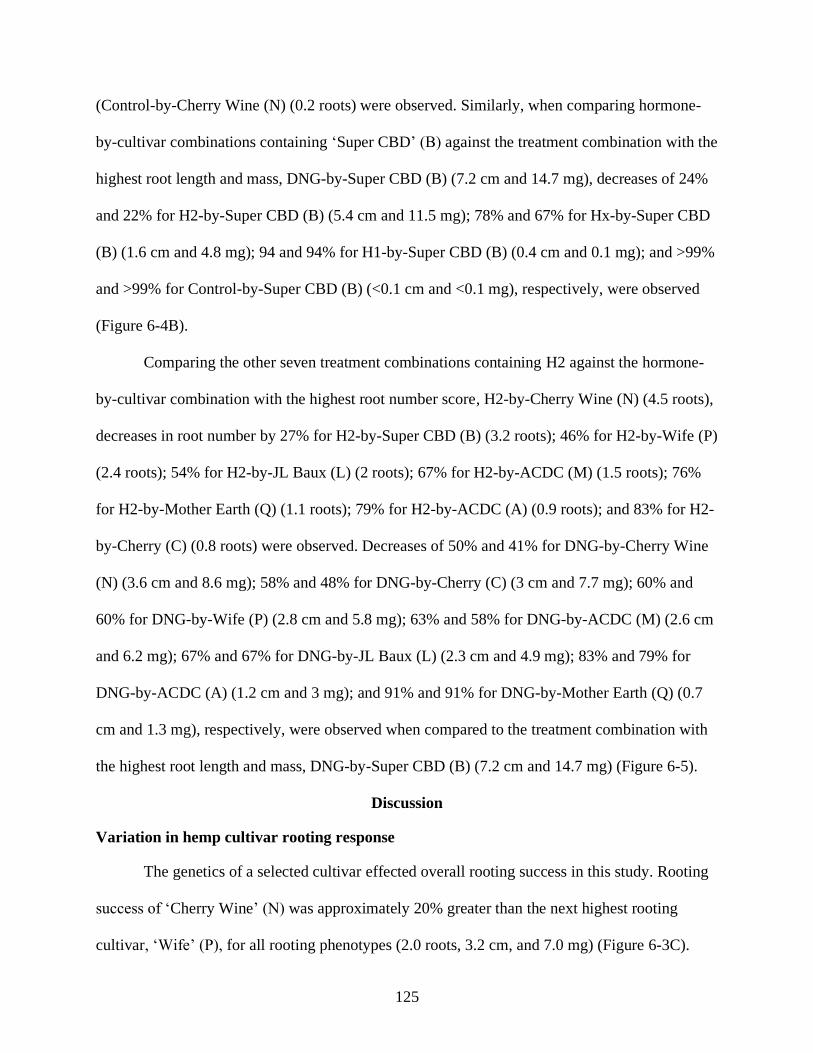
125
(Control-by-Cherry Wine (N) (0.2 roots) were observed. Similarly, when comparing hormone-
by-cultivar combinations containing ‘Super CBD’ (B) against the treatment combination with the
highest root length and mass, DNG-by-Super CBD (B) (7.2 cm and 14.7 mg), decreases of 24%
and 22% for H2-by-Super CBD (B) (5.4 cm and 11.5 mg); 78% and 67% for Hx-by-Super CBD
(B) (1.6 cm and 4.8 mg); 94 and 94% for H1-by-Super CBD (B) (0.4 cm and 0.1 mg); and >99%
and >99% for Control-by-Super CBD (B) (<0.1 cm and <0.1 mg), respectively, were observed
(Figure 6-4B).
Comparing the other seven treatment combinations containing H2 against the hormone-
by-cultivar combination with the highest root number score, H2-by-Cherry Wine (N) (4.5 roots),
decreases in root number by 27% for H2-by-Super CBD (B) (3.2 roots); 46% for H2-by-Wife (P)
(2.4 roots); 54% for H2-by-JL Baux (L) (2 roots); 67% for H2-by-ACDC (M) (1.5 roots); 76%
for H2-by-Mother Earth (Q) (1.1 roots); 79% for H2-by-ACDC (A) (0.9 roots); and 83% for H2-
by-Cherry (C) (0.8 roots) were observed. Decreases of 50% and 41% for DNG-by-Cherry Wine
(N) (3.6 cm and 8.6 mg); 58% and 48% for DNG-by-Cherry (C) (3 cm and 7.7 mg); 60% and
60% for DNG-by-Wife (P) (2.8 cm and 5.8 mg); 63% and 58% for DNG-by-ACDC (M) (2.6 cm
and 6.2 mg); 67% and 67% for DNG-by-JL Baux (L) (2.3 cm and 4.9 mg); 83% and 79% for
DNG-by-ACDC (A) (1.2 cm and 3 mg); and 91% and 91% for DNG-by-Mother Earth (Q) (0.7
cm and 1.3 mg), respectively, were observed when compared to the treatment combination with
the highest root length and mass, DNG-by-Super CBD (B) (7.2 cm and 14.7 mg) (Figure 6-5).
Discussion
Variation in hemp cultivar rooting response
The genetics of a selected cultivar effected overall rooting success in this study. Rooting
success of ‘Cherry Wine’ (N) was approximately 20% greater than the next highest rooting
cultivar, ‘Wife’ (P), for all rooting phenotypes (2.0 roots, 3.2 cm, and 7.0 mg) (Figure 6-3C).
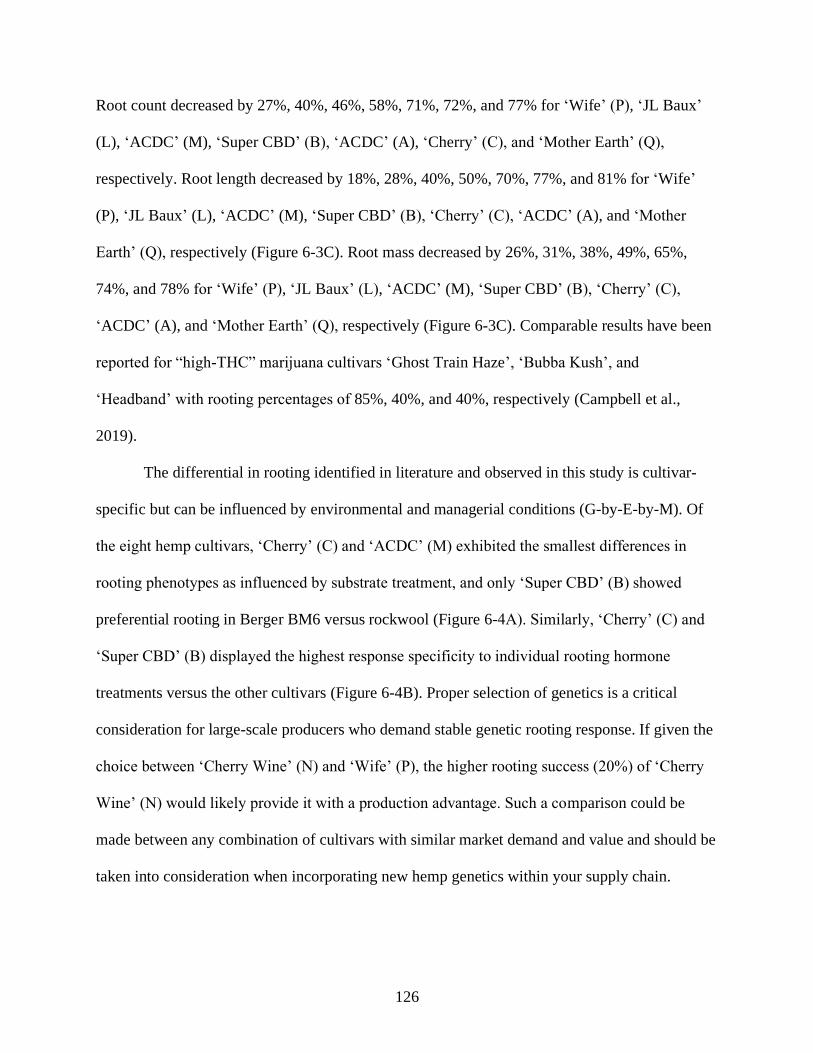
126
Root count decreased by 27%, 40%, 46%, 58%, 71%, 72%, and 77% for ‘Wife’ (P), ‘JL Baux’
(L), ‘ACDC’ (M), ‘Super CBD’ (B), ‘ACDC’ (A), ‘Cherry’ (C), and ‘Mother Earth’ (Q),
respectively. Root length decreased by 18%, 28%, 40%, 50%, 70%, 77%, and 81% for ‘Wife’
(P), ‘JL Baux’ (L), ‘ACDC’ (M), ‘Super CBD’ (B), ‘Cherry’ (C), ‘ACDC’ (A), and ‘Mother
Earth’ (Q), respectively (Figure 6-3C). Root mass decreased by 26%, 31%, 38%, 49%, 65%,
74%, and 78% for ‘Wife’ (P), ‘JL Baux’ (L), ‘ACDC’ (M), ‘Super CBD’ (B), ‘Cherry’ (C),
‘ACDC’ (A), and ‘Mother Earth’ (Q), respectively (Figure 6-3C). Comparable results have been
reported for “high-THC” marijuana cultivars ‘Ghost Train Haze’, ‘Bubba Kush’, and
‘Headband’ with rooting percentages of 85%, 40%, and 40%, respectively (Campbell et al.,
2019).
The differential in rooting identified in literature and observed in this study is cultivar-
specific but can be influenced by environmental and managerial conditions (G-by-E-by-M). Of
the eight hemp cultivars, ‘Cherry’ (C) and ‘ACDC’ (M) exhibited the smallest differences in
rooting phenotypes as influenced by substrate treatment, and only ‘Super CBD’ (B) showed
preferential rooting in Berger BM6 versus rockwool (Figure 6-4A). Similarly, ‘Cherry’ (C) and
‘Super CBD’ (B) displayed the highest response specificity to individual rooting hormone
treatments versus the other cultivars (Figure 6-4B). Proper selection of genetics is a critical
consideration for large-scale producers who demand stable genetic rooting response. If given the
choice between ‘Cherry Wine’ (N) and ‘Wife’ (P), the higher rooting success (20%) of ‘Cherry
Wine’ (N) would likely provide it with a production advantage. Such a comparison could be
made between any combination of cultivars with similar market demand and value and should be
taken into consideration when incorporating new hemp genetics within your supply chain.

127
Substrate selection can have a major effect on rooting response
In combination with superior genetics for rooting response, selection of an optimal rooting
substrate played a critical role in rooting success. Rockwool significantly improved rooting
response (7.7 roots, 9.5 cm, 23.8 mg) compared to reductions in root count, length, and mass of
90%, 86%, and 89% for Berger BM6 (0.7 roots, 1.3 cm, 2.7 mg); 92%, 83%, and 87% for PRO-
MIX HP (0.6 roots, 1.6 cm, 3 mg); and >99%, >99%, and >99% for Jolly Gardner Pro-Line C/20
(<0.1 roots, <0.1 cm, 0.1 mg), respectively (Figure 6-3A). During production, the “uniformity in
density, size, and weight” that Grodan advertises for their stone wool products carries multiple
advantages over commercial potting mixes. Whether it’s the uniform substrate consistency,
optimal air-to-water ratio (due to high porosity and water-holding capacity), a lack of
competitive organisms (due to the high temperatures used during manufacturing), or a
combination of the three; Grodan rockwool significantly outperformed the other three substrate
experimental treatments (Allaire et al., 2005).
When comparing the three commercially available potting mixes utilized, the primary
factor considered was the peat concentration, ranging from 65 - 75%, 80%, and 85% for the
PRO-MIX HP, Jolly Gardner Pro-Line C/20, and Berger BM6 substrates, respectively (Figure 6-
3A). Hemp prefers well-aerated soils with loose compaction and high organic matter
concentration; poorly drained or compacted soils can result in difficulty establishing seedlings
and young plants. Therefore, it could be hypothesized that rooting success would be improved as
peat concentration was increased (Small et al., 2002). This is consistent with the rooting number
for the Berger BM6 and PRO-MIX HP substrates, which decreased from 0.7 roots to 0.6 roots as
the peat concentration was decreased from 85% to 65 - 75% (Figure 6-3A). Although, this is
contradicted by the root length (<0.1 cm) and mass (<0.1 mg) for Pro-Line C/20. In the context
of density, the higher Db, and therefore higher level of compaction reported for the Jolly Garner

128
Pro-Line C/20 versus Berger BM6 and PRO-MIX HP substrates, could also be responsible for its
poor rooting success (Amaducci et al., 2008).
Application of a rooting hormone substantially increased rooting versus a control
Selection of rooting hormone had minimal impact on rooting success compared to
cultivar and substrate selection, although, significant improvement was achieved when using a
hormone versus the control. H2 had the greatest root count (1.8 roots) and mass (6.2 mg)
compared to a 12%, 17%, 56%, and 94% reduction in root count and a 7%, 3%, 53%, and 94 %
reduction in root mass when DNG, Hx, H1, and control treatments were applied, respectively
(Figure 6-3B). Hx had the longest root length (2.9 cm) compared to a 3%, 11%, 58%, and 94%
reduction in root length when H2, DNG, H1, and control treatments were applied, respectively
(Figure 6-3B).
Proper selection of rooting hormone could play a critical role in optimization of rooting
success, but to a lesser extent compared to cultivar and substrate selection. Caplan et al. (2018a)
found that the position (apical or basal) C. sativa cuttings were taken from had little effect on
success or quality of rooting, but that application of a 0.2% IBA treatment exhibited a 2.1-fold
increased rate of rooting success and 1.6-fold increased root quality when compared to a 0.2%
willow (Salix alba L.) extract. Our results demonstrate that higher concentrations of hormone
resulted in improve rooting response, e.g., (i) the 3000 ppm indole-3-butyric (IBA) (H2)
concentration caused maximal root numbers and mass, (ii) the 500 ppm 1-Naphthaleneacetic
acid (NAA) (Hx) treatment resulted in the longest root length, and (iii) the 1000 ppm IBA/500
ppm NAA combination (DNG) was in between.
Conclusion
Differing agricultural techniques stemming from cultural preferences interacting with
varied environmental factors have led to a wide and diverse industrial hemp phenotype, and the

129
blossoming industrial hemp and cannabinoid markets will necessitate a reliable supply of
consistently cultivated to produce the extracts, consumer goods, and other associated products
required. Our study identified: (i) variances in genetics among cultivar effect hemp rooting; (ii)
substrate selection significantly effects rooting response of hemp vegetative cuttings; (iii) the use
of a rooting hormone significantly increases rooting success; and (iv) specific interactions occur
between cultivars and substrates or hormones, although the substrate or hormone selection may
overcome one another. While multiple methods exist for the propagation of industrial hemp,
rooting success of vegetative cuttings will be maximized by proper selection of ideal hemp
cultivars and substrate, in combination with a rooting hormone.

130
Figure 6-1. Cross section, dry bulk density (Db) in lb./ft.3 and g/cm3, sphagnum peat moss
content (%) and pH for the four experimental substrates. Photo credits: Sean M.
Campbell.

131
Figure 6-2. Overhead and schematic view of a 72-count cell-pack tray. The middle 40 cells were
filled with one of the four substrates (main plot); further divided into the five rooting
hormone treatments (sub-plot): Hormidin 1 (H1, 1,000 ppm IBA); Hormidin 2 (H2,
3,000 ppm IBA); 1:10 Dip ‘N Grow (DNG, 1,000 ppm IBA/500 ppm NAA); 1:5
Hormex (Hx, 500 ppm NAA) and an untreated Control; and filled with one replicate
each for the eight hemp cultivars (sub-sub-plot): ACDC (A), Super CBD (B), Cherry
(C), JL Baux (L), ACDC (M), Cherry Wine (N), Wife (P), and Mother Earth (Q).
Photo credit: Sean M. Campbell.
H1 H2 Hx DNG Control
M N C M L Q Q L P B
L A N Q M A M C N A
P B A L P C B A C M
Q C B P B N N P Q L

132
Figure 6-3. Root number (roots; top row), length (cm, center row), and mass (mg; bottom row)
for the substrate, hormone, and cultivar independent variables for industrial hemp
(Cannabis sativa) vegetative cuttings. A) Substrate treatments. B) Hormone
treatments: Hormidin 1 (H1, 1,000 ppm IBA); Hormidin 2 (H2, 3,000 ppm IBA);
1:10 Dip ‘N Grow (DNG, 1,000 ppm IBA/500 ppm NAA); 1:5 Hormex (Hx, 500
ppm NAA) and an untreated Control. C) Cultivar treatments. Bars plot represent
group means and error bars represent the 95th confidence interval of each group.
Connect letter represent Tukey HSD significant difference tests (α=0.05).

133
Figure 6-4. Visual representation of root number, length (cm), and mass (mg) for the substrate-
by-cultivar and hormone-by-cultivar interactions for industrial hemp (Cannabis
sativa) vegetative cuttings. A) Substrate-by-cultivar interaction. B) Hormone-by-
cultivar interaction. Root number (roots; left column), length (cm; center column),
and mass (mg; right column). Points are independent and lines are being used for
visualization purposes.

134
Figure 6-5. Visual representation of root number for the substrate-by-cultivar interaction for
industrial hemp (Cannabis sativa) vegetative cuttings. Points are independent and
lines are being used for visualization purposes.

135
CHAPTER 7
SUMMARY
C. ternatea is namely valued in North America for the vibrant color and pH-dependent
changing ability of its flowers (Marpaung et al., 2020; Wiboonsirikul, 2019), which are prevalent
in consumer goods, agricultural products, biotechnology, and medicine (Oguis et al., 2019; Siti
Azima et al., 2017). Further, recent public awareness in the environmental implications of food,
beverages, cosmetics and pharmaceuticals coupled with health concerns associated with
consumption (Chu et al., 2016; McCann et al., 2007) and use (Pham T. N. et al., 2020) of
synthetic food colorants has popularized the use of C. ternatea globally. The flowers can be
consumed in a variety of applications, including fresh, dried, extracted, or tempura fried
(Duncan, 2017). The leaves, young shoots, and soft pods are consumed as a vegetable in the
Philippines and India (Mahfouz et al., 2020), and it is one of the most popular livestock forage
crops globally (Mahfouz et al., 2019).
Studies indicate that consumption of C. ternatea flowers can result in a significant
increase in plasma antioxidant capacity with a concurrent reduction of lipid peroxidation by-
products (Adisakwattana et al., 2020). This is credited to the elevated anthocyanin concentration
(Mahmad and Taha, 2018), which is higher than roselle or dragon fruit (Pham Tri Nhut et al.,
2019). Anthocyanins are responsible for the red, purple, and blue pigments found in plants
(Mahmad and Taha, 2018; Mehmood et al., 2019) and are one of the most utilized natural food
colorants (Marpaung and Pramesthi, 2020). C. ternatea flower extract in particular is noted for
its high color density and chroma values (Siti Azima et al., 2017). Upon introduction of a novel
crop, vital cultivation methodologies are often assessed at publicly funded institutions, saving
growers and producer’s valuable time and resources. In light of the advantageous qualities
136
supporting utilization, a series of research projects were conducted to assess the viability of C.
ternatea as a production crop within Florida and the rest of North America.
Propagation
With a surge potential applications coupled with a heavy seeding rate of between 6 and
3,400 total seeds per plant from an assay of 19 varying accessions, the need to maximize
germination viability of C. ternatea seeds during production has become increasingly crucial
(Morris, 2009). Given the prevalence in nursery growers among our invested stakeholders,
substrate type, substrate temperature, and seed scarification technique were chosen as the
independent variables for the two experimental studies conducted on C. ternatea, while cultivar,
substrate type, and rooting hormone application were used for the corroborating study on another
newly introduced production crop, industrial hemp (C. sativa).
Two different substrate types were utilized for the first C. ternatea experiment, a soilless
substrate mix (Fafard 4P; Sun Gro Horticulture, Agawam, MA) and rockwool (Grodan,
Roermond, The Netherlands) alongside 70, 80, and 90 °F substrate temperature treatments.
Results suggest that C. ternatea germination uniformity is maximized when the rockwool
substrate is used at a substrate temperature of approximately 70 °F. This is further confirmed by
germinability (G) values for the substrate temperature by substrate type interaction effects, where
the 70 °F rockwool, 80 °F rockwool, and 70 °F soilless substrate treatment combinations
exhibited the highest numbers of viable, germinated seeds at 98%, 92%, and 87%, respectively.
Expanding on the conclusions of the first germination study, the second utilized three
experimental substrate temperature treatments of 70, 75, and 80 °F alongside three experimental
seed scarification treatments; either physical scarification with a small nick to the seed coat using
a razor blade, physical scarification with the razor blade before a 24 hour soak in deionized water
(DI) water, and a control that wasn’t scarified or soaked. Both variables had treatments that
137
resulted in maximal germinability but with opposite relationships to the mean germination time
and rate. The 70 °F treatment reached maximal germination (54.8%) at the highest time (2.61 d)
and slowest rate (0.39 d-1) while the scarified and soaked seed scarification treatment reached
maximal germination (80.9%) at the lowest time (2.06 days) and fastest rate (0.51 d-1).
These results were corroborated in the industrial hemp (C. sativa) study, where eight
“high-CBD” hemp cultivars, four soilless substrates, and five rooting hormone treatments were
assessed for their effect on vegetative propagule rooting success. Results indicated that variances
in genetics among cultivar influenced hemp rooting, with ‘Cherry Wine’ (N) developing the
highest root number (2.0 roots), length (3.2 cm), and mass (7.0 mg) among the eight tested.
Substrate selection also affected rooting response, with cuttings propagated in rockwool
displaying the greatest root number (7.7 roots), length (9.5 cm), and mass (23.8 mg),
approximately 10-fold greater than the next best performing substrate for all rooting phenotypes.
Finally, application of Hormidin 2 resulted in the highest number (1.8 roots), approximately 18-
fold over the control (0.1 roots), and mass (6.2 mg), a 15.5-fold increase over the control (0.3
mg), while application of Hormex resulted in the greatest length (2.9 cm), a 17-fold increase over
the control (0.2 cm). While multiple methods exist for the propagation of industrial hemp,
rooting success of vegetative cuttings will be maximized by proper selection of ideal hemp
cultivar in combination with the rockwool substrate and application of a rooting hormone.
Growing Structure
Following germination, other production parameters were considered for C. ternatea. The
May 2019 issue of the Florida Breweries Report listed 351 licensed breweries in the state, with
51 new breweries reported in the last year since the May 2018 issue of the report (BrewersLaw,
2018; BrewersLaw, 2019). Concurrently, the Imbibe beverage development firm stated in their
2019 Beverage Trend Predictions that “butterfly pea flower tea will be the rising star of 2019

138
because it is high in antioxidants and naturally changes color from blue to purple when acidity is
added to it” (McHugh, 2018). These factors combined with its multiple applications make C.
ternatea an ideal candidate to supplement the strong agritourism industry in the state.
Three experimental structures plus an unsupported control were utilized for this
experiment assessing the effect of growing structure on flower production in C. ternatea,
including a 3 m (~10 ft.) short trellis consisting of two jute twine strings suspended in a V
pattern, a 1.5 m (~5 ft.) welded wire garden fence, and a 137.2 cm (54 in.) galvanized tomato
cage. With 33.24 flowers, 8.25 g wet weight, and 1.36 g dry weight, both the 1.5 m wire fence
and the 3 m short trellis (29.2 flowers, 7.22 g wet weight, and 1.13 g dry weight) significantly
outperformed the tomato cage and the unsupported control. Placed within existing crop rows or
alongside buildings, these structures allow for easily manicured and maintained plants with
ample access for untrained pickers, two crucial elements for any U-Pick type operation.
Fertilization and Irrigation
In Florida, sandy soils with minimal water and nutrient holding capacity are common. As
a result, a significant concern within commercial crop production is the application of
appropriate fertilization and irrigation to ensure that plant needs are sufficiently met for plant
growth and development but not to the point that resources are squandered or contaminated. An
experimental trail was conducted to establish an optimal application rates for fertilizing and
irrigating C. ternatea, using the Konica Minolta SPAD-502Plus hand-held meter to assess the
effect these cultivation parameters have on growth characteristics and flower production.
Fertilization was applied in four rates, corresponding to the high (65 g), medium (45 g), low (24
g), and control (0 g) rates specified for the Osmocote Plus 15-9-12, 5 - 6 Month, Controlled
Release Fertilizer. Irrigation was separated into two schedules, both utilizing the same irrigation
rate, but with one group receiving irrigation daily and the other receiving it every 3rd day.

139
Within fertilization, all three PGI parameters indicated that the low fertilization treatment
exhibited the best growth and development at a height of 124.98 cm and with 18.81 nodes and
2.52 flowers. This is followed by the medium (101.6 cm, 17.23 nodes, 1.7 flowers), high (97.66
cm, 16.12 nodes, 1.82 flowers), and control (90.9 cm, 15.93 nodes, 1.18 flowers) fertilization
rates. Alternatively, the high fertilizer treatment exhibited the highest average SPAD index-value
(44.41) followed by the medium (41.71), low (40.66), and control (32.43) treatments. The SPAD
index-value correlates to the relative chlorophyll content of the leaf and is an indirect indicator of
N content. The fertilizer utilized contains 15% N and consequently the observed trend between
increasing fertilization rate and SPAD index-value is consistent with expectations. Finally, the
del-3-glu concentration (mg/L) values lacked both significance and a discernable trend for the
medium (15.59 mg/L), control (14.73 mg/L), high (13.61 mg/L), and low (11.63 mg/L)
fertilization rates.
Results for the irrigation independent variable also exhibited significance as the every 3rd
day irrigation treatment (110.38 cm height, 17.75 nodes, 1.94 flowers, and 40.97 SPAD index-
value) exhibited preferable growth and development over the daily-irrigated group (95.79 cm,
16.15 nodes, 1.64 flowers, and 38.51 SPAD index-value). Other researchers found that lowered
irrigation and/or decreased plant available water similarly resulted in either greater or similar
growth and development when compared to plants that have their water needs met, and therefore
our results are consistent with literature. Another response of drought and water stress is the
buildup of osmotica in the plant cells, or substances that contribute to regulation of osmotic
pressure and can function as protective agents. Thus, duration of stress and/or recovery from
previous stress events are also critical factors that influence synthesis of secondary plant
metabolites (Fonseca et al., 2006; Niinemets, 2016; Selmar and Kleinwächter, 2013). The every
140
3rd day treatment exhibited significantly higher del-3-glu concentrations at 15.44 vs. 11.95 mg/L
when compared to the daily irrigated group and is consistent with the reported trends.
C. ternatea Cultivation
Overall, optimal germination in C. ternatea seeds was obtained through physical
scarification by nicking the seed coat, soaking for 24 hours in DI water, before germinating the
seeds in rockwool maintained at an optimal substrate temperature (To) of 70 °F. The 1.5 m wire
fence growing system exhibited the best results among those tested for potential production or
agritourism operations, though the 3 m short trellis is a suitable alternative if required by
growing environment constraints. Low fertilization rates should be employed to maximize C.
ternatea growth, development, and flower yield, with more work needed to assess the effect on
flower quality. Finally, irrigation should be applied in a deficit to boost plant growth and
stimulate synthesis and accumulation of secondary plant metabolites like del-3-glu. Given these
parameters, it is the authors opinion that C. ternatea would make an appropriate production crop
and should be adopted in Florida as well as other comparable growing environments within
North America.

141
LIST OF REFERENCES
Adisakwattana, S., P. Pasukamonset, and C. Chusak. 2020. Chapter 18 - Clitoria ternatea
beverages and antioxidant usage, p. 189-196. In: V.R. Preedy (ed.). Pathology. Academic
Press. doi: 10.1016/B978-0-12-815972-9.00018-4.
Atlas of Florida Plants, AFP. 2020. Clitoria ternatea. Institute for Systematic Biology (ISB).
https://florida.plantatlas.usf.edu/plant.aspx?id=1486.
Akula, R. and G.A. Ravishankar. 2011. Influence of abiotic stress signals on secondary
metabolites in plants. Plant Signal. Behav. 6:1720-1731. doi: 10.4161/psb.6.11.17613.
Al-Zamanan, S.M.M., F.S. El-Nakhlawy, and A. Elfeel. 2016. Effect of Nitrogen, Shading and
Intercropping on Clitoria Forage Production in Ziziphus based Agroforestry System
under Arid Land Conditions of Jeddah. Sci. Agri. 14:239-242. doi:
10.15192/PSCP.SA.2016.14.2.239242.
Alderete-Chavez, A., J.J. Guerra-Santos, N. De la Cruz-Landero, E.G. Brito, R., E.N. Gelabert,
R., E. E., and L.E. Amador-del Angel. 2011. Evaluation of Clitoria ternatea L. in
Relation with Fertility in Tropical Soils. J. Appl. Sci. 11:1044-1048. doi:
10.3923/jas.2011.1044.1048.
Allaire, S.E., J. Caron, C. Ménard, and M. Dorais. 2005. Potential replacements for rockwool as
growing substrate for greenhouse tomato. Can. J. Soil Sci. 85:67-74. doi: 10.4141/S04-
026.
Amaducci, S., A. Zatta, M. Raffanini, and G. Venturi. 2008. Characterisation of hemp (Cannabis
sativa L.) roots under different growing conditions. Plant Soil. 313:227. doi:
10.1007/s11104-008-9695-0.
Austin, D.F. 2004. Florida Ethnobotany. Taylor & Francis Group. doi: 10.1201/9780203491881.
Aye, T.T. and S.S. Lin. 2020. Taxonomy and Pollen Morphology of Nine Species in Fabaceae. J.
Myanmar Acad. Arts Sci. 18:301-313.
Bailey, R., B. Pearson, R. Trigiano, and D. Gray. 2017. The Derivation of Modern Cannabis
Varieties. Crit Rev Plant Sci. 35:1-21. doi: 10.1080/07352689.2016.1273626.
Bakhashwain, A.A.S. and A. Elfeel. 2011. Foliage productivity and quality of valuable medicinal
plant (Clitoria ternatea L.) as affected by different fertilizers. J. Med. Plant Res. 6:4225-
4230. doi: 10.5897/JMPR12.321.
Ball, V. 1998. Ball Redbook. Ball Pub.
Barik, D.P., S.K. Naik, A. Mudgal, and P.K. Chand. 2007. Rapid plant regeneration through in
vitro axillary shoot proliferation of butterfly pea (Clitoria ternatea L.) - a twinning
legume. In Vitro Cell. Dev. Biol. Plant. 43:144-148. doi: 10.1007/s11627-007-9040-y.
142
Benda, C.D. 2020. Plant of the Week Butterfly Pea (Clitoria mariana L.). U.S. Forest Service,
https://www.fs.fed.us/wildflowers/plant-of-the-week/clitoria_mariana.shtml.
Berger. Berger BM6 Technical Data Sheet. Berger, https://www.amleo.com/images/art/BM6-
Tech-Sheet.pdf.
Bougoul, S., S. Ruy, F. Groot, and T. Boulard. 2005. Hydraulic and physical properties of
stonewool substrates in horticulture. Sci. Hort. - Amsterdam. 104:391-405. doi:
10.1016/j.scienta.2005.01.018.
Boyer, N.Z. and W.R. Graves. 2009. NAA is More Effective Than IBA for Rooting Stem
Cuttings of Two Nyssa spp. J. Environ. Hortic. 27:183-187. doi: 10.24266/0738-2898-
27.3.183.
Campbell, L.G., S.G.U. Naraine, and J. Dusfresne. 2019. Phenotypic plasticity influences the
success of clonal propagation in industrial pharmaceutical Cannabis sativa. PLOS ONE
14:e0213434. doi: 10.1371/journal.pone.0213434.
Campbell, S.M., B.J. Pearson, and C.S. Marble. 2020. Influence of Substrate Type and
Temperature on Germination of Butterfly Pea. HortTech. 30:1-6. doi:
10.21273/HORTTECH04583-20.
Caplan, D., J. Stemeroff, M. Dixon, and Y. Zheng. 2018a. Vegetative propagation of cannabis by
stem cuttings: Effects of leaf number, cutting position, rooting hormone, and leaf tip
removal. Can. J. Plant Sci. 98. doi: 10.1139/CJPS-2018-0038.
Caplan, D., Y. Zheng, and M. Dixon. 2018b. Propagation and Root Zone Management for
Controlled Environment Cannabis Production.
Chu, B.S., J. Wilkin, M. House, M. Roleska, and M. Lemos. 2016b. Effect of Sucrose on
Thermal and pH Stability of Clitoria ternatea Extract. Int. J. Food Process. Technol.
3:11-17. doi: 10.15379/2408-9826.2016.03.01.02.
Collins, R. and T. Grundy. 2005. The butterfly pea book : a guide to establishing and managing
butterfly pea pastures in central Queensland. Dept. of Primary Industries and Fisheries,
Brisbane, Queensland.
Congress, U. 2018. Agricultural Act of 2018. US Government Printing Office, Washington, DC,
USA.
Das, M., S. Pramod, and M. Sharma. 2019. Effect of moisture content and storage temperature
on germination and seedling vigor index in Clitoria ternatea L. Med. Plants-Int. J. of
Phytomed. and Rel. Ind. 11:387-395.
Das, M.L., M. Sharma, and P. Sivan. 2017. Seed Germination and Seedling Vigor Index in Bixa
orellana and Clitoria ternatea. Int. J. Pure App. Biosci. 5:15-19. doi: 10.18782/2320-
7051.2869.

143
Debaeke, P., P. Rouet, and E. Justes. 2006. Relationship Between the Normalized SPAD Index
and the Nitrogen Nutrition Index: Application to Durum Wheat. J. Plant Nutr. 29:75-92.
doi: 10.1080/01904160500416471.
Duncan, J. 2017. Cover Crop Options for Hot and Humid Areas. National Center for Appropriate
Technology, https://attra.ncat.org/product/cover-crop-options-for-hot-and-humid-areas/.
Edwardson, J.R. 1952. Hops - Their botany, history, production and utilization. Econ. Bot.
6:160-175. doi: 10.1007/BF02984875.
Elio, J., J.V. John, J.C. Daniel, and J.S. Peter. 2005. Greenhouse-grown Colored Peppers: A
Profitable Alternative for Vegetable Production in Florida? HortTech. 15:355-369. doi:
10.21273/HORTTECH.15.2.0355.
Extension, N.S. 2020. North Carolina Extension Gardener Plant Toolbox - Clitoria ternatea. NC
State Extension, https://plants.ces.ncsu.edu/plants/clitoria-ternatea/.
Fantz, P.R. 2000. Nomenclatural Notes on the Genus Clitoria for the Flora North American
Project. Castanea 65:89-92.
Fonseca, J.M., J.W. Rushing, N.C. Rajapakse, R.L. Thomas, and M.B. Riley. 2006. Potential
implications of medicinal plant production in controlled environments: The case of
feverfew (Tanacetum parthenium). HortScience 41:531-535. doi:
10.21273/HORTSCI.41.3.531
Garden, M.B. 2020. Plant Finder - Clitoria ternatea.
http://www.missouribotanicalgarden.org/PlantFinder/PlantFinderDetails.aspx?taxonid=2
80445.
Gardener, J. 2020. Jolly Gardener Soil Products. In: Oldcastle (ed.).
https://jollygardener.com/soil_jg_mixes.htm.
Griesser, M., G. Weingart, K. Schoedl-Hummel, N. Neumann, M. Becker, K. Varmuza, F.
Liebner, R. Schuhmacher, and A. Forneck. 2015. Severe drought stress is affecting
selected primary metabolites, polyphenols, and volatile metabolites in grapevine leaves
(Vitis vinifera cv. Pinot noir). Plant Physiol. Biochem. 88:17-26. doi:
10.1016/j.plaphy.2015.01.004.
Germplasm Resource Information Network, G.R.I.N. 2020. Taxon: Clitoria ternatea L. U.S.
National Plant Germplasm System, https://npgsweb.ars-
grin.gov/gringlobal/taxon/taxonomydetail?id=10942.
Heimler, D., A. Romani, and F. Ieri. 2017. Plant polyphenol content, soil fertilization and
agricultural management: a review. Eur. Food Res. Technol. 243:1107-1115. doi:
10.1007/s00217-016-2826-6.
Henry, M.B. and K.A. Stofer. 2017. Florida's Agritourism Laws. UF/IFAS Electronic Display
Information Service (EDIS) #AEC623.
144
Horticulture, Premier Tech. 2020. PRO-MIX HP Mycorrhizae Product Specifications.
https://www.pthorticulture.com/en/products/pro-mix-hp-mycorrhizae/#tab:product-
specification.
Hutasoit, R. 2018. Evaluation of four pasture legumes species as forages and cover crops in oil
palm plantation. JITV 22:124. doi: 10.14334/jitv.v22i3.1801.
Integrated Taxonomic Information System, ITIS. 2020. Clitoria ternatea L.,
https://www.itis.gov/servlet/SingleRpt/SingleRpt?search_topic=TSN&search_value=265
43#null.
International Seed Testing, A. 2013. International rules for seed testing: Weight determination.
Int. Seed Testing Assoc., Bassersdorf, Switzerland.
International Plant Names Index, IPNI. 2020. Clitoria ternatea L., Sp. Pl. 2: 753 (1753).
https://www.ipni.org/n/486606-1.
Invasive.org. 2018. Asian pigeonwings Clitoria ternatea L.
https://www.invasive.org/browse/subinfo.cfm?sub=24610.
Jelantik, I., T. Nikolaus, C. Leo Penu, G. Malelak, and I. Benu. 2019. Forage Production and
Nutritive Value of (Clitoria Ternatea) Harvested at 60, 75 And 90 Days After Planting.
Pastura 8:76. doi: 10.24843/Pastura.2019.v08.i02.p03.
Jezek, M., C. Zörb, N. Merkt, and C.-M. Geilfus. 2018. Anthocyanin Management in Fruits by
Fertilization. J. Agric. Food Chem. 66:753-764. doi: 10.1021/acs.jafc.7b03813.
Johnson, R. 2018. Hemp as an Agricultural Commodity. Congressional Research Service,
Washington, DC, USA.
Kazuma, K., N. Noda, and M. Suzuki. 2003. Flavonoid composition related to petal color in
different lines of Clitoria ternatea. Phytochemistry 64:1133-1139. doi: 10.1016/S0031-
9422(03)00504-1.
Kondo, T. and H. Higuchi. 2012. Effects of Nitrogen Form and Concentration in Fertilizer on
Vegetative Growth, Flowering, and Leaf Mineral Contents of Passion Fruit. Trop. Agric.
Dev. 56:123-128. doi: 10.11248/jsta.56.123.
Kungsuwan, K., K. Singh, S. Phetkaoand, and N. Utama-ang. 2014. Effects of pH and
anthocyanin concentration on color and antioxidant activity of Clitoria ternatea extract.
FABJ 2:31-46. doi: 10.14456/fabj.2014.3
Kähkönen, M.P., J. Heinämäki, V. Ollilainen, and M. Heinonen. 2003. Berry anthocyanins:
isolation, identification and antioxidant activities. J. Sci. Food Agric. 83:1403-1411. doi:
10.1002/jsfa.1511.
145
Lakshan, S., C. Pathirana, N. Jayanath, and W. Abeysekara. 2020. Antioxidant and selected
chemical properties of the flowers of three different varieties of Butterfly Pea (Clitoria
ternatea L.). Ceylon J. Sci. 49:195-201. doi: 10.4038/cjs.v49i2.7740.
Law, B. 2018. The Florida Breweries Report - May 2018. https://brewerslaw.com/the-florida-
breweries-report-may-2018/.
Law, B. 2019. The Florida Breweries Report - May 2019. https://brewerslaw.com/the-florida-
breweries-report-may-2019/.
Lee, J., R. Durst, and R. Wrolstad. 2005. Determination of total monomeric anthocyanin pigment
content of fruit juices, beverages, natural colorants, and wines by the pH differential
method: Collaborative Study. Journal of AOAC International 88:1269–1278. doi:
10.1093/jaoac/88.5.1269
Lee, M.J. 2019. The Legalization of Hemp. Food and Drug Law Institute, Washington, DC,
USA. https://www.fdli.org/2019/02/the-legalization-of-hemp/.
Ling, Q., H. Weihua, and P. Jarvis. 2011. Use of a SPAD-502 meter to measure leaf chlorophyll
concentration in Arabidopsis thaliana. Photosynth. Res. doi: 10.1007/s11120-010-9606-0.
Ludwig-Müller, J. 2000. Indole-3-butyric acid in plant growth and development. Plant Growth
Regul. 32:219-230. doi: 10.1023/A:1010746806891.
Mackay, W., T.D. Davis, and D. Sankhla. 2001. Influence of scarification and temperature on
seed germination of Lupinus arboreus. Seed Sci. Technol. 29:543-548.
Mahfouz, H., E.A. Megawer, A. Maher, and A. Shaaban. 2020. Integrated effect of planting
dates and irrigation regimes on morpho-physiological response, forage yield and quality,
and water use efficiency of clitoria (Clitoria ternatea L.) in arid region. Arch. Agron. Soil
Sci. 66:152-167. doi: 10.1080/03650340.2019.1605165.
Mahfouz, H., E.A. Megawer, and A. Shaaban. 2019. Planting dates and plant densities influence
on morpho-physiological responses, forage productivity and nutritive value of Clitoria in
an arid region. Discovery Agriculture 5:105-118.
Mahmad, N. and R.M. Taha. 2018. Effects of pH, UV-B radiation and NaCl on anthocyanin
stability from vivid blue petals of Clitoria ternatea L., a potential natural colourant from
legume crop. Pigment & Resin Technology 47:507-510. doi: 10.1108/PRT-11-2016-
0106.
Makasana, J., J. Patel, V. Pillai, A. Sharma, B. Dholakiya, N. Gajbhiye, and R. Saravanan. 2016.
Effect of seed treatment on germination and flavonoids diversity in accessions of
butterfly pea (Clitoria ternatea). Indian J. Agric. Sci. 86:1553-1558.
Markwell, J., J.C. Osterman, and J.L. Mitchell. 1995. Calibration of the Minolta SPAD-502 leaf
chlorophyll meter. Photosynth. Res. 46:467-472. doi: 10.1007/BF00032301

146
Marpaung, A.M., M. Lee, and I.S. Kartawiria. 2020. The Development of Butterfly pea (Clitoria
ternatea) Flower Powder Drink by Co-crystallization. IJoST 3:34-37. doi:
10.22437/ifstj.v3i2.10185.
Marpaung, A.M. and B.P.R. Pramesthi. 2020. Effect of pH and added sugar on stability of color,
anthocyanin content and phenolic content of Clitoria ternatea, Ipomoea tricolor and
Brassica oleracea extracts. Agric. Nat. Resour. 54:273–278. doi:
10.34044/j.anres.2020.54.3.06.
McCann, D., A. Barrett, A. Cooper, D. Crumpler, L. Dalen, K. Grimshaw, E. Kitchin, K. Lok, L.
Porteous, E. Prince, E. Sonuga-Barke, J.O. Warner, and J. Stevenson. 2007. Food
additives and hyperactive behaviour in 3-year-old and 8/9-year-old children in the
community: a randomised, double-blinded, placebo-controlled trial. Lancet 370:1560-
1567. doi: 10.1016/S0140-6736(07)61306-3.
McDonald, C. 2002. Germination response to temperature in tropical and subtropical pasture
legumes. 1. Constant temperature. Aust. J. Exp. Agric. doi: 10.1071/EA00188.
McHugh, H. 2018. Imbibe Releases 2019 Beverage Trend Predictions. Imbibe - The Drink Tank,
https://imbibeinc.com/imbibe-in-the-news/imbibe-releases-2019-beverage-trend-
predictions.
McKiernan, A.B., B.M. Potts, T.J. Brodribb, M.J. Hovenden, N.W. Davies, S.A.M. McAdam,
J.J. Ross, T. Rodemann, and J.M. O'Reilly-Wapstra. 2016. Responses to mild water
deficit and rewatering differ among secondary metabolites but are similar among
provenances within Eucalyptus species. Tree Physiol. 36:133-147. doi:
10.1093/treephys/tpv106.
Mehmood, A., M. Ishaq, L. Zhao, S. Yaqoob, B. Safdar, M. Nadeem, M. Munir, and C. Wang.
2019. Impact of ultrasound and conventional extraction techniques on bioactive
compounds and biological activities of blue butterfly pea flower (Clitoria ternatea L.).
Ultrason. Sonochem. 51:12-19. doi: 10.1016/j.ultsonch.2018.10.013.
Mishra, D., K. Chaudhuri, V.P. Singh, and J. Shukla. 2006. Seed germination studies in
medicinal plants of commercial value. Multipurpose Trees in the Tropics: Management &
Improvement Strategies. Scientific Publishers 382. ISBN: 8172334249
Morris, J.B. 2009. Characterization of butterfly pea (Clitoria ternatea L.) accessions for
morphology, phenology, reproduction and potential nutraceutical, pharmaceutical trait
utilization. Genet. Resour. Crop Evol. 56:421-427. doi: 10.1007/s10722-008-9376-0.
Morsy, A. and A. Awadalla. 2017. Growth, Forage Yield and Quality of Clitoria (Clitoria
ternatea) as Affected by Dates and Methods of Sowing and Phosphorus Fertilizer under
Toshka Region Condition. Middle East J. Agric. Res. 6:506-518. ISSN: 2077-4605

147
Mukherjee, P.K., V. Kumar, N.S. Kumar, and M. Heinrich. 2008. The Ayurvedic medicine
Clitoria ternatea--from traditional use to scientific assessment. J. Ethnopharmacol.
120:291-301. doi: 10.1016/j.jep.2008.09.009.
Mullick, P. and U. Chatterji. 1967. Eco-physiological studies on seed germination: Germination
experiments with the seeds of Clitoria ternatea Linn. Trop. Ecol. 8:116–125.
Nadzirah, J., Z. Mohd Naqiuddin Mohd, N. Nur A’in Mohd, and P.e. Furzani. 2018. Influences
of Environmental Conditions to Phytoconstituents in Clitoria ternatea (Butterfly Pea
Flower) – A Review. JST 10. doi: 10.30880/jst.2018.10.02.029.
Nagar, R.P. and S. Meena. 2015. Effect of physical and chemical scarification and ageing on
hardseededness in Clitoria ternatea. Range Manag. Agrofor. 36:79-83.
Niinemets, Ü. 2016. Uncovering the hidden facets of drought stress: secondary metabolites make
the difference. Tree Physiol. 36:129-132. doi: 10.1093/treephys/tpv128.
Oguis, G.K., E.K. Gilding, M.A. Jackson, and D.J. Craik. 2019. Butterfly Pea (Clitoria ternatea),
a Cyclotide-Bearing Plant With Applications in Agriculture and Medicine. Front. Plant
Sci. 10. doi: 10.3389/fpls.2019.00645.
Olle, M., M. Ngouajio, and A. Siomos. 2012. Vegetable quality and productivity as influenced
by growing medium: A review. Zemdirbyste-Agriculture 99:399-408.
Palumbo, M.J., F.E. Putz, and S.T. Talcott. 2007. Nitrogen fertilizer and gender effects on the
secondary metabolism of yaupon, a caffeine-containing North American holly. Oecologia
151:1-9. doi: 10.1007/s00442-006-0574-1.
Palumbo, M.J., S.T. Talcott, and F.E. Putz. 2009. Ilex Vomitoria Ait. (Yaupon): A Native North
American Source of a Caffeinated and Antioxidant-Rich Tea. Econ. Bot. 63:130-137.
doi: 10.1007/s12231-009-9078-3.
Papadopoulos, A., A. Bar-Tal, A. Silber, U. Saha, and M. Raviv. 2008. Inorganic and Synthetic
Organic Components of Soilless Culture and Potting Mixes. Soilless Culture 505-543.
doi: 10.1016/B978-044452975-6.50014-9.
Park, B.S. and G.W. Knox. 2016. Flowering Vines for Florida. Electronic Data Information
Source - UF/IFAS Extension.
Pham, T.N., T.D. Lam, M.T. Nguyen, X.T. Le, D.-V.N. Vo, T.Q. Toan, and T.S. Vo. 2019.
Effect of various factors on extraction efficiency of total anthocyanins from Butterfly pea
(Clitoria ternatea L. Flowers) in Southern Vietnam. IOP Conference Series: Materials
Science and Engineering 544:02013. doi: 10.1088/1757-899x/544/1/012013.
Pham, T.N., X.T. Le, P.T.N. Nguyen, T.H. Tran, T.P. Dao, D.H. Nguyen, V.T. Danh, and H.L.T.
Anh. 2020. Effects of storage conditions on total anthocyanin content of Butterfly pea
flower (Clitoria ternatea L.). IOP Conference Series: Materials Science and Engineering
736:062005. doi: 10.1088/1757-899x/736/6/062005.

148
Poh, A. 2019. Research on the ecology and morphology of Clitoria ternatea. Singapore School
of Science and Technology. doi: 10.13140/RG.2.2.20004.63362.
Potter, D.J. 2004. Growth and morphology of medicinal cannabis. The Medicinal Uses of
Cannabis and Cannabinoids. Pharmaceutical Press 43(172):56-57. doi: 10.1016/S0768-
9179(08)70455-3.
PubChem. 2020. PubChem Compound Summary for CID 443650, Delphinidin 3-glucoside.
National Center for Biotechnology Information.
https://pubchem.ncbi.nlm.nih.gov/compound/Delphinidin-3-glucoside.
Ranal, M.A., D.G.d. Santana, W.R. Ferreira, and C. Mendes-Rodrigues. 2009. Calculating
germination measurements and organizing spreadsheets. Rev. Bras. Bot. 32:849-855. doi:
10.1590/S0100-84042009000400022.
Raviv, M., R. Wallach, A. Silber, and A. Bar-Tal. 2002. Substrates and their analysis.
Hydroponic Prod. Veg. Ornam. 25-102.
Rodriguez-Saona, L.E. and R.E. Wrolstad. 2001. Extraction, Isolation, and Purification of
Anthocyanins. Current Protocols in Food Analytical Chemistry. John Wiley & Sons, Inc.
doi: 10.1002/0471142913.faf0101s00.
Rojas-Sandoval, J. 2018. Clitoria ternatea (butterfly-pea). Invasive Species Compendium,
https://www.cabi.org/isc/datasheet/55416.
Rumble, J.N., K. Stofer, and T.K. Ruth. 2018. Statewide Plan for Agritourism. University of
Florida/IFAS Center for Public Issues Education.
Sastry, K.S., B. Mandal, J. Hammond, S.W. Scott, R.W. Briddon, S.K. Sastry, and T. Sano.
2019. Clitoria ternatea (Butterfly pea). Encyclopedia of Plant Viruses and Viroids 600-
602.
Selmar, D. and M. Kleinwächter. 2013. Stress Enhances the Synthesis of Secondary Plant
Products: The Impact of Stress-Related Over-Reduction on the Accumulation of Natural
Products. Plant Cell Physiol. 54:817-826. doi: 10.1093/pcp/pct054.
Selvamaleeswaran, P., J. Wesely, B. Vennila, and S. Balakrishnan. 2011. Dormancy breaking
and seed germination techniques for Clitoria ternatea Linn. IJABB 1:185-192.
Sevanayak, D., A. Edna, R.V. Koti, M.B. Doddamani, and D. Deb. 2020. Salinity tolerance of
forage range legumes during germination and early seedling growth. International
Grassland Congress Proceedings - 23rd International Grassland Congress.
Shamnad, J. 2020. Mineral and nutritional potential of Clitoria ternatea L. variants as forage. J.
Trop. Agric. 57:163-166.

149
Shobharani, M. and S. Sundareswaran. 2018. Effect of different dormancy breaking treatments
on seed germination and seedling growth in Shankhapushpi (Clitoria ternatea L.). J.
Pharmacogn. Phytochem. 7:1353-1355.
Simonson, R. 2016. A Mood-Ring Ingredient Makes Cocktails Change Color. The New York
Times. https://www.nytimes.com/2016/07/06/dining/blue-cocktails-blure-butterfly-pea-
flower.html.
Siti Azima, A.M., A. Noriham, and N. Manshoor. 2017. Phenolics, antioxidants and color
properties of aqueous pigmented plant extracts: Ardisia colorata var. elliptica, Clitoria
ternatea, Garcinia mangostana and Syzygium cumini. J. Funct. Foods 38:232-241. doi:
10.1016/j.jff.2017.09.018.
Small, E., D. Marcus, J. Janick, and A. Whipkey. 2002. Hemp: A New Crop with New Uses for
North America. In: J. Janick and A. Whipkey (eds.), Trends in new crops and new uses.
ASHS Press 284-326.
Statista. 2020a. Sales of hemp-based products in the United States from 2012 to 2022.
https://www.statista.com/statistics/980300/hemp-based-products-sales-us/.
Statista. 2020b. Total U.S. cannabidiol (CBD) consumer sales from 2014 to 2022.
https://www.statista.com/statistics/760498/total-us-cbd-sales/.
Stofer, K. and J.N. Rumble. 2018. Helping Agritourism Visitors Learn During Their Visits.
UF/IFAS Electronic Display Information Service (EDIS) #AEC645.
Suma, A.M., A.P. Mallikarjuna Gowda, M.N. Thimmegowda, and Y.S. Praneeth. 2019. Effect of
seed treatment and nutrient levels on growth, yield and quality of Shankapushpi (Clitoria
ternatea L.). J. Pharmacogn. Phytochem. 8:1465-1471.
Supply, BFG. 2020. Oldcastle C/20 Growing Mix. https://www.bfgsupply.com/order-
now/product/159/453981/oldcastle-c20-mix-28cu-ft-48pl.
Sushmita, B. and K. Deeksha. 2017. Drought Stress Response in Clitoria ternatea L. IJIFR
4:7932-7940. ISSN: 2347-1697.
Swiader, J.M. and A. Moore. 2002. SPAD-chlorophyll response to nitrogen fertilization and
evaluation of nitrogen status in dryland and irrigated pumpkins. J. Plant Nutr. 25:1089-
1100. doi: 10.1081/PLN-120003941.
Taha, E.Y.E. and M.A.M. Khair. 2014. Effect of Irrigation Regimes on Water Productivities of
some Rainy Season Sown Forages in the Gezira, Sudan. U. of K. J. Agric. Sci. 22:166-
178.
Vashisth, T., M. Olmstead, J. Olmstead, and T. Colquhoun. 2017. Effects of Nitrogen
Fertilization on Subtropical Peach Fruit Quality: Organic Acids, Phytochemical Content,
and Total Antioxidant Capacity. J. Am. Soc. Hortic. Sci. 142:393-404. doi:
10.21273/JASHS04011-16

150
Watt, M.S. and M. Bloomberg. 2012. Key features of the seed germination response to high
temperatures. New Phytol. 196:332-336. doi: 10.1111/j.1469-8137.2012.04280.x.
Wiboonsirikul, J. 2019. Degradation kinetics of color in butterfly pea (Clitoria ternatea L.)
extract dried with sugar. RJST 14:1-11.
Williams, V. 2005. Pruning Ornamental Plants. University of Maryland Extension.
Zandalinas, S.I., R. Mittler, D. Balfagón, V. Arbona, and A. Gómez‐Cadenas. 2017. Plant
adaptations to the combination of drought and high temperatures. Physiol. Plant. 162:2-
12. doi: 10.1111/ppl.12540.

151
BIOGRAPHICAL SKETCH
Sean M. Campbell acquired his Bachelor of Science (B.Sc.) and Master of Science
(M.Sc.) degrees in food science with a specialization in sensory analysis under Dr. Charles Sims
before completing his Doctor of Philosophy (Ph.D.) degree in environmental horticulture under
Dr. Brian Pearson and Dr. Chris Marble, all within the University of Florida. His current
research interests include medicinal and beverage related crops, specifically butterfly pea
(Clitoria ternatea), hops (Humulus lupulus), industrial hemp (Cannabis sativa), and kratom
(Mitragyna speciosa).


