© 2019 JETIR July 2019, Volume 6, Issue 7 ... fileIn the first phase, the Indian banking...
18
© 2019 JETIR July 2019, Volume 6, Issue 7 www.jetir.org (ISSN-2349-5162) JETIR1906187 Journal of Emerging Technologies and Innovative Research (JETIR) www.jetir.org 284 “An Empirical study on Financial Performance of Commercial Banks with reference to NPA in Bangalore Region” V.GIRIDHAR, DR.SENTHILKUMAR ASST PROFESSOR, PROFESSOR BET COLLEGE OF MANAGEMENT,BANASWADI BANGALORE, PRESIDENCY UNIVERSITY Abstract: The origin of modern commercial bank in India can be traced to the 18 th century. It all began with the establishment of Bank of Hindustan in 1770 in Calcutta under European management. It was liquidated in 1830-32. The Indian banking industry is comprised of commercial banks, regional rural banks, co-operative banks, small finance banks and payment banks. India’s commercial banks were nationalized in two phases – 14 in 1969 and six in 1980. Upon completion of nationalization, close to 90 percent of the banking sector in terms of credit had been cornered by government owned banks. This study mainly determines the advances and total assets of commercial banks. Also it analyse and examines the movement of non-performing assets of public and private sector scheduled commercial banks. It is found that gross NPAs and net NPAs have grown almost at the same pace till 2008. Thereafter the growth of net NPAs has outpaced the growth of gross NPAs and the public sector commercial banks, have the difference between the two CAGRs which was much higher in their growth perspective. Keywords: Commercial Bank, Nationalization, Non-Performing Assets 1.0 Introduction: 1.1. Theoretical background of the Study: The origin of modern commercial banking in India can be traced to the 18 th century. It all began with the establishment of Bank of Hindustan in 1770 in Calcutta under European management. It was liquidated in 1830-32. The growth of the Indian banking industry since the establishment of Bank of Hindustan in 1770 can be reviewed over three phases: In the first phase, the Indian banking industry’s growth until the first exercise of nationalization of banks in 1969 is examined. In the second phase, the banking industry’ growth from the nationalization phase until the liberalization of the Indian economy and the initiation of banking reforms in 1991 is examined. In the third phase, the post-1991 phase of banking growth is examined. In 1839, an attempt was made by some Indian merchants to establish a bank called Union Bank. It collapsed within a decade. Then came Allahabad Bank in 1865 and it is operating till date. It is one of the nationalized banks of the country. It is the oldest public sector bank in the country with branches all over the country. It has been in business for the last 145 years. It is also one of India’s oldest joint stock banks. However, the
Transcript of © 2019 JETIR July 2019, Volume 6, Issue 7 ... fileIn the first phase, the Indian banking...
© 2019 JETIR July 2019, Volume 6, Issue 7 www.jetir.org (ISSN-2349-5162)
JETIR1906187 Journal of Emerging Technologies and Innovative Research (JETIR) www.jetir.org 284
“An Empirical study on Financial Performance of
Commercial Banks with reference to NPA in
Bangalore Region” V.GIRIDHAR, DR.SENTHILKUMAR
ASST PROFESSOR, PROFESSOR
BET COLLEGE OF MANAGEMENT,BANASWADI BANGALORE, PRESIDENCY UNIVERSITY
Abstract:
The origin of modern commercial bank in India can be traced to the 18th century. It all began with the
establishment of Bank of Hindustan in 1770 in Calcutta under European management. It was liquidated in
1830-32. The Indian banking industry is comprised of commercial banks, regional rural banks, co-operative
banks, small finance banks and payment banks. India’s commercial banks were nationalized in two phases –
14 in 1969 and six in 1980. Upon completion of nationalization, close to 90 percent of the banking sector in
terms of credit had been cornered by government owned banks. This study mainly determines the advances
and total assets of commercial banks. Also it analyse and examines the movement of non-performing assets
of public and private sector scheduled commercial banks. It is found that gross NPAs and net NPAs have
grown almost at the same pace till 2008. Thereafter the growth of net NPAs has outpaced the growth of gross
NPAs and the public sector commercial banks, have the difference between the two CAGRs which was much
higher in their growth perspective.
Keywords: Commercial Bank, Nationalization, Non-Performing Assets
1.0 Introduction:
1.1. Theoretical background of the Study:
The origin of modern commercial banking in India can be traced to the 18th century. It all began with the
establishment of Bank of Hindustan in 1770 in Calcutta under European management. It was liquidated in
1830-32. The growth of the Indian banking industry since the establishment of Bank of Hindustan in 1770
can be reviewed over three phases:
In the first phase, the Indian banking industry’s growth until the first exercise of nationalization of banks in
1969 is examined. In the second phase, the banking industry’ growth from the nationalization phase until the
liberalization of the Indian economy and the initiation of banking reforms in 1991 is examined. In the third
phase, the post-1991 phase of banking growth is examined.
In 1839, an attempt was made by some Indian merchants to establish a bank called Union Bank. It collapsed
within a decade. Then came Allahabad Bank in 1865 and it is operating till date. It is one of the nationalized
banks of the country. It is the oldest public sector bank in the country with branches all over the country. It
has been in business for the last 145 years. It is also one of India’s oldest joint stock banks. However, the
© 2019 JETIR July 2019, Volume 6, Issue 7 www.jetir.org (ISSN-2349-5162)
JETIR1906187 Journal of Emerging Technologies and Innovative Research (JETIR) www.jetir.org 285
credit for being the oldest joint stock bank of India should have gone to Bank of Upper India which
was established in 1863. But the bank collapsed in 1913.
1.2 The Indian banking scenario
The Indian banking industry is comprised of commercial banks, regional rural banks, co-operative banks,
small finance banks and payment banks.
1.3 Commercial banks
Commercial banks could be scheduled banks or non-scheduled banks. All the commercial banks are regulated
by the Banking Regulation Act, 1949. Commercial banks are “for profit” entities.
Scheduled commercial banks (SCBs) figure in the second schedule of the Reserve Bank of India Act, 1934.
To qualify as a scheduled bank, the paid up capital and collected funds of the bank must not be less than INR
five lakhs. Scheduled banks are eligible for loans from the Reserve Bank of India at bank rate and admitted to
the membership of clearing houses. It may be noted that co-operative banks too figure in the said schedule.
Scheduled co-operative banks embrace Scheduled State Co-operative Banks and Scheduled Urban
Cooperative Banks.
However, from the perspective of the RBI, the scheduled commercial banks in India are categorised into six
different groups according to their ownership and / or nature of operation.
In the bank group-wise classification, IDBI Bank Ltd. is also viewed as a nationalised bank.
Non-scheduled commercial banks do not figure in the second schedule of the RBI Act, 1934. Banks with a
reserve capital below INR five lakhs qualify as non-scheduled banks. They cannot borrow from the RBI for
normal banking purposes, except, in an emergency or in “abnormal circumstances.” Jammu & Kashmir Bank
is an example of a non-scheduled commercial bank.
1.4 Co-operative banks
Co-operative banks operate in urban and non-urban areas. All banks registered under the Cooperative Societies
Act, 1912 are called co-operative banks. These are banks run by an elected managing committee. They confer
certain rights on their members. They are subject to a slew of “communally developed and approved bylaws
and amendments.”
In the urban centres, they mainly finance entrepreneurs, small businesses, industries, self-employment
ventures and cater to home buying and educational needs. Likewise, co-operative banks in the rural areas
primarily cater to agricultural-based activities, which include farming activities, dairy activities and hatchery
ventures. They also extend loans to small scale units, cottage industries, and self-employment activities like
artisanship.
© 2019 JETIR July 2019, Volume 6, Issue 7 www.jetir.org (ISSN-2349-5162)
JETIR1906187 Journal of Emerging Technologies and Innovative Research (JETIR) www.jetir.org 286
Unlike commercial banks, which are profit-driven, co-operative banks operate on a “no profit, no loss” basis.
These are regulated by the Reserve Bank of India under the Banking Regulation Act, 1949 and Banking Laws
(Application to Co-operative Societies) Act, 1965.
1.5 Regional rural banks
Regional Rural Banks or RRBs, simply put serve the rural areas and agricultural sectors with basic banking
and adequate financial services. They were set up in 1975, based on the recommendations of a committee.
Based in Moradabad, Prathama Bank, established on 2 October 1975, is the first RRB to open in India. It was
sponsored by Syndicate Bank. The RRBs are owned by the central government (50 percent), the state
government (15 percent) and the sponsor bank (35 percent). Several commercial banks have sponsored RRBs.
Prominent examples include the Maharashtra Gramin Bank (sponsored by the Bank of Maharashtra) and the
Himachal Gramin Bank (sponsored by Punjab National Bank). RRBs were set up to eliminate informal
financiers like money lenders and to supplement the efforts of co-operative banks.
2.0 Nationalisation of commercial banks
India’s commercial banks were nationalized in two phases – 14 in 1969 and six in 1980. Upon completion of
nationalization, close to 90 percent of the banking sector in terms of credit had been cornered by government
owned banks. A few foreign banks and some small private banks accounted for the rest of the credit. During
the period 1980–92, the PSU banks had been completely government owned. The first bank to go public was
the State Bank of India – it went public in 1992-93.
Post liberalization in 1991, the government appointed various committees to review the functioning of the
Indian banking sector and recommend policy changes to make the banks healthier, competitive and efficient.
Two expert committees were set up under the chairmanship of Mr. M. Narasimham in 1991 and 1998. The
recommendations made by these committees (popularly known as Narasimham Committee I and II) furnished
a roadmap for banking sector reforms. The committees recommended several micro prudential measures. They
included adoption of risk based capital standards, and uniform accounting practices for income recognition
and provisioning against bad and doubtful debts. The objective was to benchmark against international best
practices as contemplated in the Basle I norms defined by the Basle Committee on Banking Supervision
(BCBS). Following the recommendations of the Narasimham committee I, Indian banks were subjected to a
capital to risk-weighted assets mechanism. Accordingly, the banks had to achieve a CRAR or capital to risk-
weighted assets ratio of eight percent by 1996. The CRAR measures the ratio of a bank’s paid-up capital to its
advances and other assets. The Narasimham Committee II also made several recommendations on asset
classification. It raised banks’ CRAR to 10 percent by 2002 and recommended constitution of Asset
Reconstruction Companies (ARCs) that would take over the stressed assets of banks. The RBI has since
progressively introduced prudential norms for income recognition, asset classification, and provisioning for
the advances portfolio of banks. The Narasimham Committee I also recommended issuance of new licenses
© 2019 JETIR July 2019, Volume 6, Issue 7 www.jetir.org (ISSN-2349-5162)
JETIR1906187 Journal of Emerging Technologies and Innovative Research (JETIR) www.jetir.org 287
to private sector entities to set up banks. Consequently, RBI issued licenses for setting up new owned banks
in the private sector. While most of these new private sector banks started functioning in the mid-1990s, their
share of the banking business remained modest until 2000. Other banking sector reforms based on the
committee’s recommendations included interest rate deregulation, allowing PSU banks to raise capital up to
49 percent of their equity from the capital market and gradual reduction of the Statutory Liquidity Ratio (SLR)
and Cash Reserve Ratio (CRR). The move was meant to improve the banks’ profitability. The banking sector
has grown remarkably since then. During the period 1969 to 2015, the number of commercial banks went up
from 89 to 152. Dependence on bank finance has also increased over the years. The following Table reveals
where the operational status of the Indian banking sector as of FY 2016-17.

© 2019 JETIR July 2019, Volume 6, Issue 7 www.jetir.org (ISSN-2349-5162)
JETIR1906187 Journal of Emerging Technologies and Innovative Research (JETIR) www.jetir.org 288
Table-1.1
Operational status of Indian banking sector as of FY 2016-17 (in INR billion)
Year Items Amount
Outstanding Percentage
Variation
2016-17 1 Balance Sheet Operations
1.1 Total Liabilities/assets 141586 7.8
1.2 Deposits 111139 10.1
1.3 Borrowings 12807 -11.6
1.4 Loans and advances 81162 2.8
1.5 Investments 36522 9.7
1.6 Off-balance sheet exposure (as percentage of on-balance sheet liabilities) 107 -
1.7 Total consolidated international claims 7168 48.8
2 Profitability
2.1 Net profit 439 28.6
2.2 Return on Asset (RoA) (Per cent) 0.4 -
2.3 Return on Equity (RoE) (Per cent) 4.2 -
2.4 Net Interest Margin (NIM) (Per cent) 2.5 -
3 Capital Adequacy
3.1 Capital to risk weighted assets ratio (CRAR) @ 13.6 -
3.2 Tier I capital (as percentage of total capital) @ 82.1 -
3.3 CRAR (tier I) (Per cent) @ 11.2 -
4 Asset Quality
4.1 Gross NPAs 7918 29.4
4.2 Net NPAs 4331 23.8
4.3 Gross NPA ratio (Gross NPAs as percentage of gross advances) 9.3 -
4.4 Net NPA ratio (Net NPAs as percentage of net advances) 5.3 -
4.5 Provision Coverage Ratio (Per cent)** 43.5 -
4.6 Slippage ratio (Per cent) 5.7 -
© 2019 JETIR July 2019, Volume 6, Issue 7 www.jetir.org (ISSN-2349-5162)
JETIR1906187 Journal of Emerging Technologies and Innovative Research (JETIR) www.jetir.org 289
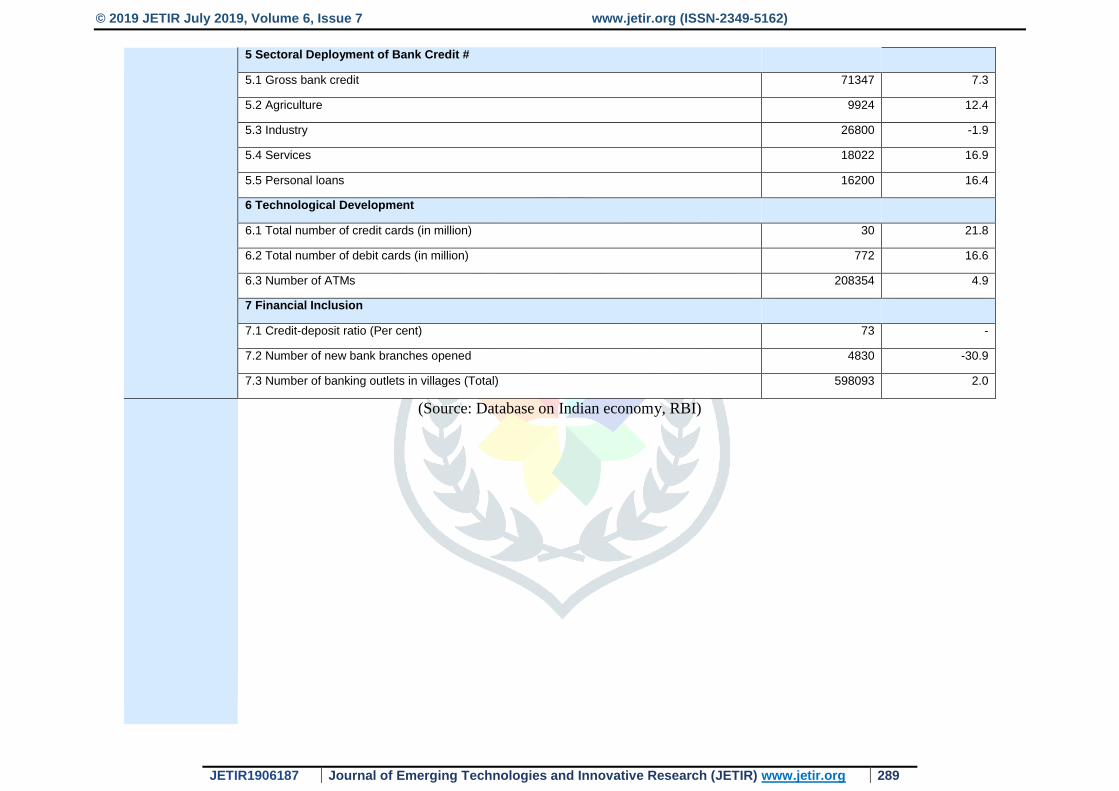
5 Sectoral Deployment of Bank Credit #
5.1 Gross bank credit 71347 7.3
5.2 Agriculture 9924 12.4
5.3 Industry 26800 -1.9
5.4 Services 18022 16.9
5.5 Personal loans 16200 16.4
6 Technological Development
6.1 Total number of credit cards (in million) 30 21.8
6.2 Total number of debit cards (in million) 772 16.6
6.3 Number of ATMs 208354 4.9
7 Financial Inclusion
7.1 Credit-deposit ratio (Per cent) 73 -
7.2 Number of new bank branches opened 4830 -30.9
7.3 Number of banking outlets in villages (Total) 598093 2.0
(Source: Database on Indian economy, RBI)
© 2019 JETIR July 2019, Volume 6, Issue 7 www.jetir.org (ISSN-2349-5162)
JETIR1906187 Journal of Emerging Technologies and Innovative Research (JETIR) www.jetir.org 290
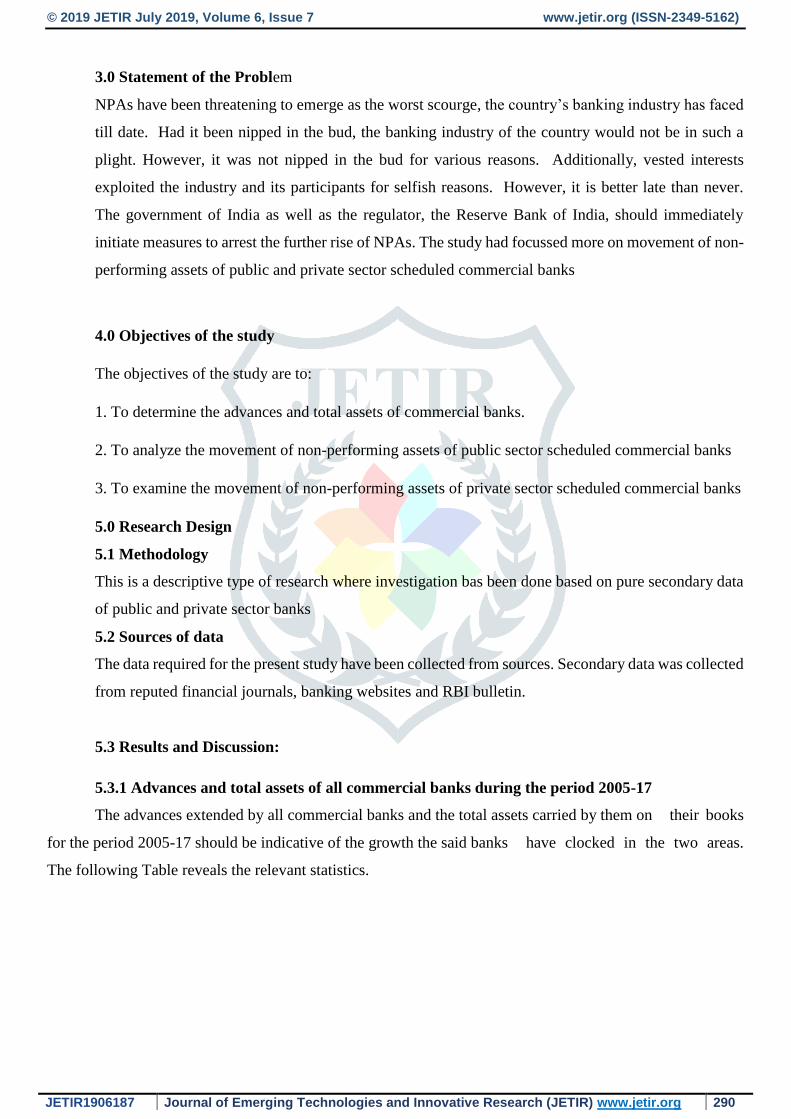
3.0 Statement of the Problem
NPAs have been threatening to emerge as the worst scourge, the country’s banking industry has faced
till date. Had it been nipped in the bud, the banking industry of the country would not be in such a
plight. However, it was not nipped in the bud for various reasons. Additionally, vested interests
exploited the industry and its participants for selfish reasons. However, it is better late than never.
The government of India as well as the regulator, the Reserve Bank of India, should immediately
initiate measures to arrest the further rise of NPAs. The study had focussed more on movement of non-
performing assets of public and private sector scheduled commercial banks
4.0 Objectives of the study
The objectives of the study are to:
1. To determine the advances and total assets of commercial banks.
2. To analyze the movement of non-performing assets of public sector scheduled commercial banks
3. To examine the movement of non-performing assets of private sector scheduled commercial banks
5.0 Research Design
5.1 Methodology
This is a descriptive type of research where investigation bas been done based on pure secondary data
of public and private sector banks
5.2 Sources of data
The data required for the present study have been collected from sources. Secondary data was collected
from reputed financial journals, banking websites and RBI bulletin.
5.3 Results and Discussion:
5.3.1 Advances and total assets of all commercial banks during the period 2005-17
The advances extended by all commercial banks and the total assets carried by them on their books
for the period 2005-17 should be indicative of the growth the said banks have clocked in the two areas.
The following Table reveals the relevant statistics.
© 2019 JETIR July 2019, Volume 6, Issue 7 www.jetir.org (ISSN-2349-5162)
JETIR1906187 Journal of Emerging Technologies and Innovative Research (JETIR) www.jetir.org 291
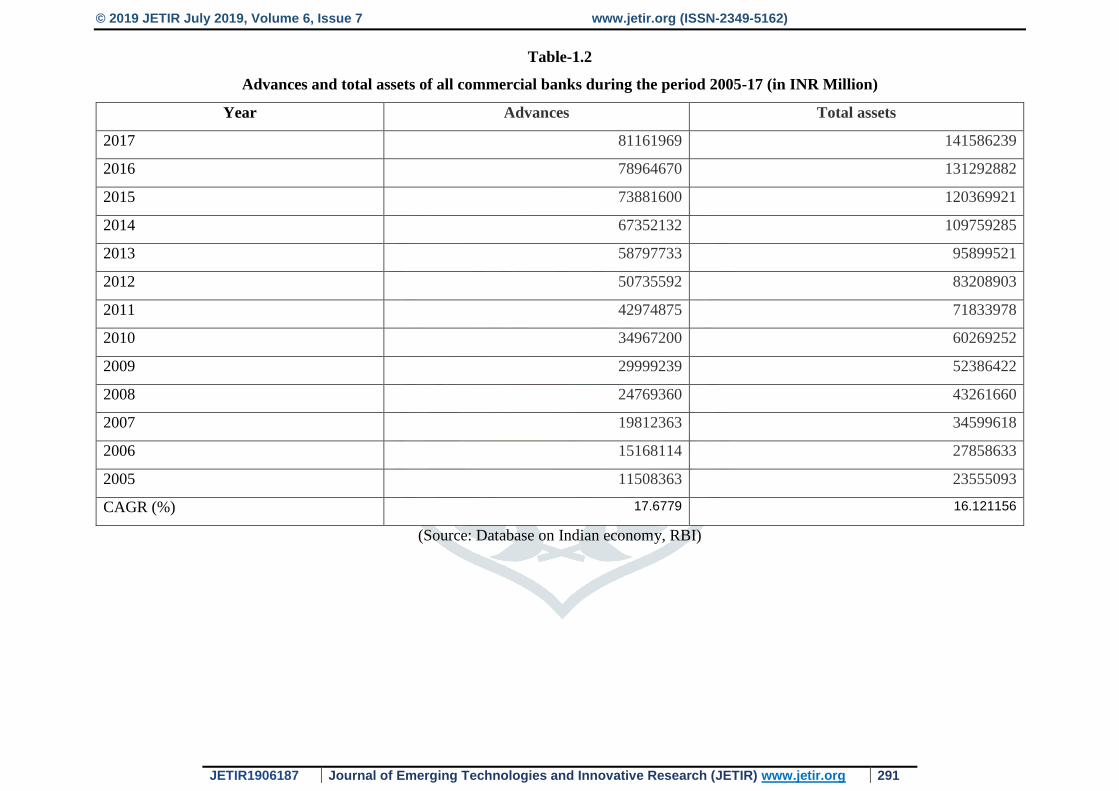
Table-1.2
Advances and total assets of all commercial banks during the period 2005-17 (in INR Million)
Year Advances Total assets
2017 81161969 141586239
2016 78964670 131292882
2015 73881600 120369921
2014 67352132 109759285
2013 58797733 95899521
2012 50735592 83208903
2011 42974875 71833978
2010 34967200 60269252
2009 29999239 52386422
2008 24769360 43261660
2007 19812363 34599618
2006 15168114 27858633
2005 11508363 23555093
CAGR (%) 17.6779 16.121156
(Source: Database on Indian economy, RBI)
© 2019 JETIR July 2019, Volume 6, Issue 7 www.jetir.org (ISSN-2349-5162)
JETIR1906187 Journal of Emerging Technologies and Innovative Research (JETIR) www.jetir.org 292
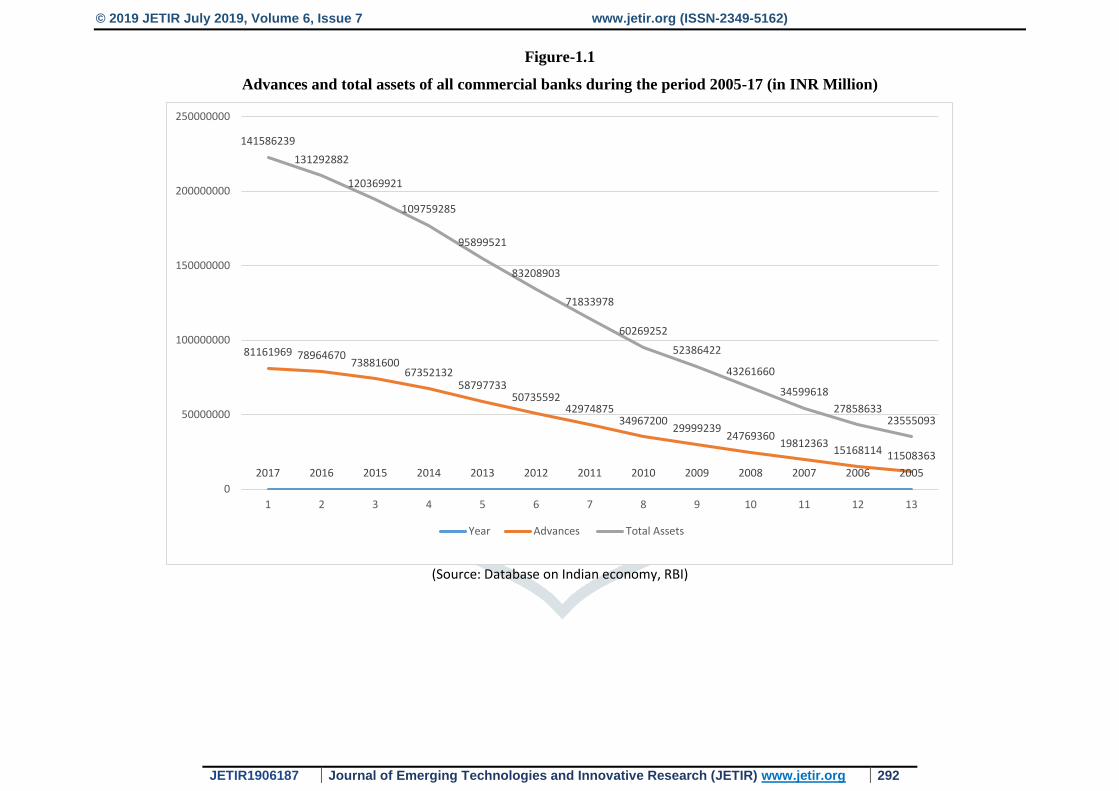
Figure-1.1
Advances and total assets of all commercial banks during the period 2005-17 (in INR Million)
(Source: Database on Indian economy, RBI)
2017 2016 2015 2014 2013 2012 2011 2010 2009 2008 2007 2006 2005
81161969 7896467073881600
6735213258797733
5073559242974875
3496720029999239
2476936019812363
15168114 11508363
141586239
131292882
120369921
109759285
95899521
83208903
71833978
60269252
52386422
43261660
34599618
2785863323555093
0
50000000
100000000
150000000
200000000
250000000
1 2 3 4 5 6 7 8 9 10 11 12 13
Year Advances Total Assets

© 2019 JETIR June 2019, Volume 6, Issue 6 www.jetir.org (ISSN-2349-5162)
JETIR1906187 Journal of Emerging Technologies and Innovative Research (JETIR) www.jetir.org 293
It is clear from the Table and the Figure that the advances have grown at a slightly higher CAGR of 17.68
percent approximately compared to the CAGR of 16.12 percent registered by total assets. The two have almost
moved in tandem and aggressively too in spite of the global financial meltdown they had to contend with
during the early part of the period under review. Thus, the performance on the two fronts is noteworthy.
5.3.2 Non-performing assets (NPAs)
Banks’ job does not end with lending. They have to recover the money they lent along with the interest due
on the money lent. They should recycle the recovered money by relending it at a lucrative interest rate. The
interest recovered by the banks on the loans they lent goes to service the depositors since it is the depositors’
money the bank has lent in the first place. Interest on the depositor’s money is paid from the interest the bank
recovers from their borrowers on the money they lent. The principal banks recover from the borrowers goes
to return the deposit they raised from the depositors. Obviously, when the banks fail to recover the loans and
the interest thereon, they have to repay the principal and / or return the deposit to the depositors from their
own kitty. Hence, while the banks may be happy with their ability to identify the borrowers and lend to them,
they must also ensure that they are in a position to recover the money they lent along with the interest due
thereon. Hence, the responsibility of the banks do not end with mere lending. In fact, it is at the lending stage
that the banks are saddled with the responsibility of recovering the loan along with the interest due thereon.
When the loans are not recovered promptly, troubles mount for the bank. They have to make additional efforts
to recover the loan and the interest due thereon. In some cases, the banks may not be able to recover the loans
at all with the result that they have to write off such loans. Inevitably, the bottom lines of the banks take a hit
in such cases. Hence, as explained in paragraph 1.1.2 above, banks are required to put in place certain systems
and procedures to ensure that their bottom lines are minimally hit.
Substandard assets
Assets which have remained non-performing for a period of up to and inclusive of 12 months are substandard
assets.
Doubtful assets
Assets turn doubtful when they remain in the substandard category for a period of 12 months.
Loss assets
Loss assets are uncollectible and are of little value – so little that their continuance as a bankable asset in the
books of the bank concerned is not warranted, even if they carry some salvage or recovery value.
5.4 Movement of non-performing assets (NPAs) of public sector scheduled commercial banks
As explained in a previous paragraph, the country’s banking industry has been witness to two major NPA
episodes in the post liberalization era. Hence it is relevant to examine the movement of non-performing assets
© 2019 JETIR June 2019, Volume 6, Issue 6 www.jetir.org (ISSN-2349-5162)
JETIR1906187 Journal of Emerging Technologies and Innovative Research (JETIR) www.jetir.org 294
(NPAs) of scheduled commercial banks around the period the second crisis erupted and eventually settled
down. In the following Tables and Figures, the movement of non-performing assets (NPAs) of scheduled
commercial banks is captured, category-wise. The categories defined for the purpose are scheduled
commercial banks from the public sector, scheduled commercial banks from the private sector and the SBI
group, with its associates. It may be noted here that on April 1, 2017 all the associate banks of SBI were
merged with the SBI.
© 2019 JETIR June 2019, Volume 6, Issue 6 www.jetir.org (ISSN-2349-5162)
JETIR1906187 Journal of Emerging Technologies and Innovative Research (JETIR) www.jetir.org 295
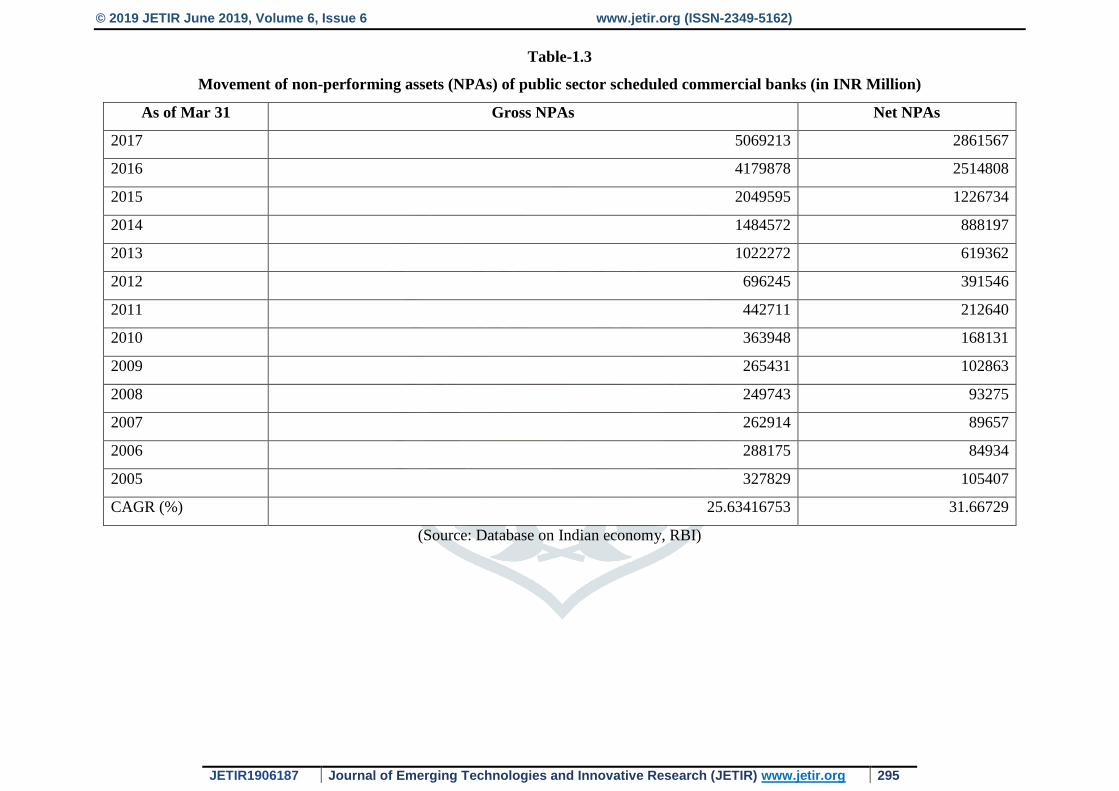
Table-1.3
Movement of non-performing assets (NPAs) of public sector scheduled commercial banks (in INR Million)
As of Mar 31 Gross NPAs Net NPAs
2017 5069213 2861567
2016 4179878 2514808
2015 2049595 1226734
2014 1484572 888197
2013 1022272 619362
2012 696245 391546
2011 442711 212640
2010 363948 168131
2009 265431 102863
2008 249743 93275
2007 262914 89657
2006 288175 84934
2005 327829 105407
CAGR (%) 25.63416753 31.66729
(Source: Database on Indian economy, RBI)
© 2019 JETIR June 2019, Volume 6, Issue 6 www.jetir.org (ISSN-2349-5162)
JETIR1906187 Journal of Emerging Technologies and Innovative Research (JETIR) www.jetir.org 296
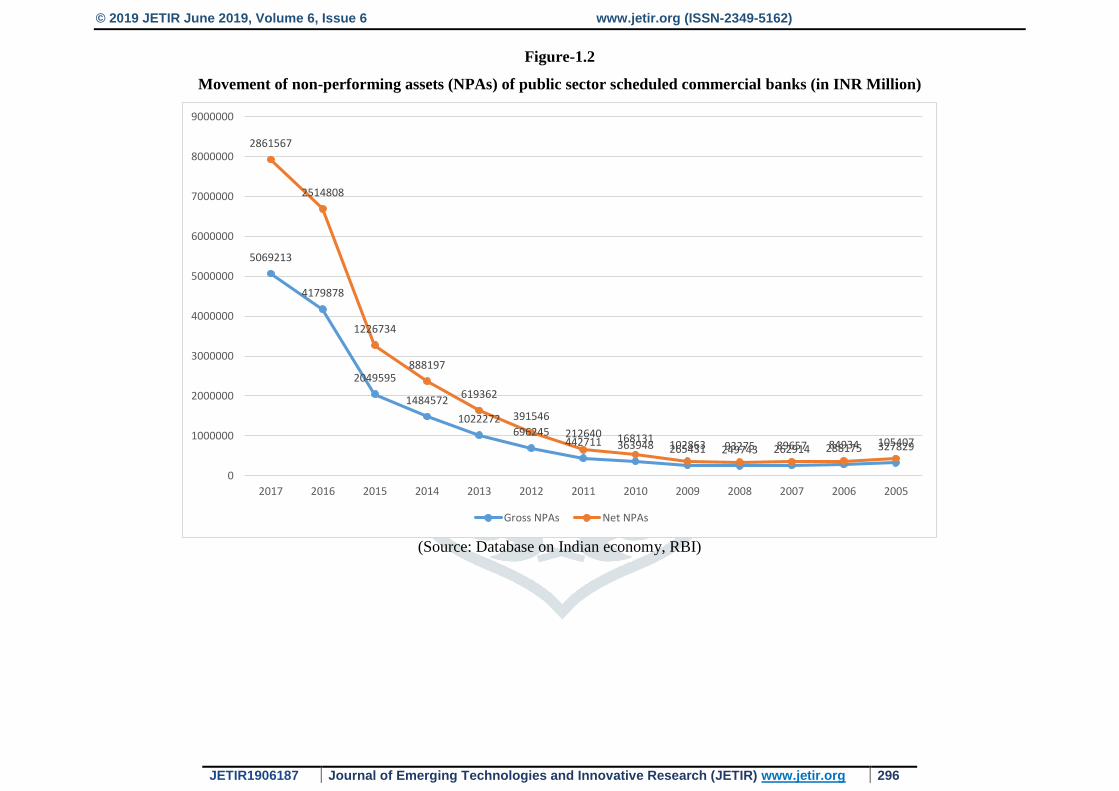
Figure-1.2
Movement of non-performing assets (NPAs) of public sector scheduled commercial banks (in INR Million)
(Source: Database on Indian economy, RBI)
5069213
4179878
2049595
1484572
1022272696245
442711 363948 265431 249743 262914 288175 327829
2861567
2514808
1226734
888197
619362
391546
212640 168131102863 93275 89657 84934 105407
0
1000000
2000000
3000000
4000000
5000000
6000000
7000000
8000000
9000000
2017 2016 2015 2014 2013 2012 2011 2010 2009 2008 2007 2006 2005
Gross NPAs Net NPAs
© 2019 JETIR June 2019, Volume 6, Issue 6 www.jetir.org (ISSN-2349-5162)
JETIR1906187 Journal of Emerging Technologies and Innovative Research (JETIR) www.jetir.org 297
Until 2008 at least, gross NPAs and net NPAs have grown almost at the same pace. Thereafter the growth of
net NPAs has outpaced the growth of gross NPAs. Post 2011, the gap between the two ‘worms’ has widened
suggesting that net NPAs have grown even faster in the post 2011 phase.
5.5 Movement of non-performing assets (NPAs) of private sector scheduled commercial banks
In the following Tables and Figures, the movement of non-performing assets (NPAs) of private sector
scheduled commercial banks is captured.

© 2019 JETIR June 2019, Volume 6, Issue 6 www.jetir.org (ISSN-2349-5162)
JETIR1906187 Journal of Emerging Technologies and Innovative Research (JETIR) www.jetir.org 298
Table-1.4
Movement of non-performing assets (NPAs) of private sector scheduled commercial banks (in INR Million)
As of Mar 31 Gross NPAs Net NPAs
2017 932092 477802
2016 561857 266774
2015 341062 141283
2014 245424 88615
2013 210705 59944
2012 187678 44012
2011 182406 44322
2010 176400 65060
2009 169266 74120
2008 129974 56469
2007 92553 40282
2006 78108 31703
2005 87822 42116
CAGR (%) 21.75536416 22.43356
(Source: Database on Indian economy, RBI)
© 2019 JETIR June 2019, Volume 6, Issue 6 www.jetir.org (ISSN-2349-5162)
JETIR1906187 Journal of Emerging Technologies and Innovative Research (JETIR) www.jetir.org 299
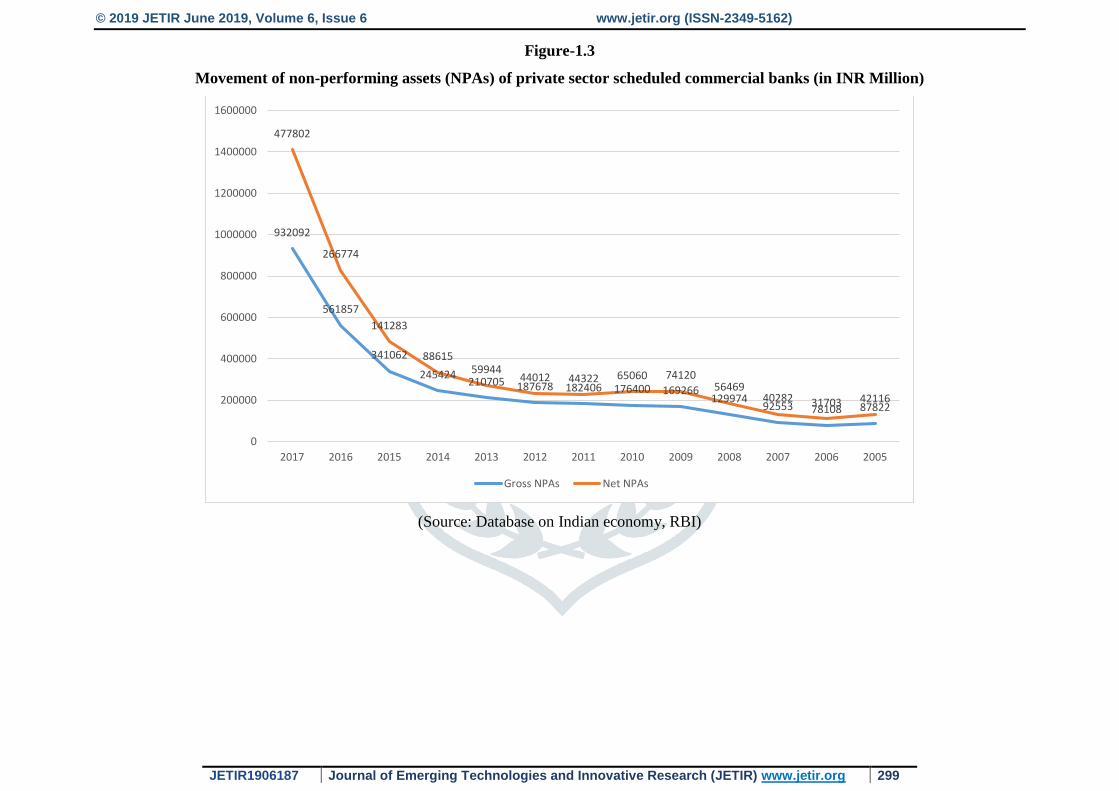
Figure-1.3
Movement of non-performing assets (NPAs) of private sector scheduled commercial banks (in INR Million)
(Source: Database on Indian economy, RBI)
932092
561857
341062
245424210705 187678 182406 176400 169266
12997492553 78108 87822
477802
266774
141283
8861559944
44012 44322 65060 7412056469
40282 31703 42116
0
200000
400000
600000
800000
1000000
1200000
1400000
1600000
2017 2016 2015 2014 2013 2012 2011 2010 2009 2008 2007 2006 2005
Gross NPAs Net NPAs
© 2019 JETIR June 2019, Volume 6, Issue 6 www.jetir.org (ISSN-2349-5162)
JETIR1906187 Journal of Emerging Technologies and Innovative Research (JETIR) www.jetir.org 300
It is clear from the Table and Figure that gross NPAs and net NPAs have grown at the same rate more or less.
The CAGRs are 21.75536416 percent and 22.43356 percent respectively. In the case of public sector
commercial banks, it may be recalled, the difference between the two CAGRs was much higher, at six percent!
Here the difference is hardly one percent!
6.0 Conclusion:
India must prepare to tackle the issue of NPAs by monitoring asset quality review (AQR) with down-to-earth
appraisal and effective implementation of possible new solutions (Sanjay, 2017). The researcher welcomes
the RBI’s ‘bold move’ to clean up the banks’ balance-sheets by resorting to AQR. However, with the country’s
stressed assets accounting for 12.3 percent of the total outstanding loans which is the highest among major
emerging markets, decisive solutions to resurrect the banking sector are needed, asserts the researcher. The
surge in NPAs has taken a heavy toll on credit growth, which has already hit rock bottom. With NPAs rising
steeply, banks (particularly the public sector banks) have a tough time retaining their capital base. They have
pruned their lending operations for the purpose. The rise of NPAs and a continuous fall in non-food bank
credit over the past few years portends trouble. Several researches established a strong correlation between
growth and bank credit for the effective measures of NPAs among private and public sector commercial banks.
References:
1. Acharya, V., & Kulkarni, N. (2011). What Saved the Indian Banking System: State Ownership or
State Guarantees? World Economy, 19-31.
2. Adhikari, A. (2014, March 30). Story: Business Today. Retrieved June 20, 2014, from Business
Today Web site: http://businesstoday.intoday.in/story/union-bank-of-india-crisis-rising-
npas/1/204011.html
3. Adil, M., Al, G. O., & Albkour, A. M. (2013). SERVQUAL and SERVPERF: A review of measures
in services marketing research. Global Journal of Management and Business Research.
4. FE Online. (2017, May 17). Home:Financial Express.com. Retrieved from Financial Express
Website: http://www.financialexpress.com/industry/banking-finance/demonetisation-impact-bank-
npas-mount-to-rs-614872-crore-set-to-rise-further/558916/
5. Gandhi, R. (2014, June 2). Home: Bank for International Settlements. Retrieved June 20, 2014, from
Bank for International Settlements Web site: http://www.bis.org/review/r140602g.htm
6. Lele, S. C. (2013, June 12). Business Standard. Retrieved March 1, 2014, from Business Standard
Web site: http://www.business-standard.com/article/finance/india-inc-prefers-to-rejig-loans-outside-
cdr-113061100856_1.html
7. Madhavi, H. C. (2017, January 2). Home:in10stech.com. Retrieved from instech.com Web site:
http://in10stech.com/blog/customer-onboarding-how-to-make-a-great-first-impression/
© 2019 JETIR June 2019, Volume 6, Issue 6 www.jetir.org (ISSN-2349-5162)
JETIR1906187 Journal of Emerging Technologies and Innovative Research (JETIR) www.jetir.org 301
8. Pandey, R., Patnaik, I., & Shah, A. (2016). Dating business cycles in India. New Delhi: National
Institute of Public Finance and Policy.
9. Press Information Bureau. (2016, February 3). Press Release: Press Information Bureau. Retrieved
June 10, 2016, from Press Information Bureau Web site:
http://pib.nic.in/newsite/PrintRelease.aspx?relid=136034
10. Rajeswari, S., & Harsh, V. (2017). Non-performing assets in Indian Banks: This time it is different.
Mumbai: Indira Gandhi Institute of Development Research.