© 2014 North American Blueberry Council Cort Brazelton North American Blueberry Council © 2014...
51
-
Upload
franklin-baldwin -
Category
Documents
-
view
223 -
download
4
Transcript of © 2014 North American Blueberry Council Cort Brazelton North American Blueberry Council © 2014...


© 2014 North American Blueberry CouncilCort Brazelton
2014
North American Blueberry Council© 2014
World Blueberry Acreage & ProductionFall Preview
Cort Brazelton

© 2014 North American Blueberry CouncilCort Brazelton
Traditional
14
Developing

© 2014 North American Blueberry CouncilCort Brazelton
© 2014 North American Blueberry CouncilCort Brazelton
North America
15

© 2014 North American Blueberry CouncilCort Brazelton
16
2014 North American Highbush Production North America Region
≈20% every 2 years
FR PR Total FR PR Total FR PR Total
Western 120.8 92.5 213.3 159.0 142.9 301.9 178.0 216.0 394.0
Midwest 54.1 50.8 104.9 31.5 52.2 83.7 46.8 38.7 85.5
Northeast 39.0 8.2 47.2 51.3 9.1 60.4 54.9 5.1 60.0
Southern 84.1 36.8 120.9 88.1 53.1 141.2 104.0 52.0 156.0
Mexico & Cen. Am. 5.0 0.0 5.0 12.3 0.2 12.5 23.1 0.2 23.3
TOTAL 303.0 188.3 491.3 342.2 257.4 599.6 406.8 312.0 718.8
2010 Million Lbs. 2012 Million Lbs. 2014 Million Lbs.

© 2014 North American Blueberry CouncilCort Brazelton
17
2014 North American Highbush Production North America Region
0
100
200
300
400
500
600
700
800
Fresh ------
Process2010
TOTAL-------
Fresh -------
Process2012
TOTAL-------
Fresh -------
Process2014
TOTAL-------
Mexico & Cen. Am.
Southern
Northeast
Midwest
Western
Million Lbs.

© 2014 North American Blueberry CouncilCort Brazelton
18
NA Fresh Production by Region1995 - 2014
Western
Mexico & Central America
0
50
100
150
200
250
300
350
400
450
1995 1997 1999 2001 2003 2005 2007 2008 2010 2012 2014

© 2014 North American Blueberry CouncilCort Brazelton
19
NA Processed Production by Region1995 - 2014
Western
MidwesternNortheastern Southern
Mexico & Central America
0
50
100
150
200
250
300
350
1995 1997 1999 2001 2003 2005 2007 2008 2010 2012 2014

© 2014 North American Blueberry CouncilCort Brazelton
© 2014 North American Blueberry CouncilCort Brazelton
South America
20

© 2014 North American Blueberry CouncilCort Brazelton
21
2013/14 South American Highbush Production
119 m lbs. ~
FR PR Total FR PR Total FR PR Total
Chile 109.5 14.0 123.5 154.5 65.9 220.4 163.1 60.1 223.2
Argentina 24.6 2.0 26.6 31.3 14.2 45.5 27.7 6.3 34.0
Uruguay 2.7 0.3 3.0 4.2 1.8 5.9 4.0 1.5 5.5
Peru 0.0 0.0 0.0 0.1 0.0 0.1 4.5 0.1 4.6
Brazil 0.2 0.0 0.2 0.4 0.0 0.4 0.5 0.0 0.5
Colombia 0.0 0.0 0.0 0.0 0.0 0.0 0.2 0.0 0.2
TOTAL 137.1 16.3 153.4 190.5 81.8 272.4 200.0 68.0 268.0
2010 Million Lbs. 2012 Million Lbs. 2014 Million Lbs.

© 2014 North American Blueberry CouncilCort Brazelton
22
2013/14 South American Highbush Production
0
50
100
150
200
250
300
Fresh ------
Process2010
TOTAL-------
Fresh -------
Process2012
TOTAL-------
Fresh -------
Process2014
TOTAL-------
ColombiaBrazilPeruUruguayArgentinaChile
Million Lbs.

© 2014 North American Blueberry CouncilCort Brazelton
23
2013/14 South America Fresh Production
Chile82%
Argentina14%Uruguay
2%
Peru2.25%
Brazil0.25%
Colombia0.08%

© 2014 North American Blueberry CouncilCort Brazelton
© 2014 North American Blueberry CouncilCort Brazelton
Europe
24

© 2014 North American Blueberry CouncilCort Brazelton
25
FR PR Total FR PR Total FR PR Total
South & Western 23.8 0.2 24.0 27.9 0.3 28.2 53.7 0.5 54.2
Central & Northern 28.9 2.1 31.0 37.9 3.8 41.7 46.2 3.7 49.8
Eastern 15.9 10.2 26.1 24.8 3.6 28.4 32.1 5.6 37.7
TOTAL 68.6 12.5 81.1 90.6 7.7 98.2 131.9 9.8 141.7
2010 Million Lbs. 2012 Million Lbs. 2014 Million Lbs.
2014 European Highbush Production

© 2014 North American Blueberry CouncilCort Brazelton
26
2014 European Highbush Production
0
20
40
60
80
100
120
140
160
Fresh ------
Process2010
TOTAL-------
Fresh -------
Process2012
TOTAL-------
Fresh -------
Process2014
TOTAL-------
Eastern
Central & Northern
South & Western
Million Lbs.

© 2014 North American Blueberry CouncilCort Brazelton
© 2014 North American Blueberry CouncilCort Brazelton
Mediterranean & North Africa
27

© 2014 North American Blueberry CouncilCort Brazelton
28
2014 Mediterranean & North AfricaHighbush Production
FR PR Total FR PR Total FR PR Total
Morocco 1.8 0.0 1.8 4.9 0.0 4.9 13.2 0.1 13.3
Egypt 0.1 0.0 0.1 0.1 0.0 0.1 0.1 0.0 0.1
Turkey 0.1 0.0 0.1 0.4 0.1 0.5 0.6 0.2 0.8
Israel 0.1 0.0 0.1 0.1 0.0 0.1 0.1 0.0 0.1
Tunisia 0.0 0.0 0.0 0.0 0.0 0.0 0.1 0.0 0.1
Others 0.1 0.0 0.1 0.0 0.0 0.0 0.0 0.0 0.0
TOTAL 2.2 0.0 2.2 5.4 0.1 5.5 14.0 0.3 14.2
2010 Million Lbs. 2012 Million Lbs. 2014 Million Lbs.

© 2014 North American Blueberry CouncilCort Brazelton
29
2014 Mediterranean & North AfricaHighbush Production
0
2
4
6
8
10
12
14
16
Fresh ------
Process2010
TOTAL-------
Fresh -------
Process2012
TOTAL-------
Fresh -------
Process2014
TOTAL-------
Others
Tunisia
Israel
Turkey
Egypt
Morocco
Million Lbs.

© 2014 North American Blueberry CouncilCort Brazelton
© 2014 North American Blueberry CouncilCort Brazelton
Southern Africa
30
© 2014 North American Blueberry CouncilCort Brazelton
31
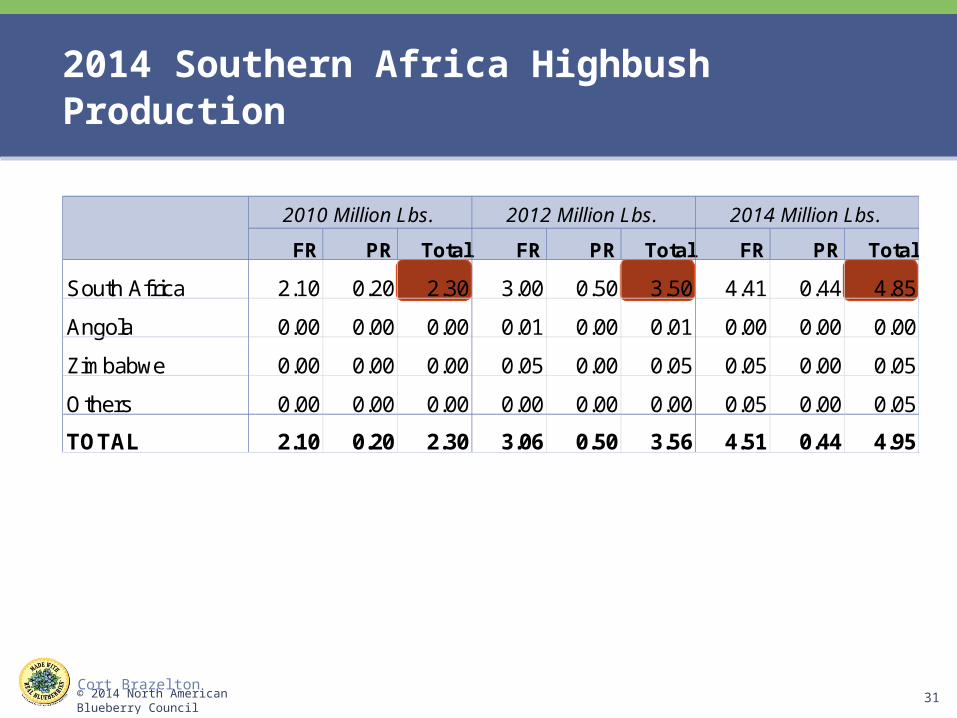
2014 Southern Africa Highbush Production
FR PR Total FR PR Total FR PR Total
South Africa 2.10 0.20 2.30 3.00 0.50 3.50 4.41 0.44 4.85
Angola 0.00 0.00 0.00 0.01 0.00 0.01 0.00 0.00 0.00
Zimbabwe 0.00 0.00 0.00 0.05 0.00 0.05 0.05 0.00 0.05
Others 0.00 0.00 0.00 0.00 0.00 0.00 0.05 0.00 0.05
TOTAL 2.10 0.20 2.30 3.06 0.50 3.56 4.51 0.44 4.95
2010 Million Lbs. 2012 Million Lbs. 2014 Million Lbs.

© 2014 North American Blueberry CouncilCort Brazelton
32
2014 Southern Africa Highbush Production
0.0
1.0
2.0
3.0
4.0
5.0
Fresh ------
Process2010
TOTAL-------
Fresh -------
Process2012
TOTAL-------
Fresh -------
Process2014
TOTAL-------
Others
Zimbabwe
Angola
South Africa
Million Lbs.

© 2014 North American Blueberry CouncilCort Brazelton
© 2014 North American Blueberry CouncilCort Brazelton
Asia & Pacific
33

© 2014 North American Blueberry CouncilCort Brazelton
34
FR PR Total FR PR Total FR PR Total
China 3.0 3.6 6.6 18.0 7.0 25.0 35.3 8.8 44.1
India 0.2 0.0 0.2 0.3 0.0 0.3 0.0 0.0 0.0
Japan 4.9 0.2 5.1 5.4 1.2 6.6 7.2 1.6 8.8
South Korea 0.5 0.0 0.5 1.7 0.2 1.9 9.6 1.1 10.7
TOTAL 8.6 3.8 12.4 25.4 8.4 33.8 52.1 11.5 63.6
2010 Million Lbs. 2012 Million Lbs. 2014 Million Lbs.
2014 Asia & Pacific Highbush ProductionAsia

© 2014 North American Blueberry CouncilCort Brazelton
35
2014 Asia & Pacific Highbush ProductionAsia
0
10
20
30
40
50
60
70
Fresh ------
Process2010
TOTAL-------
Fresh -------
Process2012
TOTAL-------
Fresh -------
Process2014
TOTAL-------
South Korea
Japan
India
China
Million Lbs.

© 2014 North American Blueberry CouncilCort Brazelton
36
2014 Asia & Pacific Highbush ProductionPacific
FR PR Total FR PR Total FR PR Total
Australia 5.7 0.9 6.6 9.5 0.7 10.1 14.2 0.8 15.0
New Zealand 2.0 1.5 3.5 3.1 1.1 4.2 4.0 1.5 5.5
Indonesia 0.0 0.0 0.0 0.0 0.0 0.0 0.0 0.0 0.0
Philippines 0.0 0.0 0.0 0.0 0.0 0.0 0.0 0.0 0.0
TOTAL 7.7 2.4 10.1 12.6 1.8 14.3 18.2 2.3 20.5
2010 Million Lbs. 2012 Million Lbs. 2014 Million Lbs.

© 2014 North American Blueberry CouncilCort Brazelton
37
2014 Asia & Pacific Highbush ProductionPacific
0
5
10
15
20
25
Fresh ------
Process2010
TOTAL-------
Fresh -------
Process2012
TOTAL-------
Fresh -------
Process2014
TOTAL-------
Philippines
Indonesia
New Zealand
Australia
Million Lbs.

© 2014 North American Blueberry CouncilCort Brazelton
38
2014 Asia & Pacific Highbush Production
FR PR Total FR PR Total FR PR Total
Asia 8.6 3.8 12.4 25.4 8.4 33.8 52.1 11.5 63.6
Pacific 7.7 2.4 10.1 12.6 1.8 14.3 18.2 2.3 20.5
TOTAL 16.3 6.2 22.5 38.0 10.2 48.1 70.3 13.8 84.1
2010 Million Lbs. 2012 Million Lbs. 2014 Million Lbs.
~2x?

© 2014 North American Blueberry CouncilCort Brazelton
39
2014 Asia & Pacific Highbush Production
0
10
20
30
40
50
60
70
80
90
Fresh ------
Process2010
TOTAL-------
Fresh -------
Process2012
TOTAL-------
Fresh -------
Process2014
TOTAL-------
Pacific
Asia
Million Lbs.

© 2014 North American Blueberry CouncilCort Brazelton
© 2014 North American Blueberry CouncilCort Brazelton
World
40

© 2014 North American Blueberry CouncilCort Brazelton
41
FR PR Total FR PR Total FR PR Total
North America 303.0 188.3 491.3 342.2 257.4 599.6 406.8 312.0 718.8
South America 137.1 16.3 153.4 190.5 81.8 272.4 200.0 68.0 268.0
Europe 68.6 12.5 81.1 90.6 7.7 98.2 131.9 9.8 141.7
Med. & N. Africa 2.2 0.0 2.2 5.4 0.1 5.5 14.0 0.3 14.2
Southern Africa 2.1 0.2 2.3 3.1 0.5 3.6 4.5 0.4 5.0
Asia & Pacific 16.3 6.2 22.5 38.0 10.2 48.1 70.3 13.8 84.1
World Acreage 529.3 223.6 752.9 669.8 357.7 1,027.4 827.4 404.3 1,231.7
2014 Million Lbs.2010 Million Lbs. 2012 Million Lbs.
2014 World Highbush Production by Region
≈275 m lbs. ≈205 m lbs.≈150 m lbs.

© 2014 North American Blueberry CouncilCort Brazelton
42
2014 World Highbush Production by Region
0
200
400
600
800
1,000
1,200
1,400
Fresh ------
Process2010
TOTAL-------
Fresh -------
Process2012
TOTAL-------
Fresh -------
Process2014
TOTAL-------
Asia & PacificSouthern AfricaMed. & N. AfricaEuropeSouth AmericaNorth America
Million Lbs.

© 2014 North American Blueberry CouncilCort Brazelton
2012 World Highbush Production Growth Prediction
43
0
300
600
900
1,200
1,500
2005 2008 2010 2012 2014 2016
Million Lbs.Asia & PacificSouthern AfricaMed. & N. AfricaEuropeSouth AmericaNorth America
Over 1.3 Bn lbs. by 2015
Over 1.45 Bn lbs. by 2017

© 2014 North American Blueberry CouncilCort Brazelton
Global Market Growth …
44
Existing Market
Growth Market
Developing Market
`

Australian Blueberry Industry Growth Success
Experience Sharing
Shanghai, November 2014
Presented by PJ McPherson

Australian Blueberry Growers Association (ABGA)
• Grower membership (incorporated) – Mid 1980’s– Intent to cover all growers & growing regions– Meets 4/5 times annually, with Annual Conference– The industry voice (political / generic)– Lobby for adequate, skilled workforce
• Promotional activities (voluntary levy)– Increase consumer awareness (health)– Market access - new markets
• R&D activities (matching government $)– Food safety / sustainability– Employ Industry Development Officers
(Technical, Quality Assurance)

• Northern Hemisphere -window of opportunity• Australian product - premium quality• Markets
• Japan – closed 2011 (awaiting re-opening)• UK / Europe - opportunistic - price main barrier• South East Asia – steady growth• Russia new market opening – good growth
– Putin factor
China / India direct market access – opportunity
Australian COP our “Achilles' heel”.
Marketing & DistributionFresh Export

• Higher fruit quality – fresh safe blueberries– Picked, packed, air shipped – ETA 36 to 48 hours– Latest fruit varieties from world renowned,
proven private programs• Taste• Shelf life• Size
– Mirror Japanese fresh strategy - proven
• Fills under-supply window– September through November
(Northern NSW)
– Possibly February through April (Tasmania)
What Australia has to Offer China Fresh Supply
10 hourflight

• Number of private breeding programs
• Mainly based on early seasonSouthern Highbush as displayed at Asia Fruit Logistica in Hong Kong
• Mostly linked back to Florida
• “Evergreening” the big attribute
• Have proven successful in other Northern hemisphere locations – Morocco / Mexico / California / Peru
• Southern China possibly best location and production on site is under establishment
What Australia has to Offer China Genetics

• Technical Expertise– Growing knowledge (+30 years)
– Production / Horticulture
– Post harvest / shelf-life extension
– Cool chain management
• Consumer Promotions Learnings– Consumer awareness
– Social media
– Consumer literature
• Joint Venture growing opportunity– Sharing the expertise and the risk
What Australia has to Offer China Technical Expertise / Joint Venture

• Assist in gaining market access for:– Premium Blueberries
– World class Genetics
• We need your support – political / biosecurity
• Create a win / win situation for China consumer
What can China do for Australia