© 2004, Energy Systems Laboratory, Texas A&M University System1 The Energy Advancement Leadership...
28
1 © 2004, Energy Systems Laboratory, Texas A&M University System The Energy Advancement Leadership Conference Available Technologies: Energy Efficiency Energy Efficiency & Air Quality Tom Fitzpatrick Energy Systems Laboratory Texas Engineering Experiment Station Texas A&M University System November 17, 2004
Transcript of © 2004, Energy Systems Laboratory, Texas A&M University System1 The Energy Advancement Leadership...

1© 2004, Energy Systems Laboratory, Texas A&M University System
The Energy Advancement Leadership ConferenceAvailable Technologies: Energy Efficiency
Energy Efficiency & Air QualityTom Fitzpatrick
Energy Systems LaboratoryTexas Engineering Experiment Station
Texas A&M University System
November 17, 2004

© 2004, Energy Systems Laboratory, Texas A&M University System
Objectives
• Introduce the Energy Systems Lab• Call your attention to practical potential of energy
efficiency• Highlight recent work on methodology to
calculate creditable emissions reductions from EE/RE in clean air plans
• Highlight a low-investment, high return approach to improving building efficiency, called Continuous CommissioningSM
• Invite you to a new event.
© 2004, Energy Systems Laboratory, Texas A&M University System

© 2004, Energy Systems Laboratory, Texas A&M University System
Energy Systems Laboratory• Division within Texas Engineering Experiment
Station, Texas A&M University System• Conducts research on energy efficient
design/operations for large buildings & renewable energy applications
• Conducts testing of HVAC equipment, meters/sensors & photovoltaic technologies
• Developed and supports market deployment of building optimization technique - Continuous Commissioning®
• Provides technical support for energy efficiency initiatives in TERP
© 2004, Energy Systems Laboratory, Texas A&M University System

© 2004, Energy Systems Laboratory, Texas A&M University System
Significance of Energy Efficiency & Renewable
Energy in Texas
EE/RE is cleanest, most cost effective, readily available means to meet new energy demand.
“Off the shelf” technologies (lighting, controls, HVACs, traffic signals) could save
Texas Tune-up (CC®) of commercial buildings could save (~$30M TAMU)
Improving water & waste water treatment/distribution (up to 50% of local govt. energy use) save
Alternate resources such as wind, biomass & PV offset fossil fuels
10 – 90 %
15 – 20 %
20 – 40 %
(Highest Renewable Potential of any state)

© 2004, Energy Systems Laboratory, Texas A&M University System
Energy Efficiency in the TERP
• SB 5 (77th) created framework for SIP credits from Energy Efficiency & Renewable Energy (EE/RE)
• Authorized TCEQ to promote EE/RE as a control strategy & to create a methodology for obtaining SIP credits
• Mandated statewide adoption of Energy Codes for residential/commercial construction
• Mandated 5% energy savings goal annually by local government buildings in affected counties
© 2004, Energy Systems Laboratory, Texas A&M University System

© 2004, Energy Systems Laboratory, Texas A&M University System
An Easily AccessibleWeb Based
Emissions Reductions and Energy Savings Calculator
© 2004, Energy Systems Laboratory, Texas A&M University System
General Capabilities (ECalc)
• Calculates energy and emissions savings from code-compliant new construction and certain public building retrofits
• Calculates savings from renewable Solar Hot Water, Solar PV, and Wind Power projects
• Calculates savings for Municipal Water, Wastewater, Traffic Lights and Street Lights projects

© 2004, Energy Systems Laboratory, Texas A&M University System
Models

© 2004, Energy Systems Laboratory, Texas A&M University System
Express Calc
55
43
R-26
R-13
21
0.45
4.3
86
© 2004, Energy Systems Laboratory, Texas A&M University System
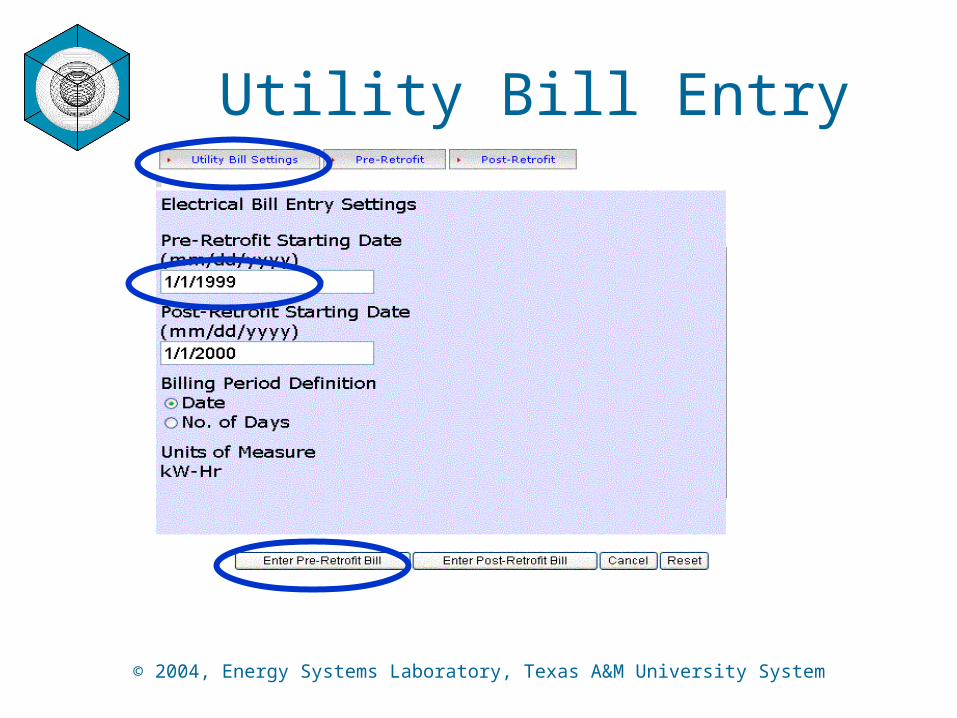
Utility Bill Entry

© 2004, Energy Systems Laboratory, Texas A&M University System
Solar – Domestic Hot Water
60
60

© 2004, Energy Systems Laboratory, Texas A&M University System
Job Report - SummarySummary Report currently being evaluated to further simplify
-
174.3208.8
165.7CodePrecode
User Input0.340.42
0.3269,576.478,889.1
67,469.2 1231.41402.6
1090.3CodePrecode
User Input0.420.51
0.39311,365.8372,229.1
292,835.4
174.3208.8
165.7CodePrecode
User Input0.340.42
0.3269,576.478,889.1
67,469.2

© 2004, Energy Systems Laboratory, Texas A&M University System
Job Report - DetailsDetailed Report provides needed information for obtaining SIP credits
Several pages of information can be automatically read and tallied

© 2004, Energy Systems Laboratory, Texas A&M University System
System Architecture - Overview
Web Server Database Server CalcEngine(s)
DOE-2 v2.1EFchart
PVFChartIMT
Calc Servers
User
Web ServerDB Server
SQL Server2000
C#.NETASP.NETADO.NET
XML
Email w results
VB.NETADO.NET
ASCIIOutput
BrowserRenewables
MunicipalCommunity
Buildings

© 2004, Energy Systems Laboratory, Texas A&M University System
eCalc Block Diagram Calculation Engine
CE FramePitcher
CE FrameCatcher
DOE-2
FCHART
PVFCHART
UTILITYBILLS(24 mo)
LIGHTING ANDWATER
SYSTEMS
eGRID
Weather
NOAAWeather
WeatherFilter, QA and
Filling
User
Web
Model Inputs
Utility Bills
Job
Web Server
Reports Report/
Database
DB Server
XML
Data
SQL
2000
XSLTfromXML
JobData
Pa
ram
ete
rs f
rom
Use
r,an
d “B
uild
ing
Da
tab
ase
”
Job Completion/Failure
Intermediate and
Final Run Data
Workstation(s)
PEAKEXTRACTOR
(IMT)
XML

© 2004, Energy Systems Laboratory, Texas A&M University System
What is Continuous Commissioning®?
• A team effort (facility staff and CC® engineers) which commissions mechanical and control devices to optimize overall building performance
• Oriented toward total building performance with an emphasis on reducing energy costs and improving comfort
• Optimizes energy consumption of the building as it is currently operated, not as designed
• “Continuous” emphasizes the need for performance tracking and ongoing service to keep the commissioning “continuous”

© 2004, Energy Systems Laboratory, Texas A&M University System
Continuous Commissioning Started with Retrofit Projects
$0
$500,000
$1,000,000
$1,500,000
$2,000,000
$2,500,000
$3,000,000
$3,500,000
$4,000,000
$4,500,000
$5,000,000
TSH UTMB UTHSC
Before Retrofit After Retrofit After CC

© 2004, Energy Systems Laboratory, Texas A&M University System
Examples of CC Projects
• Texas LoanSTAR Program• Texas A&M University Campus• Terrell State Hospital• Brooke Army Medical Center• Penn State University• Fairview University Medical Center –
Minneapolis• Alamo Community College District

© 2004, Energy Systems Laboratory, Texas A&M University System
Step 1
Initial Survey Identify CC / ECM’s / Savings Specify Monitoring Approval to ProceedInvolve Facility Staff
Step 2Install Monitoring Develop Energy BaselineInvolve/Train Facility Staff
Step 3
Survey Facility Problem Solving Quantify / Prioritize CC / ECM’s Analyze Energy Flow Involve Facility Staff
Step 4
Step 5
Install / Commission Major Equipment to Building NeedsAdditional Problem SolvingInvolve/Train Facility Staff
Step 6
Commission Entire Building to Building NeedsAdditional Problem SolvingInvolve/Train Facility Staff
On-Going Monitoring / AnalysisFeedback Results to Facility StaffRevisit Building YearlyInvolve/Retrain Facility Staff
Process

© 2004, Energy Systems Laboratory, Texas A&M University System
Case Study:Kleberg Building, Texas A&M Campus
• Building:165,031 ft2, 4-floors plus bsmt.• HVAC:
– 2 x 100hp SDVAV AHUs with Pre-Heat and Terminal Box Reheat
– 2 x 25hp Return Air Fans
• Building Type: Classrooms, Offices, Laboratories
• Central Plant Supply: CHW & HW

© 2004, Energy Systems Laboratory, Texas A&M University System
Kleberg:
Major CC Measures Implemented
1. Applied preheat & cold deck reset schedules
2. Utilized economizer cycle3. Optimized CHW pump control4. Performed lab air balance
Reduced building pressure from 0.05” to 0.03” H2OReduced exhaust duct pressure from 3.0” to 0.75” H2O

© 2004, Energy Systems Laboratory, Texas A&M University System
Kleberg Building:
Heating Consumption:
Kleberg BuildingHot Water Consumption
0.0
1000.0
2000.0
3000.0
4000.0
5000.0
6000.0
7000.0
8000.0
0.0 10.0 20.0 30.0 40.0 50.0 60.0 70.0 80.0 90.0 100.0
OA Temp, °F
HW
Btu
(K
Btu
/h)
Pre-CC
Post-CC

© 2004, Energy Systems Laboratory, Texas A&M University System
Kleberg Building: Cooling Consumption
Kleberg BuildingChilled Water Consumption
0.0
1000.0
2000.0
3000.0
4000.0
5000.0
6000.0
7000.0
8000.0
9000.0
10000.0
0.0 10.0 20.0 30.0 40.0 50.0 60.0 70.0 80.0 90.0 100.0
OA Temp, °F
CW
Btu
(K
Btu
/h)
Pre-CC
Post-CC

© 2004, Energy Systems Laboratory, Texas A&M University System
Kleberg Building:
Case Study Results
Measured Savings
(Jun ‘96 to July ‘99)
HW = $482,600 (84% energy reduction)
CHW = $656,200 (63% energy reduction)
Total = $1,138,800
Average Annual Savings: $360,000 / year

© 2004, Energy Systems Laboratory, Texas A&M University System
Summary of CC Benefits
• Reduce energy use and related environmental impacts
• Simple Pay-back: Typically less than three years• Project Duration: Typically 3 weeks to 10 weeks per
building• Building Comfort: Improved• Maintenance Cost: Reduced• Potential System Upgrades: Identified• Technical knowledge of in-house operating staff:
Improved

© 2004, Energy Systems Laboratory, Texas A&M University System
Benefits of Energy Efficiency & Renewable Energy Sources
• Reduced air pollution
• Reduced needs/costs for Electric Generation and new Transmission
• Reduced requirement for fossil fuels
• Cheap, clean, readily available supply
• Proven reserves Gap
?Alternate ResourcesEnergy Efficiency
Energy
Demand
Energy Supply
Time

© 2004, Energy Systems Laboratory, Texas A&M University System
Invitation• Emissions Reduction & Energy Leadership
Summit in San Antonio Dec. 14 – 17, 2004• www.sanantonioenergyleadership.org
© 2004, Energy Systems Laboratory, Texas A&M University System
Thanks!
• The need and opportunity for energy efficiency is growing
• eCalc is an easy to use tool to support crediting EE/RE with emissions reductions
• Continuous Commissioning® is a technique for delivering energy efficiency in existing buildings, with or without retrofit.
• Come see us in San Antonio Dec. 14-16.
© 2004, Energy Systems Laboratory, Texas A&M University System