
© 2000 Universität Karlsruhe, System Architecture Group Efficient and Flexible Value Sampling...
28
© 2000 Universität Karlsruhe, System Architecture Group Efficient and Flexible Value Sampling Michael Burrows (Compaq SRC) Ulfar Erlingson (deCODE Genetics) Shun-Tak Leung (Compaq SRC) Mark Vandevoorde (AltaVista) Carl Waldspurger (VMWare) Kip Walker (CMU) Bill Weihl (Akamai) ASPLOS-IX Ninth International Conference on Architectural Support for Programming Languages and Operating Systems November 12-15 2000, Cambridge, MA
-
date post
22-Dec-2015 -
Category
Documents
-
view
213 -
download
0
Transcript of © 2000 Universität Karlsruhe, System Architecture Group Efficient and Flexible Value Sampling...
© 2000 Universität Karlsruhe, System Architecture
Group
Efficient and Flexible Value Sampling
Michael Burrows (Compaq SRC)Ulfar Erlingson (deCODE Genetics)
Shun-Tak Leung (Compaq SRC)Mark Vandevoorde (AltaVista)
Carl Waldspurger (VMWare)Kip Walker (CMU)
Bill Weihl (Akamai)
ASPLOS-IX
Ninth International Conference onArchitectural Support forProgramming Languages andOperating Systems
November 12-15 2000, Cambridge, MA
© 2000 Universität Karlsruhe, System Architecture Group
Goal: Value profiling
Record values during program execution
Find “semi-invariant” values for prefetching, specialization, speculation
For example: A load reads from 0x3C8 95% of the
time A function is always evaluated to zero
© 2000 Universität Karlsruhe, System Architecture Group
Possible techniques
Instrument program with binary editor Interpret, and record values generated Sample values using periodic timer
interrupts
Last approach is explored.It is potentially far less intrusive.
© 2000 Universität Karlsruhe, System Architecture Group
DCPI overview/review
DCPI profiles all address spaces Generates periodic interrupts Interrupt routine records process ID and
PC User-space daemon maps to
offset/executable, and aggregates samples in files
Tools report data for executables, procedures, and instructions
© 2000 Universität Karlsruhe, System Architecture Group
Value sampling with DCPI
On each interrupt, collect values Somehow associate values with
PC, PID Summarize values, and aggregate
in files Tools analyze summaries to find
optimization opportunities
© 2000 Universität Karlsruhe, System Architecture Group
Inherited properties of DCPI
It’s a sampling technique It has modest overhead
(Low enough for production use) It’s transparent to user It can be used on the whole system
(Including operating system kernel)
© 2000 Universität Karlsruhe, System Architecture Group
Associating values with instructions
Which instructions generated which values?
On interrupt, we don’t know: Which instruction was last executed Which register was last written
© 2000 Universität Karlsruhe, System Architecture Group
First try — “bounce back” interrupt
Alpha 21164 can interrupt after k user-mode cycles
On a periodic interrupt:1. Record PC2. Set k to be small3. Return
On “bounce-back” interrupt, match executed instructions against register content
© 2000 Universität Karlsruhe, System Architecture Group
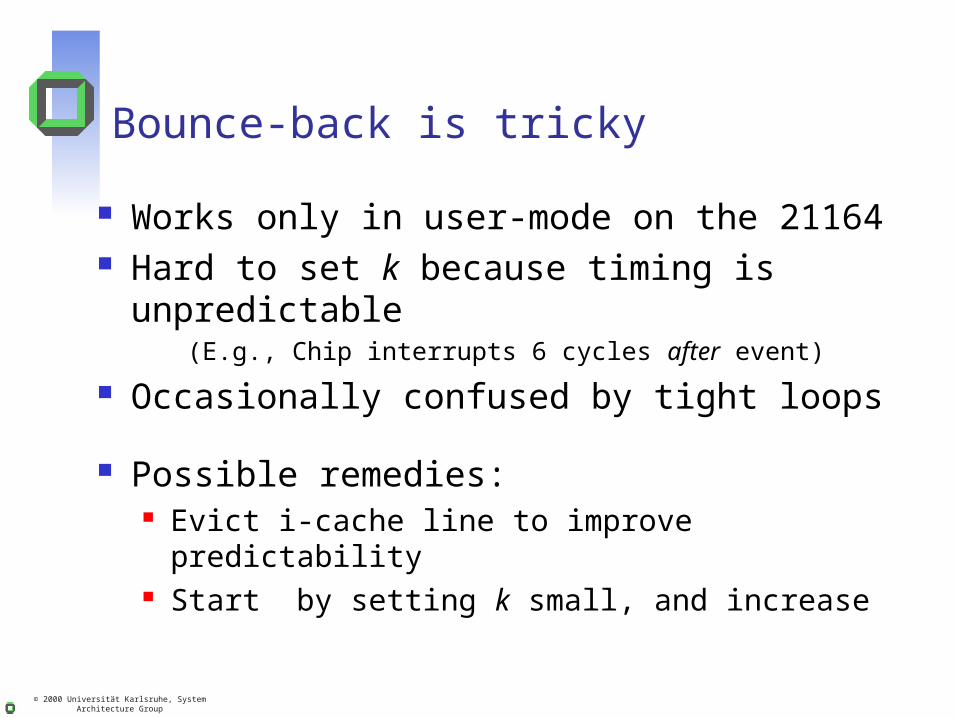
Bounce-back is tricky
Possible remedies: Evict i-cache line to improve predictability Start by setting k small, and increase
Works only in user-mode on the 21164 Hard to set k because timing is
unpredictable(E.g., Chip interrupts 6 cycles after event)
Occasionally confused by tight loops
© 2000 Universität Karlsruhe, System Architecture Group
Collecting values with an interpreter
On each interrupt, interpret a few instructions
Save values associated with each instruction

© 2000 Universität Karlsruhe, System Architecture Group
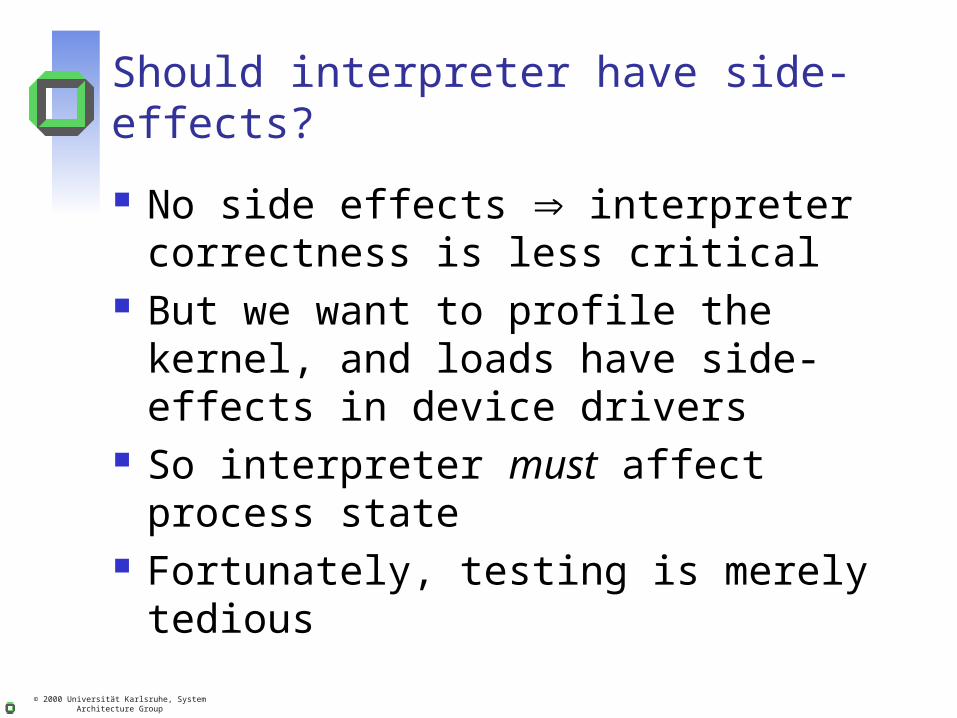
Should interpreter have side-effects?
No side effects interpreter correctness is less critical
But we want to profile the kernel, and loads have side-effects in device drivers
So interpreter must affect process state
Fortunately, testing is merely tedious
© 2000 Universität Karlsruhe, System Architecture Group
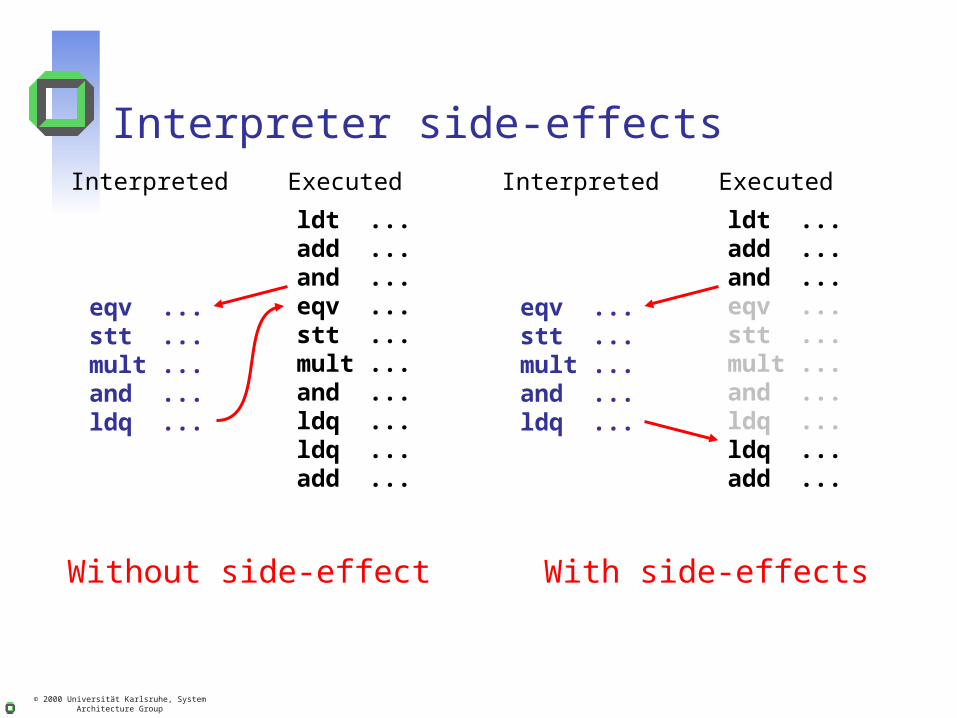
Interpreter side-effects
ldt ...add ...and ...eqv ...stt ...mult ...and ...ldq ...ldq ...add ...
eqv ...stt ...mult ...and ...ldq ...
Interpreted Executed
Without side-effect
ldt ...add ...and ...eqv ...stt ...mult ...and ...ldq ...ldq ...add ...
eqv ...stt ...mult ...and ...ldq ...
Interpreted Executed
With side-effects
© 2000 Universität Karlsruhe, System Architecture Group
Should interpreter have side-effects?
No side effects interpreter correctness is less critical
But we want to profile the kernel, and loads have side-effects in device drivers
So interpreter must affect process state
Fortunately, testing is merely tedious
© 2000 Universität Karlsruhe, System Architecture Group
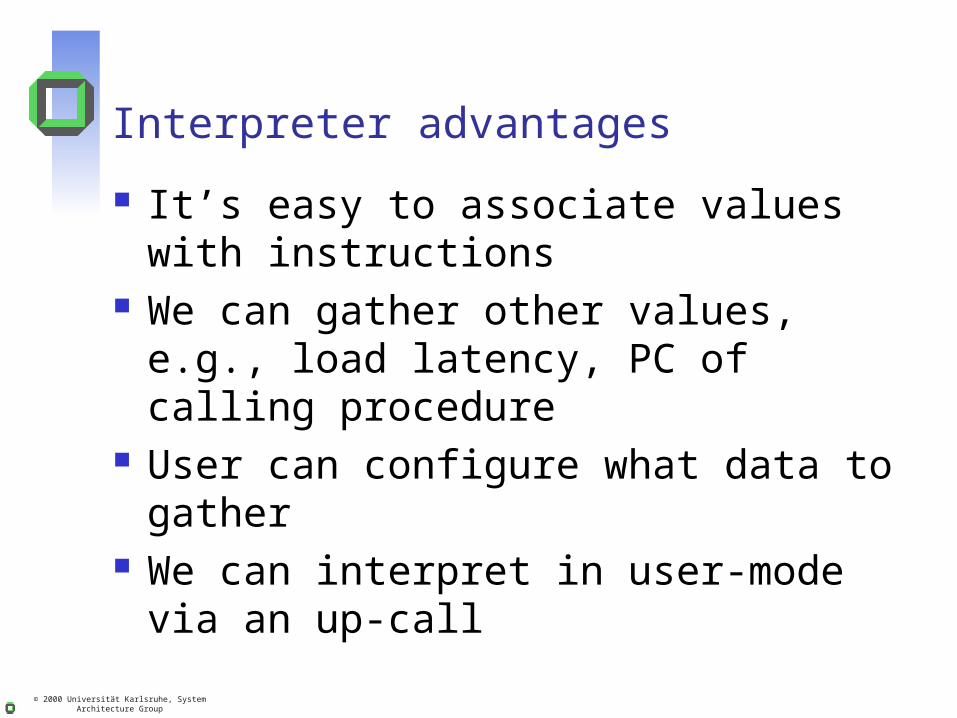
Interpreter advantages
It’s easy to associate values with instructions
We can gather other values, e.g., load latency, PC of calling procedure
User can configure what data to gather
We can interpret in user-mode via an up-call
© 2000 Universität Karlsruhe, System Architecture Group
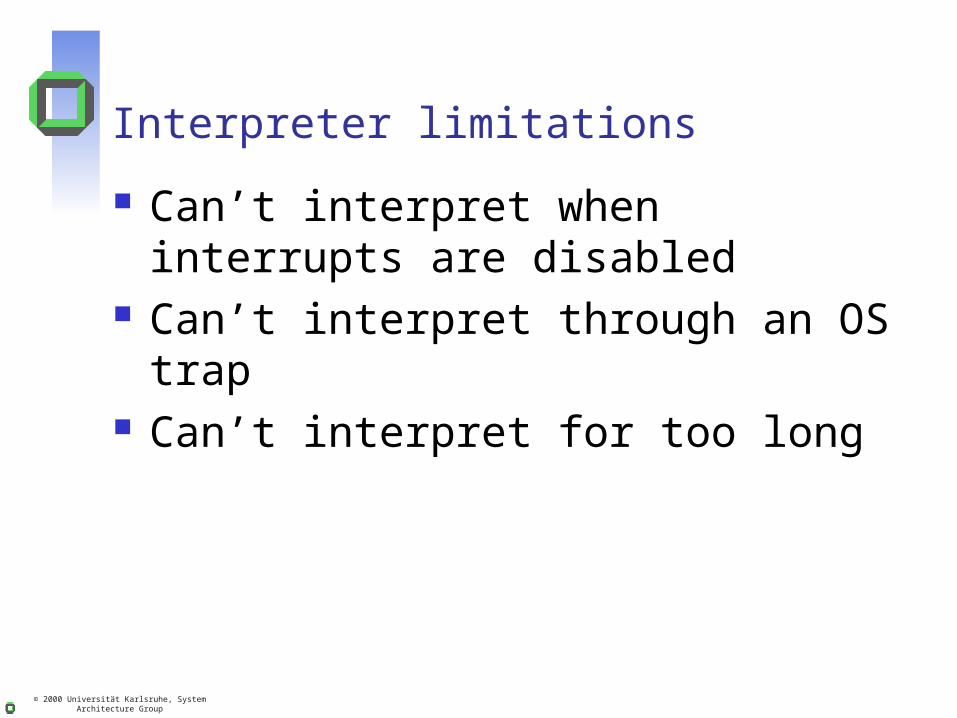
Interpreter limitations
Can’t interpret when interrupts are disabled
Can’t interpret through an OS trap Can’t interpret for too long
© 2000 Universität Karlsruhe, System Architecture Group
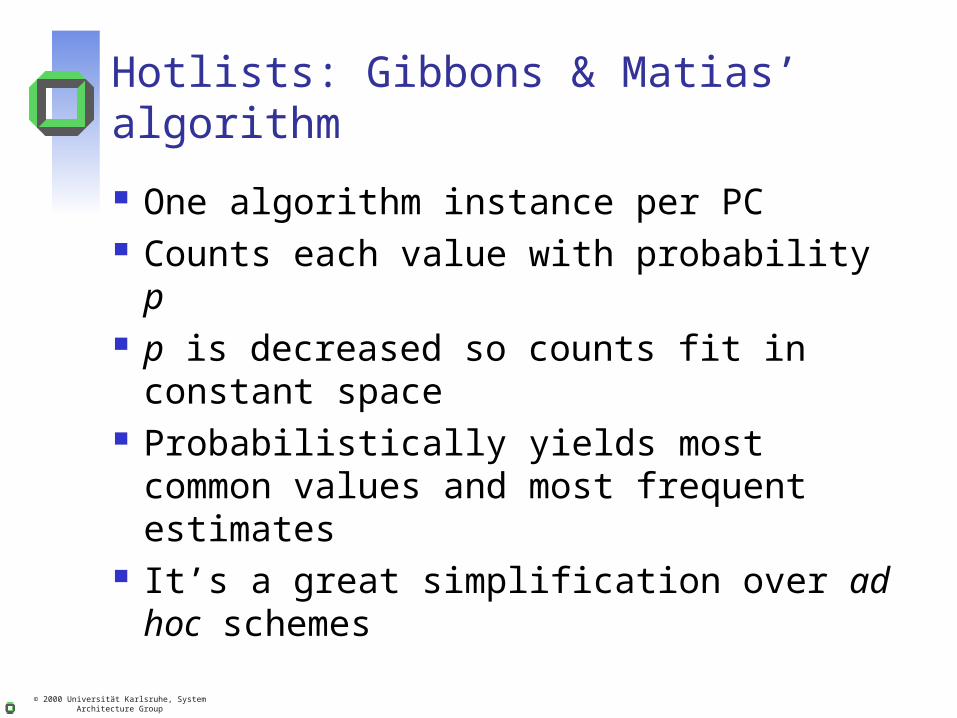
Hotlists: Gibbons & Matias’ algorithm
One algorithm instance per PC Counts each value with probability p p is decreased so counts fit in
constant space Probabilistically yields most common
values and most frequent estimates It’s a great simplification over ad hoc
schemes
© 2000 Universität Karlsruhe, System Architecture Group
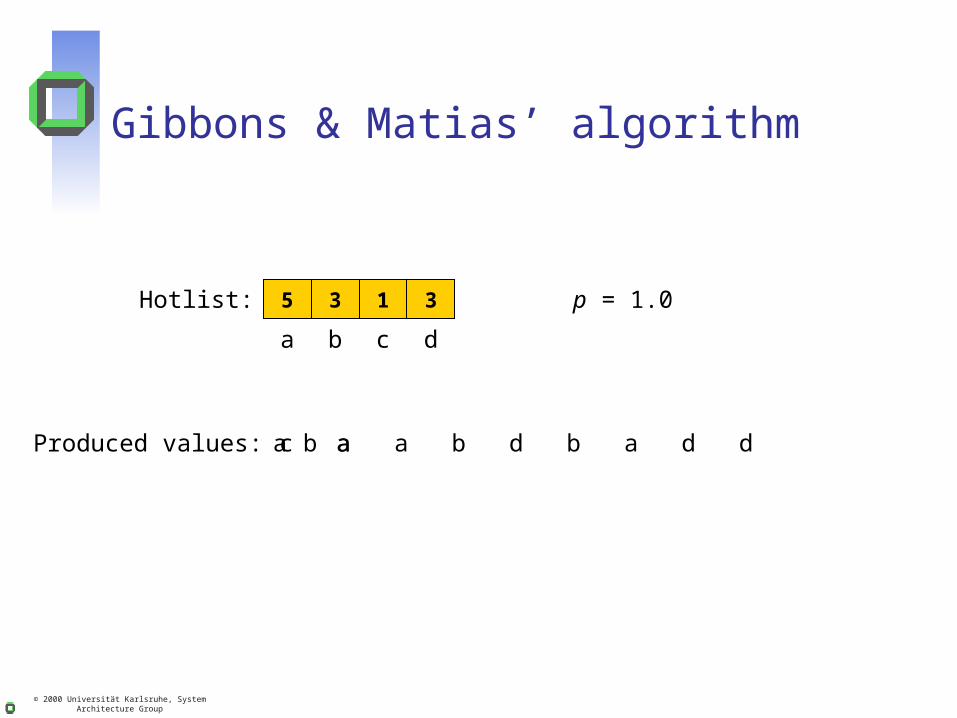
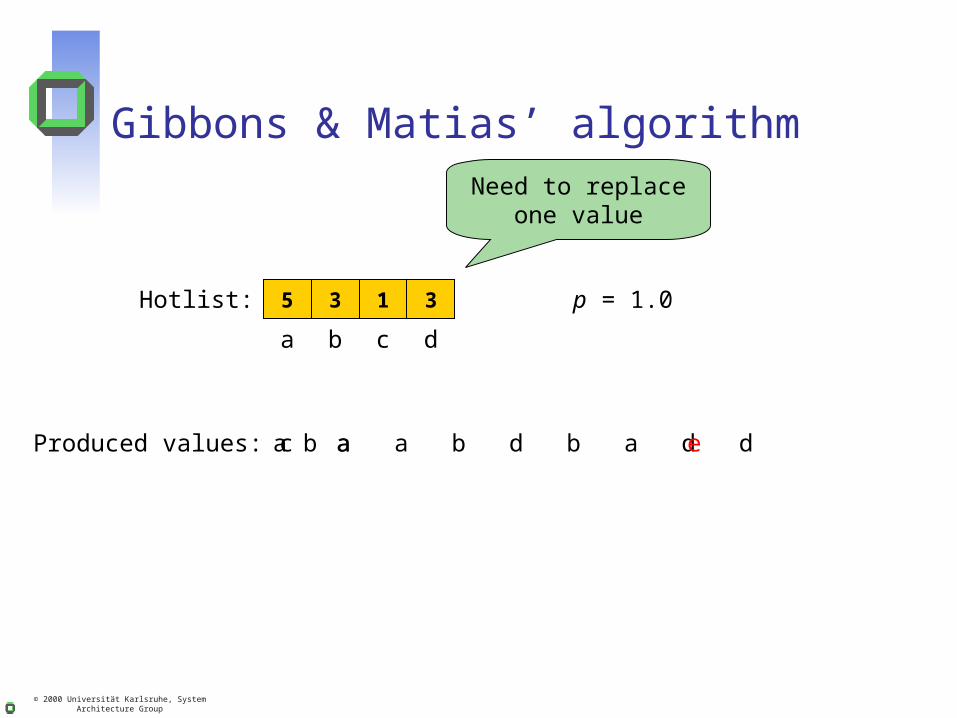
Gibbons & Matias’ algorithm
0 0 0 0
a
a
1Hotlist:
b
b
1
a
2
Produced values: c a a b d b a d d
5 3 1 3
c d
p = 1.0
© 2000 Universität Karlsruhe, System Architecture Group
Gibbons & Matias’ algorithm
0 0 0 0
a
a
1Hotlist:
b
b
1
a
2
Produced values: c a a b d b a d d
5 3 1 3
c d
p = 1.0
e
Need to replaceone value
© 2000 Universität Karlsruhe, System Architecture Group
Gibbons & Matias’ algorithm
0 0 0 0
a
a
1Hotlist:
b
b
1
a
2
Produced values: c a a b d b a d d
5 3 1 3
c d
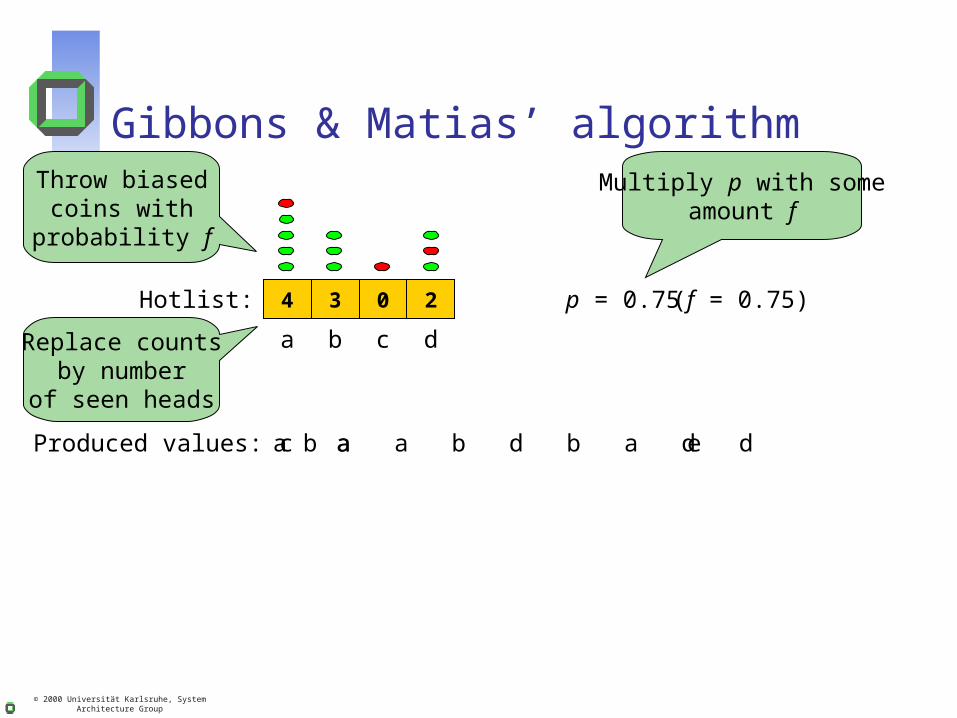
p = 0.75
e
Multiply p with someamount f
(f = 0.75)
Throw biasedcoins with
probability f
4 3 0 2
Replace countsby number
of seen heads
© 2000 Universität Karlsruhe, System Architecture Group
Gibbons & Matias’ algorithm
0 0 0 0
a
a
1Hotlist:
b
b
1
a
2
Produced values: c a a b d b a d d
5 3 1 3
e d
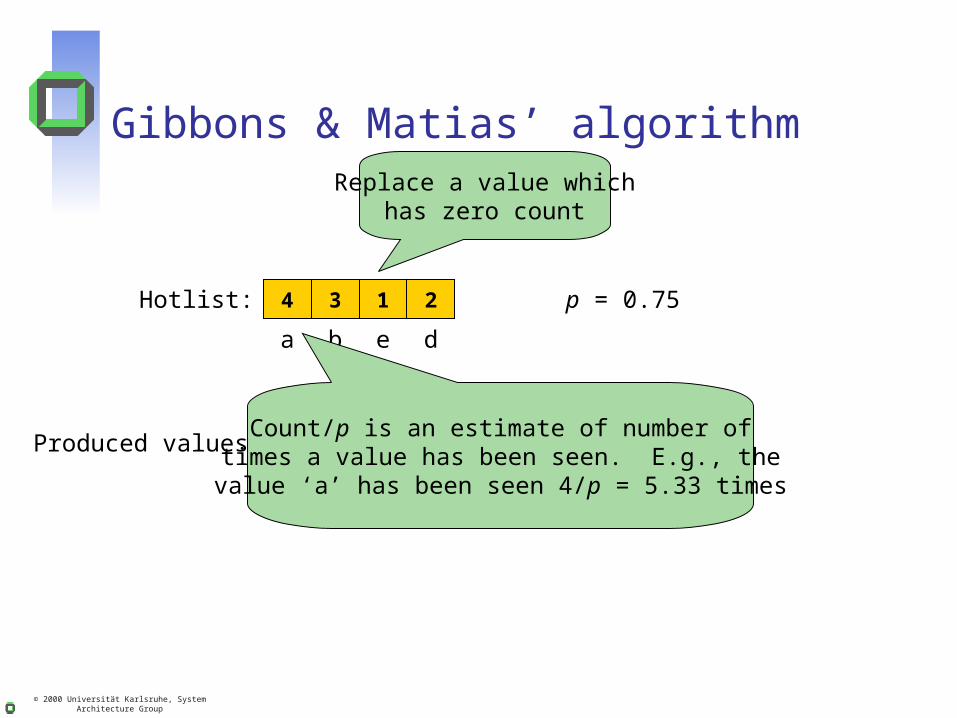
p = 0.75
e
4 3 1 2
Replace a value whichhas zero count
Count/p is an estimate of number oftimes a value has been seen. E.g., the
value ‘a’ has been seen 4/p = 5.33 times
© 2000 Universität Karlsruhe, System Architecture Group
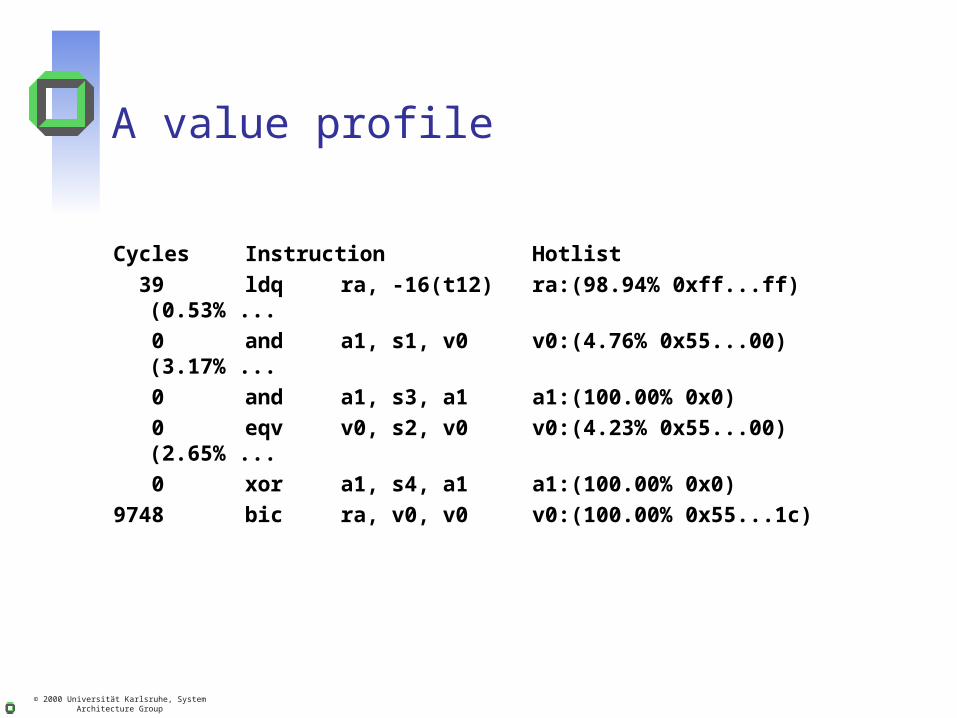
A value profile
Cycles Instruction Hotlist 39 ldq ra, -16(t12) ra:(98.94% 0xff...ff)
(0.53% ... 0 and a1, s1, v0 v0:(4.76% 0x55...00)
(3.17% ... 0 and a1, s3, a1 a1:(100.00% 0x0) 0 eqv v0, s2, v0 v0:(4.23% 0x55...00)
(2.65% ... 0 xor a1, s4, a1 a1:(100.00% 0x0)9748 bic ra, v0, v0 v0:(100.00% 0x55...1c)
© 2000 Universität Karlsruhe, System Architecture Group
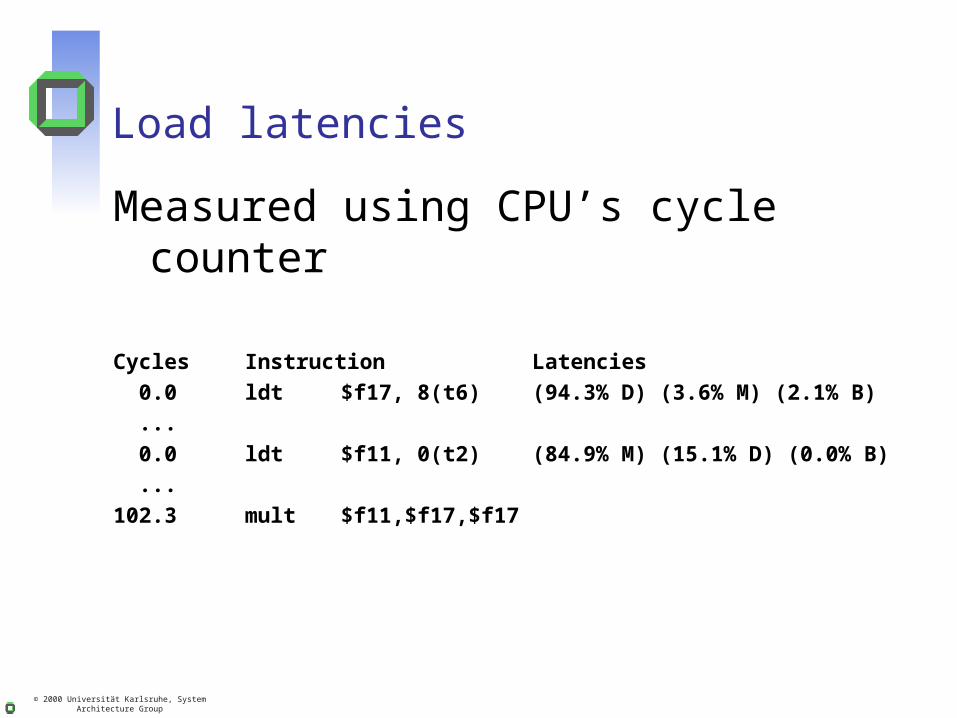
Load latencies
Measured using CPU’s cycle counter
Cycles Instruction Latencies 0.0 ldt $f17, 8(t6) (94.3% D) (3.6% M) (2.1% B) ... 0.0 ldt $f11, 0(t2) (84.9% M) (15.1% D) (0.0% B) ...102.3 mult $f11,$f17,$f17
© 2000 Universität Karlsruhe, System Architecture Group
Are latency values meaningful?
Usually, yes We displace a few percent of d-
cache lines
Can’t get i-cache fill latencies with interpreter
Nor mispredict penalties
© 2000 Universität Karlsruhe, System Architecture Group
21264 replay traps
Reordering can violate memory sematics(E.g., a load of L reorded before a store to L)
A replay trap replays the offending instruction
Expensive: All later instructions are replayed
Hardware counters saw where the trap occurred, but not why
© 2000 Universität Karlsruhe, System Architecture Group
Identifying replay trap cause: vreplay
Interpret >100 instructions at a time
Interpreter compares load/store addresses
Records which instructions could conflict
Later, combine results and hardware counts
© 2000 Universität Karlsruhe, System Architecture Group
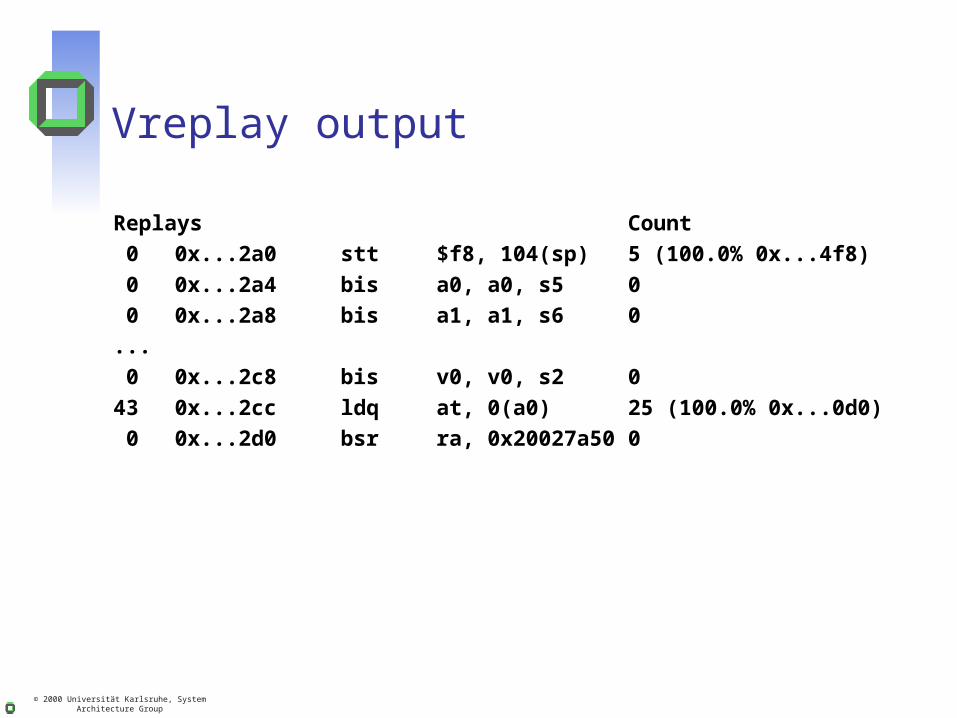
Vreplay output
Replays Count 0 0x...2a0 stt $f8, 104(sp) 5 (100.0% 0x...4f8) 0 0x...2a4 bis a0, a0, s5 0 0 0x...2a8 bis a1, a1, s6 0... 0 0x...2c8 bis v0, v0, s2 043 0x...2cc ldq at, 0(a0) 25 (100.0% 0x...0d0) 0 0x...2d0 bsr ra, 0x20027a50 0
© 2000 Universität Karlsruhe, System Architecture Group
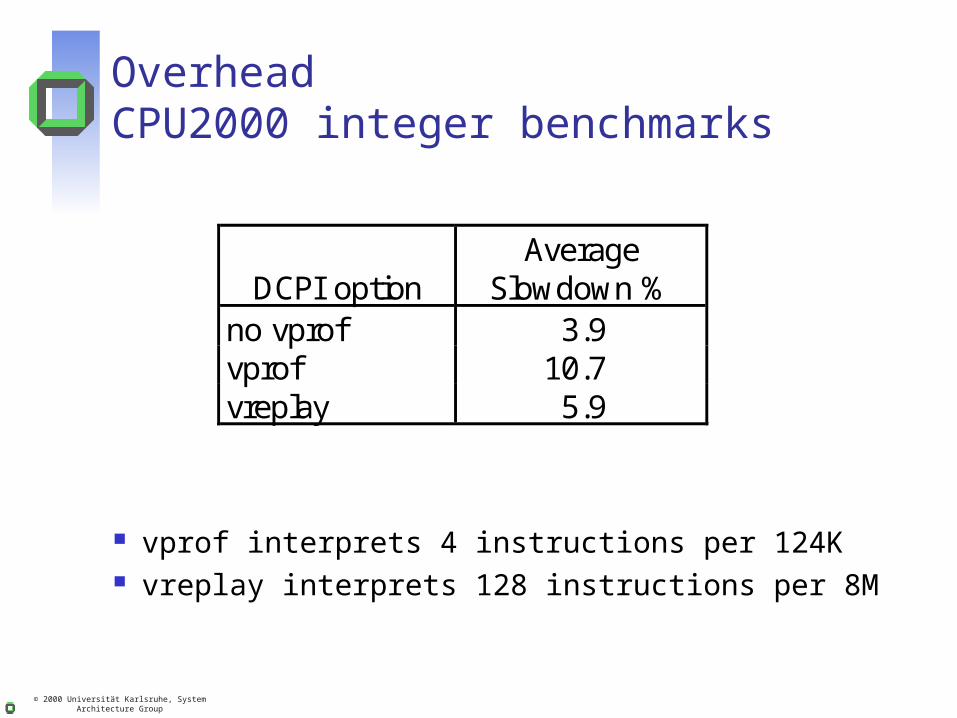
OverheadCPU2000 integer benchmarks
vprof interprets 4 instructions per 124K vreplay interprets 128 instructions per 8M
DCPI optionAverage
Slowdown %no vprof 3.9vprof 10.7vreplay 5.9
© 2000 Universität Karlsruhe, System Architecture Group
Summary
Periodic interpretation: flexible, about 10% overhead
Provides value profiles and data not provided by hardware counters
Gibbons and Matias’ algorithm is useful
Download from:http://www.tru64unix.compaq.com/dcpi/