DTIC · 1445 Sumertime aerosol measurements in the Ross sea region of Antartica. N.J. Harvey, I.S....
111
Jilt International Conference on Aerosols and Background Pollution DTIC 0 fIt E-LtCTE O AUG 0 8198 9 CmT< - D Abstracts AprMOTd for public reloamm University College, Galway, Ireland 13 - 15 June, 1989 807 068
Transcript of DTIC · 1445 Sumertime aerosol measurements in the Ross sea region of Antartica. N.J. Harvey, I.S....

Jilt
International Conferenceon
Aerosols and Background Pollution
DTIC0 fIt E-LtCTE
O AUG 0 8 198 9
CmT< - D
Abstracts
AprMOTd for public reloamm
University College, Galway,Ireland
13 - 15 June, 1989
807 068
AEROSOLS AND BACKGROUND POLLUTION CONFERENCE
University College Galway 1989
ABSTRACTS
Sponsors and Supporters
The European Association for the Science of Air Pollution
The European Research Office, London
The Gesellschaft fur Aerosolforschung
The Aerosol Society
Western Regional Tourism Organization Ltd.
Guinness Group Sales
Bank of Ireland
University College Galway
..- u-

ARROSOLS AND BACKGROUND POLLUIONI
Tuesday 13 June
0830 Registration
0945 Official Conference Opening
SESSION 1: AEROSOL CLIMATOLOGY. - :C -.
1000 Aerosol Climatology invited review [2-
0. Preining
1045 Refreshment break "
1115 Development of a global-scale background aerosol modelD.A. Bowdile
1130 Arctic Haze: Long range pollution of the polar atmosphereR.C. Schnell and J.D. Kahl
1145 Southern Ocean condensation nuclei and climate variationsJ.L. Gras
1200 Cloud condensation and Aitken nuclei measurements in backgroundairE.K. Bigg, A.D. Kaye and W.J. MNegaw
1215 Aerosol climatology measurements with Nolan-Pollak countersT.C. O'CoMnor and F.M. McGovern
1230 Lunch
SESSION 2: MARINE AEROSOLS
1345 Marine Aerosols ; invited reviewJ.W. Fitzgerald
1430 Marine Aerosols generated from bursting air bubblesJ. Wu
1445 Sumertime aerosol measurements in the Ross sea region ofAntartica.N.J. Harvey, I.S. Lechner, G.W. Fischer and P. Isaac
1500 Physical characteristics of the ambient aerosol at Mace HeadS.G. Jexinu s, C.D. O'Dowd, T.C. O'Connor and F.M. McGovern
1515 North Atlantic Aerosol Background concentrations measured at aHebridean coastal siteN.H. Smith, P.M. Park and I.E. Consterdine
1530 Refreshment break
,,f"

1600 SESSION 2 continued
1600 Physical and chemical parameters of marine background andSahara aerosols over the North Atlantic oceanV. Dreiling, R. Maser and L. Schutz
1615 Measurements of aerosol concentration and distribution atHelgoland IslandP. Brand, J. Gebhart, M. Below, B. Georgi and J. Heyder
1630 Volatility of background aerosolS.G. Jennings and C.D.O'Dowd
1645 Interhemisphereic variability in aerosol physicochemistry overthe remote Pacific oceanA.D. Clarke
1700 Comparison of aerosol characteristics in the arid southwesternUS and the west coast of western EuropeE.H. Holt, R.G. Pinnick and S.G. Jennings
1715 Distribution of methanesulfonate, NSS-sulfate andDimethylsulfide over the Atlantic and the North SeaS. Burgermeister and H. -W. Georgii
1800 Reception - Aula Maxima
2100 Irish style evening - Salthill Hotel
Accesicon For
NTIS CRA&I
SoT;C TAU]IU;.i.rno ,CoX1 Li]
I .- i ; .,. C.
A-11

Wededay 14 June
SESSION 3: PROPERTIES CF AESOLS
0900 The chemistry of aerosols in the atmosphere: invited reviewR.M. Harrison
0945 Elemental composition of aerosol particles under backgroundconditions in HungaryI. Borb6ly-Kiss, E. Koltai, E. N sziroo, A. Moln~r and Gy.Szab6
1000 Particulate and gaseous air pollutant levels at the Portuguesewest coastC. A. Pio, R.M. Leal, I.M. Santos and T.D. Anacleto
1015 Acid aerosol measurements at a suburban Connecticut siteG. Keeler, J. Spengler, and R. Castillo
1030 Sensitivity limit, resolution, counting efficiency andcoincidence limit of optical aerosol particle countersH.T. Be
1045 Refreshment break
1115 Session 3: PROPERTIES OF AEROSOLS (CARBOCROS) continued
1115 Characterization of the carbonaceous aerosol in the westernMediterranean atmosphereH. Cachidr, M.P. Bremond and P. Buat-M6nard
1130 Internal/external mixing of soot to aerosols insolirce andreceptor regions in AustriaR. Hitzenberger
1145 A methodology for estimating regional emissions of black carbonaerosol in the ArticJ.D. Kahl, A.D.A. Hanson-and P.C. Schnell
120u Airborne particulate elements carbon: its sources, transportand soiling potentialR.S. Hamilton and T.A. Mansfield
1215 Particle samples from forest firesA.D. ay and W.J. Megaw
1230 Atmospheric aerosol sources and their climatic significanceG.A. d'Almida, P. Koepke and M. Hess
1245 Lunch
lii

1345 SESSION 3: PROPERTIES OF AEROSOLS (OPTICAL) continued
1345 Atmospheric optical depths : background and perturbations inthe troposphere and stratosphereR.F. Pueschel, P.B. Russell and M.P. McCormick
1400 Spectral extinction coefficients of background aerosols inEurope, North America and South America; A comparisonH. Horvath
1415 Evidence of a tropospheric aerosol backscatter background modeat CO2 wavelengthsJ. Rothermel, D.A. Bowdle, R.T. Menzies, M.J. Post and J.M.Vaughan
1430 The Mauna Loa aerosol backscatter intercomparison experiment(MABIE)D.A. Bowdle, E.M. Patterson, M.J. Post and A.D. Clarke
1445 Aerosol optical properties in remote marine regionsA.D. Clarke
1500 Refreshment break
1530 POSTER PAPERS PRESENTATION
SESSION 1 AEROSOL CLIMATOILGY
Continuous background aerosol monitoring with the epiphaniometerU. Baltensperger, H.W. Gaggeler and D.T. Jost
A thermo-optic technique for in-situ analysis of size-resolved aerosolphysicochemistryA.D. Clarke
Background aerosol measurements in GermanyB. Georgi
Comparison of aerosol size distribution measurements in an urban andremote site in SwitzerlandB. Giorgi, H. -N. MKller and M. Meurer
iv
. I .

SESSION 3: PROPERTIES OF AEROSOLS (CHEMICAL):
Reaction of monoterpenes with ozone, SO2 and NO 2 gas phase oxidation ofSO2 and formation of sulphuric acidD. Kotzias, K. Fytianos and F. Geiss
Atmospheric conditions of photochemical smog formation in citiesO.V. Lomaya and D.F. Kharchilava
Terpenes, ozone and nitrogen oxide in a Finnish background stationT. Raunemaa and S. Konttinen
Case studies of the chemical composition of atmospheric aerosol at theSzrenica summit, Karkonosze range, PolandJ.W. Zwozdziak
PROPERTIES OF AEROSOLS (PHYSICAL):
Simulation of aerosol particles in a large smog chamberH. Bunz, M. Koyra and W. Schock
A novel instrument for the classificat'on of air borne particles on thebasis of size, shape and count frequencyN.A. Eyles, P.H. Kaye and I.K. Ludlow
Sampling artifacts from curved airborne intake systemsB.J. Huebert, W. Warren and G. Lee
A study of particulate resuspension from an ash-dumpJ.S. Pastuszka, J. Dybizbanski and M. Borowska
Application of an isothermal haze chamber to studies of mixedsoluble/insolwle anthropogenic particlesC.F. Rogers
Microphysical characteristics evolution of the natural aerosol justbefore fog formationR. Serpolay
PROPERTIES OF AEROSOL (OPTICAL):
Periodicity of extinction curve of dielectric spherical particlesPeter Chglek, J. Zhah, and S.G. Jennings
Observations of a possible Gobi dust event by infrared lidar near MaunaLoa, HawaiiN.J. Post and D.A. Bowdle
Aerosol backscattering climatologies as observed by infrared lidarN.J. Post
An interactive model for predicting scattering functions of polydisperseaerosolsP.C. Reist and W. Wilson
v
Concentration of some aerosol components and its influence on globalsolar radiation absorption and scattering in central part of upperSilasian Industry Region, PolandA. Sztyler
SESSION 4: TRANSPORT, SCAVENGING AND DRPOSITICK
Background air quality and deposition of trace elements in the provinceof South-HollandJ. van Daalen
Study of atmospheric aerosols in a terrain-induced nocturnal boundarylayer using bistatic lidarP.C.S. Devara and P.E. Raj
Vertical profile and elemental concentrations of aerosols in a forestareaK. Hameri, M. Kulmala, S. Ylatalo, U. Tapper and T. Raunemaa
Modelling dry deposition of particles to the oceanP. Huelshoj and C. Hansen
Modelling of the transport of water-soluble aerosols by a tropical squalllineM. Laube and P. Scheidgen
Transport, chemistry and deposition of airborne gaseous and particulatepollutants in a marine environmentS.M. Joffre and V. Lindfors
Ionic balances in marine rainwater with a special emptiasis on sources ofalkaline and acidic speciesR. Loeme, G. Bergametti, P. Carlier and G. Mouvier
Concentration profiles of trace elements over the North Sea and theAtlantic Ocean : anthropogenic and natural contributionR. Lsno, P. Carlier and G. Bergametti
Diurnal variation of the concentrations of radon and its shortliveddaughters in the atmosphere near the groundJ. Porstendorfer, G. Butterweck and A. Reineking
Removal of airborne particles by raindropsN. Taheri and Sh. Ayatollahi
1800 Bus to hotels
1930 Bus departure to dinner
2000 Conference dinner at the Connemara Coast Hotel
vi
.2

Thursday 15 June t
SESSION 4: Cii4' frr AND DISPERsAL O iiF - - -
0900 Long range transport of aerosols invited reviewR. Jaenicke
0945 AEROSOL TRANSPORT (VERTICAL)
0945 Troposphere aerosol size distributions in eastern and northernNorth America between 1982 and 1988 : A signature fortroposphere-stratosphere exchage?W.R. Leaitch and G.A. Isaac
1000 Aerosol measurements in the Southwest PacificI.S. Lechner, G.W. Fisher, N.J. Harvey, H.R. Larsen and R.A.Knobben
1015 Vertical profiles of aerosol properties on the Artic summer
troposphereJ. Heintzenberg, J. Strom, J.A. Ogren and L. Gardneus
1030 Vertical profiles of aerosol to 7 lan in the arid SouthwesternUSR.G. PinrLick, G. Fernandez, D.M. Garvey and E.H. Holt
1045 Refreshment break
1115 AEROSOL TRANSPORT (JRIZMAL)
1115 Atmospheric transport of sulfur and nitrogen across the NorthAtlantic ocean from North America to EuropeJ.N. Galloway and D.M. Whelpdale
1130 Long-range transport of trace metals to North Europe marginalseasG. Petersen, H. Weber, H. Grassl and J. Pacyna
1145 Source, transport and deposition of lead in the MediterraneanatmosphereE. Remoaki, R. Losno, G. Bergametti and P. Buat-Mgnard
1200 European source area identification and apportionment of longrange transported aerosolE. SwIetlicki, B. Swantesson and H.-C. Hansson
1215 Influence of ammonia from agriculture on trends in backgroundaerosol concentrationsH.5. ApSism, M. Kruse-Plass, P. Stott and G. Whitecombe
1230 Atmospheric electricity in GalwayJ.C.H. van der Hags
1245 Lunch
vii

1400 AEROSOL DISPERSAL - SCAVENGING
1400 Scavenging of aerosol particles by drizzle and precipitationsized dropsB. T. McGann and S.G. Jennings
1415 A theoretical study of the wet removal of two different typesof aerosol particles by a two dimensional dynamic model for aconvective warm cloudA.I. Flossmann and H.R. Pruppacher
1430 A field study on in-cloud removal of aerosol particlesT. Schumann
1445 A theoretical investigation of the collection of aerosolparticles by falling ice crystalsN. L. Miller
1500 The scavenging of high altitude aerosol by small ice crystalsD.A. Bell and C.P.R. Saunders
1515 Refreshment break
1545 Modelling of wet scavenging of heavy metals in the marineenvironmentL. Levkov, D.P. Eppel and H. Grasal
1600 Field measurements of the wet deposition of particulatematerialsK. W. Nicholson and J.R. Branson
1615 Sequential sampling of major ions, dissolved and total tracemetals in wet depositionB. Lin and T. D. Jickells
1630 Daily measurements of background air pollutants at a site inthe west of Northern IrelandJ. Stedman
1645 Seasonal variations in sulfate, nitrate and chloride in theGreenland ice sheet relation to atmospheric concentrationsC. I. Davidson
1700 Conference Close
viii

AEROSOL CLIMATOLOGY
0. PreiningInstitute for Experimental Physics
University of ViennaAustria
Climatology in general became, during the past few years, a very hotissue. The global heating due to the greenhouse effect, the seeminglyunavoidable global temperature increase caused by human activities, and theozone hole, developing over the antarctic set an alarm. From the climatemodelling efforts and from analyzing the situating and extrapolating into thenext hundred years it became evident that only large scale changes in humanactivities by all mankind can reduce the problems of the future to managablesizes. However these problems are only to a minor part scientific, they cannot be solved by science but only by political decisions, very hard anddifficult decisions, and the decision makers need a strong and convincingscientific backing to induce the general and global acceptance of thenecessary restrictions.
In this situation the aerosol science comunity found itself asked tocontribute. A very fast look around gave the astonishing fact that: 1)aerosols may play an important role for the assessment of climate, 2) thereis little known about the atmospheric aerosol, its production, its residencetime in the atmosphere, its sinks and its influences on climate. A jointworking group (JWG) on an international aerosol climatology project (IACP)formed and issued a plan outline for a "Global Aerosol Climatology and EffectsProgram (GACEP)". In their summary they stated on the role of aerosols:Large fractions of the atmospheric aerosols are of biological origin and mayhave considerable influence on climate by acting as cloud and ice nuclei,especially sulfate particles forming in the atmosphere from dimethyl sulfidefrom marine organismus may also act as cloud nuclei. Aerosols may add to thegreenhouse effect about as much as CO2. The Ozone-hole is influenced andprobably enforced (or even caused) by polar stratospheric clouds which in turnform on aerosol precursors, and finally Cloud Chemistry also depends onaerosols.
Literature
Landolt-Bornstein, New SeriesGroup V: Geophysics and Space Research, Vol.4, MeteorologySubvolume b: Physical and Chemical Properties of the Air,
Springer 1988.Subvolume c: Part I, Climatology Part 1, Springer 1987Subvolume c: Part II, Climatology Part 2, Springer 1988
A Deepak and G. Vali ed's for JWGGlobal Aerosol Climatology and Effects Program (GACEP): A PlanOutline; June 1988.

!r
DEVELOPMENT OF A GLOBAL-SCALE BACKGROUND AEROSOL MODEL
D.A. BowdleJohnson Research Center
University of Alabama at HuntsvilleHuntsville, Alabama 35899
USA
A global-scale model of background tropospheric aerosols is beingdeveloped to provide critical baseline design parameters for NASA's
prospective space-based Laser Atmospheric Wind Sounder (LAWS). Precise
definitions are required to properly design, communicate, and evaluate this
research. Three general background classes are distinguished. The termoperational background refers to the dominant modal structure in adistribution of aerosol measurements from a given aerosol sensor. Full
specification of this term requires: 1) the measured or derived aerosolproperty; 2) the end-to-end measurement system, including aerosol sensor,sensor platform, data processing, and analysis; 3) the end-to-end accuracy,precision and detection threshold; 4) the volume, shape, position,orientation, and spatial/temporal resolution of the effective sample zone; 5)
the spatial/temporal domain of the full data set; 6) the end-to-end sampleselection criteria for the full data set (including operational constraints);7) the methodology for i&:ntifying and isolating the background mode from thefull data set; and 8) the statistical descriptors for the background mode.The term consensus background refers to a set of estimates of a given aerosol
property, derived from operational background values for a wide variety ofaerosol data sets, and determined to be similar by a given statistical test.
Specification requires: 1) the data set selection criteria; 2) the dataconversion methods; and 3) the statistical test for "similarity". Ageophysical background refers to a set of airmasses with similar values of a
given aerosol property, as deduced from the presence of a consensus backgroundfor the property. Application of this methodology to a specific problemrequires careful choice of the full set of background parameters are soughtfrom each data set in NASA's GLobal Backscatter Experiment (GLOBE) data base
on background tropospheric aerosols. This comprehensive global- scale database includes measurements of aerosol microphysics and short wavelengthaerosol optical properties, along with modelling and direct measurements ofaerosol backscatte properties at CO 2 wavelengths. A global-scale consensusbackground of 10-1Umkg-lsr
-l was found for backscatter mixing ratios (aerosol
backscatter coefficients normalized by air density) at the 9.11 micron designwavelength for LAWS, suggestive of a global-scale geophysical background forthis property and a corresponding operational background design baseline forLAWS. Model methodology and results should be useful in: 1) studies of thelife-cycles, global-scale budgets, and physicochemical properties ofbackground aerosols; 2) the design of sensors that use scattering frombackground aerosols in the measurement of other atmospheric quantities; and3) the development of data compression algorithms for massive global-scaleaerosol data bases.
2

ARCTIC HAZE: LONG RANGE POLLUTION OF THE POLAR ATMOSPHERE
R.C. SchnellCIRES, University of Colorado
Boulder, CO 80309, USA
J.D. KahlGeophysical Monitoring for Climatic Change
National Oceanic and Atmospheric AdministrationBoulder, CO 80303, USA
The Arctic Gas and Aerosol Sampling Program (AGASP) is a multifacetedcooperative research program designed to determine the jistribution,transport, chemistry, aerosol physics, and radiative effects of the polar-wideair pollution phenomenon known as Arctic haze. The research was conceived,organized, and directed by the National Oceanic and Atmospheric Administration(NOAA), and the Cooperative Institute for Research in Environmental Sciences(CIRES), University of Colorado, Boulder. AGASP has involved participantsfrom the United States, Canada, Norway, Sweden, Federal Republic of Germany,and Denmark and has covered two intensive field study periods in March-April1983 and March-April 1986, and a third is scheduled for March-April 1989.The core field research program consists of airborne measurements tied tosimilar baseline station measurements at Pt. Barrow, Alaska; Alert, NorthwestTerritories; and Ny Alesund, Spitzbergen. The results of the 1983 programwere published in special issues of Geophysical Research Letters (vol. 11,no.5, May 1984) and Atmospheric Environment (Vol.19, no.12, December 1985).The 1986 program results are "in press" in special issues of the Journal ofAtmospheric Chemistry and Atmospheric Environment, both due out in mid-1989.
The program has shown that the winter-spring Arctic atmosphere ispolluted with well-defined layers of anthropogenic gases and aerosols ofEurasian origin. Some of the pollution plumes have been tracked for over10,000 km. The plumes contain excess amounts of C, CH4 , C02 , CO, SO2 , and ahost of inorganic trace species.
Concern has been raised that this massive air pollution in the Arcticcoud be affecting climate by trapping radiation as haze optical depths of 0.75have been measured. The haze also may be depositing toxic elements andacidic species on the ice caps and on the high Arctic tundra.
3

SOUTHERN OCEAN CONDENSATION NUCLEI AND CLIMATE VARIATIONS
J.L. GrasCSIRO Division of Atmospheric Research
PMB 1, MordiallocVic. 3195, Australia
Atmospheric cond-.nsation nucleus concentrations have been determined on aregular basis at Cape Grim, Tasmania since 1977. However, a clearunderstanding of what represents a "baseline" measurement has been elusive.The idea that a "baseline" for CN (and CCN) concentrations exists only in astatistical sense is proposed. Use of the concentration-frequencydistribution to describe the aerosol is suggested, with the distributiongeometric mean a single convenient measure. This approach has been followedwith the Cape Grim CN data obtained from 1977 to 1987 to derive monthlyestimates of "baseline" concentration. These show strong seasonal variationsbut also quite marked variations on an interannual time scale. Bynumerically filtering the monthly data the presence of quasi-periodicoscillations in "baseline" CN concentrations with frequencies similar to thoseobserved in the Southern Oscillation have been revealed. Some association
between the major fluctuations and El-Nino Southern Oscillation perturbationsin the regional circulation is suggested and possible mechanisms discussed.
4
CLOUD CONDENSATION AND AITKEN NUCLEI MEASUREMENTS INBACKGROUND AIR
E.K. BiggCSIROEppingNSW
Australia
A.D. KayeEnvironmental and Medical Sciences
DivisionAEREHarwell
OxfordshireUK
W.J. MegawInstitute for Space and TerrestrialScience and Department of Physics
York University4700 Keele Street
North YorkOntario M3J IP3
Canada
A series of measurements is described which was made at the Cape Grim LowBackground Station in 1985 in which concentrations of CCN and Aitken nucleiwere determined. The samples taken when background air was being sampledcould be determined from the weather situation. In addition however it waspossible to distinguish background samples not only from the lowerconcentration of particles but also from the shape of the curves of CCNconcentration vs supersaturation.
5

AEROSOL CLIMATOLWGY MEASUREMENTS WITH NOLAN-POLLAK COUNTERS
T.C. O'Connor and F.M. McGovernDepartment of Experimental Physics
University CollegeGalway, Ireland
The Nolan-Pollak counter was originally developed in the 1940's foraerosol climatology measurements although its versatility led subsequently tomany other applications in aerosol science. It has been widely used inmanual, automatic and modified forms in many parts of the world to recordambient concentrations of Aitken nuclei. Measurements at Mace Head, Irelandwill be used to discuss its suitability for the purpose. The design,calibration and performance of an automatic counter will be discussed.
Acknowledgement: This work was supported by an Eolas Research Grant.
6
4
MARINE AEROSOLS
James W.Fitzgerald
Naval Research LaboratoryWashington. DC 20375
S INTRODUCTION
SKnowledge of the physical and chemical properties of marine aerosol
particles is important because of the role these particles play in a number of
important atmospheric processes. Marine aerosols affect radiative transfer'and climate directly by scattering and absorbing radiation and indirectly byinfluencing the droplet size distribution and albedo of marine boundary layerclouds. In addition, marine aerosol particles play an important role in themarine portion of the atmospheric sulfur cycle; they affect the performance ofelectro-optical systems since they limit transmission of electromagneticradiation; and they provide the backscatter signal necessary to permitretrieval of wind profiles over the ocean using doppler-lidar wind soundertechniques (Gerber, 1989).
The number, size distribution and composition of marine aerosol particlesvary in time and space in response to a number of different processesincluding long-range transport of continental -ir; aerosol production by thebursting of whitecap bubbles and by homogeneous nucleation involving theoxidation products of precursor gases emitted by the ocean; removal ofparticles by deposition and precipitation scavenging; and aerosoltransformation processes such as coagulation, condensation of low volatilityreaction products (e.g., sulfuric acid), and enhancement of aerosol mass as aresult of S02 -to-sulfate conversion in cloud droplets.
In the last fifteen years a number of excellent review papers on marineaerosols have been published. Junge (1972) presented a remarkably discerningsurvey of our knowledge of the physico-chemistry of aerosols in theundisturbed marine environment. On the basis of available data Jungedeveloped an idealized model of the various components of the undisturbedmarine aerosol. More recently, Podzimek (1980, 1982) reviewed the advances inmarine aerosol research in the decade following Junge's review. Since 1980,considerable gains have been made in our knowledge of the marine aerosol,particularly with regard to the size distribution of submicron aerosols, theconcentrations of the main aerosol constituents in clean marine air, and theprocesses which control the submicron portion of the size distribution.
The purpose of this review is to present an up-to-date description of ourknowledge of the physico-chemical properties of aerosols in clean marine air.with emphasis on the following topics: the total particle concentrations; the
size and volume distributions of particles over the size range 0.006 < r < 50pm; the principal aerosol constituents and their concentrations; sources ofthe marine aerosol; and the dependence of the particle size distribution andsalt loading on wind speed.
TOTAL PARTICLE CONCENTRATIONS
Podzimek (1980), updating an earlier study of Hogan (1976). hassummarized the results of numerous observations of Aitken nucleus
7
KX7

concentrations over the ocean in the form of a map showing the geographicaldistribution of mean Aitken nucleus concentrations over the oceans.Concentrations range from 4000-6000 cm
-3 off the east coasts of North America
and Asia to less than 300 cm-3
over the central regions of the Atlantic,Pacific and Indian Oceans. Hoppel et al. (1989) measured the variation intotal particle concentrations (obtained by integrating the particle sizedistribution between 0.006 and 0.5 pm radius) during a transatlantic cruisefrom Charleston. SC to the Canary Islands. Particle concentrations decreasedfrom 6000 cm-
3 near the coast to a mean of about 200 cm
°3 over the remote
Atlantic in air which had a long history (> 10 da s) over water. The lowesttotal particle concentration observed was 100 cm- . Particles smaller than0.03 pm radius contributed less than 20Z to the total particle concentrationin clean marine air over the subtropical North Atlantic. No correlation wasfound between total particle concentrations and wind speed.
Recent measurements of total particle concentrations have also been madein remote regions of the eastern Pacific Coean. Parungo at al. (1987). usinga GE automatic condensation nucleus counter having good sensitivity as low as
r o10 cm"3, report mean concentrations of about 125 cm
"3 along the Equator at 59S
when winds were from the Southern Hemisphere. The lowest concentration was 60cm
"3. Hoppel and Frick (1989) found the mean concentration of particles
larger than 0.006 pm radius to be 200 cm"3
between Hawaii and Tahiti on acruise from Hawaii to the South Pacific. The lowest average daily totalparticle concentration 70 cm-3 measured near 55*S and 1550 W. Precipitationwas reported the previous day.
Diurnal variations in total particle concentrations over the open oceanshave been reported by several investigators. Heszaros and Vissy (1974) founda noontime maximum in the average diurnal change in the concentration ofAitken particles over the South Atlantic and Indian Oceans. A diurnalvariation in Aitken nucleus concentrations, with a daytime maximum andnighttime minimum, was observed over the Pacific by Parungo at al. (1987) onlywhen the air mass was constant throughout the day. A daytime maximum inAitken particle concentrations implies photochemical production of very smallparticles which may be due to higher daytime photooxidation rates oforganosulfur gases (such as DHS) emitted by the ocean. However. Hoppel at al.(1989) and Hoppel and Frick (1989) found no evidence of a daytime maximum in
the concentration of particles larger than 0.006 pm over the remote Atlanticand Pacific Oceans. This finding may not be inconsistent with a diurnalvariation in Aitken concentrations if the daytime maximum is due to variationsIn the concentration of particles smaller than 0.006 pm. One would expect.however, that, once produced, such small particles would grow to 0.006 pm andlarger. Haaf and Jaenicke (1980) did not find a diurnal variation in totalparticle concentrations over the North Atlantic but did find a pronounced noonmaximum in the concentration of particles smaller than 0.01 pm radius. Bigget al. (1984) found seasonal variations in Aitken particle concentrations withmaximum at the summer solstice and minimum in winter at five remote SouthernHemisphere sites. The variations, which ranged from an order of magnitudedifference at Syowa (690S, 40 E) to a 252 difference at Samoa (140S, 171W),were attributed to variations in the photochemical production of particlesrelated to the availability of solar radiation.
PARTICLE SIZE DISTRIBUTION
Figure 1 is a plot of the aerosol particle size distributions in cleanmarine air, as measured by various investigators in the last decade. Table 1summarizes the location, sampling height and method of measurement for each of
the distributions. The distributions of Exton et al. (1986), Hoppel et al.
ty.

10'10'
- \N
'E 10P
100''
10' £ E 10-10' b f PPSN MI-SS (
6A I& --- DAE 0 E0LAE TIO)EXTON I AL ~ ITEMS ) EXTO T A T 11 60
10-N ' 10-
10' 1i' 1o 10' 1d 10- 10" 10' 10 10RADIUS 0) RADIUS O
Fig. 1. Published measurements of Fig. 2. Particle volume distribu-
the size distribution of aerosol tions corresponding to the size
particles in clean marine air. distributions in Figure 1.
(1989) and de Leeuw (1986) were obtained at wind speeds of 5 m s"1
or less.Swhile the spectrum of Mezaros and Vissy (1974) is a mean over a period when
the average wind speed was 12 m s"1. The distribution of Gras and AyersI (1980) is a geometric mean of measurements made over a period of several
months during which the wind speed ranged from 3 m s"1
to 20 m 5"I .
Data on
the size distribution of particles larger than 10 pm radius are particularlyscarce. It is difficult to determine to what extent the differences in thesize distributions are due to differences in sampling location, to differencesin wind speed (in the case of particles larger than 0.3 pm radius), or to
TASLE I NUMOANT IF TOO SAMPLING LOCATION. SAMPLING AIOGT ASS METHOS IF MEASUREMENT
PIN TIE PARTICLE SIZE Al VOLUME OINTNISUTIIII DIOCUSSEO IN THE TEXT.NIN R INRTA .MPACTN
ElTHOSTA.(16 COCATSIEIIN NIHTO) PAN A SAN ClAN PNONE(
VIPP5L ST AL. IS) SOUTRIC ATLANTIC N0N SlIP LEVEL SIPNTIL M LEONT ANALOE
(1 A74 ADAOCEN ( -IED ANAYSS F ANDTE SAPLES 19
(M .o00, 1 le 16 0
GRDA YEi(il) CP R TEADIUS (um RADUSONIUSER Cm) OL
Fig.S 1.1E Pulihe meaureent of Fig 2.Patcl olm|) sr
the ~ ~ ~ ~ ~ ~ ~ ~ ~ CIE siedsrbto farsl t scr eoding to th size
REPLO ANC! DT ~l~I URN 4 ICTIN IMPOLTIN 11.AVLYVZN)R
199andeLe (1986 o) were obaie at wid ped o.5s-1o es
wh Pil teT spetru ofll MSUDzCaro ATandI V Sy P (1974) Di RNTA aT maovra per~i
odwe
theiIN avrg idspe a 2S-1. (0.he ditibto of Gras aner
(190)isaeomtrceaoft me or a p d of s
m9 d
,4
ithe_.... sizedistributionofpartieslargerthan_10pmradiusareparticularly
It
rz itiuin r u odfeecsi apiglctot ifrne
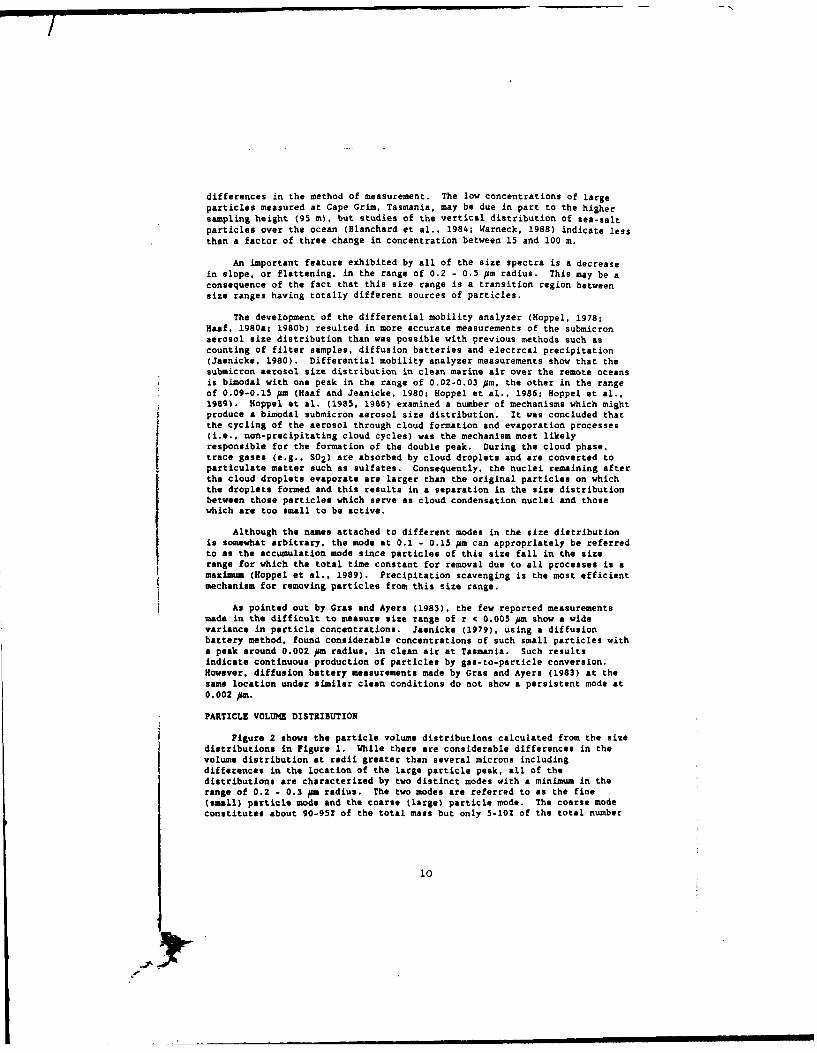
differences in the method of measurement. The low concentrations of largeparticles measured at Cape Grim. Tasmania, may be due in part to the highersampling height (95 m), but studies of the vertical distribution of sea-saltparticles over the ocean (Blanchard et al., 1984; Warneck, 1988) indicate lessthan a factor of three change in concentration between 15 and 100 m.
An important feature exhibited by all of the size spectra is a decreasein slope, or flattening, in the range of 0.2 - 0.5 am radius. This may be aconsequence of the fact that this size range is a transition region betweensize ranges having totally different sources of particles.
The development of the differential mobility analyzer (Hoppel, 1978;Haaf, 1980a; 1980b) resulted in more accurate measurements of the submicronaerosol size distribution than was possible with previous methods such ascounting of filter samples, diffusion batteries and electrcal precipitation(Jaenicke. 1980). Differential mobility analyzer measurements show that thesubmicron aerosol size distribution in clean marine air over the remote oceansis bimodal with one peak in the range of 0.02-0.03 pm, the other in the rangeof 0.09-0.15 jm (Haaf and Jeanicke, 1980; Hoppel et al., 1986; Hoppel et al.,1989). Hoppel at al. (1985, 1986) examined a number of mechanisms which mightproduce a bimodal submicron aerosol size distribution. It was concluded thatthe cycling of the aerosol through cloud formation and evaporation processes(i.e., non-precipitating cloud cycles) was the mechanism most likelyresponsible for the formation of the double peak. During the cloud phase,trace gases (e.g., S02) are absorbed by cloud droplets and are converted toparticulate matter such as sulfates. Consequently, the nuclei remaining afterthe cloud droplets evaporate are larger than the original particles on whichthe droplets formed and this results in a separation in the size distributionbetween those particles which serve as cloud condensation nuclei and thosewhich are too small to be active.
Although the names attached to different modes in the size distributionis somewhat arbitrary, the mode at 0.1 - 0.15 #m can appropriately be referredto as the accumulation mode since particles of this size fall in the sizerange for which the total time constant for removal due to all processes is amaximum (Hoppel et al., 1989). Precipitation scavenging is the most efficientmechanism for removing particles from this size range.
As pointed out by Gras and Ayers (1983), the few reported measurementsmade in the difficult to measure size range of r < 0.005 pm show a widevariance in particle concentrations. Jaenicke (1979), using a diffusionbattery method, found considerable concentrations of such small particles witha peak around 0.002 jm radius, in clean air at Tasmania. Such resultsindicate continuous production of particles by gas-to-particle conversion.However, diffusion battery measurements made by Gras and Ayers (1983) at thesame location under similar clean conditions do not show a persistent mode at0.002 /P.
PARTICLE VOLUME DISTRIBUTION
Figure 2 shows the particle volume distributions calculated from the sizedistributions in Figure 1. While there are considerable differences in thevolume distribution at radii greater than several microns includingdifferences in the location of the large particle peak, all of thedistributions are characterized by two distinct modes with a minimum in therange of 0.2 - 0.3 jim radius. The two modes are referred to as the fine(small) particle mode and the coarse (large) particle mode. The coarse modeconstitutes about 90-952 of the total mass but only 5-10Z of the total number
10
A- i II I I••I I II•imll

of particles. The coarse particle mass in clean marine air is comprisedmainly of sea salt and shows a strong dependence on wind speed.
COMPOSITION AND SOURCES OF THE MARINE AEROSOL
The principal constituents of the marine aerosol are sea salt, non-sea-salt sulfate, mineral dust, and, generally to a lesser extent, nitrates. Non-sea-salt sulfates and nitrates have both a continental and marine source.Mineral dust is transported from semi-arid and desert regions and is a highlyvariable component of the coarse particle mode. The concentration of sea saltdepends primarily on wind speed and can range from about 2 jig m
3 to over 100
#g m-3 . The primary marine sources of NOx and hence nitrate are downmixingfrom the stratosphere and production by lightning (Crutzen and Gidel, 1983).Table 2 gives the concentrations of the aerosol constituents in clean marineair over the remote oceans, as measured by various investigators. Althoughsea salt does not have a continental source and does not, strictly speakinghave a clean marine or background concentration, it is included in Table 2 for
TAL.E 2 CONCENTRATIONS ( I/.$
) OF THE PRINCIPAL AEROSOL CONSTITUENTS IN CLEAN MARINE AIR.
MASS
CONSTITUENT CONCENTRATION LOCATION REFERENCE
SEA SALT 2.6 - 5.O EQUATORIAL AND TROPICAL PACIFIC RUENONCK CT AL. (195e)
GALAPAGOS TO HAWAII
1, - 35.0 N. ATLANTIC (NO N, tiew) LOVETT (1IS)u c to ./.
1.2 - 6o.0 S. ATLANTIC (4U-NOS. 40.00W) LEPPLE ET AL. (IOS)
U < to ./.
2.0 - 2o.0 CAPE GRIM, TASMANIA GRAS AND AYERS (IONS)u < to ./.
0.-00 RAOOST ST A 1101400W
NON-ISA- ALT . .- .I . AST EQUATORIAL PACIFIC PARUN O IT AL. (1987)
SULFATE (5S O,lOO'
0.A - O0.e EASTERA TROPICAL PACIFIC RANEDONCK ST AL. (19NN)
O.25. PANAMA TO TAHITI ¥AENMAUT IT AL. (12l3)
0.3S INDIAN OCEAN SAVOIE Er AL. (1907)
CLEAN S. HEMISPHERE AIR
MINERAL DUST .1EQUATORIAL AND TROPICAL PACIFIC RAEMOONCK IT AL. (1984)
GALAPAGOS TO HAWAII
0G07 GALAPAGOS TO TAHITI MAENHAUT Er AL. (IONS)
O.2 PACIFIC MARINE GOUNOARY LAYER PATTERSON ET AL. (1980)
(ISeN TO ASNS)
O.27 INDIAN OCEAN. S. HENISPNENE AIR SAVOIE ET AL. (1007)
0.0-4 41..0 CLEAN NORTN PACIFIC AIR AEMATSU ST AL. (120E)
O.os - 0.1 TROPICAL CENTRAL PACIFIC UEWATSU 9T AL. (1iN)
O.62 - 8.O CENTRAL ANO NORTHERN N. ATLANTIC PROSPERO (IN7O)
NITRATE O.16 INDIAN OCEAN, S. NEMISPERE AIR SAVOIS ST AL. (It*T)
o.1 - O.2 EAST EQUATORIAL PACIFIC PARUNGO ST AL. (lIT)
* 50001.1 VALUES ARE AOITHETIC [ANS EXCEPT AS NOTED
S RANGE OP N&N VALUES AT SEVERAL ISLAND LOCATIONES
* aOSNETRIC NEAN
11

the purpose of comparing the relative contribution of the various constituentsto the total aerosol mass in clean marine air. The concentrations of sea saltgiven are for wind speeds less than 10 m 9
-1. Sea salt concentrations can be
as high as 100 jig m- at wind speeds in excess of 20 m s- (Exton et al.,1986; Lovett, 1978).
Non-sea-salt SulfateThe concentration of non-sea-salt sulfate decreases markedly from coastal
regions of the continents to the remote areas of the oceans. Parungo et al.
(1987) found that non-sea-salt sulfate concentrations were almost an order ofmagnitude lower over the equatorial Pacific than they were off the west coastof the United States. As reported by Parungo et al. (1986, 1987), non-sea-salt sulfate concentrations over the remote oceans have been found to increasein regions of ocean upwelling and can at times exceed the concentrations ofsea-salt sulfate.
Numerous studies have shown that the fine particle mode (r < 0.3 Am) inclean marine air is composed predominantly of non-sea-salt sulfate.Examination of individual particles by means of electron microscopy (Meszarosand Vissy. 1974: Gras and Ayers. 1983; Parungo et al., 1987) has shown that ahigh percentage of the fine-mode particles are morphologically similar toammonium sulfate. Small amounts of sulfuric acid have also been detected.
Aerosol volatility measurements have also shown that the majority ofsmall particles are composed of non-sea-salt sulfate. Clarke et al. (1987)measured the change in the particle size distribution in clean Pacific air andfound that only about 1Z of the fine-mode particles survived heating totemperatures that would volatilize everything but sea salt. Approximately 401of the particles disappeared at temperatures that would volatilize sulfuricacid particles, the remaining 601 having a thermal response like ammoniumsulfatelbisulfate. Hoppel and Frick (1989) also measured the volatility ofsubmicron particles (r < 0.5 Am radius) over the remote Pacific Ocean andfound that, typically, only a few percent of the particles were involatile.However, measurements made on a day with very clean air (total particle countof 70 cm-
3), following a couple of days of stormy conditions, showed that 40Z
of the particles smaller than 0.2 im radius were involatile and presumablycomposed of sea salt. Thus, it appears that enough small salt particles canbe produced during high winds to make a significant contribution to the fine-particle mode in very clean background air.
A question of major importance is the origin of the non-sea-salt sulfatein clean marine air and the relative contributions from long-range transportof continental air and in situ production over the ocean. The evidence for asignificant marine source of non-sea-salt sulfate is substantial and includesthe following: (1) the presence of methanesulfonic acid (which has nocontinental source) in marine aerosol particles. (2) higher concentrations ofnon-sea-salt sulfate in ocean upwelling regions, (3) a sufficient sourcestrength of reduced sulfur gases from the ocean to sustain the observedconcentrations of excess sulfate against removal processes, (4) an apparentsource of small particles which maintains the small particle concentrationsagainst coagulational decay and (5) the existence of a double peak in thesubmicron aerosol size distribution.
The photooxidation of dimethyl sulfide (DMS) gas, which is produced bybiological activity in the ocean and released into the atmosphere, is believedto be the most important source of marine background concentrations of non-ava-salt sulfate (Andreas and Raemdonck, 1983; Cline and Bates, 1983; Bigg etal., 1984). In the atmosphere, DMS is rapidly oxidized by the OH radical toSO2 and methanesulfonic acid (MSA). the proportion of SO2 being as much as 80Z
12
A
t+

at the low NO, levels typical of the remote marine atmosphere (Tyndall et al..1986). SO2. in turn, is photooxidized to H2SO4 by reaction with OH and otherfree radicals (Eggleton and Cox. 1978).
Sulfate is formed by gas-to-particle conversion involving the oxidationproducts of DMS. The principal gas-to-particle conversion mechanisms are:(1) Formation of new particles by heteromolecular homogeneous nucleation inthe H2SO4-MSA-water system, with possible involvement of other trace gases
such as ammonia (2) Condensation of H2S04 and MSA on newly-formed and existingparticles and (3) Aqueous-phase oxidation of S02 to sulfate in cloud droplets.All three of these processes influence the submicron aerosol size distributionover the remote oceans (Fitzgerald and Hoppel. 1988; Hoppel, 1988).
The relative importance of the different gas-to-particle conversionpathways as a source of the non-sea-salt sulfate in marine aerosols is not
fully resolved. Predicted gas-phase H2504 concentrations equal to only 10Z ofthe background sulfates (Toon et al., 1987, Kritz, 1983) and MSA to non-sea-sat sulfate ratios less than 0.1 (Saltzman et al., 1983. 1985) tend to argue
against homogeneous oxidation of S02 to H2S04 and condensation of MSA andH2$O4 as main pathways from DMS to aerosol sulfate. Rather. S02-to-sulfateconversion is clouds may be the most important pathway. It should be noted.however, that concentrations of MSA and H2SO4 in marine aerosols may be lowbecause of reaction of H2SO4 with ammonia to form ammonium sulfate and byoxidation of MSA by OH in aerosols and cloud droplets (Saltzman et al., 1986).It is further noted that significant amounts of H2S04 in marine aerosols havebeen reported by Clarke et al. (1987).
Sea SaltSea salt is the principal constituent of the coarse-particle mode except
during episodes of continental dust transport. The production of sea-saltaerosol is due to the agitation of the sea surface by the wind. Wind stresson the ocean surface is a generator of air bubbles which later burst,producing both film drops and jet drops (Blanchard and Woodcock. 1957;Blanchard, 1963). Bubbles are most numerous in the whitecaps associated withbreaking waves, where they are formed by the entrainment of air into the
surface water by breaking wave motion. Whitecaps begin to appear at windspeeds of about 3 m 51
. At wind speeds of 10 m
, approximately lZ of the
sea is covered by whitecaps and at 15 m s-1
4Z of the surface is covered(Monahan, 1971; Toba and Chaen, 1973). Each bursting bubble produces between1 an 10 jet drops and up to several hundred smaller film drops, depending onthe size of the bubble. After generation, the drops rapidly equilibrate tothe ambient relative humidity and become either sea-salt particles or sea-saltsolution droplets. Most film and jet drops have radii < 10 #m and most filmdrops are smaller than 1 ism radius (Woolf et al.. 1988).
In addition to indirect production of sea-salt particles by burstingbubbles, there is also direct production of spume drops resulting from themechanical disruption of wave crests by the wind. Spume drop formationbecomes a significant contributor of large (> 10 pm radius) spray droplets atwind speeds in excess of 10 m s
-1 (Wang and Street. 1978; Monahan et al..
1986). Spume drop formation has been invoked to explain the 'tail' on thelarge droplet end of aerosol spectra measured during the 1978 JASIN Experiment(Monahan et al., 1983).
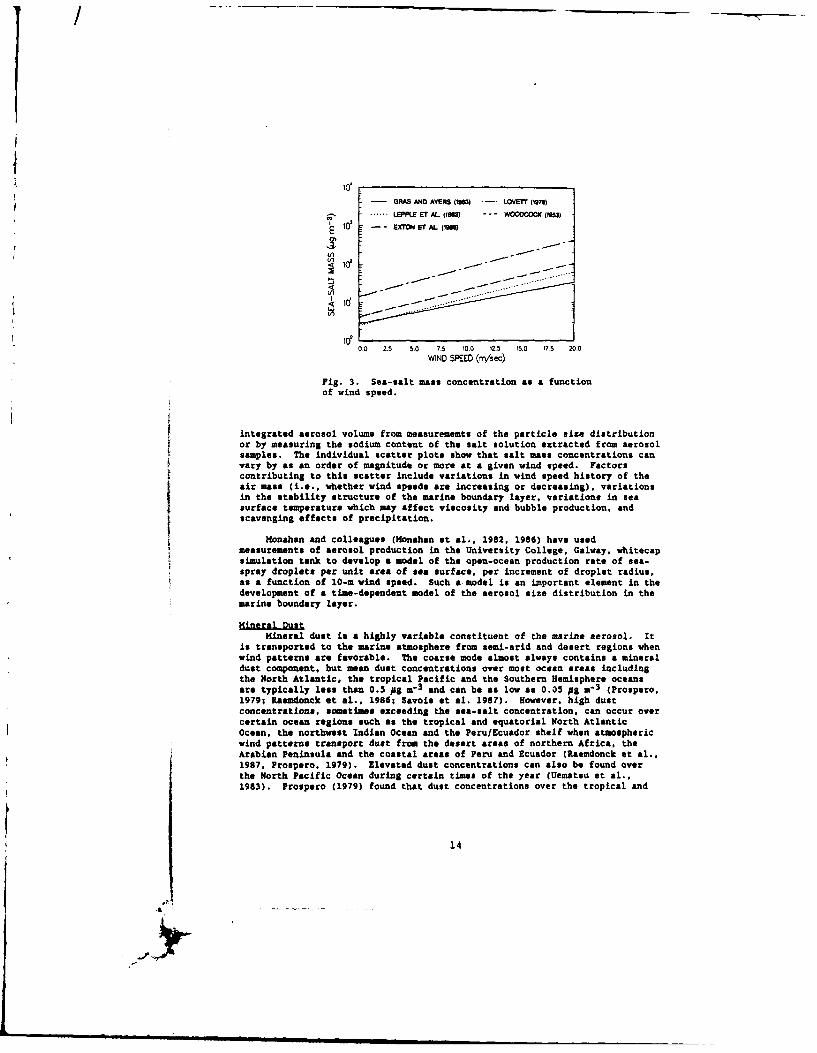
Figure 3 shows the dependence of sea-salt aerosol mass concentration onwind speed, as reported by several investigators. Each curve is a linearleast squares fit of the expression ln9 - b + aU, where 0 is the salt massconcentration and U is wind speed, to scatter plots of sea-salt mass versuswind speed. Sea-salt concentrations are determined either by computing the
13
I
- GRAS AND AYERS pso) -. LOVETr (9s). ...... LEPP.E E1 AL (15) --- WOOCOCK (19
EXTON ET AL (1005~10z -- -ST U_ -
.......~. .
0,0 2.5 5.0 7.5 10.0 12.5 15.0 17.5 20.0
WIND SPEED (m/sec)
Fig. 3. Sea-salt mass concentration as a functionof wind speed.
integrated aerosol volume from measurememts of the particle size distribution
or by measuring the sodium content of the salt solution extracted from aerosolsamples. The individual scatter plots show that salt mass concentrations canvary by as an order of magnitude or more at a given wind speed. Factors
contributing to this scatter include variations in wind speed history of the
air mass (i.e., whether wind speeds are increasing or decreasing), variationsin the stability structure of the marine boundary layer, variations in seasurface temperature which may affect viscosity and bubble production, andscavenging effects of precipitation.
Monahan and colleagues (Honahan at al., 1982, 1986) have used
measurements of aerosol production in the University College, Galway, whitecapsimulation tank to develop a model of the open-ocean production rate of sea-
spray droplets per unit area of sea surface, per increment of droplet radius,
as a function of 10-m wind speed. Such a model is an important element in thedevelopment of a time-dependent model of the aerosol size distribution in themarine boundary layer.
Mineral Dust
Mineral dust is a highly variable constituent of the marine aerosol. Itis transported to the marine atmosphere from semi-arid and desert regions when
wind patterns are favorable. The coarse mode almost always contains a mineralduet component, but mean dust concentrations over most ocean areas including
the North Atlantic, the tropical Pacific and the Southern Hemisphere oceansare typically less than 0.5 pg m-
3 and can be as low as 0.05 pg m
-3 (Prospero,
1979; Ramadonck at al., 1986; Savoie et al. 1987). However, high duet
concentrations, sometimes exceeding the sea-salt concentration, can occur over
certain ocean regions such as the tropical and equatorial North AtlanticOcean, the northwest Indian Ocean and the PerufEcuador shelf when atmospheric
wind patterns transport dust from the desert areas of northern Africa, the
Arabian Peninsula and the coastal areas of Peru and Ecuador (Raemdonck et al.,
1987, Prospero, 1979). Elevated dust concentrations can also be found overthe North Pacific Ocean during certain times of the year (Uematsu et al.,1983). Prospero (1979) found that dust concentrations over the tropical and
14
-- - - -- .5 .- - --rms m m - m mm m m

equatorial North Atlantic can vary by a factor of 100 depending on the originof the air.
In clean, remote ocean areas. 70Z of the mass of mineral dust isassociated with particles larger than 1 pm radius (Raemdonck et al., 1986) anda large fraction of the dust component is found to be internally mixed withsea-salt particles (Raemdonck et al., 1986; Andreae et al., 1986). Andreae etal. (1986) suggest that the internal mixing could be produced by processes inclouds, including coagulation of droplets formed on the two types of particlesandlor the scavenging of the crustal particles by cloud droplets.
REFERENCES
Andreae. M.0. and H. Raemdonck, 1983: Dimethyl sulfide in the surface oceanand the marine atmosphere: A global view. Science. M21, 744-747.
Andreae, H.O. et al.,1985 Dimethyl sulfide in the marine atmosphere.Geonhys. Res.. IQ. 12891-12900.
Andreae. M.O., R.J. Charlson, F. Bruynseels, H. Storms, R. Van Grieken, andW. Maenhaut, 1986: Internal mixture of sea salt, silicates, and excesssulfate in marine aerosols. Scinc, 232. 1620-1623.
Bigg, E.K., J.L. Gras. and C. Evans. 1984: Origin of Aitken particles inremote regions of the Southern Hemisphere. J. Atmos. Chem., 1. 203-214.
Blanchard, D.C., and A.H. Woodcock, 1957: Bubble formation and modificationin the sea and its meteorological significance. Tellus, 9, 145-158.
Blanchard, D.C., A. H. Woodcock, and R.J. Cipriano. 1984: The verticaldistribution of the concentration of sea salt in the marine atmosphere nearHawaii. Tellus, 2Ul, 118-125.
Clarke, A.D., N.C. Ahlquist, and D.S. Covert. 1987: The Pacific marineaerosol: Evidence for natural acid sulfates. J. Geonhvs. Res.. 9U. 4179-4190.
Cline. J.D.. and T.S. Bates, 19831 Dimethyl sulfide in the equatorial PacificOcean: A natural source of sulfur to the atmosphere. Chem. Phys. Lett.,U.h0 463-466.
Crutzen P.J., and L.T. Gidel. 1983: A two-dimensional photochemical model ofthe atmosphere, 2: The tropospheric budgets of the anthropogenicchlorocarbons, CO, C04. CH3Cl and the effect of various NOx sources ontropospheric ozone. J. Ceonhls. Res., IA, 6641-6661.
Eggleton. A.l.J.. and R.A. Cox. 19761 Homogeneous oxidation of sulfurcompounds in the atmosphere. A., 12, 227-230.
Exton, N.J.. J. Latham, P.M. Park. M.H. Smith. and R.R. Allan, 19861 Theproduction and dispersal of maritime aerosol. In, Oceanic Whitecans, E.C.Monahan and G. Mac Niocaill (Edo.). D. Reidel Publishing Co.. 175-193.
Fitzgerald, J.W.. and V.A. Hoppel, 1986 Numerical simulation of theevolution of the particle size distribution in the marine boundary layer.In, Atmospheric Aerosols and Nucleation, Lecture Notes in Physics Series,)09 Edited by P.E. Wagner and G. Vali, Springer-Verlag. pp. 245-248.
15

Gerber. H., 1989: Probability of retrieving wind profiles in the marineboundary with a satellite laser wind sounder. (Submitted for publication).
Gras J.L., and G.P. Ayers, 1983: Marine aerosol at southern mid-latitudes.J. Ge pohys. Re., _U, 10661-10666.
Haaf, W., 1980a: Accurate measurements of aerosol size distribution - I.Theory of a plate condenser for bipolar mobility analysis. J. Aerosol"., 11, 189-200.
Haaf, W., 1980b: Accurate measurements of aerosol size distribution - II.Construction of a new plate condenser electric mobility analyzer and firstresults. J. Aerosol Sci., II, 201-212.
Haaf, W., and R. Jaenicke, 1980: Results of improved size distributionmeasurements in the Aitken range of atmospheric aerosols. J. Aerosol Sci..11, 321-330.
Hogan, A.W., 1976: Physical properties of the atmospheric aerosol. Ph.D.Thesis, Dept. of Geophysics, Hokkaido University, Sapporo, Japan, April1976.
Hoppel. W.A., 1978: Determination of the aerosol size distribution of thecharged fraction of aerosols. J. Aerosol Sci., 9, 41-54.
Hoppel, W.A., J.W. Fitzgerald, and R.E. Larson, 1985: Aerosol sizedistributions in air masses advecting off the East Coast of the UnitedStates. J. Geoohys. Res., 2Q. 2365-2379.
Hoppel, W.A., G.M. Frick, and R.E. Larson, 1986: Effect of nonprecipitating
clouds on the aerosol size distribution in the marine boundary layer.Ge phys. Res. Lett., U3, 125-128.
Hoppel. W.A., 1988: The role of non-precipitating cloud cycles and gas-to-particle conversion in the maintenance of the submicron aerosol sizedistribution over the tropical oceans. In, Aerosols and Climate, Edited byP.V. Hobbs and H.P. McCormick, A. Deepak Publishing, Hampton, VA, pp. 9-19.
Hoppel, W.A., J.W. Fitzgerald, G.M. Frick. R.E. Larson, and E.J. Mack, 1989:
Atmospheric aerosol size distributions and optical properties in the marineboundary layer over the Atlantic Ocean. NRL Report 9188, 75 pp.
Hoppel, W.A., and G.M. Frick, 1989: Submicron aerosol size distributionsmeasured over the tropical and South Pacific. (Submitted for publication).
Jaenicke, R., 1978: Aitken particle size distribution in the Atlantic
northeast trade winds. 'Meteor* Forsch.-Ereebnisse, 11. 1-9.
Jaenicke, R., 1979: Measurements of Aitken nuclei in extremely clean air inTasmania (Australia). J.Aerosol Sci., IQ, 205-207.
Junge, C.E., 1972: Our knowledge of the physico-chemistry of aerosols in theundisturbed marine environment. J. Geophvs. Res., 7. 5183-5200.
de Leeuv, G., 1986t Vertical profiles of giant particles close above the sea
surface. Tellus, 38J, 51-61.
16
. . . mm "= -- 'm 9 i ~ md immmi im i a
a

Lepple, F.K., D.S. Bressan, J.B. Hoover, and R.E. Larson, 1983: Sea saltaerosol, atmospheric radon and meteorological observations in the westerrSouth Atlantic Ocean (February 1981). NRL Memorandum Report 5153, 63pp.
Lovett, R.F., 1978: Quantitative measurement of airborne sea-sait in theNorth Atlantic. Tellus, 30, 358-364.
Maenhaut, W., H. Raemdonck, A. Selen. R. van Grieken, and J.W. Winchester,1983: Characterization of the atmospheric aerosol over the easterrequatorial Pacific. J. Geophvs. Res., JA, 5353-5364.
Meszaros, A., and K. Vissy, 1974; Concentration. size distribution andchemical nature of atmospheric aerosol particles in remote ocean areas. .Aerosol Sci.. 1, 101-109.
Monahan, E.C., 1971: Oceanic whitecaps. J. Phys. Oceanogr., j, 139-144.
Monahan, E.C., K.L. Davidson. and D.E. Spiel. 1982: Whitecap aerosolproductivity deduced from simulation tank experiments. J. Geoohys.iRs.,87. 8898-8904.
Monahan. E.C., C.W. Fairall, K.L. Davidson, and P. Jones-Boyle, 1983:Observed inter-relationships amongst bim-elevation winds, oceanicwhitecaps, and marine aerosols. Quart. J. Roy. Meteor. $2Q., JQ,, 379--392.
Monahan, E.C., D.E. Spiel, and K.L. Davidson, 1986: A model of marine aerosolgeneration via whitecaps and wave disruption. In, Oceanic Whitecaps, F.C.Monahan and G. Mac Niocaill (Eds.), D. Reidel Publishing co., 167-174.
Parungo. F.P., C.T. Nagamoto, 3. Rosinski, and P.L. Haagenson, 1986: A studof marine aerosols over the Pacific Ocean. J. Atmos. Chem. A , 199-226.
Parungo, F.P., C T. Nagamoto, R. Madel, J. Rosinski, and P.L. Haagenson, 1987:Marine aerosols in Pacific upwelling regions. J. Aerosol Sci., 18, 277-290.
Patterson, E.M., C.S. Kiang, A.C. Delany, A.F. Wartburg, A.C.D. Leslie, andB.J. Huebert. 1980: Global measurements of aerosols in remote continentaland marine regions% Concentrations, size distributions, and opticalproperties. J. Geophvs. Res., U, 7361-7376.
Podzimek, J., 1980: Advances in marine aerosol research. J. Rech._Atmoj.,14. 35-61.
Podzimek, J., 1982: Marine aerosol research. QIdoiais, 8j, 179-199.
Prospero. J.M., 1979: Mineral and sea salt aerosol concentrations in variousocean regions. J. Geophvs. Res., J4, 725-731.
Raemdonck, H., W. Maenhaut. and M.O. Andreae. 1986: Chemistry of marineaerosols over the tropical and equatorial Pacific. J. Geoohvs. Res., 91,8623-6636.
Saltzman, E.S., D.L. Savoie, R.G. Zika. and J.M. Prospero, 1983:Metbanesulfonic acid in the marine atmosphere. J. Geophy.. Res.,10897-10902.
17
Saltzman, E.S., D.L. Savoie, J.,. Prospero. and R.G. Zike. 1985z Atmosphericmethanesulfonic acid and non-sea-salt sulfate at Fanning and AmericanSamoa. Geophys. Res. Lett., 12. 437-440.
Saltzman. 1.S., D.L. Savois, J.. Prospero, and R.G. Zika, 19861Methanesulfonic acid and non-sea-salt sulfate in Pacific airt Regional andseasonal variations. J. Atmos. Chem., _k, 227-240.
Savoie, D.L., J.H. Prospero. and R.T. Nees, 1987: Nitrate, non-sea-saltsulfate, and mineral aerosol over the northwestern Indian Ocean. ,.eonhvs. Res., 2, 933-942.
Toba. Y.. and H. Chaen, 1973: Quantitative expression of the breaking of windwaves on the sea surface. Record. Oceanoer. Works Janan, .j, 1-11.
Toon, O.B., J.F. Kasting, R.P. Turco, and H.S. Liu, 1987: The sulfur cycle inthe marine atmosphere. J. Geonhys. Res. 2., 943-963.
Tyndall. G.S., J.P. Burrows. W. Schneider, and G.K. Noortgat. 1986: Ratecoefficient for the reaction between NO3 radicals and dlmethylsulfide.Chem. Phys. Lett.. Ia0.. 463-466.
Uematsu, M., R.A. Duce, J.H. Prospero, L. Chen. J.T. Merrill, and R.L.McDonald, 1983: Transport of mineral aerosol from Asia over the northPacific Ocean. J. Geophvs. Res., U. 5343-5352.
Wang, C.S., and ? L. Street. 1978: Measurements of spray at an air-waterinterface. Dyn. Atmos Oceans, Z. 141-152.
Warneck, P., 1988: Chemistry of the Natural Atmosphere. InternationalGeophysics Series. Vol. 41, Academic Press, New York, 753 pp.
Woolf, D.K., E.C. Honahan, and D.E. SPiel, 1988: Quantification of the marineaerosol produced by whitecaps. Prenrint. Seventh Conf. on Ocean-Atmosohere
Interaction, Amer. Meteor. Soc.. 182-185.
18
p
., -'
MARINE AEROSOLS GENERATED FROM BURSTING AIR BUBBLES
Jin WuAir-Sea Interaction Laboratory
University of DelawareLewes, Delaware 19958, USA
Marine aerosols are generated by bursting air bubbles at the sea surface;those produced through the fragmentation of film cap are film drops, and thosethrough the break up of a water jet formed by the collapse of bubble cavityare jet drops (Blanchard 1963). These drops are associated with the cloudformation, air-sea exchanges, sea-surface enrichment, as well as ocean-engineering practices. Consequently, there have been many attempts inquantifying productions of these drops. The observation on film drops,because of their vastness in number and smallness in size, is especiallydifficult. Two successful experiments, however, were conducted recently overthe still water surface with artificially produced bubbles (Resch et al. 1986;Blanchard and Syzdek 1988). Their results are herewith reviewed and found tobe highly complimentary; Resch et al. covered the largest size possible downto about 8 pn in diameter, and Blanchard and Syzdek extended from there to say0.01 pm. Excluding the peculiar production peak observed in the latter, bothsets of data are found to follow very closely the same power law, heircombination provides the total production function: nf = 1.07 D2 "1 where nfis the number of film drops produced by their parent bubble having thediameter D (m). The production of jet drops was studied earlier byKientzler et al. (1954) and summarized by Blanchard (1983). Their data onthe number of jet drops produced by parent bubbles were parameterized by Wu(1988b) as: nj = 7 exp(-D/3). In the meantime, the bubble concentration atthe sea surface was proposed by Wu (1988a) as: No = 57 U3 -5 D- 4, where U10
10expressed in ms- 1 is the wind velocity measured at 10 m above the mean seasurface and D is again expressed in nu. Combining all these results, theproduction of marine aerosols under various wind velocities are estimated;they consist mainly of jet drops.
References
Blanchard, D.C., 1963, Prog. Oceanogr. 1, 71-102.Blanchard, D.C., 1983, in "Air-Sea Exchange of Gases and Particles" P.S. Lissand W. G.N. Slinn, eds. D. Reidel, 407-454.Kientzler, C.F., A.B. Arons, D.C. Blanchard and A.H. Woodcock,Tellus 6, 1-7.
Resch, F.J., S.J. Darrozes and G.M. Afeti, 1986, J. Geophys. Res.91, 1019-1029.
Wu, Jin, 1988a, J. Geophys. Res. 93, 587-590.Wu, Jin, 1988B, Tellus (to appear).
Acknowledgement: This project is supported by the Ocean/Atmospheric/PolarEnvironments Program, Office of Naval Research under ContractN00014-87-K-0557.
19

SUMERTIME AEROSOL MEASUREMENTS IN THE ROSS SEA REGIONOF ANTARCTICA
M.J. Harvey, I.S. Lechner, G.W. Fisher and P. IsaacNew Zealand Meteorological Service
P.O. Box 722, WellingtonNew Zealand
Measurements of atmospheric aerosols have been made in the RossDependency, Antarctica in the 1986-87 and 1988-89 summer field seasons. Thestudy is part of a N.Z. Meteorological Service programme which aims tocharacterize the physics and chemistry of atmospheric particulate mattez- inthe S.W. Pacific at sites remote from anthropogenic influences.
The results presented will show size distributions 0.1 - 3.0 Lm diadetermined by a single particle optical counter, C.N. concentrations andchemical composition determined by both X-ray emission analysis of individualparticles (TEM/EDAX) and bulk filtration. Data collected during a three weekstudy on Bowers Piedmont Glacier in November 1988 showed particleconcentration (0.1 - 3.0 Lm dia) to range between 25 - 50 ml- anddistributions to be bimodal (with large particle mode of about . jm dia).Similar distributions of particles were observed at three other sites in1986-87. Initial examination by EDAX shows most sub-&m diameter particles tobe sulphur species.
Some comparisons will be made between this data, collected at the surfaceand measurements made in the free troposphere between 1.5 oN (Tarawa) and46 OS (Invercargill, N.Z.) from an aircraft which has been instrumented byN.Z. Met. Service.
20

PHYSICAL CHARACTERISTICS OF THE AMBIENT AEROSOL AT MACE HEAD
S.G. Jennings, C.D. O'Dowd, T.C. O'Connor, F.M. McGovernDepartment of Experimental Physics
University CollegeGalway, Ireland
Measurements of the ambient aerosol number and particle size distributionwere made at Mace Head, on the west coast of Ireland, to obtain the physicalcharacteristics of particles in the maritime air from the North Atlantic oceanand in airmasses from the continent of Europe. The aerosol particle sizinginstrumentation, based on optical scattering counters, had a continuousmeasurement capability over a radius range of 0.045 to 1.5 micrometres withautomated data handling down to 2 Hz. This was supplemented by manual andautomatic Nolan-Pollak Aitken nuclei counters. Field measurements from late1987 to date are presented on particle number, size, mass and surfacedistributions.
The measurements show a reduction of between two or three orders inmagnitude of these aerosol parameters when the wind is from a W or SWdirection (that is for a maritime air mass) as compared to when the aerosol isof continental European origin from a predominantly E or SE direction. Curvefitting of the particle size data for the prevailing SW airmass at Mace Headindicated that in general there were three log-normal modes present. Thesmaller mode possessed geometric mean radius rg of between 0.07-0.08 Pm andgeometric standard deviation ag of about 1.30; the second mode possessed rand ar values of about 0.17 wm and 1.1 whilst the third mode was characterifedby a &eOmetric mean radius of about 0.3 m and geometric standard deviation ofabout 1.9. Aerosol mass loadin s varied from 10.5 ig m- 3 (for W directionair trajectory) up to 48.7 Ag m- for the E - SE wind sector of anthropogenicsource. The mass measurements were complemented by Aitken nucleusmeasurements at the site which showed that the lowest particle numberconcentration counts (less than 100 cm-3 ) originated from the W directionwhilst the highest particle concentration (greater than 104 cm-3 ) were fromthe SE direction.
Acknowledgement: This work was partially supported by the European ResearchOffice, Inndon, Contract DAJA45-87-C-0016, and an Eolas research grant.
21
4.4'

/
NORTH ATLANTIC AEROSOLBACKGROUND CONCENTRATIONS MEASURED AT A HEBRIDEAN COASTAL SITE
M.H. Smith, P.M. Park and I.E. ConsterdinePure and Applied Physics Department
UMIST, Manchester M60 1QD, UK
At the beginning of a series of field observations in the Outer Hebridesduring August 1986, there was a period of several days when the wind speedremained below 7m/s, which contrasted dramatically with the earlier Springobservations with wind speeds gusting to 50 m/s. During this calm period,there was little or no whitecapping, beyond the surf zone, and very lowparticle counts were recorded for all measured sizes (radii from 0.09 to23.5 pm). These data provide estimates of the very low wind speed backgroundparticle counts characteristic of the North Atlantic environment and, also,yield information on particle loss rates. The background count previouslyobtained by extrapolating the concentration/wind speed relationship to zerowind speed was considerably higher; this was probably due to the short timesspent at lower wind speeds being insufficient to permit the particleconcentration to reach its equilibrium level.
When periods of heavy precipitation and continental influence are removedfrom these data, there was generally a steady decline in aerosol concentrationthroughout this episode for particles from about 0.25 to 16 jim radius. Theconcentration of the largest particles, 16 c r < 23.5 An, was almost uniformlyzero throughout, with only the occasional particle recorded. For smallerparticles, no discernible trend could be established suggesting either verylow loss rates or, more likely, continuing production from sources other thanthe sea surface.
Mechanisms of particle loss including sedimentation, coagulation and drydeposition were considered and the observed time constants were compared withestimates derived from simple assessments of these processes. An elementarymodel of particle loss by dry deposition to the water surface is adequate toexplain the observed time constants and, for most particle sizes turbulentdeposition dominates gravitational sedimentation.
22

PHYSICAL AND CHEMICAL PARAMETERS OF MARINE BACKGROUNDAND SAHARA AEROSOLS OVER THE NORTH ATLANTIC OCEAN
V. Dreiling, R. Maser and L. SchutzInstitute of Meteorology
University of MainzSaarstr. 21, D-6500 Mainz, Germany
During the last 20 years, several aerosol measuring campaigns have beencarried out on board of research vessels in the Eastern North Atlantic andduring field expeditions at various West African locations. The samples weretaken at different seasons of the year. Number and mass concentrations aswell as size distributions have been determined with various aerosol samplingand measuring systems. Two major aerosol bodies are likely because there aremoderate variations of the concentration levels for major parts of the aerosolsize distribution, and a similar shape of size distribution as well as arather constant relative elemental composition. Therefore, marine backgroundand Sahara aerosols can be described with typical distribution andconcentration parameters.
23
i II - Il .- I.. ... . II .I!I-

MEASUREMENTS OF AEROSOL CONCENTRATION AND DISTRIBUTION ATHELGOLAND ISLAND
P. Brand and J. GebbartGesellschaft fur Strahlen- und Umweltforschung
Paul -Ehrlich-Strasse 206000 Frankfurt/Main
Federal Republic of Germany
M. Below and B. GeorgiNiedersachsisches Institut fur Radiookologie
Herrenhauserstrasse 23000 Hannover
Federal Republic of Germany
J. HeyderGSF-Proj ekt Inhalation
8042 NeuherbergFederal Republic of Germany
Ei, iro mental aerosols cover a size range from a few nanometers up tose' ,ral micrometers. For particle sizing of such aerosols different sensorsbased on different principles of operation have to be applied. In thepresent study a Differential-Mobility-Particle-Sizer (DMPS), a laser aerosolspectrometer model LAS-K and a white light optical particle counter modelDAP-Test-2000 have been combined. The DMPS, which classifies particlesaccording to their mobility, is applied for measurements between 10 and about200 nm. The LAS-X which usually delivers an optical diameter, can be used inthe size range between 90 nm and about 3 m and the DAP-Test-2000 forparcicles between I Lm and 25 m. Since the optical diameter depends on therefractive index of the particles, direct calibrations of the LAS-X in termsof mobility-diameters have been carried out (Brand and Gebhart, 1988).Because of its high time resolution (5 min), this instrument allowsobservations of short-term variations in particle number, volume and sizedistribution. In general the aerosol number concentration was nearly oneorder of magnitude lower than in urban districts, but particle productionperiods were observed in which the concentration was comparable to valuesmeasured in cities. These production periods were correlated to sunradiation and the generated particles were found in a nucleation mode in thediameter range between 20 rim and 40 nm.
Reference:
Brand, P., Gebhart, J.: A combined DMPS-OPC-Sizing System and its Calibrationand Application for Environmental Aerosols. Twelth International Conferenceon Atmospheric Aerosols and Nucleation, Wien, Ostereich, 22.-27.8.1988.Proceedings of the Conference, Springer-Verlag (1988).
24
__ _ _ _ __ _ _ _ _

VOLATILITY OF BACKGROUND AEROSOL
S.G. Jennings and C.D. O'DowdDepartment of Experimental Physics
University CollegeGalway, Ireland
In this work the volatile properties of Atlantic background maritimeaerosol is reported for the first time. Field measurements on the volatilityof background aerosol particles have been carried out at Mace Head fieldresearch station on a remote location off the west coast of Ireland, spanning18 months from December 1987 to date.
Evaporation in aerosol particle size occurred as the particles are drawnthrough a quartz heateg tube whose inner temperature was varied from ambienttemperature up to 850 C. Detailed measurements of the reduction in particlesize and number concentration with temperature were made generally over 60minute temperature cycles with a-Particle Measurement Systems (PMS)light-scattering aerosol counter - an Active Scattering Spectrometer Probe(ASASP-X).
The field volatility measurements show a sharp decrease in aerosol numberconcentration for particle radius up to about 0.4 micrometers for temperaturesup to 400 C.
A comparison of the field data was made with laboratory aerosolpolydispersion volatility measurements for a wide range of atmospheric aerosolconstituents using the identical volatility apparatus. Average field datatemperature fractionation curves for submicrome~re particles comparefavourably with the laboratory data (up to 400 C) for ammonium sulphate (andammonium bisulphate) suggesting that those materials are a major constituentof the submicrometre marine background aerosol fraction.
Field volatility measurement for higher temperature up to 850 0 C showthat the particle size radius range (0.3 - 1.5 micrometre) is also volatileand display temperature - fractionation characteristics of sodium chloride, oncomparison with laboratory data. The measurements also indicate that themajority of the remaining submicrometre aerosol is largely unaffected at thesehigher temperatures suggesting the presence of clay mineral type constituentsin the background submicrometre aerosol.
Acknowledgement: This work was supported by the European Research Office,London, Contract DAJA45-86-C-0051.
25

INTERHEMISPHERIC VARIABILITY IN AEROSOL PHYSICOCHEMISTRYOVER THE REMOTE PACIFIC OCEAN
A.D. Clarke
Hawaii Institute of GeophysicsSchool of Ocean and Earth Science Technology
University of Hawaii, Honolulu, HI 96822
Extensive measurements of aerosol physicochemistry and related properties havebeen carried out over the remote Pacific using research vessels, aircraft anda stationary site at Mauna Loa Observatory, Hawaii (alt. 3,500 m). A custom256 channel optical particle counter matched via microcomputer to a thermalconditioning system acted as a Thermo-Optic Aerosol Discriminator (TOAD).This sulfuric acid, sulfate or sea-salt to be separately accumulated in-situand in real-time. Coincident measurements of condensation nuclei (CN),aerosol light scattering coefficient (integrating nephelometer), aerosollight- absorption (integrating sandwich photometer) were also made.
Data from the North Pacific generally show elevated coarse and fine modeaerosol concentrations at higher latitudes than the equatorial and southernPacific. The total CN and the relative fraction of CN remaining afterheating to 300 C also appear greater in the northern hemisphere and often whenlight- absorption values are highest, usually indicating the presence of soot.The ratio of ammonium to sulfate in the aerosol, as inferred by the TOAD
system, is also higher in the northern hemisphere (usually near one orgreater) than in the southern hemisphere (usually near zero). Theseobservations suggest the North Pacific is often influenced by continental andcombustion aerosol with higher ammonia concentrations than the southernhemisphere. The relative "cleanliness" of the south Pacific atmosphere witha NH4+/ S04- value that tends to be zero, except when when air masses indicaterecent passage over land, suggests that natural sources of sulfuric acid arecommon to extensive oceanic regions. Experiments using a differentialmobility analyzer/TOAD combination indicate an internally mixed fine-modeaerosol in the North Pacific but a small externally mixed component south ofthe equator.
26
4
7
COMPARISON OF AEROSOL CHARACTERISTICS IN THE ARID SOUTHWESTERNUS AND THE WEST COAST OF WESTERN EUROPE
E.H. Holt and R.G. PinnickUS Army Atmospheric Sciences Laboratory
White Sands Missile Range, NM 88002USA
S.G. Jennings and C.D. O'DowdDepartment of PhysicsUniversity College
Galway, Ireland
The addition of a heated intake to a particle counter, as employed in thepioneering work of Rosen (1) and Twomey (2), permits the volatility of theambient aerosol to be determined, leading to information about the compositionof the aerosol particles. This technique has been used for aerosolmeasurements in two diverse locations - the west coast of Western Europe andan interior basin in the arid southwestern United States. A comnon bimodalaerosol distribution is found at both sites. The smaller fraction of theaerosol is found to be dominated by ammonium sulphate in both cases. Adependence of aerosol number density on air mass type is also a commonfeature. In the southwestern US the change from a modified maritime polarair mass to a modified maritime tropical air mass by a frontal passage led toa concentration increase of up to an order of magnitude in the volatilesubmicron particles and a substantial increase in the proportion ofnonvolatile particles in this size range. On the west coast of Irelandaerosol number density increases by two to three orders of magnitude as theair mass changes from maritime to continental origin. The nonvolatileaerosol fraction in the southwester US is found to be composed of quartz andclay minerals with some carbonaceous particles suspected in low concentration.The use of higher instrument intake temperatures for analyzing the aerosol on
the west coast of Ireland led to the identification of sodium chloride in thesupermicron aerosol fraction. Planned installation of aethalometers at bothlocations is designed to determine the carbonaceous content of the aerosol andits dependence on air mass origin and meteorological condition.
References:
(1) Rosen, J.M., J. Appl. Met. 10, p.1044-1046 (1971).(2) Twomey, S., J. Atmos. Sci. 28, p.377-381 (1971).
27
J . . .

DISTRIBUTION OF METHANESULFONATE, NSS-SULFATE ANDDIMETHYLSULFIDE OVER THE ATLANTIC AND THE NORTH SEA
S. Burgermeister, H.-W. GeorgiiInstitut fur Meteorologie und GeophysikJ.W. Goethe-Universitat, Feldbergstr. 476000 Frankfurt/Main, F.R. Germany
The emission of gaseous biogenic fulfur compounds from marine andcontinental sources is an important supplier of atmospheric sulfur. One ofits essential processes is the flux of dimethyl-sulfide (DMS) from the oceansto the atmosphere with an estimated amount of 40 Tg S(DMS)/yr, about half ofthe global anthropogenic sulfur emissions. In the atmosphere DMS is oxidizedby OH-, N03 - and 10- radicals. Final oxidation products are sulfate (S04) -and methanesulfonate (CH3 SH3-, MSA)- particles which are effective ascondensation nuclei. Information about the yield of these two compounds are~still discrepant.
The results of parallel measurements of methanesulfonate and non-sea-salt
(nss)-sulfate in the aerosol and of dimethysulfide in the marine atmosphereare presented with the main emphasis on the MSA-aerosol. Theseinvestigations were performed during two passages with the research vessel"Polarstern" across the Atlantic between 50N and 300S in March/April 1987,September/October 1988 and during measurements on the island Sylt (May 1986,August 1987) as well as on a research platform in the North Sea (May 1988).In addition the concentrations of MSA and nss-sulfate were determined in rain-and fog-water.
The concentration of MSA in the aerosol varied between 1 and 20 ngS(MSA)/m 3 over the Atlantic while in the region of the North Sea higher valuesof 5 - 100 ng S(MSA)/m 3 were observed. On an average theS(DMS)-concentration was a factor of 4-9 higher than the S(MSA) -concentrations. Beyond the influence of continents the quotient ofnss-sulfate- and MSA-concentrations in the aerosol was aboi- 10. TheMSA-concentration proved to be a good indicator for advect_ . of marine airmasses. During the measurements on the platform a diurnal variation of theMSA- concentration was found with a maximum at daytime. In rain-waterMSA-concentrations of 1 - 20 g S(MSA)/I were determined, while in fog thevalues increased to 50- > 100 Ag S(SMA)/l. The concentration of MSA showed areverse correlation with the pH of rain- and fog-water.
28
a"
l" a~ IaH a

THE CHEMISTRY OF AEROSOLS IN THE ATMOSPHERE
R.M. HarrisonInstitute of Aerosol Science
University of EssexColchester C04 3SQ
United Kingdom
The chemical composition of atmospheric aerosols is influenced by threemajor factors:
(a) composition of primary aerosol emissions of both natural andman-made substances;
(b) composition of secondary aerosols formed by gas to particleconversion processes;
(c) subsequent chemical reactions of the primary and secondaryaerosols.
Typical example of aerosol components arising by all three mechanisms will bepresented.
There are many techniques by which chemical information upon atmosphericaerosol composition may be obtained. If it is required to characterize theaerosol beyond the level of elemental abundance in a bulk sample, twotechniques stand out as especially valuable:
(a) X-ray powder diffraction, which can provide an unequivocalidentification of specific crystalline chemical compounds
within a size-fractionated bulk sample,
(b) electron microscope or microprobe techniques in which theelemental composition of individual particles is determined.
Some of the results of the application of such methods will be reviewed, andthe conclusion presented that irrespective of geographic location, there aremajor similarities in aerosol composition worldwide.
Two aerosol systems providing a particular chemical challenge are theNH4NO3 /NH3 /HNO3 and NH4 Cl/NH3 /HCI systems. These are described anddiscussed in the light of the ability of equilibrium chemical thermodynamicsto predict their status, and of experimental studies designed to elucidate thekinetics of achievement of equilibrium conditions.
29IJ

ELEMENTAL COMPOSITION OF AEROSOL PARTICLES UNDERBACKGROUND CONDITIONS IN HUNGARY
I. Borbily-Kiss, E. Koltai and Gy. Szab6Institute of Nuclear Research
H-4001 Debrecen, POD 51Hungary
E. MN6szros and A. Molntr
Institute for Atmospheric PhysicsH-1675 Budapest, POB 39
Hungary
The elemental composition of atmospheric aerosol particles sampled underregional background conditions is determined by using the PIXE method. Theresults of a sampling program of several years are presented. It is shownthat sulfur and silicon are the most abounding elements showing that theaerosol is partly of anthropogenic and partly of soil origin. The origin ofparticles is further discussed on the basis of elemental ratios related toselenium and vanadium as well as on the basis of the analyses ofmeteorological conditions during sampling. The results are compared to thoseobtained under oceanic conditions to estimate the strength of continentalsources. Finally, for some cases the regional and long range transport ofdifferent elements is evaluated.
30

PARTICULATE AND GASEOUS AIR POLLUTANT LEVELSAT THE PORTUGUESE WEST COAST
C.A. Pio, R.M. Leal, I.M. Santos and T.D. AnacletoDepartamento de Ambiente e Ordenamento
Universidade de Aveiro3800 Aveiro, Portugal
A field study has been conducted on a coastal site near Aveiro-Portugalto assess the chemical composition of aerosol particles and the levels ofinorganic gaseous compounds involved on gas/particle conversion in theatmosphere. For this purpose parallel sampling of suspended particles with a"high volume" sampler and HCl, HNO 3 and NH3 with a filter pack technique wascarried out during 24 hour periods. The aerosol samples were analysed forsulphates, nitrates, chlorides, ammonium, organic carbon, elemental carbon andtrace elements including K, Na, Mg, Ca, Be, Cd, Cr, Cu, Fe, Mn, Mo, Ni, Pb, Vand Zn by a variety of techniques (atomic absorption, atomic emission, ionchromatography, thermal volatilization/NDIR, etc.)
Gaseous and particulate pollutant levels are similar to other valuesobserved in non-polluted atmospheres. The equilibrium between particle andgas phase is evaluated for NH4 Cl and NH4 NO3 compounds in comparison withthermodynamic data.
Backward air mass trajectories and source apportionment techniques wereapplied to the data to find the groups and processes responsible for theaerosol burden in this region of Europe.
31

ACID AEROSOL MEASUREMENTS AT A SUBURBAN CONNECTICUT SITE
G. Keeler and J. SpenglerHarvard School of Public Health
Boston, MA, USA
R. CastilloWestern Connecticut State University
Danbury, CT, USA
Atmospheric acidity data was gathered during a year-long field projectinvestigating the possible health effects of acid aerosols at a rural site insouthwestern Connecticut. This site was chosen as the air quality isfrequently influenced by pollutants transported from the New York City-NewJersey corridor.
An annular denuder filter-pack system was utilized to obtain dailymeasurements of gaseous HNO3 , HONO, SO2 and NH3 , fine particle S0 4 =, NO3 -,NH4 +, and H+, and fine mass (<2.1 Lm). Ozone concentrations and basicmeteorological data were also obtained continuously. Multiple measurementlocations, in a 10 mile radius of the central site, were also utilized tostudy the spatial patterns of aerosol acidity in the community. Preliminarydata from the summer of 1988 at this site will be presented and contrasted todata taken at other network sites. Correlations of atmospheric acidity withozone and meteorological parameters will be presented.
32
SENSITIVITY LIMIT, RESOLUTION, COUNTING EFFICIENCYAND COINCIDENCE LIMIT OF OPTICAL AEROSOL PARTICLE COUNTERS
H.T. SomerEngineering Manager
Pacific Scientific CorporationSilver Spring, Maryland 20910
USA
The importance of aerosol contamination monitoring in the semiconductorindustry is well established and recognized to achieve high yields inIntegrated Circuit production. The trend of this industry to smallerdimensions forces instrument manufacturers to push the performance of opticalaerosol particle counters (OAPC) to their physical limit. The driving forceis the desire to detect the smallest particle. Unfortunately lowering thesensitivity limit of an OAPC might also affect other important instrumentperformance parameters.
This paper will illustrate the relationship between four major OAPCperformance parameters and will expose their individual effect on instrumentperformance. It will be shown that many instruments with low sensitivitylimits (0.1 tm and lower) can only accomplish this task if counting efficiencyis sacrificed to less than 50% and resolution is reduced. In reality thismeans that instrument performance is reduced in order to detect "some" of thesmall particles which then define the sensitivity limit of the instrument.
33
A

CHARACTERIZATION OF THE CARBONACEOUS AEROSOL IN THE WESTERNMEDITERRANEAN ATMOSPHERE
H. Cachi6r, M.P. Bremond and P. Buat-M~nardCentre de Faibles Radioactivites
Lamoratoire mixte CNRS-CEA91198 Gif sur Yvette Cedex
France
Aerosols were sampled over the Western Mediterranean sea during 4 fieldexperiments and analysed for their total and soot carbon contents.Particulate carbon is always the major element of the aerosol. It exhiitsrather uniform atmospheric concentrations (mean values: 2 and 0.4 IgC/m3 fortotal and soot carbon respectively). The two components display asatisfactory covariation which suggests a comnon origin. The carbonaceousaerosol bears the characteristics of that sampled in industrial sourceregions: on the average, 22% of the carbon is in the soot mode and analysesof size-segregated samples indicate that at least 50% of the carbon mass isattached to submicron-particles. These results suggest that the particulatecarbon produced from fossil fuels is conservative during its transport in theatmosphere. Also, intense anthropogenic atmospheric inputs in Western Europegenerate an important background of carbonaceous aprticles over theMediterranean sea. Such an aerosol load might influence the transport andchemistry of other compounds as well as the radiative balance of thisatmospheric environment.
34
- I -mH I -s i-.-il . -I - -

INTERNAL/EXTERNAL MIXING OF SOOT TO AEROSOLS IN SOURCE
AND RECEPTOR REGIONS IN AUSTRIA
R. HitzenbergerInstitute for Experimental Physics
Boltzmanng 5A-1090 Vienna
Austria
Elemental carbon (soot) can be mixed to the atmospheric aerosol eitherinternally (i.e. within the individual particles) or externally. The type ofmixing determines the optical properties of the aerosol and especially itssingle scattering albedo, which is often used to predict the radiative andclimatic consequences caused by an aerosol layer. Model calculations (e.g.Ackerman, Toon 1981) have shown that, depending on the mixing type, a certainamount of elemental carbon can produce non-negligible differences of thesingle scattering albedo of a model aerosol.
During an intensive measurement period of two weeks in September 1983 themass size distribution of the aerosol in the urban source area of Vienna andin a rural receptor region in its vicinity was measured with AERAS cascadeimpactors. The impaction foils were subsequently analyzed for total mass,sulfate, nitrate and carbon. A summary of these measurements was presentedelsewhere (Hitzenberger et al. 1985), while the humidity dependence of thesize distributions of the chemical species is investigated in the presentpaper. If the aerosol is mixed externally, the size of the (nonhygroscopic)elemental carbon particles should not be a function of relative humidity.If, on the other hand, elemental carbon is present within the hygroscopic saltparticles, the carbon size distribution should undergo the usual humiditydependent growth/evaporation processes.
From the chemical size distributions in Vienna no appreciable change ofthe carbon distribution was found for relative humidities above 50%. Theshape of the distribution stayed more or less constant during the wholemeasurement period. The sulfate and nitrate distributions follow theexpected humidity pattern, so one could conclude that at least in the sourceregion the aerosol is mixed mainly externally. In the same time period,however, all measured chemical size distributions in the receptor regionexhibit similar humidity trends. The carbon size distribution closelyfollows that of the salts. Therefore an internal mixture seems to beindicated.
References
Ackerman, T.P., Toon, O.B. (1981), Appl. Opt., 20, 3661-3668.Hitzenberger, R., Horvath, H., Pinninger, M., Puxbaum, H. (1985), J. Rech.Atmos. 10, 150-161.
35

A METHODOLOGY FOR ESTIMATING REGIONAL EMISSIONS OF BLACKCARBON IN THE ARCTIC
J.D. KahlGeophysical Monitoring for Climatic Change
Air Resources LaboratoryNational Oceanic and Atmospheric Administration
325 Broadway, BoulderColorado 80303, USA
A.D.A. HansenApplied Science Division
Lawrence Berkeley LaboratoryUniversity of California
BerkeleyCalifornia 94720, USA
R.C. SchnellCooperative Institute for Research in Environmental Sciences
University of Colorado, BoulderColorado 80303, USA
Black Carbon aerosol (BC), a strong absorber of visible light,constitutes a small but significant fraction of the effluent arising fromcarbonaceous fuel combustion processes. Estimates of the source strengthsand geographical distribution of BC emissions, needed to model their effectson radiative transfer, are currently unavailable. In this paper we present amethodology for estimating regional emissions of BC in Arctic latitudes basedon the synthesis of three independent pieces of information: time-resolvedmeasurements of BC and CO2 at Pt. Barrow, Alaska; long-range atmospherictrajectory analyses; and tabulated values of regional fuel consumption.Preliminary results imply annual BC emissions in the Novaxa Zemlya/TaymyrPeninsula regions of the northern USSR on the order of 10 g yr -
36
AL

AIRBORNE PARTICULATE ELEMENTAL CARBONITS SOURCES, TRANSPORT AND SOILING POTENTIAL
R.S. Hamilton and T.A. MansfieldUrban Pollution Research Centre
School of Applied ScienceMiddlesex Polytechnic, QueenswayEnfield, Middlesex EN3 4SF, UK
This paper will review the sources of airborne particulate elementalcarbon (PEC) and develop an emission inventory for this pollutant. Thisinventory shows that diesel emissions are the main source of PEC, even forsites remote from highways. Observed correlations between PEC and Pb are ingood agreement with their respective emission factors.
The application of a model for area ground level emissions is considered.The predictions of the model are consistent with observed values.
Correlations between gravimetric and smoke shade estimations of airborneparticulate mass are considered and the relative contribution from PECassessed. The contribution of PEC to airborne dark smoke varies from 60% inurban areas to a national average of 25%. Finally, the soiling potential ofparticulate matter deposited from the atmosphere to horizontal and verticalsurfaces, and the relative contribution from PEC, will be assessed andcompared with experimentally obtained values.
tI
37
el, 'm il i
PARTICLE SAMPLES FROM FOREST FIRES
A.D. KayeEnvironmental and Medical Sciences
DivisionAERE
HarwellOxfordshire
UK
W.J. MegawInstitute for Space and TerrestrialScience and Department of Physics
York University4700 Keele Street
North YorkOntario M3J 1P3
Canada
Naturally occurring forest fires are one of the contributors to thebackground atmospheric aerosol. The general perception has been that forestfires will give rise to sooty and carbonaceous smoke and the sampling ofparticles from them is of some interest especially via a via nuclear winterstudies. It is not generally possible to obtain close in samples of theaerosol from natural forest fires, but in Ontario forest management includesprescribed burns in which areas of unproductive forest are set alight prior toreplanting.
In 1987 a helicoptor was used to obtain particle samples fairly close toa prescribed burn near Timmins, Ontario. Particles were sampledqualitatively using a rather crude but effective 'whirling broomstick'technique. It was found that sooty carbonaceous particles were the exceptionrather than the rule and the samples revealed, rather surprisingly, a widevariety of particle types depending on the closeness of the sampling point tothe fire and the time after formation. Some hypotheses will be advanced,rather tentatively, in an attempt to account for these differences.
38
,j7m mm ~ mm

ATMOSPHERIC AEROSOL SOURCES AND THEIR CLIMATIC SIGNIFICANCE
G.A. d'Almeida, P. Koepke, and M. HessMeteorologisches Institut der Universitaet Muenchen
Theresienstrasse 37D-8000 Muenchen 2F.R. Germany
Specifications of the sources and emission rates of atmosphericparticulate matter provide basic information for estimating their climaticimpact both on a regional and global scale. The production sources andmechanisms reflect the chemical composition, the size range, and the shape ofthe particles. These properties indicate the ability and the extent to whichthe particles can interact with electromagnetic waves, liquid and solidmatters and to go or not into solution droplets.
In the present study, a survey of the following species: sulphate,sea-salt, soot, mineral, dust-like, and water-soluble substances have beenmade to determine their microphysical properties and their radiativecharacteristics as a function of the ambient relative humidity. Their globaldistributions and their variations with time have been made to evaluate theirclimatic signature in the visible and infrared regions. Updated results ofthe study will be presented.
39
|U - _ __._ _ _ _ _ _ __mam I l I I f . .

ATMOSPHERIC OPTICAL DEPTHS: BACKGROUND AND PERTURBATIONSIN THE TROPOSPHERE AND STRATOSPHERE
R.F. Pueschel and P.B. RussellNASA Ames Research CenterMoffett Field
Ca 94035
M.P. McCormickNASA Langley Research Center
HamptonVa 23665
Sun photometry is a convenient way to measure atmospheric optical depths,one of the parameters by which climatically important aerosol-relatedperturbations of the background atmosphere can be assessed. Traditionally,sun photometric observations have been ground-based. Such observations donot provide information on the vertical profile of optical depths, therebylimiting an assessment of climatic effects of background and pollutionaerosols. This situation has been changed in recent years with the advent ofairborne sun photometry (Matsumoto et al., 1987); Russell et al., 1986;Pueschel et al., 1988) and spaceborne extinction measurements (McCormick,1986; Kent and McCormick, 1984). In this presentation we comparesurface-derived atmospheric optical depth data from WMO's Background AirPollution Monitoring Network (BAPMDN) with airborne results from NASA's FirstISLCP (International Satellite Land Climatology Project) Field Experiment(FIRE), and with extinction measurements of NASA's Stratospheric Aerosol andGas Experiment (SAGE) satellite program. This data evaluation permits adistinction between tropospheric and stratospheric optical depths, and theirperturbations by anthropogenic and volcanic pollutants, respectively.
References: Kent, G.S., and McCormick, M.P., SAGE and SAM II Measurements ofGlobal Stratospheric Aerosol Optical Depth and Mass Loading. J. Geophys. Res.,89, 5303-5314, 1984.Matsumoto, T., P. Russell, C. Mina, and W. VanArk, Airborne TrackingSunphotometer. J. Atmos. and Oceanic Techn., 4, 336- 339, 1987.McCormick, M.P., SAGE Aerosol Measurements, NASA Ref. Pub. 1149, 305 pp.,1986.Pueschel, R.F., J.M. Livingston, P.B. Russell, D.A. Colburn, T.P. Ackerman,D., A. Allen, B.D. Zak, and W. Einfeld, Smoke Optical Depths: Magnitude,Variability, and Wavelength Dependence. J. Geophys. Res., 93, 8388-8402,1988.Russell, P.B., T.Matsumoto, V.J. Banta, J.M. Livingston, C. Mina, D.S.Colburn, and R.F. Pueschel, Measurements with an airborne, autocracking,external head sunphotometer.Proceedings, Sixth Conference Atmosph. Rad., Williamsburg, VA, May 13-16,1986.
40
____________

SPECTRAL EXTINCTION COEFFICIENTS OF BACKGROUND AEROSOLS INEUROPE, NORTH AMERICA AND SOUTH AMERICA; A COMPARISON
H. HorvathInstitut fur Experimentalphysik der Universitat Wien
Boltzmanngasse 5A-1090 Wien, Austria
Several intensive studies have been performed in order to investigate theatmospheric aerosol in remote locations and to obtain data on the atmosphericextinction coefficient. The following results were obtained:
A) Europe: In an early study in the late summer of 1964 the sizedistribution was measured continuously with an aerosol spectrometer. Thenumber size distribution functions had a peak around 0.3 micrometer, secondarymaxima sometimes occurred above one micrometer diameter. The extinctioncoefficient of the aerosol was calculated by means of Mie theory, and valuesbetween 0.03 and 0.2 km have been found. The lowest values occurred duringsnowfall, high values normally were obtained when the haze layer extended tothe elevation of the measuring site, which was at an altitude of 2000 meters.
Similar results have been obtained from determinations of the spectralextinction coefficient with the university of Vienna telephotometer, whichwere performed since 1972. On days with excellent (European) visibility theextinction coefficient usually has a value of 0.03 km, on average days valuesaround 0.1 km are typical. It is interesting to note, that these values werefound both in the Alps and at a rural site 100 km south of the heavyindustrialized Ruhr district in Germany. This indicates, that the aerosolfound at remote sites in Europe apparently is the average pollution spreadover a large area.
B) North America: Spectral extinction coefficients were obtained with theUniversity of Vienna telephotometer at a rural site north of Denver, Colorado,and at a site in the desert of northern Arizona in the Summer of 1979.Usually the extinction coefficients had values between 0.01 )an and 0.04 km.At the rural site in Colorado an influence of the urban plume of Denver wasfound, since in most cases the values for sight paths towards the town werelowest, whereas in the desert site in the southwest the same extinctioncoefficient was measured in all directions. A severe smog episode in LosAngeles (more than 700 km to the west) caused an increase of the extinctioncoefficient by a factor of 2 at this remote location.
C) South America: In the Cordillera De Los Andes near Santiago de Chileextinction coefficients have been determined at elevations above 3000 meters.Values betwee 0.018 km and 0.15 km have been found depending on the height ofthe haze layer, which usually increases from below 2000 meters in the morningto above 4000 meters in the afternoon. Probably the low extinctioncoefficients in the morning still are influenced by "left over" aerosol of thehaze layer of the previous day. This will be clarified by measurements,which are scheduled after the deadline for submission of abstracts.
41

EVIDENCE OF A TROPOSPHERIC AEROSOL BACKSCAT1ER BACKGROUNDMODE AT CO2 WAVELENGTHS
J. Rothermel D.A. BowdleUniversities Space Research Johnson Research Center
Association University of Alabama in4950 Corporate Drive, Suite 100 HuntsvilleHuntsville, Alabama USA 35806 Huntsville, Alabama
USA 35899
R. T. Menzies M.J. PostJet Propulsion Laboratory Wave Propagation4800 Oak Grove Drive Laboratory, NationalPasadena, California USA 91109 Oceanic & Atmospheric
Administration325 Broadway, BoulderColorado USA 80303
J.M. VaughanRoyal Signals and Radar Establishment
St. Andrews RoadGreat Malvern, Worcs. UK WR14 3PS
The Laser Atmospheric Wind Sounder (LAWS) has been proposed for themeasurement of global tropospheric winds. LAWS, a satellite-borne,lidar-based sensor, will measure Doppler shifts in aerosol backscattersignals. The wind measurement accuracy will depend critically on thestrength of the backscattered signal, which in turn is a function of thebackscatter coefficient a (w), or p. During this decade, climatologies ofbackscatter profiles have been obtained in the troposphere and lowerstratosphere at CO2 wavelengths from several locations. Three suchclimatologies are described and compared. The Royal Signals and RadarEstablishment (RSRE), United Kingdom (UK), obtained sounding measurements overthe UK from 1981-1983 using the Laser True Airspeed System (LATAS), anairborne focussed 10.6 pi pulsed Doppler lidar. The Jet PropulsionLaboratory (JPL) obtained measurements over Pasadena from 1983-1988 usingground- based 10.6 and 9.25 pm lidars. The measured profiles were convertedto backscatter mixing ratio (13/p), a conserved quantity in the absence ofsource/sink processes, by normalizing the backscatter estimates (m-lsr-1
units) by air density p (kg m units) at each altitude. The resultant3/p profiles were averaged over selected height intervals and sorted into sub-decade classes of logl0 (p/p). The frequency of occurrence corresponding toeach bin at every height level was then calculated, color-coded, and displayedwith computer-generated graphics for interpretation. Comparison of theresulting, "stacked" frequency histograms at 10.6 jm from each location showstriking similarities. A well-defined clean background mode ("backgroundbranch") within a narrow range of p/p values about 10- 1 0m 2kg-lsr- 1 isapparent in the middle and upper troposphere. The extension of thebackground branch into the lower troposphere varies with the seasonal strengthand geographic variability of a "convective branch" as determined by theconvective boundary layer (CBL) activity and the surface aerosol flux. Theposition of the "stratospheric branch" varies with volcanic activity and thedaily and seasonal rise and fall of the troposphere. The existence andsimilarity of the three background modes is remarkable in view of the naturalaerosol backscatter variability (over four orders of magnitude in thetroposphere), the diversity of the measurement conditions, and the presence
42

of stratospheric aerosol injections from Mount St. Helens (May 1980), ElChichon (Spring 1982), and other volcanoes preceding and throughout themeasurement period. The 9.25 and 10.6 pm JPL histograms are quite similar,except that the 9.25 Im modal values are larger by approximately a factor ofthree above the CBL, consistent with theoretical predictions. it is notedthat low aerosol extinction coefficients at 1.0 pm, which could represent abackground mode, have been observed in SAGE II solar occultation data.Empirical conversion factors between such a 1.0 pm extinction background andthe 10.6 W backscatter background are consistent with theoretical values.In summary, the existence of the background mode has major implications forglobal-scale aerosol models and studies of global aerosol budgets. It isalso important for the design and performance simulation of prospectivesatellite sensors that rely on atmospheric aerosols as scattering targets.
43

THE MAUNA L0A AEROSOL BACKSCATTER INTERCOMPARISONEXPERIMENT (MABIE)
D. A. Bowdle E.M. PattersonJohnson Research Center School of Geophysical SciencesUniversity of Alabama in Georgia Institute ofHuntsville TechnologyHuntsville, Alabama 35899, USA Atlanta, Georgia 30332, USA
M.J. Post A.D. ClarkeNOAA Wave Propagation Hawaii Institute of.aboratory GeophysicsBoulder, Colorado 80303, USA Honolulu, Hawaii 96822, USA
Coordinated measurements of aerosol physicochemical and opticalproperties were obtained at the Mauna Loa Observatory (MLO) Hawaii, at 3.4 kmaltitude, during the Mauna Loa Aerosol Backscatter Intercomparison Experiment(MABIE) from November 14 - December 12, 1988. MABIE instrumentation includeda high-volume filter/cascade impactor sampler (Georgia Institute ofTechnology); a high-resolution optical particle counter with thermalpreconditioning (University of Hawaii); and a multiwavelength integratingnephelometer (NOAA's Geophysical Monitoring for Climatic Change) - all drawingfrom tall sampling stacks at the MLO site; and a high-power tunable (9.25 )mor 10.6 Lm) pulsed CO2 Doppler lidar (NOAA's Wave Propagation Laboratory),situated at 3.2 km altitude, 2.9 kms from MLO. Routine MABIE operationsconcentrated on concurrent measurements with all instruments in nocturnaldownslope drainage flows, since these conditions supposedly transportbackground mid-tropospheric aerosols over the MLO sampling stacks. Inaddition, the lidar obtained several detailed vertical cross-sections ofaerosol backscatter and winds in the upslope and downslope "skin" flows, alongwith numerous vertical profiles of backscatter and winds. Fair weatherdominated MABIE sampling conditions, although brief stormy periods occurredduring occasional frontal passages, with intervening periods of scatteredmaritime convection near the islands. Preliminary data during typical fairweather periods indicate background aerosol concentrations of approximately0.1 gg m-3 , with sulphuric acid apparently the dominant sub-micron component;scattering extinction at 0.55 pm of approx. 2-4 x 10- 7m-i; and backscattercoefficients at 10.6 M m of approx. 10- 1 1m-lsr -1 .
Background aerosol optical properties calculated from MABIE microphysicaldata are reasonably consistent with simultaneous measurements of those sameoptical properties. Moreover, measured and modelled optical properties fromMABIE are reasonably consistent with background free tropospheric dataobtained over less remote regions. These fair-weather MABIE data will bepresented along with the rest of the MABIE data set in a local and regionalmeteorological context. This analysis is expected to determine whetherdownslope aerosol measurements at MLO are truly representative of the freetroposphere above the island, and, consequently, representative of the freetroposphere in the central Pacific Ocean around the islands. The results ofthis study will be used as inputs to a global-scale model of aerosolbackscatter as part of NASA's GLObal Backscatter Experiment (GLOBE), INSUPPORT OF NASA's prospective Doppler Laser Atmospheric Wind Sounder (LAWS).
44
.; J

/
AEROSOL OPTICAL PROPERTIES IN REMOTE MARINE REGIONS
A.D. ClarkeHawaii Institute of Geophysics
School of Ocean and Earth Science TecnnologyUniversity of Hawaii, Honolulu, HI 96822
During the past several years we have measured aerosol light-absorptionba, and aerosol light-scattering coefficients, b., in remote regions of theAtlantic, Pacific and Indian oceans. The light-absorption coefficientfrequently reflects the concentration of soot carbon in the atmosphere and isa sensitive indicator of air masses influenced by combustion aerosol. Thishas enabled us to identify remote regions influenced by continental and/oranthropogenic influences and their optical properties.
Taken together the terms ba and b. define the single scatter albedo(SSA=b$/(bs+ba)), an important parameter for the determination of aerosolradiative effects in the atmosphere. Our measurements of ba and the relatedsoot concentrations range over 3 orders of magnitude for these remote regions.Lowest values were encountered in the South Pacific (bs = lxlO-Sm
-1 ) andhighest values (b. - 1500 x 10-8 m-1 ) were found over the South Atlantic. Therelated variability in SSA ranged from 0.99 to 0.77 respectively. The formervalue appears representative of "clean" marine regions with negligiblecontinental influence and results in a net atmospheric "cooling" effect due toaerosol while the latter reflects continental combustion sources that resultin a net atmospheric "heating". If our collection of data from theseextensive oceanic regions is representative then SSA values representing"clean" conditions occur in only about half of the remote regions studied.
45

/
CONFERENCE POSTER PAPERS
PRESENTATION
46
.4
/ i I I I " I - . . . . .... . . . .. ..

CONTINUOUS BACKGROUND AEROSOL MONITORING WITH THE EPIPHANIOMETER
U. Baltensperger, H.W. Gaggeler and D.T. JostPaul Scherrer InstituteGH-5232 Villigen PSI
Switzerland
A new device was developed, which allows continuous aerosol monitoring.Calibration experiments showed that the device delivers a signal which isessentially proportional to the exposed aerosol surface, and it was thereforecalled epiphaniometer (greek epiphania - surface of a body). Its highsensitivity allows measurements also at very low concentrations found e.g. athigh-alpine sites. Due to the low flow rate of 1 1/uin the device consumesonly 8 W and is therefore suitable for battery operation.
The system is based on a nuclear technique. Aerosols are pumped througha chamber containing radioactive lead isotopes (211 Pb). These single leadatoms are produced at a constant rate by the decay of a short lived radonisotope emanating from a long-lived actinium source. 211Pb atoms attached toaerosols are transported through a capillary acting as a diffusion barrier fornon-attached lead atoms. At the end of the capillary, the aerosols and withthem attached lead atoms are deposited on a filter. The resulting activityon the filter is measured continuously by a surface barrier detector. Due tothe relatively short half-life of 211Pb, the device allows continuousmonitoring of aerosols, without changing or transporting the filter.
Results from a battery-operated aerosol monitoring station on Colle Gnifetti(Monte Rosa region, Switzerland, 4450 m a.s.l.) will be presented. The dataare compared to two neighbouring stations at lower levels (3100 and 1600 ma.s.l.) and another high-alpine station (Jungfraujoch, 3450 m a.s.l.)
Counts
20 25 30 8Date (August/September 1988)
Figure 1. Signal of the epiphaniometer for a 3 week measuring period on
Colle Gnifetti, None Rosa (4450 m a.s.l.)
Reference
H.W. Gaggeler, U. Baltensperger, M. Eimenegger, D.T. Jost, A Schmidt-Ott, P.Haller, M. Hofmann, "The epiphaniometer, a new device for continuous aerosolmonitoring", accepted for publication in J. Aerosol Sci.
47
i I ii , •_ ra

A THERMD-OPTIC TECHNIQUE FOR IN-SITU ANALYSIS OF
SIZE-RESOLVED AEROSOL PHYSICOCHEMISTRY
A.D. ClarkeHawaii Institute of Geophysics
School of Ocean and Earth Science TechnologyUniversity of Hawaii, Honolulu, HI 96822
We have developed a technique for the in-situ investigation of aerosolphysicochemistry as a function of size over the range from 0.14 pm to 6 pm.The method is designed for use in remote background regions where thepredominant fine-node aerosol (DO < 0.5 Lm) is generally sulfuric acid,ammonium sulfate/dust, sea-salt With some sulfate or nitrate).Interpretation of the data depends upon the thermal volatility of the variousconstituents and knowledge of their state of hydration and optical properties.
The optical components of a laser optical particle counter, OPC (LAS-X,Particle Measurement Systems, Boulder CO), have been used in conjunction witha custyom 256 channel pulse height analyser (Norm Ahlquist, University ofWashington, Seattle, WA) installed in an Apple II microcomputer to create ahigh- resolution single range particle sizing instrument. The OPC isinterfaced with a multichannel, continuous-flow heater assembly that is alsounder microcomputer control. The combined system acts as a real-timeThermo-Optic Aerosol Discriminator (TOAS). Aerosol is brought into the TOAD,mixed 1:1 with dry air (0% RH) and distributed to three heater tubesmaintained at 40 -C, 140 OC and 300 °C after which it is selected and sized.
Analysis of the data is made by subtracting individual conditioned sizedistributions in order to isolate size distributions of the above mentionedcomponents. These volume distributions are then "corrected" by relatingvolume ratios of volatiles lost at 140 °C and 300 °C to molar ratios of theinferred constituents via laboratory calibrations that compensate forrefractive index and residual water. Quantitative agreement between resultsfrom standard analytical chemistry and TOAD inferred aerosol physicochemistryfor both laboratory tests and several field studies will be demonstrated.
48

BACKGROUND AEROSOL MEASURE ENTS IN GERMANY
B. GeorgiNiedersachsisches Institut fur Radiookologie
an der Universitat HannoverHerrenhauser Str. 2, D-3000 Hannover 21, FRG
The atmospheric aerosol is a three phase system (solid particles withliquid shell in a carrier gas) and acts as a vehicle for the transport ofmaterials of anthropogenic origin between sources and sinks. The particulateload of the atmosphere has changed in recent times from the dominant naturalsources to anthropogenic ones. An increase of the load at smalleraerosol-particle radii has become evident besides the overall increasingoutput of pollutants from various sources. changes in industrial processeslike increased mass fluxes at higher production temperatures, production ofsynthetic materials from powder or gases, filter installations, waste removaland increasing traffic emissions caused a shift towards smaller radii in thedistribution of primary particles released to the atmosphere. The smallradii fraction is further augmented by the change in concentration andcomposition of gas emissions, because favourable meteorological conditionslead to the enhanced production of ultra fine secondary particles from the gasphase (under irradiation). This increase of air-borne particles in the smallsize range causes a substantially increased residence time of anthropogenicemissions. That again results in a transport of particulate matter over longdistances into areas which formerly have been regarded as clean air regions.Only washout after cloud and precipitation scavenging efficiently reducesaerosol concentrations and contributes, besides other processes, to pollutiondeposition in the biosphere, Acidification of haze, fog and rain are measuredand remobilisation of fairly toxic substances in the ground are observed.
The measurement system in use are a series of well designed low pressureimpactors covering the size range from the nucleation to the coarse mode.Size selective measurements at 5 stations in Germany are compared according totheir distribution and assorted chemical constituents.
49

COMPARISON OF AEROSOL SIZE DISTRIBUTION MEASUREMENTSIN AN URBAN AND REHMTE SITE IN SWITZERLAND
B. GeorgiNiedersachaisches Inotitut fur Radiookologie an der
Universitat HannoverHerrenhauser Str. 2
D-3000 Hannover 1, RG
H.-N. MllerUmweltschutzamt, Stadt LuzernStadthaus, Hirachengraben 17
Ch-6002 Luzern und Geographisches InstitutUniversitat Giessen, FRG
M. HererMathematisch-Geographische Fakultat
Universitat EichstattOstenstrasse 18
D-8078 Eichstaat, FRG
The orography of the city Luzern is characterized by high altitudemountains in the South and East direction and low hills towards West andNorth. In the hilly region the major emission sources are situated and twohighways entering the town centre. Between the mountains and the town agreat lake provides ventilation. Vertical profiles and scavenging at themountain slope has been published previously (Schumann eat al, 1988). Themeasuring campaign has been concentrated on size selective particlemeasurements by low pressure impactors; the collection of meteorologicaldata, on large and micro scale; traffic evaluations and the measurement ofNO&X, 02, CO, TSP at two sites. The results prove the dominant role ofparticulate Nitrate as major pollutant in the town area. In consideration ofthe meteorological and automotive originated data the fluxes from the citytowards the rural sites are calculated. The dispersion of the particulates,the gases and the production of particulates from the gas phase is the majorinput of the urban sites to the background aerosols at the remote sites. Theindustrial contribution to the background pollution are below the part of thetraffic especially during rush hours. The very high number of particulates< 0.5 tn diameter increases the properties of CN and generates a stable layerof haze from the city towards the remote hill area at certain altitude.
References
Schumann, T., Zinder, B. and Waldvogel, A., 1988: Aerosol and HydrometeorConcentrations and their Chemical Composition during Winter Precipitationalong a Mountain Slope. Part 1. Temporal evolution of the aerosol,microphysical and meteorological conditions, Atmos. Environ. 22, 1443-1459.
50

REACTION OF MOTERPEMS WITH OZONE, SMPHUR DIOXIDEAND NITROGEN DIOXIDE -GAS-PHASE OXIDATION OF SO
AND FORMATION OF SULPHURIC ACID
D. Kotzias, K. Fytianos and F. GeissCommission of the European Communities
Joint Research CentreIspra (VA) - Italy
Teflon bag experiments were carried out in the dark in order to study thegas-phase reactions of selected monoterpenes with ozone in the presence of S02(p-pinene) as well as in the presence of SO,/NO2 (a-pinene, O-pinene,limonene). Emphasis was given in identifying the main reaction products andin quantifying the formed sulphuric acid aerosol. Apart from the sulphuricacid aerosol no other sulphur containing compounds could be detected.
It was found that the reaction of p-pinene with ozone, S02 and NO2leads mainly to 6,6-dimethyl-bicyclo (3.1.1] heptan-2-one (nopinone), thea-pinene -03 -SO2 -NO - reaction produced 2', 21 - dimethyl -3-acetylcyclobutyl ethanal (pinonaldehyde). The reaction of limonene with ozone-S 2 -N02 leads mainly to an unidentified product with a molecular weightM a 134. In addition to the above mentioned volatile products, the formationof organic nitrates could be by means of gas chromatography - massspectrometry established.
The yield of H2S04 in the system p-pinene /03 /SO2 varies between 0.13and 0.44 depending on the initial conditions e.g. humidity. In the systemterpene/0 3 /SO2 /NO2 the yield of H2904 was for a-pinene, 0.01 - 0.03, forp-pinene 0.07 - 0.13 and for limonene 0.02 - 0.09.
51

ATMOSPHERIC CONDITIONS OF PHDTOCE(ICAL SMOG FORMATION IN CITIES
O.V. Lomaya and D.F. KharchilavaInstitute of Geophysics Academy of Sciences of the Georgian SSR
Z. Rukhadze str.l, 380093Tbilisi, USSR
As it is known,anthropogenic impurities coming into the surface layer ofthe atmosphere of modern industrial cities undergo chemical reactions and formnew compounds - secondary pollutants of the air. Under certain atmosphericconditions the rate of chemical reactions increases, a rapid growth ofimpurities concentrations takes place and photochemical smog forms. Aslaboratory and field researches have shown, one of the products ofphotochemical sniog is ozone. Its concentration grows parallel with thegrowth of secondary aerosols and number of gas impurities. It can reachgreat values. A sharp rise of 03 in daytime hours was often observed incities.
The purpose of this paper is to elucidate conditions under whichintensive formation of photochemical smog takes place on the basis ofsystematic diurnal 04 measurements in the surface layer of the atmosphere inTbilisi. A statistical analysis of 03 dependency on the atmosphere'scharacteristics at various hours during day and night, includingautocorrelation analysis of parallel time series of 03 and the atmosphereparameters were carried out. Conclusions are made of atmospheric processesinfluencing upon quantitative contents of this pollutant in night time andday-time with different duration of solar radiation. Analysis is made ofconditions accompanying the cases with typical for photochemical processesdiurnal dynamics of 03. In the majority of these cases such atmosphericconditions took place that a sharp growth of 03 in afternoon hours could notbe caused by horizontal advection or vertical transfer from upper layers ofthe atmosphere. So during the days under consideration intensivephotochemical processes took place which led to local formation of ozone andother products of chemical reactions. On the basis of investigations and theresults of other authors works conclusions are drawn about conditionsfavouring the formation of secondary pollutants of the atmosphere, the heightof their generation and the time of maximum intensity of photochemicalprocesses in the lower troposphere.
52
!'
/
TERPENES, OZONE AND NITROGEN OXIDESIN A FINNISH RACKGROUND STATION
T. Raunemaa and S. KonttinenUniversity of Kuopio
Department of Environmental SciencesPOB 6, SF-70211 Kuopio, Finland
Photochemical formation of ozone requires presence of NOx andhydrocarbons. Natural emissions of hydrocarbons as terpenes are large, whichdirects considerable interest in studying their role in ozone procedos.
As previous terpene measurements point to large variation in theirconcentrations, existing data on background concentrations of these compoundscannot be used for exact analyses. Multicomponent data are required for thepurpose.
The terpenes, ozone and NO2 in a coniferous forest were determined inspring, summer and fall in the same stand locations. At the same timemeteorological and some aerosol data were registered. The largesttemperature difference between the periods was 40 °C. The terpenes from aTenax-sorbent sampling were analyzed using a thermal desorption and massselective gas chromatography.
The terpenes and ozone showed similar seasonal variation with high valuesin July. Their diurnal variation was inverted, with terpenes highest atnights and ozone lowest.
Ozone was effectively reduced inside the forest (at 10 om from theclosest tree stem) at nights when the temperature is high, but in principalnot at all when the temperature is below zero centigrades.
The ratio terpenes/NOx was high only during nights. Such values for theratio CH/NOx( 5-10) have in laboratory tests produced maximal ozoneconcentrations. The terpene-ozone-NOx phenomenon is more properly analysedin the work.
53

I
CASE STUDIES OF THE C[OICAL CC4POSITIOt OF ATWSPMWRIC AEROSOLAT THE SZRENICA SUNIT, KARMOSZE RANGE, POLAND
a.W. ZwozdziakInstitute of EnvironmentProtection Engineering
Technical University of roclaw, PolandThe concentrations of TSP, SO2, NOx, sulphate aerosol, trace metals and
PAN in atmospheric aerosol samples have been measured since April 1986 at theSzrenica summit 1362 m a.s.l. for air masses coming from south- andnorth-western Europe. Samples were taken in 24 hour intervals continuouslyfor seven days every month. The sampler for sulphate and ammonium aerosolconsisted of a prefilter and a bubbler with hydrogen peroxide and sulphuricacid solution, respectively. microscopic analysis (TEM, SEM) was used tostudy the physical and chemical properties of aerosol microparticles.
04 examinations have revealed large quantities of extremely fineparticles (radius below 0.1 jnm). Concentrations of fine sulphate aerosoldetermined from the hydrogen peroxide solution after subtracting sulphurconcentrations associated with SO2 were also found to be very fine, amountingup to 200 Lg/m 3. Conversion of SO2 to S04o2 ranged from 8 to 76%, accordingto the history of air masses, cloud activity and the height of the inversionlayer. A reasonable explanation of these results is that a substantialportion of SO4- has formed in the region of interest and does not come fromlong-range transport.
Based on aerosol chemistry and meteorological data, source apportionmentwas carried out for the remaining investigated species.
54
i]-
ii m | | I I II n _ i i I a i

SIMULATI( OF AEROSOL PARTICLES IN A LARGE SMOG CHAMBER
H. Bunz, M. Koyra, W. SchockLaboratorium fur Aerosolphysik und FiltertechnikKernfor schungs zentrum Karlsruhe
P.O. Box 3640, D-7500 Karlsruhe, FRGThe principal problem describing the behaviour of atmospheric aerosols
consists of the simultaneous action of both physical and chemical processes.
The physical processes comprise linear processes like the particle depositionand non-linear processes like coagulation. The simulation of such a systemis unfortunately not possible from a strictly theoretical basis but need quitea few parameters which have to be determined experimentally. Thecharacteristic time is quite different for the different processes andexperimental methods are requested suitable to the specific problem. Fastprocesses are preferably investigated by flow reactors, but slow processeslike a number of heterogeneous reactions on particle surfaces have to beexamined in large batch reactors since the residence time of the particles islarge enough only in such reactors. To plan such an experiment a number ofcalcuations with the computer code NACH! were performed which is able tosimulate the behaviour of an aerosol system under the influence of allimportant aerosol physical processes (coagulation, nucleation, condensationand deposition processes) and a limited number of chemical processes likeformation of gaseous sulfuric acid and a special type of heterogeneousoxidation of sulfuric dioxide on the particles. it can be shown whichprocesses of which characteristic time and reaction velocity can beinvestigated by the planned experiments in the 80 m3 container. The findingswhich processes can be examined does not only depend on the particle size butalso on the thermodyna ic conditions like temperature and pressure of thecarrier gas which might be important if stratospheric aerosols have to beinvestigated.
55
A

A NOVEL INSTRUHENT FOR THE CLASSIFICATION OF AIRBORNE PARTICLESON TIE BASIS OF SIZE, SHAPE AND COUNT FREQUENCY
N.A. Eyles, P.H. Kaye and I.K. LudlowHatfield Polytechnic
Laser Systems Research GroupHatfield, Hertfordshire AL109AB
England
A laser light scattering instrument has been developed to assist in thestudy of airborne particulate material. The instrument employs a noveloptical scattering chamber design which allows airborne particles to be drawnin from an ambient atmosphere and examined individually at high throughputrates (10,000 per second). The combination of a system of optical detectorsand high speed data processing allows in the classification of the particlesin terms of their size (or for non-spherical particles, the sphericalequivalent size), their shape (based upon the spatial intensity distributionof the scattered light), and their time-of-flight through the laser beam(which may later be related to aerodynamic size). The instrument is designedfor particle detection in the size range 1 to 10 pm, although this range maybe altered if necessary.
Raw data from the individual particles is stored in real- time for postsampling analysis and display. During the analysis, particles are ascribedan Asymmetry Factor, or asphericity factor, which relates to the degree ofasymmetry intheir spatial light scattering profiles. Thus sphericalparticles have factor 0 and fibrous particles factor 100. Cumulativeparticle data plots may then be displayed showing particle Size vs. Frequency,Asymmetry Factor vs Frequency, and perhaps most interestingly, Size vs.Asymmetry vs. Frequency. The three-dimensional surface produced by thelatter process represents a characteristic signature of the ambient aerosol,and early results indicate that possibly pertinent features, such as, forexample, the presence of a low concentrtion of spherical particles (ordroplets) in a non-spherical particle population, or the presence of fibrousparticles, may be determined from the surface .topology.
Current work is examining the degree of orientation experienced bynon-spherical particles in the laminar-flow system used for particle deliveryinto the chamber, and on the scattering properties of a variety ofparticulates including salt crystals, coal dusts, industrial fibre dusts, andsome naturally occurring pollens.
I56
L , 4 -.. .. _III

SAMPLING ARTIFACTS FROM CURVED AIRPORNE INTAKE SYSTEMS
B.J. Huebert, W. Warren, and G. LeeCenter for Atmospheric Chemistry StudiesGraduate School of OceanographyUniversity of Rhode Island
Narragansett, RI 02882-1197USA
Although many investigators have collected aerosols from airborneplatforms, the passing efficiency of the common curved- tube intake systemshas not been carefully measured under actual flight conditions. We willreport on in-flight comparisons between a variety of intake geometries,including one which has no curved intake tube. our preliminary data suggestthat the losses in curved intakes are far larger than we had previouslyimagined, so that the data from earlier programs may in fact be lower limitsto actual aerosol concentrations.
57

A STUDY OF PARTICULATE RESUSPENSIN FROM AN ASH-DUMP
J.S. Pastuszka, J. Dybizbanski and M. BorowskaInstitute of Environmental Protection
Environmental Pollution Abatement CentreKossutha St. 6, 40-832 Katowice, Poland
Measurements were carried out of the mass concentration of particlesresuspended from an ash-dump of coal-fired power plant as well as a windvelocity at the height 1.5 m.
The threshold wind velocity vt was obtained as about 2.3 ms- 1 from therelation of aerosol concentration as a function of windspeed. Theseinvestigations were performed by use of the Model 3500 Respirable Aerosol MassMonitor - Piezobalance at 200 m downwind distance from the dump.
The simple box model was also studied in detail by applying it to a dustresuspension from the ash-dump of coal-fired power plant. From theseconsiderations the surface emission values as a function of windspeed wereestimated. Based on the measurements of aerosol mass concentrations madewith the Staplex High-Volume Salers, calculations predict surface emissionsas 0.98; 1.35 and 28.01 mgn-2 s for the windspeed 5,6 and 10 ms- 1
respectively.
These results indicate that the model can provide information necessaryfor the study of the influence of individual surface resuspension sources onthe lower atmosphere.
58
I mm S .mmmmm mmmm

APPLICATION OF AN ISOTHERMAL HAZE CHAMBER TO STUDIES OF MIXEDSOLUBLE/INSOLUBLE ANTHROPOGENIC PARTICLES
C.F. RogersDesert Research Institute
Reno, NevadaUSA
Anthropogenic aerosol particles such as those resulting from petroleumfuel combustion have been found to be composed of elemental carbon, organiccarbon, and sometimes internally mixed water-soluble compounds. Particlesthat are mostly water soluble, and are of sufficiently large size, are likelyto be activated as atmospheric cloud condensation nuclei (CCN), and aresubject to relatively rapid atmospheric removal. Smaller particles, or thosecontaining only marginal amounts of water soluble compounds, will be resistantto activation and "nucleation scavenging", and thus are candidates for longerresidence times in the atmosphere. These anthropogenic nuclei may bedetected at remote sites, in low concentrations, where water nucleationmeasurement techniques provide one method of distinguishing them from othermixed or mostly soluble particles. This differentiation is clearlydemonstrated on a size-critical supersaturation (Sc) plot, generated byelectrostatic size classification (EC) of the sample particles, and subsequentmeasurement of their Sc spectra by means of an isothermal haze chamber (IHC).
In this application, IHC devices have an advantage over other CCN detectorsin that the difference in behaviour between sparingly soluble and mostlysoluble particles is accentuated by the application of the 1.00 (or less)saturation ratio in the IHC, as opposed to the supersaturations applied inother types of CCN detectors. For example, the equilibrium diameters of theparticles in the two types of chambers may differ by as much as a factor often. A measurement system consisting of an EC/IHC combination has been builtand carefully calibrated using pure soluble monodisperse particles. Thechamber operates at RH lower than 100% by using saturated solutions. Dataobtained with this system, when applied to typical fuel smoke particles, willbe presented.
59
L,

MICROPHYSICAL CHARACTERISTICS EVOLUTION OF THE NATURAL AEROSOLJUST BEFORE FOG FORMATION
R. SerpolayOPGC, 12 Avenue des Landais63000 Clermont FD (France)
Air samplings realized in conditions where fog formation was possiblerevealed the microphysical reality of a particularly coherent continuitybetween:
1) the cloud condensation nuclei (visual range conditions well above 1 km),the detection and study of which could only be achieved by an isothermal hazechamber with respect to their condensation activity (supersaturation spectra),and
2) the nuclei droplet (haze conditions with visual range around 1 Ian) and/orthe fog droplets induced by the preceding nuclei (visual range below 0.8 Ian),all particles detectable with the help of a size spectrometer.
In other respects, the data of the haze chamber used as above in 1) havebeen quite representative of a further fog formation in as much as thej relative humidity of the air reached at least 100%.
I
i 60

PERIODICITY OF EXTINCTION CURVE OF DIELECTRIC SPHERICAL PARTICLES
P. Chtlek and J. ZhanSchool of Meteorology and Department of Physics
University of OklahomaNorman, OK, USA
S.G. JenningsDepartment of PhysicsUniversity CollegeGalway, Ireland
We have shown that in the large size parameter region (x>>n2/2) theRe(an + bn) is independent of the summation index n. For real refractiveindices r<2.5 the dominating term of Re(an + bn) has the x-dependence of theform sin[ [(m-l)x] leading to the periodicity of Re(a + bn ) and of theextinction curve Qext(x) given by Ax = u /(m-l). Te derived periodicity isthe same as the periodicity of interference structure derived using theanomalous diffraction condition m-1<<1. At refractive indices m>2.5 theextinction curve does not have a simple periodic structure, since severalterms of approximately equal magnitude and different x-dependence contributeto the Re(an + bn).
61
jr61
! n n mm lmmnmn • N n m~nm nA

/
OBSERVATIONS OF A POSSIBLE GOBI DUST EVENT BY INFRAREDLIDAR NEAR MAUNA IDA, HAWAII
M.J. PostNOAA Wave Propagation Laboratory
Boulder, Colorado 80303USA
D.A. BowdleJohnson Research Center
University of Alabama at HuntsvilleHuntsville, AL 35899
USA
During November and December 1988 NOAA's Doppler Lidar was stationed nearthe GMCC climatic observatory on the slope of Hawaii's Mauna Loa volcano. Wewere participating in a NASA sponsored experiment to measure vertical aerosolbackscattering profiles at 10.59 and 9.25 micrors wavelength under clean, orbackground, conditions, and to compare our measurements with in- situcamplers. In this regard the experiment was very successful. But onDecember 2 we also observed highly enhanced aerosol loading in severalelevated layers for tens of hour. These layers advected over us from theeast, then settled through the altitude of the lidar and the observatory(approximately 3.5 km ASL). In this paper we will analyze the temporal andspatial development of the event as observed by the lidar, and include datathat were acquired sinultaneously with several types of particle samplers fromGMCC, Georgia Institute of Technology, and the University of Hawaii. We hopealso to include back- trajectories of the air parcels in question forindication of the aerosols' source.
62
Ia ___________,__________
nnndnmn llmnm l

AEROSOL BACKSCATTERING CLL-TOI GIES AS OBSERVED BYINFRARED LIDAR
M.J. PostNOAA Wave Propagation Laboratory
Boulder, Colorado 80303USA
We present analyses of several years of lidar backscatter data acquirednear Boulder, Colorado at 10.59 microns wavelength, and of one month of dataacquired in Fall 1988 in clean Pacific air near Mauna Loa, Hawaii at 10.59 and9.25 microns wavelength. The continental profiles include data before,during and after the El Chichon event, from which we deduce purging timeconstants on a global scale for both the stratosphere and the troposphere, andhypothesize that tropopause folding is responsible for significant amounts ofstratosphere/troposphere exchange. In contrast, the more recent continentaland Pacific Statistical analyses of the data show that many of the backscattervalues are log-normally distributed, indicating single sources andproportional diffusion of aerosol-ladened upper air parcels.
63
AN INTERACTIVE MODEL FOR PREDICTING SCATTERING FUNCTIONSOF POLYDISPERSE AEROSOLS
P.C. ReistDepartment of Environmental Science and Engineering
University of North CarolinaChapel Hill, NC 27514
USA
W. WilsonAtmospheric Research and Exp. Assessment Laboratory
U.S. EPAMail drop MD-75
Research Triangle Park, NC 27711USA
Details of a PC-based computer model for predicting optical properties ofpolydisperse aerosols are presented. This program permits the user tocomte extinction and angular scattering functions for aerosols of arbitrarysize distribution and illuminating light spectral properties. The effect ofrelative humidity on optical properties can be included. Calculations arecarried out in an efficient manner with a minimum of delay between input andoutput. The program is available for general distribution.
I
64
- C -
4.i

I
CONCENTRATION OF SOME AEROSOL COMPONENTS AND ITS INFLUENCE
ON GLOBAL SOLAR RADIATION ABSORPTION AND SCATTERINGIN CENTRAL PART OF UPPER SILASIAN INDUSTRY REGION, POLAND
A. SztylerInstitut of Environmental Protection
Kossutha 6,40-832 Katowice, Poland
The work will be based on simultaneous measurements of aerosol componentslike elemental carbon, sulfates and nitrates and actinometric parameters,direct and total global solar radiation, which have been carried out duringapproximately 2.5 years, 1987 - 1989 on Katowice - Zaleze station.
In the paper will be preliminary presented reciprocal relationshipsbetween mentioned aerosol components and its influence on absorbed andscattered shortwave solar energy reaching the earth's surface.
65
A

BACKGROUND AIR QUALITY AND DEPOSITION OF TRACE ELEMENTSIN THE PROVINCE OF SOUTH-HOLLAND
J. van DaalenDienst Centraal ilieubeheer Rijnmond
,s Gravelandseqeg 5653119 XT SchiedamThe Netherlands
Recently a survey was made of the aerosol/trace element situation inSouth-Holland, the Netherlands, consisting of an emission inventory andmeasurements of the background air quality and background deposition values,following a general survey of the background air pollution in the wholecountry. Use was made of high volume samplers, medium volume samplers,cascade impactors and moss.
There are no large man-made sources of trace elements in the province.Relatively large emissions come from oil refining, waste combustion andtraffic. In fact, the emissions in the province, as well as in the wholecountry, are very low compared to the emissions in the surrounding countries.The absence of large sources is reflected in the values of the (background)
air pollution. Analysis of the measured values shows that the greater partof the aerosols comes from the surrounding countries.
For cadmium a further analysis was made: the total economic andenvironmental input, accumulation and output were analysed. It was foundthat the depositioi of cadmium alone exceeds the decrease of cadmium in thesoil from harvesting crops and leaching. Even with an estimate for thefraction of cadmium from natural sources, such as soil dust and sea spray, thedeposition of cadmium from man-made sources still only just about balances thedecrease of cadmium in the soil. This means that where no crops areharvested, as in nature reserves, or where fertilizer, manure, sewage sludgeor compost is used, a steady increase of cadmium in the ground, and hence invegetation and organisms is foreseen. As it is predicted that cadmiumaccumulates in the economic cycle and more waste incineration will take place,the (background) air pollution of cadmium, and probably of several more traceelements, will increase, unless preventive measures are taken. Thecontinuing increase of cadmium in the environment will, in due time, become athreat to the ecological systems and to the economy.
6
66
I-..
I n l _l H Hi a ma i i i ll l i a

II
STUDY OF ATMOSPHERIC AEROSOLS IN A TERRAIN-INDUCED NOCTURALBOUNDARY LAYER USING BISTATIC LIDAR
P.C.S. Devara and P. Ernest RajIndian Institute of Tropical Meteorology
Pune-411 008India
The aerosol content of the lower atmosphere fluctuates under thecontinuous influence of particle source and deposition mechanisms. Thesefluctuations in aerosol amount, particularly in the atmospheric boundary layercan easily be monitoried by means of lidar as the scattering from aerosolparticles contributes a maximum to the lidaxy backscattered intensity in thisregion. Thus the inhomogeneities in ambient aerosol content can be used astracers of the structure and stratification of the nocturnal boundary layerwhich can be attributed to the phenomena of convective activity andturbulence. Better height resolution can be achieved with lidars and theseinstruments have been in use for investigating small-scale atmosphericphenomena.I! A bistatic lidar has been developed at the Indian Institute of TropicalMeteorology, Pune, India for sensing lower atmospheric aerosol characteristicsremotely. The measuring site is surrounded by hillocks which affect theaerosol transport particularly in the lower levels. The aerosol verticalprofiles (20-1000 metres) obtained during night-time between 2000-2130 hrs ISTto 20 June, 13 October, 11 November and 8 December 1988 have been presented inthis paper. These profiles have been measured at a height interval of 20metres to study the stratified aerosol layered structure. Moreover,normalised concentration gradients (NCG) have been computed from theseprofiles to extract information on layer characteristics. It is observedthat the gradient was very steep up to 150 metres on all the four experimentalnights. The profile measured in June showed thin layers throughout theheight region while those obtained in the other three months exhibitedrelatively smooth altitudinal variation. However, the overall concentrationof aerosol particles in the lowest part of the atmosphere was found to be highin October, November and December when compared to June which corroborates theearlier studies of aerosols at this station. In order to examine thealtitude structures, the above aerosol profiles are compared with the profilesof radiometersonde derived temperature and bellonsonde derived winds. Theresults are explained on the basis of terrain effects and stratifiedturbulence that prevailed at the station on the above four days.
67
7.-
VERTICAL PROFILE AND ELEMNTAL CONCENTRATIONSOF AEROSOLS IN A FOREST AREA
K. Hameri, M. Kulmala, S. Ylatalo, and U. TapperUniversity of Helsinki, Department of Physics
Siltavuorenpenger 20D, SF-00170 Helsinki
T. RaunemaaUniversity of Kuopio
Department of Environmental SciencesPOB 6, SF-70211 Kuopio, Finland
During summers 1987 and 1988 four one week period stacked filter unitmeasurements were carried out in Hyytiala, area which can be considered asbackground area in Finland. The sampling periods varied from 12 h to 2 d.The size distributions of aerosols were determined during sampling periodswith ten stage HAUKE low pressure impactor. The mass concentrations ofairborne particles were measured both in fine (aerodynamic diameter < 1 jim)and coarse (> 1 pm) fractions using Nuclepore filters. Stacked filter unitswere situated in a meteorological tower at heights 3, 6 and 9 m which made itpossible to obtain the vertical profile of mass and element concentrations.The top of the tower was 3-4 meters above the forest cae-.. Alsometeorological data were registered simultaneously. ", ciculate matterwas analysed using the elemental analysis method PIXE.
Mass distributions show that particle matter is divided between the fineand coarse fraction but elemental analysis show that certain elements like K,Ca, Si and Fe appear quite differently in these fractions. The most intenseelement analysed by PIXE was silicon.
Vertical profiles for the elements differ also. Si and Fe have sourcesin the ground as their concentrations systematically decrease when going fromground to top. S in fine particle fraction varies much with time reflectingtransport from ourside but it also may have sources inside the forest.Strikingly, S was high during nights. K and Ca have no systematic profile sothey have sources inside the forest. These sources are varying, mostprobably with the meteorology. It was remarkable that Cl was found inside aforest in the site located far from coast. As a conclusion internal cyclingof elements inside the forest has an important role when analysing backgroundpollution.
68
I4\

MODELLING DRY DEPOSITION OF PARTICLES TO THE OCEAN
P. Hummelshoj,Meteorology and Wind Energy Department,
Riso National Laboratory,DK-4000 Roskilde,
Denmark.
C. Hansen,Geophysical Institute,
University of Copenhagen,Haraldsgad. 6,
DK-2200 Copenhagen N,Denmark.
It is well known that some of the particles in the ocean mixed layerderives from the atmosphere, but it is generally unknown how large theatmospheric input is. A resistance model to describe the transport ofparticles to the ocean has been developed. The transport is expressed interms of the deposition velocity, vd. No chemical or biological processes isincluded in the model, but only physical processes. The processes, which isincluded in the model is sedimentation, including hygroscopic growth of wetparticles, Brownian diffusion, atmospheric (turbulent) diffusion and wash outby spray-droplets from whitecaps. The model operates in three differentlayers: a turbulent well mixed layer, a laminar sublayer just above thesmooth surface and a turbulent sublayer just above the whitecaps. Thepurpose of making this model is to provide a tool for a critical evaluationof the relative importance of the individual processes. At this stage, it istherefore a model which is primarily intended to serve as a basis fortheoretical discussions.
Of the included parameters the wind speed, U(z), primarily through itseffect on the area with whitecaps, the particle diameter, and the particledensity, is found to be the most important.
69
MWELLING OF THE TRANSPORT OF WATER-SOLUBLE AEROSOLS BY ATROPICAL SQUALL LINE
M. Laube and P. ScheidgenInstitut fur Geophysik und meteorologie der Universitat zu Koln
Albertus-Magnus PlatzD-5000 Koln 41, FRG
A two-dimensional eulerian cloud-model is used to study the evolution ofa tropical squall line and the transport of water soluble aerosols. Thebasis of the meteorological data are observations during the COPT-experimentin Africa. The content of the cloud water, rain water, cloud ice and thewind components are computed over a period of 120 minutes in a domain of 40 x15 km with a vertical and horizontal resolution of 333 meters. Substances,which are emitted at the ground, are transported up to 12 km by the strongupdraft motion and are distributed in the horizontal direction. It will beshown, that there are high concentrations of ground emitted substances in thecloud level. The important role of correct parameterization of cloudmicrophysics on the evolution of the cloud and on the modelling of thescavenging and transport of water soluble aerosols are discussed.
70
4'

I |
TRANSPORT, CHEInSTRY AND DEPOSITION OF AIRBORNE GASEOUSAND PARTICULATE POLLUTANTS IN A MARINE ENVIOI41ENT
S.M. Joffre and V. LindforsFinnish MWteorological Institute
Air Quality -Opartment Sahaajankatu 22ESF-00810 Helsinki
Finland
We report on shipborne measurements carried out during a cruise acrossthe Baltic Sea in April-June 1985. Concentration levels of both gaseous(SOZ, HO 3, NH3 , Hg, PAH) and particulate (S04_, N03-, NH4+ , PAH) compoundsindicate that the Baltic Sea cannot be considered as a remote clean area.Meteorological patterns explained much of the time evolution of theconcentrations. The ratio SO2/SO4', related to the conversion rate ofsulphur dioxide to particulate sulphate, was generally smaller than one anddepended on relative humidity and ammonia concentration. The highcorrelation between sulphate, nitrate and ammonium ions can be explained bytheir anthropogenic origin and their occurrence under the form of salt. Theprobability for ammonium nitrate particles to exist in the meteorologicalconditions prevalent during the cruise, was found to be weak. Theexperimentally determined ammonium nitrate dissociation constants were in fairagreement with thermodynamical predictions, with the exception of clean aircases. Ammonia was found to have an uncertain path with possible marinesources, a weak correlation with other compounds, and a variable residencetime. These data, completed with corresponding observations from coastalEMEP-stations, allowed us to assess the dry deposition rate and the chemicaltransformation rate coefficients in a simple transport-scavenging model forsulphur compounts. The results were satisfactory for the dry depositionvelocity, v-d agreed with the predictions of a theoretical model, but wereconflicting for the transformation rate, and very sensitive to the variousassumptions made in the computations.
71

IONIC BALANCES IN MARINE RAINWATER WITH A SPECIAL EMPHASISON SOURCES OF ALKALINE AND ACIDIC SPECIES
R. Losno, G. Bergametti, P. Carlier and G. MouvierLaboratoire do Physico-Chimie de l'Atmosphere
Universite PARIS 72, Place Jussieu 75251
Paris CEDEX 05
Rainwaters were collected in ultra clean conditions during three fieldexperiments (two in Corsica Island and one during a North-South Atlantictransect of the 1988 "Polarstern" cruise). These rainwaters are immediatelyfiltered and the major ions were measured by ionic chromatography, atomicabsorption and colorimetric methods.
In these marine areas, the concentrations of major ions range over one ortwo orders of magnitude and are generally dominated by the redissolution inrainwater of the sea salts. The non-sea salt component in rainwater shows thepresence of the anthropogenic nitric and sulfuric acids which are wellcorrelated with the origin of the air masses and which lead to acidic rains(pH from 4 to 5).
High values of pH (6-7) are also observed and can be explained by theneutralization of strong acids by natural alkaline dust as calcite, which aremainly transported from the desert areas of the African continent. A studyof these ionic balances in relation with 3D air mass trajectories allows oneto demonstrate the composition of these two components during African dusttransports.
72
r'-

CONCENTRATION PROFILES OF TRACE ELEMENTS OVER THE NORTH SEAAND THE ATLANTIC OCEAN: ANTHROPOGENIC AND NATURAL CONTRIBUTION
R. Losno, P. Carlier and G. BerganettiLaboratoire de Physico-Chimie de !'Atmosphere
Universite PARIS 72, Place Jussieu 75251
Paris CEDEX 05
During a 1988 "Polarstern" cruise, eighteen aerosol samples werecollected over the North Sea and the Atlantic Ocean (between 53°N and 32
0S) in
ultra clean conditions. Measurements of trace elements (Al, Si, P, S, Mn,Zn ..) were performed by X-Ray fluorescence.
The latitudinal profile exhibits a strong decrease of particulateconcentrations for pollutants as Zn or S*. In the North Sea, concentrationsas high as 3500 ng.m- of sulfur and 50 ng.m
-f of zinc were observed while the
concentrations are in the order of 500 ng.m-3
and I ng.m-3
respectively in theSouthern Hemisphere and Tropical North Atlantic. These results point out thestrong influence of the anthropogenic emissions of the North Europeancountries on the atmosphere of the marine areas.
On the contrary, soil derived particles (as indicated by Al or Siconcentrations) show high concentrations between 40°N and 10°N. 3D air masstrajectories indicate that such high concentrations over the Tropical NorthAtlantic are related to Saharan dust events.
Obviously, elements associated to both anthropogenic and crustal sources(P and Mn) presented a mixed profile of concentrations.
73

DIURNAL VARIATION OF THE CONCENTRATIONS OF RADON AND ITSSHORTLIVED DAUGHTERS IN THE ATMOSPHERE NEAR THE GROUND
J. Porstendorfer, G. Butterweck and A. ReinekingZentrales Isotopenlabor der Georg August Universitat
D-3400 Gottingen, FRG
In connection with deposition studies of aerosol on vegetation, besides thesize distribution of the aerosol the vertical turbulent diffusivity is themost important meteorological parameter, which influences the behaviour of theaerosol particle in the surface layer of the atmosphere. From the verticalprofile of the radon concentration and the state of equilibrium between radonand its daughters above the canopy the vertical turbulent diffusivity can becalculated.
The diurnal variation of radon (Rn-222) and the radon daughters (Po-218 (RaA),Pb-214 (RaB, Bi-214 (RaC) concentrations have been measured simultaneously at0.2, 0.7, 1.2 and 3.2 m above the ground. At the same positions themeterological parameters, temperature and wind velocity, were continuouslyregistered. The variation of the concentration profiles and the derivedvalues for the turbulent mixing during a day and at different weatherconditions are discussed.
74

REMOVAL OF AIR BORNE PARTICLES BY RAIN DROPS
M. Taheri and Sh. AyatollahiChemical Engineering Department
Shiraz UniversityShiraz, Iran
A mathematical model was developed for removal of airborne particles byrain drops. In this model separation of sell particles by inertia anddiffusional mechanisms are considered on individual drops. Then a materialbalance over a volume element was carried out in order to take into accountthe effect of rainfall and wind velocity. The results indicate that theremoval rate increases for particle above 0.2 micrometer as the particle sizeincreases. For particles below 0.2 micrometer the trend is reversed and theremoval rate increases as the particle size decreases.
75
CONFERENCE PAPER PRESENTATIONS
(CONTINUED)
76

LONG RANGE TRANSPORT OF AEROSOLS
Ruprecht Jaenicke,Institute for Meteorology,
University of Mainz.Federal Republic of Germany
Across Europe, rather usual acidic precipitation is reported. Theaverage pH-value is slightly more than 4 with a considerable standardvariation. As usual, such an average is only half the story. A closeinspection of the data set evailable in Mainz shows a two peaked frequencydistribution with an acidic peak as mentioned above and a peak around pl=6,well on the basic side for rain. Basic rain is reported in pronounced casesof airmass transport from the South-West and furthermore from Northern Africa.Obviously, this is Saharan air. With multiday backward trajectory analysisfor all the other cases of basic pH, the trajectories always pass over theSaharan desert. For Central Europe, the latest case occurred on May 1, 1989.Saharan air arrived from the North-East having travelled more than 5 days overEastern Europe and a distance of more than 4500 km. Transport over such a longdistance is a regular phenomenon for Saharan dust across the Atlantic oceantowards the Caribbean Sea.
Mineral dust is an excellent tracer for long range transport, because itis hardly modified during transport. Radioactivity attached to aerosolparticles is of equal use, and the Chernobyl accident case has shown atransport distance equal to that of the Saharan desert dust.
There are many isolated reports of long range transport of specificaerosol substances in the past. Under stratospheric conditions in the absenceof clouds and precipitation, such a long transport seems to be easy, as thevolcanic eruptions with the worldwide spread of dust and the drastic effectson temperature and light scatter show.
For aerosols, the troposphere usually seems to inhibit such a longtransport. Usually for the troposphere spread and dilution of material isassumed to lower quickly and drastically the concentration of freshly releasedtrace substances thus reducing its effects. So only very substantialexplosions of material could be detected far downwind. There are indicationsthat the tropospheric spread and dilution is not so ormipotent as usuallyassumed, thus keeping an aerosol cloud together and delivering rather highconcentrations of aerosols to far away places. As an example, the watervapour of the atmosphere with a residence time of 10 days is comparable tothat of the natural aerosol. The confinement of water clouds bythermodynamical atmospheric processes can be seen visually and on satelliteimages in the infrared. A long distance transport of aerosol clouds certainlyhas an influence on our understanding of background aerosols and theirexistence in an atmosphere faced with an increasing number of anthropogenicaerosol sources and substances. This question has never been investigatetsystematically, but certainly deserves more attention for promoting ourunderstanding of the natural aerosol and the atmosphere.
77
V&_ m I I Im
TROPOSPHERIC AEROSOL SIZE DISTRIBUTIONS IN EASTERN AND NORTHERNNORTH AMERICA BETWEEN 1982 AND 1988:
A SIGNATURE FOR TROPOSPHERE-STRATOSPHERE EXCHANGE?
W.R. Leaitch and G.A. IsaacAtmospheric Environment Service
4905 Dufferin St.Downsview, Ontario, Canada M3H 5T4
The size distribution of the 1000-500 mb tropospheric aerosol wascharacterized at 5 North American locations from 1982 until 1988 using lightscattering instruments. The instruments, a Particle Measuring SystemsASASP-100X and a PMS FSSP-100, were mounted under one wing of a Twin Otteraircraft. This ASASP measures particles between about 0.17 m and 2.0 gmdiameter, and this FSSP measurds particles between about 1 sm and 35 ±m. Thedata set is comprised from 7 studies each of 4-9 weeks duration: centralOntario, June-July 1982; central Ontario, January- February, 1984; upper NewYork state, October-November 1984; Nova Scotia, January-March 1986; theCanadian high arctic, April 1986; southern Quebec, February 1987; andcentral Ontario, July-August 1988. Except near primary source regions (e.g.oceans) particles in the range 0.17-0.5 pm generally dominate the sizedistributions, to the extent that the distributions are more nearlymonodisperse than previously indicated (the range of the geometric standarddeviation of the particles between 0.17 Am and 0.7 .m ranges is 1.22-1.26).When flying through clouds reductions in the number concentrations of theseparticles correlate very strongly with increases in cloud droplet numberconcentrations, indicating these particles are responsible for shaping themicrophysical character of liquid-water clouds. A secondary mode near 0.7 pmis present in many of the later winter and spring spectra when the totalnumber concentration of particles is very low. The evidence is constant withthis being a real phenomenon rather than an artifact of light scattering.Some of the possible explanations for the mode near 0.75 include marineaerosols, desert aerosols, or simply the evolution of the particle spectra viawet scavenging, coagulation, settling, and gas-to-particle conversion. Mostof the evidence, however, points to the stratosphere as the source. If theseparticles can be verified as originating in the stratosphere, then this mayprovide a new tool for studying the exchange of air between the troposphereand the stratosphere.
78
I.

AEROSOL MEASUREMENTS IN THE SOUTHWEST PACIFIC
I.S. Lechner, G.W. Fisher, M.J. Harvey, H.R. Larsenand R.A. Knobben
New Zealand Meteorological ServiceP.O.Box 722, Wellington
New Zealand
Measurements of the physical characteristics and chemical composition ofthe atmospheric aerosol have been made around New Zealand and other southwestPacific Islands from an instrumented aircraft between 1985 and 1988.Latitudes ranged from 46 OS to 1.5 ON at altitudes of up to 6 km. Sinqleparticle optical counters were used to cover the sizo range 0.1 pm to 16 Ymdiameter.
The results showed that in the free troposphere aerosol concentrationsranged from 2 ml-1 to 50 ml- l and the size distributions could becharacterised by a Junge slope of around - 3.5. Most of the aerosol was dryor hydrated sulphur containing particles. Potassium containing particleswere also found over a wide range of latitudes.
In the planetary boundary layer the concentrations were generally greaterand more variable and the size distributions often bimodal.
79
£Ii.

VERTICAL PROFILES OF AEROSOL PROPERTIESIN THE ARCTIC SUMMER TROPOSPHERE
J. Heintzenberg, J. Strom, J.A. Ogren and L. GardneusDepartment of MeteorologyUniversity of Stockholm
S-10691 StockholmSWEDEN
The Arctic summer troposphere probably is the cleanest region in the northernhemisphere. In cloud-free surface air, total particle concentrations down to1/cm3 and total mass concentrations down to about 100 ng m- 3 have beenmeasured and the major chemical components of this aerosol have beendetermined. Very little, though, is known about the vertical distribution ofaerosol properties in this remote region.
In connection with the Marginal Ice Zone Experiment (MIZEX-84) a large numberof flight measurements were made in the Framstrait area during June and July,1984. With an aerosol payload onboard the German research aircraft Falcon,total number concentrations and integrating nephelometer measurements wereperformed from the boundary layer up to six kilometer altitude. Simultaneoustemperature, humidity and cloudphysical measurements were used to exclude
cloud passages and high humidity situations from the data. From the cleaneddata set average vertical profiles and confidence intervals of numberconcentration and particulate light scattering were calculated.
The results show rather even concentrations from the ground up to six
kilometers. Layers with elevated concentrations were found at about 1.5 km(level of most frequent long-range transport), four km (local inversion) andsix km (near the tropopause inversion). With three-dimensional backtrajectories from the flight area, pathways and origin of the air masses willbe explored in our presentation.
80
• n I'anmmimm I IH~ ~~~~~ini
. mih-i~aio
VERTICAL PROFILES OF AEROSOL TO 7 KM IN THE ARID SOUTHWESTERN US
R.G. Pinnick, G. Fernandez, D.M. Garvey and E.H. HoltUS Army Atmospheric Sciences Laboratory
White Sands Missile Range, NM 88002USA
Concentrations of natural occurring aerosol were measured to 7 kmaltitude using aircraft-borne light scattering aerosol counters during Juneand September of 1988. Particles with equivalent diameter 0.2-10 micrometershow little vertical variation in the mixing layer (below about 4 km); abovethe mixed layer a significant decrease in concentration is observed throughoutthe size range. Decreases in concentration above the mixed layer aretypically a factor of 5 to 10 for June, and for September aerosolconcentrations decrease two orders of magnitude from the top of the mixedlayer to 7 km. Aerosol concentration vertical profiles are compared toprevious measurements of Fitch and Cress (1), Kondratyev (2), Krekov andRakhimov (3), Rosen et al (4,5) and Rosen and Hofmann (6).
References:
(1) Fitch, B.W. and T. Cress, Spacial and temporal variations of tropospheric* aerosol volume distributions, J. Climate and Appl. Met., 22 p 1262 (1983).
(2) Kondratyev, K. Atmospheric aerosol and its impact on radiation transfer,Leningrad, Gidrometeoizdat, 224 pp (1983).
(3) Krekov, G.M., and R. Rakhimov, Optico radar model of the continentalaerosol, Novosibirsk, Nauka, 198 pp (1982).
(4) Rosen, J.M., D. Hofmann, and J. Laby, Stratospheric aerosol measurementsII, the worldwide distribution, J. Atmos. Sci, 32, p.1457 (1975).
(5) Rosen, J.M., D. Hofmann, and K. Kaselau, Vertical profiles ofcondensation nuclei, J. Appl. Met. 17, p.1737 (1978).
(6) Rosen, J.M. and D. Hofmann, On the background stratospheric aerosollayer, J. Atmos. Sci. 38, p.168 (1981).
81
JF
ATMOSPHERIC TRANSPORT OF SULFUR AND NITROGEN ACROSS THEATLANTIC OCEAN FROM NORTH AMERICA TO EUROPE
J.N. GallowayEnvironmental Sciences Department
Clark Hall, University of VirginiaCharlottesville, Virginia 22903
USA
D.M. WhelpdaleAtmospheric Environment Service
Environment Canada4905 Dufferin St.
Downsview, Ontario M4H 5T4Canada
This paper addresses the subject of the long range transport of sulfurand nitrogen from North America to Europe.
The results of the Western North Atlantic Ocean Experiment [WATOX] areused to show that about thirty percent of the S and N emitted to the NorthAmerican atmosphere is transported eastward to the atmosphere of the westernNorth Atlantic Ocean. Of this material, up to fifty percent is transportedto the North Atlantic Atmosphere east of 60W.
The impact of these emissions on the composition of the central andeastern North Atlantic Ocean atmosphere is examined using eight years of dataon the composition of precipitation from Bermuda and four years of data fromthe west coast of Ireland at Adrigole.
In conjunction with this analysis of precipitation chemistry data, wealso use information on the emissions of S and N to the European atmospheretogether with estimates of the eastward transport of these species from Europeto the eastern North Atlantic atmosphere.
Significant findings are that the composition of precipitation over mostof the North Atlantic Ocean is contaminated with anthropogenic emissions.Over the western North Atlantic Ocean, the sources are predominantly NorthAmerican. Over the eastern North Atlantic Ocean, the sources arepredominantly European.
82
a

LONG-RANGE TRANSPORT OF TRACE METALS TONORTH EUROPEAN MARGINAL SEAS
G. Petersen and H. WeberGKSS Research CentreInstitute of Physics
Postfach 1160, D2054 GeesthachtFederal Republic of Germany
H. GrasslUniversity of Hamburg
Institute of MeteorologyBundesstrasse 55, D-2000 Hamburg 13
Federal Republic of Germany
J. PacynaNILU Norwegian Institute for Air Research
Postboks 64N-2001 Lillestrom, Norway
Within the frameworic of a research contract with the German FederalEnvironmental Agency the long range transport of trace metals over Europe andthe deposition into the North Sea and the Baltic Sea are estimated using theENEP-(European Monitoring and Evaluation Programme) trajectory model. Theresults for the total atmospheric deposition into the North Sea and the BalticSea show, that the calculated values are lower than previous estimates basedon extrapolations from measurements at coastal sites and ship measurements inthe southern Baltic Sea, respectively.
To verify the model results calculated atmospheric concentrations of leadwere compared with observed concentrations at two locations at the Germancoast of the North Sea and Baltic Sea. Good agreement between the measuredand calculated concentrations was obtained for these two locations relativelyclose to the main emission areas in Central Europe suggesting that theemissions are accurately assessed and that the model is able to predict thetotal deposition into the entire sea areas reasonably well.
Currently the model verification is extended by a comparison withmeasurement data from 9 locations along a meridional cut ranging from Birkenesin southern Norwan to Ny Alesund, Spitsbergen, in the Norwegian Arctic.Preliminary results indicate that the model tends to underpredict atmosphericconcentrations remote from the major emission areas. It is expected that theplanned refinements in the parameterization of the deposition processes willimprove the results.
Moreover, an attempt is made to identify natural background concentrationlevels at measurement stations in the Norwegian arctic. This is done byusing calculated 96 h-backward trajectories for a classification of airsamples with respect to emission areas. During episodes when trajectoriesarrive from areas where no emissions occur the corresponding measurementvalues are considered to be the natural background level and to be used asinput data for the model.
83

SOURCE, TRANSPORT AND DEPOSITION OF LEAD IN THEMEDITERRANEAN ATMOSPHERE
E. Remoudaki, R. Losno, G. Bergametti and P. Buat-M4nardLaboratoire de Physico-chimie de l'Atmosphere
Universite Paris VIIUA CNRS 717, 2 place Jussieu75251 Paris Cedex 05, France
Beginning in 1985, a continuous aerosol sampling program has beenundertaken at a coastal location in Northwestern Corsica (WesternMediterranean sea). Twenty-four hours aerosol samples were collected on 0.4am pore size filters from a 10 m high tower. Total deposition (wet + dry)samples were collected during the same period with a time step of 15 days.
We only present in this paper the results concerning Pb. The temporalvariability of atmospheric particulate lead concentrations is discussed onvarious time scales (daily, seasonal, annual). The source-regions and theatmospheric pathway of particulate lead are identified by using 3D air-masstrajectories.
These factors, which are able to explain abrupt changes in atmospheric* concentrations of lead, are also used, in addition to precipitation rates, to
understand the variability of atmospheric deposition of lead over theNorthwestern Mediterranian.
84
EUROPEAN SOURCE AREA IDENTIFICATION AND APPORTIONMENTOF LONG RANGE TRANSPORTED AEROSOL
E. SwietlickiBirgitta Svantesson and Hans-Christen Hansson
Department of Nuclear PhysicsSolvegatan 14S-223 62 Lund
Sweden
In order to assess the impact of various European source areas on theambient aerosol in southern Sweden, samples were collected during the periodfrom April 1985 to December 1986 at three background stations situated onsmall islands along the south-eastern coast of Sweden. A specially designed,two-size fractionating, low-volume, midrocomputer-controlled sampler suitablefor automated aerosol sampling in remote locations was utilized. It allowsfor four weeks of continuous operation, with 12-hour sampling periods. Some600 of the fine fraction samples (D < 2 MLm) were selected for analysis, basedon the 96-hour air mass back trajectories. The elements S, K, Ca, Ti, V, Mn,Fe, Ni, Cu, Zn, Br and Pb were detected in the PIXE-analysis, and Na wasanalysed simultaneously taking advantage of the proton- induced gamma-rayemission. Prior to these analyses, a light attenuation technique was usedfor the analysis of elemental carbon (soot).
The wealth of data produced was subjected to a multivariate statisticalanalysis, mainly using the classification method SIMCA (Soft IndependentModelling of Class Analogy) and the regression method PLS (Partial LeastSquares regrbssion). Applying these methods on the data set showed that thelong-range trarsported aerosol originating from various larger European sourceareas have different chemical composition, and the observed differences arestatistically significant. This enables us to perform a source area-receptormodelling or. the long range transported aerosol based on discriminant-PLS.
At occasions of direct transport over the Baltic sea from one samplingstation to another (a distance of approximately 500 kilometres) a relativeincrease of S and Br and a decrease in Ca, Ti, Mn, Fe and Zn was observed.This is a direct observation of sulphur gas-to-particle conversion takingplace during long-range transportation. The increase in particulate Br isbelieved to emanate from the sea.
The two sampling stations located east and south of Stockholm, thecapital of Sweden with approximately 1 million inhabitants, enabled us tostudy the influence of this city on its surroundings. The results showedthat the plume of Stockholm was only clearly discernable when superimposed onclean air masses originating from the Northern Atlantic.
This work was supported by the Swedish National Environmental Protection Boardand Stockholms Miljo-och Halsoskyddsforvaltning.
85
m mmlm m m m .. . [mmmi • mmmm lm(a

THE INFLUENCE OF AMMONIA FROM AGRICULTURE ON TRENDS INBACKGROUND AEROSOL CONCENTRATIONS
H.M. ApSimon, M. Kruse-Plass, P. Stott and G. WhitecombeEnvironmental Safety Group
Mechanical Engineering DepartmentImperial CollegeLondon SW7 2AZ
UK
Due to the increase in agricultural production and livestock numbers,anonia emissions in Europa are estimated to have increased by about 50% since1950. This has happened concurrently with changes in anthropogenic emissionsof SO, and NOX .
The effect of greater amounts of ammonia is to increase the in-cloudoxidation of sulphur and ammonium aerosol production; however it alsoincreases the capacity of precipitation to deposit sulphur. This paper willraise questions about the net effect of higher ammonia emissions on export ofSOx to the free tropospheric circulation by venting aloft from storm systems,and the aerosol concentrations in boundary layer air leaving continentalEurope. It will be illustrated using computer modelling studies of selectedscenarios.
86
I.I II I I I I l i

ATMOSPHERIC ELECTRICITY IN GALWAY
J.C.H. van der HageInstitute for Meteorology and Oceanography
University of UtrechtThe Netherlands
More than once it has been tried to discern a trend in the electricalconductivity of the air over the oceans, indicating an increasing backgroundpollution of the atmosphere on a global scale (Cobb and Howard, 1970). But uptill now the measurements are two few and the scatter too great for such atrend to be demonstrated beyond doubts. This is due to the followingfactors:
A- The systematic decrease of the conductivity is a slow process if it existsat all.B- The values for the conductivity were obtained by various techniques.C- The results come from various floating locations on the ocean taken undervarying weather conditions and in various seasons.
Systematic errors as introduced by B and C can be avoided by measuringthe conductivity on a suitable coastal station. A near perfect location formonitoring the background conductivity of North Atlantic air would be theresearch station at Mace Head, Galway. Optical and chemical properties ofthe air are already studied there.
Apart from studying this particular trend there is another good reason toz establish a station for atmospheric electricity in Galway. The Royal
Meteorological Service (KMI) in Belgium runs a small national network ofatmospheric electricity stations. The addition of a station at Mace Headwould result in a European network at the expense of only a relatively smallinvestment.
Our institute in Utrecht has gained three years of experience in theconstruction and the continuous operation of atmospheric electricity sensorsunder severe marine conditions (V.d. Hage, 1988). The present author wouldgladly put this experience at the disposition of EURASAP by installing anatmospheric electricity station at Mace Head when funds are available, andanother one in the Netherlands.
87

SCAVENGING OF AEROSOL PARTICLES BY DRIZZLE AND PRECIPITATIONSIZED DROPS
B.T. McGann and S.G. JenningsDepartment of Experimental Physics
University CollegeGalway, Ireland
The efficiency E(a,r) with which aerosol particles of radius r (> 0.5 AM)are scavenged by a precipitation drop of radius a (under the simultaneousinfluence of gravity, drag, electrical forces, thermophoresis anddiffusiophoresis) has been determined by means of the trajectory model firstused by Grover et al (1977). For aerosol particles with radii r < 0.5 jminertial impaction can be ignored and the collision efficiency is determinedfrom the flux model of Wang et al (1978). Reasonable agreement of calculatedcollision efficiencies using the two models is obtained over the aerosolradius overlap region from 0.1 to 1.0 m. Collision efficiencies foraerosol-drop interactions were calculated at 900 mb atmospheric pressure and10 C ambient temperature for relative humidity values of 50, 75, 95 and 100%.The particle radius ranged from 0.5 to 5 Lm whilst the drops radius variedfrom 50 to 500 Lm.
The effect of scavenging of particles by three Marshall- Palmer (M-P)type distributions with precipitation rates of 5, 10.2 and 25 mm/hr , andduration of 5, 10 and 20 minutes on lognormal aerosol size distributionswithin radii limits 0.005 to 10 m is examined for a range of relativehumidity and electrical conditions. In addition, the percentage of aerosolparticles which are scavenged by precipitation drops possessing M-Pdistributions parameters as above is calculated.
88

A THEORETICAL STUDY OF THE WET REMOVAL OF TWO DIFFERENT TYPESOF AEROSOL PARTICLES BY MEANS OF A TWO DIMENSIONAL
DYNAMIC MODEL FOR A CONVECTIVE WARM CLOUD
A.I. Flossmann and H.R. PruppacherMeteorological Institute
Joh. Gutenberg UniversityD-6500 Mainz, FRG
A theoretical model has been formulated to study the scavenging ofaerosol particles by a warm convective cloud. The model uses detailedmicrophysics and follows the evolution of the droplet spectra, the aerosolparticle spectra in the air and the size distribution of the aerosol particlemass scavenged in the cloud drops at every grid point. The processesconsidered are activation of aerosol particles (nucleation scavenging),condensation and evaporation of particles and drops, impaction scavenging ofaerosol particles through drops, collision and coalescence of drops andbreakup of large drops. This microphysical scavenging model is embedded inthe two dimensional convective cloud model of Clark et al. Thus, thecomplete model allows to follow the aerosol mass scavenged during the cloudlife time and its deposition onto the ground.
This sophisticated scavenging model has been evaluated for the conditionsof day 261 of the GATE experiment.
The initial aerosol particle spectrum was assumed to be of maritime typeconsisting of a superposition of three log-normal distributions. The
nucleation and accumulation mode were assumed to consist of (NH4 ) 2 SO 4particles and the coarse mode was set to hold only NaCI particles. Theparticle spectra were assumed to decrease exponentially with height.
On this heterogeneous aerosol particle spectrum cloud drops form throughnucleation. When the cloud drops grow they continue to scavenge the twotypes of particles through impaction. Diffusional growth, collision andcoalescence and breakup mix the aerosol particle masses and redistribute theminside the drop spectra so that the main pollution mass is associated with themain water mass. The model allows to trace the location of the two differenttypes of particles inside the drop spectrum in the cloud and in the rain onthe ground. The results show reasonable agreement with field observations.
89
A mm

A FIELD STUDY ON IN-CLOUD REMOVAL OF AEROSOL PARTICLES
T. SchumannAtmospheric Physics
ETH ZurichSwitzerland
An extensive field campaign was undertaken aimed at observing interactionsbetween aerosol particles and hydrometeors during frontal passages withprecipitation in winter time. Observations were made at three ground-basedmeasuring stations along the north-western slope of Mount Rigi, CentralSwitzerland at 430 - 1620 m a.s.l. The stations were operated simultaneouslyand were capable of measuring major parameters in and below the clouds.Detailed radar observations of the incoming precipitation completed theobservations. Fifteen precipitation systems were observed, the majority ofthem induced by weak cold fronts. A number of investigations have alreadybeen carried out with parts of this data set and have been published recently(Schumann and Waldvogel (1987), Schumann et al. (1988) , Zinder et al (1988),Schumann (1989). This contribution expands the investigations to the studyof in-cloud removal processes.
A) In-cloud scavenging:Never reported before, size-dependent in-cloud scavenging efficiencies weredetermined. With the help of such efficiencies in-cloud scavenging could beexplained as a combination of pure nucleation scavenging (for 0.2-2 &mparticles) and impaction scavenging (by diffusive processes for particlessmaller than 0.2 ,m and by impaction processes for particles large than 2 pim).The case-to-case variability of determined efficiencies was very large, being
the result of the influence of simultaneous precipitation, the solubility ofthe aerosols, the number concentration of fine particles (d - 0.25 m), andthe maximum supersaturation reached during cloud formation. Theexperimentally determined efficiencies agree, at least qualitatively, withcurrent nucleation theories e.g. by Hanel (1987). Field experiments reportedby other authors reconfirm the mean total efficiency of 70% (by aerosolvolume) found in this study.
B) Precipitation chemistry:The inorganic ion concentrations found in aerosols and precipitation show thatthe precipitation first falling contains overproportional amounts of coarse,Ca enriched aerosol particles, indicating that the transformation of cloudwater to precipitating water favours droplets originating from particles withpronounced cloud condensation nuclei characteristics. The submicronparticles consisting primarily of NO3, S0 4
= and NH4 + are quickly incorporatedinto cloud water, but much less efficiently transformed into precipitatingwater than super- micron particles. The ion concentrations in below-cloudprecipitation are from both in-cloud and below-cloud levels with widelyvarying percentages.
References:
Hanel, G. (1987): The role of aerosol properties du: -- the conensationalstage of cloud: A reinvestigation of numerics and mi_ - iysics. Beitr. Phys.Atmosph. 60, 321-339.Schumann, T., and Waldvogel, A. (1987): Meteorological Effects on ambientaerosol size distributions. J. Aerosol Sci. 18, 821- 824.
90
L i

Schumann, T., Zinder, B., and Waldvogel, A. (1988): Aerosol and hydrometeorconcentrations and their chemical composition during winter precipitationalong a mountain slope. Part 1. Temporal evolution of the aerosol,microphysical and meteorological conditions, Atmos. Environ. 22, 1443-1459.
Zinder, B., Schumann, T., and Waldvogel, A. (1988): Aerosol and hydrometeorconcentrations and their chemical composition during winter precipitationalong a mountain slope Part II: The effect of inversions on below-cloudscavenging. Atmos. Environ. 22, 2741-2750.
Schumann, T. (1989): Precipitation scavenging of aerosol particles: Awintertime field study. Ph.D. thesis, ETH Zurich, Switzerland.
9I
91
4-

A THEORETICAL INVESTIGATION OF THE COLLECTION OF AEROSOLPARTICLES BY FALLING ICE CRYSTALS
N.L. MillerCentre for Environmental Research
Argonne National LaboratoryArgonne, Illinois 60439
USA
A numerical scheme which determines the collection efficiencies, kernelsand washout rates of aerosol particles (AP) by falling columnar and platelikeice crystals is presented. A theoretical model for the removal ofmicron-size APs by falling columnar ice crystals which incorporatesgravitational, inertial, thermophoretic, diffusiophoretic and electrostaticforcing has been formulated. This trajectory model which includes computedvelocity, temperature and water vapor density fields, was coupled to a fluxmodel which determines the removal of submicron particles due to Browniandiffusion, thermo and diffusio-phoresis as well as electrostatic forcing.This combined model indicates collection efficiencies for APs of radii 0.001to 10.0 microns for the columnar ice crystal size distribution. An earlierstudy provides AP collection efficiencies by ice crystal plates for the icecrystal plate size distribution.
The columnar ice crystal-aerosol particle collection model indicates thatefficiency increases with increasing pressure, temperature or electrostaticcharge and for decreasing relative humidity. An observed zero collectionzone near APs of about 2 microns in radius is seen as a near zero balance inthe radial forces.
Integrating the product of the computed collection kernels with theirappropriate ice crystal distribution will indicate the AP size dependentwashout rates. It is seen that ice crystal plates collect APs at
* significantly greater rates than columnar ice crystals for AP greater than0.05 microns. APs less than 0.05 microns are collected at the same rate byplates and columns.
The results of this collection rate scheme have been set up as a largedata set. This data can be applied to mesoscale air pollution models eitherdirectly or in the form of a statistically fit function dependent on icecrystal and aerosol particle characteristic geometries as well as atmosphericpressure, temperature, and relative humidity. This same parameterizationtechnique has also been applied to the collection of APs by raindrops adndrizzle. This is the most accurate quantitative approach to computingwashout of APs by falling hydrometeors.
92
____ ___ ____ ___ ____ ___ ____ ___ __/

THE SCAVENGING OF HIGH ALTITUDE AEROSOL BY SMALL ICE CRYSTALS
D. A. Bell and C.P.R. SaundersAtmospheric Physics Group
UMIST, P.O. Box 88Manchester M60 1QD
United Kingdom
There have been several global models developed for the theoreticalinvestigation of the removal of high altitude aerosol from the atmospherefollowing concern about the injection of particulate material by nuclearexplosions and volcanic events. These models lack a knowledge of thescavenging efficiencies of the small ice crystals associated with cirrusclouds and storm ice anvils. These are the only hydrometers that could actto remove the injected particles.
In the past there have been a number of practical studies into thescavenging efficiencies of large ice crystals and snowflakes. A comparisonof the extrapolated results of these findings and the theoretical models ofMartin et al (1980) for the small crystal situation has been made. It wasfound that in general the extrapolated results gave efficiencies that weresignificantly higher than the predicted value. This difference was found tobe enhanced as the crystal diameter decreased.
Experiments using small ice plates grown at -18.5°C in a cloud chamberI which are then permitted to fall through a dense aerosol cloud should provide- the first direct measurements of the scavenging efficiencies of these small
crystals under cloud conditions.
93
a
4,-
II I I I l l _
MODELLING OF WET SCAVENGING OF HEAVY METALS IN THEMARINE ENVIRONMENT
L. Levkov and D.P. EppelForschungszentrum Geesthacht
Postfach 1160D-2054 Geesthacht, Fed. Rep. Germany
H. GrasslMeteorologisches Institut
Universitat HamburgFed. Rep. Germany
A 3D mesoscale model with parameterized microphysics of clouds andprecipitation (Levkov et al., 1988, in print) has been extended to include wetdeposition scavenging of heavy metals from the atmosphere. Themeteorological input data are derived from the North Sea KonTur experiment(Hoeber, 1982). As a first metal lead has been chosen. Both, calculated(long range transport model), and measured atmospheric monthly meanconcentration of lead at the Germany coast of North Sea and Baltic Sea(Petersen et al., 1988) are used as in input pollution level during thesimulations with this smaller scale model. The model output data indicate alead concentration in rain water after 4 hours of simulation between 5 and 10Lg per liter, and a wet deposition rate between 1 and 3 g per m2 per hour.These results show good agreement with measured weekly averages of leaddeposition fluxes during precipitation events at Pellworm (Stossel, 1987)selected for validation of the model. Additionally, attention is focussed todemonstrate the nonlinearity between the prognostic variables, the rainfallrate and the atmospheric wet deposition mainly resulting from the lead loadingas a function of aerosol particle size. The simulation results obtained withthe coupled dynamical, microphysical and cumulus parameterization modulessuggest this approach to be an effective tool for studying the heavy metalsinteraction with the water in the atmospheric environment.
References
1) Levkov, L., D. Jacob, D. Eppel, H. Grassl, 1988: Framework of cloudparameterization including ice for 3d mesoscale models. GKSS Est. Rep. (inprint).
2) Hoeber, H., 1982: KonTur Field Phase Report Hamburg. Geophys.Einzelschriften, Reihe B, Nr. 1.
3) G. Petersen, H. Weber, H. Grassl: Modelling the atmospheric transport oftrace metals from Europe to the North Sea and the Baltic Sea. Paperpresented at the Nato advanced research workshop on control and fate ofatmospheric heavy metals held at Gardermoen airport hotel; 12-16 September1988.
4) Stossel, R.P., 1987: Untersuchungen zur Nass und Trockendeposition vonSchwermetallen auf der Insel Pellworm. Ext. Rep. GKSS 87/E/34.
94
FIELD MEASUREMENTS OF THE WET DEPOSITION OF PARTICULATE MATERIAL
K.W. Nicholson and J.R. BransonEnvironmental and Medical Sciences Division
Harwell LaboratoryOxon. OX11 ORA
UK
Most wet deposition studies have investigated the collection ofadventitious trace species. However, these are often better suited toassessing regional pollution budgets rather than contributing to a betterunderstanding of the mechanisms important in leading to wet deposition.Alternative measurements have included plume scavenging studies which havesuffered the disadvantage that a size distribution of the scavenged species isonly partially known at best. Laboratory studies have been generallycriticised because environmental conditions might not be adequatelyreproduced.
Several releases of particles of known size distribution have beenperformed during natural precipitation events and washout rates have beenassessed. A generalisation of the results has enabled the relativeimportances of wet deposition via washout and dry deposition rates to beassessed for particulate material. A comparison has been included withtheoretical predictions also.
95
IYY .ll iIIIH

SEQUENTIAL SAMPLING OF MAJOR IONS, DISSOLVED AND TOTAL TRACEMETALS IN WET DEPOSITION
B. Lim and T.D. JickellsSchool of Environmental Sciences
University of East AngliaNorwich NR4 7TJ
In order to study the processes controlling the removal of aerosols from theatmosphere, a programme of collecting rainwater in remote regions has beeninstigated. This contribution describes the results of one such experimentat Adrigole, Ireland.
Over a period of 3 days, filtered and unfiltered precipitation weresequentially collected on a wet-only basis in April 1988. During the passageof a frontal system, both stratiform and cumuliform cloud systems wereobserved and precipitation from both cloud typEs was collected and analysedfor major ions, dissolved and particulate trace metals.
All major ions (Cl-, N03-, SO4, H+ , Na+ , K+ , Ca2 +, Mg2+ ) showed a decrease inconcentration with time, with the exception of ammonium. Elements of marineorigin (C-, S04
=, Na+ , K+, Ca2+, Mg2+) were strongly correlated with eachother (r: 0.858-0.995) and with the volume of rainfall collected in eachfraction. This suggests that these aerosols are susceptible to a dilutioneffect and may be scavenged as fully wetted aerosols, due to their hydroscopicnature. The rate of wet deposition of ammonium and total sulphate increasedwith a corresponding change in cloud base level and cloud type. In contrast,C-, NO3-, Na , K+ , Ca2+ , Mg2 + were independent of rainfall rate andtherefore, deposition rate of these elements did not increase with time.
Similarily, dissolved and total trace metal concentrations (Cd, Pb, Mn, Fe,Cu, Zn) decreased over time but the fall off rate was much less rapid than formajor ions. In contrast to most major ions, there was no volume dependencyand therefore no dilution effect was observed for these aerosols. The rateof deposition of dissolved Cu, Pb, Cd and for all total trace metals increasedwith a change in cloud system.
In general, hydrogen ion concentration varied in phase with the trace metalsmeasured. Correlations with dissolved metals were higher than with totalmetals.
96
A

DAILY MEASUREMENTS OF BACKGROUND AIR POLLUTANTS AT A SITEIN THE WEST OF NORTHERN IRELAND
J. StedmanWarren Spring Laboratory
Gunnels Wood RoadStevenage, Herts SG1 2BX, UK
Daily measurements of precipitation composition, SO2 and aerosol sulphateconcentration have been made at Lough Navar in the West of Northern Irelandfrom 1986 to 1988. Rainwater was collected using an automatic wet onlycollector and aerosol concentrations measured using a dichotomous sampler.
Using a trajectory analyses, measurements were assigned to one of fourcategories: Atlantic, Ireland, UK/Europe and undefined. The annual meanconcentrations associated with Atlantic trajectories were used as estimates ofthe background concentrations. The variability of the background wasdetermined from the frequency distributions of the daily concentrations andwet deposition associated with Atlantic trajectories.
The simultaneous sampling of aerosol and rainwater has allowed scavengingin marine air masses to be investigated and results will be presented.
97

SEASONAL VARIATIONS IN SULFATE, NITRATE, AND CHLORIDE INTHE GREENLAND ICE SHEET: RELATION TO ATMOSPHERIC CONCENTRATIONS
C.I. DavidsonDepartment of Civil Engineering
Carnegie Mellon UniversitySchenley Park
Pittsburgh, PA 15213USA
Samples from two snowpits near Dye 3 in south Greenland have been used tostudy seasonal variations in contaminant transport from the atmosphere to theice Sheet. The samples have been dated by comparing 60lu values withmeteorological data from Dye 3. Airborne concentrations over the Ice Sheethave been estimated for the dates corresponding to each snowpit sample bystatistically analyzing data from several air monitoring stations throughoutthe Arctic, and computinq average values from the appropriate stations.Seasonal variations in cuncentrations in air, concentrations in snow, andmass-basis scavenging ratios (concentration in air divided by concentratign insnow) have been identified. Results indicate that concentrations of SO4 4
- inthe air slow a strong peak in late February, while those in the snow show aweaker peak in early March with more uniform concentrations throughout theyear. The smaller seasonal variation in the snow is attributed to the effectof riming, which results in more efficient scavenging during warmer weather.In agreement with prev ous estimates, dry deposition appears to account for 10- 30% of the total S0 4 - in the snow. Concentrations of NO3 in the air peakin late February while those in the snow peak in mid-August, reflecting theinfluence of riming and possible high altitude sources of NO3 •Concentrations of C1- in the air and snow each show a winter peak and a summerpeak. The former reflects long-range transport of marine aerosol at a timewhen seas in the Arctic are frozen, while the latter results from localseaspray. Scavenging ratios for S-4
2- and NO3 peak in early August whilethose for C1- peak in early June; these variations in part reflect moreefficient scavenging during warm weather.
98

I
page
31Anacleto, T.D. 86ApSimon, H.M. 75
Ayatollahi, Sh. 7
Baltensperger, U. 47
Bell, D.A. 24
Below, M. 24
Bergametti, G. 72,73,74
Bigg, E.K. 30
Borb~ly-Kiss, I. 58
Borowska, M. 2,42
Bowdle, D.A. 44,62
Bowdle, D.A. 24
Brand, P. 24
Branson, J.R. 95
Bremond, M.P. 34
Buat-M6nard, P. 34,84
Bunz, H. 55
Burgermeister, S. 28
Butterweck, G. 74
Cachi6r, M.P. 34
Carlier, P. 72,73
Castillo, R. 32
Ch'lek, P. 61
Clarke, A.D. 26,44,45
Consterdine, I.E. 22
dAlmeida, G.A. 90
Davidson, C.I 67
Devara, P.C.S. 23
Dreiling, V. 23
Dybizbanski, J. 58
Eppel, D.P. 94
Eyles, N.A. 56
Fernandez, G. 81
Fitzgerald, J.W. 20,79
Fisher, G.W. 89
Flossmann, A.I. 89
Fytianos, K. 51
Gaggeler, H.W. 47
Galloway, J.N. 82
Gardneus, L. 80
Garvey, D.M. 81
Gebhart, J. 24
Geiss, F. 51
Georgi, B. 24,49,50
Georgii, H.W. 28
Gras, J.L. 4
Grassl, H. 83,94
Hameri, K. 68
Hamilton, R.S. 37
Hansen, A.D.A. 36
Hansen, C. 69
Hansson, H.C. 85
Harri fn, R.K. 29
Harn .J. 20,79
99

Page
Heintzenberg, J. 35Hess, M. 39Heyder, J. 24hitzenberger, R. 80Holt, E.H. 27,81Horvath, H. 41Huebert, B.J. 57Hunmelshoj. P. 69Isaac, P. 20Jaenicke, R. 77Jennings, S.G. 21,25Jennings, S.G. 27,61,88Jickells, T.D. 96Joffre, S.M. 71Jost, D.T. 47Kahl, J.D. 3Kaye, A.D. 5,30Keeler, G. 32Kharchilava, D.F. 52Koepke, P. 39Koltai, E. 30Konttinen, S. 53Kotzias, D. 51Koyra, M. 55Knobben, R.A. 79Kruse-Plass, M. 86Kulmala, M. 68Larsen, H.R. 79Laube, M. 70Leaitch, W.R. 78Leal, R.M. 31Lechner, I.S. 20,79Lee, G. 57Levkov, L. 94Lira, B. 96Lindfors, B. 71Lomaya, O.V. 52Losno, R. 72,73,84Ludlow, I.K. 56Mansfield, T.A. 37Maser, R. 23M6szdros, E. 30McCormick, M.P. 40McGann, B.T. 88McGovern, F.M. 6,21Megaw, J.W. 5,38Menzies, R.T. 42Miller, N.L. 92Molndr, A. 30Mouvier, G. 72MUller, H.-N. 50Muerer, M. 50Nicholson, K.W. 95O'Connor, T.C. 6,21
100

Page
O Dowd, C.D. 21,25,27
Ogren, J.A. 83
Pacyna, J. 22park, P.M. 22
Pastuszka, J.S. 44Patterson, E.M. 83
Petersen, G. 81pinnick, R.G. 27,81Pio, C.A. 3174Porstendorfer, J. 4
post, M.J.42,44Post, M.J.
62,63
preining, 0. 1
pruppacher, H.R. 40
Pueschel, R.F. 40
Raj, P.E. 67
Raunewaa, T. 53,68
Reineking, A. 74
Reist, P.C. 64
Remoudaki, E. 84
Rogers, C.F. 59
Rothermel, J. 42
Russell, P.B. 40
Santos, I.M. 31
Saunders, C.P.R. 70
Scheidgen, P. 70
Schnell, R.C. 3,36
Schock, W. 55
Schumann, T. 90
Schutz, L. 23
Serpolay, R. 60
Smith, M.H. 32
Sommcer, H.T. 33
Spengler, J. 32
Stedman, J. 97
Stott, P. 86
Strom, J. 80
Svantesson, B. 85
swietlicki, E. 85
Szabo, G. 30
Sztyler, A. 65
Taheri, M. 75
Tapper, U. 68
van Daalen, J. 66
van der Hage, J.C.H. 87
Vaughan, J.M. 42
Warren, W. 57
Weber, H. 83
Whelpadale, D.M. 82
Whitecombe, G. 86
Wilson, W. 64
Wu, J. 19
Ylatalo, S. 68
Zhan, J. 61
Zwozdziak, J.W. 54
101
--