-1- Marketing Spectrum/MDA Atlas Van Lines Corporate Relocation Survey Foreword SITUATIONAL ANALYSIS...
88
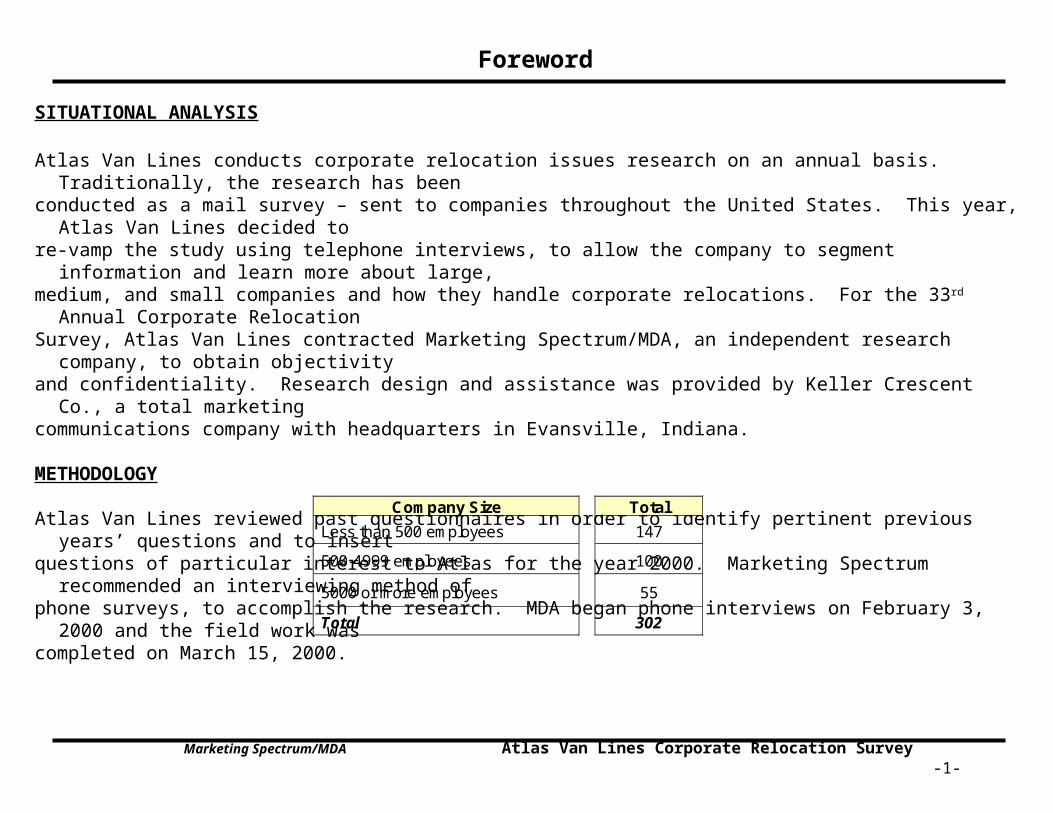
Marketing Spectrum/MDA Atlas Van Lines Corporate Relocation Survey -1- Foreword SITUATIONAL ANALYSIS Atlas Van Lines conducts corporate relocation issues research on an annual basis. Traditionally, the research has been conducted as a mail survey – sent to companies throughout the United States. This year, Atlas Van Lines decided to re-vamp the study using telephone interviews, to allow the company to segment information and learn more about large, medium, and small companies and how they handle corporate relocations. For the 33 rd Annual Corporate Relocation Survey, Atlas Van Lines contracted Marketing Spectrum/MDA, an independent research company, to obtain objectivity and confidentiality. Research design and assistance was provided by Keller Crescent Co., a total marketing communications company with headquarters in Evansville, Indiana. METHODOLOGY Atlas Van Lines reviewed past questionnaires in order to identify pertinent previous years’ questions and to insert questions of particular interest to Atlas for the year 2000. Marketing Spectrum recommended an interviewing method of phone surveys, to accomplish the research. MDA began phone interviews on February 3, 2000 and the field work was completed on March 15, 2000. Com pany Size Total Less than 500 em ployees 147 500-4999 em ployees 100 5000 orm ore em ployees 55 T otal 302
-
Upload
william-willis -
Category
Documents
-
view
221 -
download
0
Transcript of -1- Marketing Spectrum/MDA Atlas Van Lines Corporate Relocation Survey Foreword SITUATIONAL ANALYSIS...
Marketing Spectrum/MDA Atlas Van Lines Corporate Relocation Survey-1-
Foreword
SITUATIONAL ANALYSIS
Atlas Van Lines conducts corporate relocation issues research on an annual basis. Traditionally, the research has been
conducted as a mail survey – sent to companies throughout the United States. This year, Atlas Van Lines decided tore-vamp the study using telephone interviews, to allow the company to segment information and learn more about
large,medium, and small companies and how they handle corporate relocations. For the 33 rd Annual Corporate RelocationSurvey, Atlas Van Lines contracted Marketing Spectrum/MDA, an independent research company, to obtain objectivityand confidentiality. Research design and assistance was provided by Keller Crescent Co., a total marketingcommunications company with headquarters in Evansville, Indiana.
METHODOLOGY
Atlas Van Lines reviewed past questionnaires in order to identify pertinent previous years’ questions and to insert questions of particular interest to Atlas for the year 2000. Marketing Spectrum recommended an interviewing method
ofphone surveys, to accomplish the research. MDA began phone interviews on February 3, 2000 and the field work wascompleted on March 15, 2000.
Company Size Total
Less than 500 employees 147
500-4999 employees 100
5000 or more employees 55
Total 302

Marketing Spectrum/MDA Atlas Van Lines Corporate Relocation Survey-2-
Management Summary
Corporate Profile
Manufacturing/Processing is the most highly represented business classification in this study. The following is a breakdown of respondents’ company business classifications:
A little over half of these companies are international (54%); however, companies employing 5000 or more employees may drive this number. While only 39% of small companies are international, 76% of large companies are worldwide.
The average annual sales for all companies involved in this study is $65.2 million.
Almost half (49%) of the companies involved in this study employ less than 500 salaried workers, 33% employ 500-4999 employees; 18% have 5000 or more salaried employees.
Total (Base) (302)
Business Classification Manufacturing/Processing 54% Service 20 Other 10 Financial 9 Government/Military 7

Marketing Spectrum/MDA Atlas Van Lines Corporate Relocation Survey-3-
Management Summary
Corporate Profile cont’d
A little more than seven in ten (71%) companies have a formal relocation policy. Due to bigger budgets and more annual relocations, large companies (91%) are more likely to have a formal relocation policy than are small companies (54%).
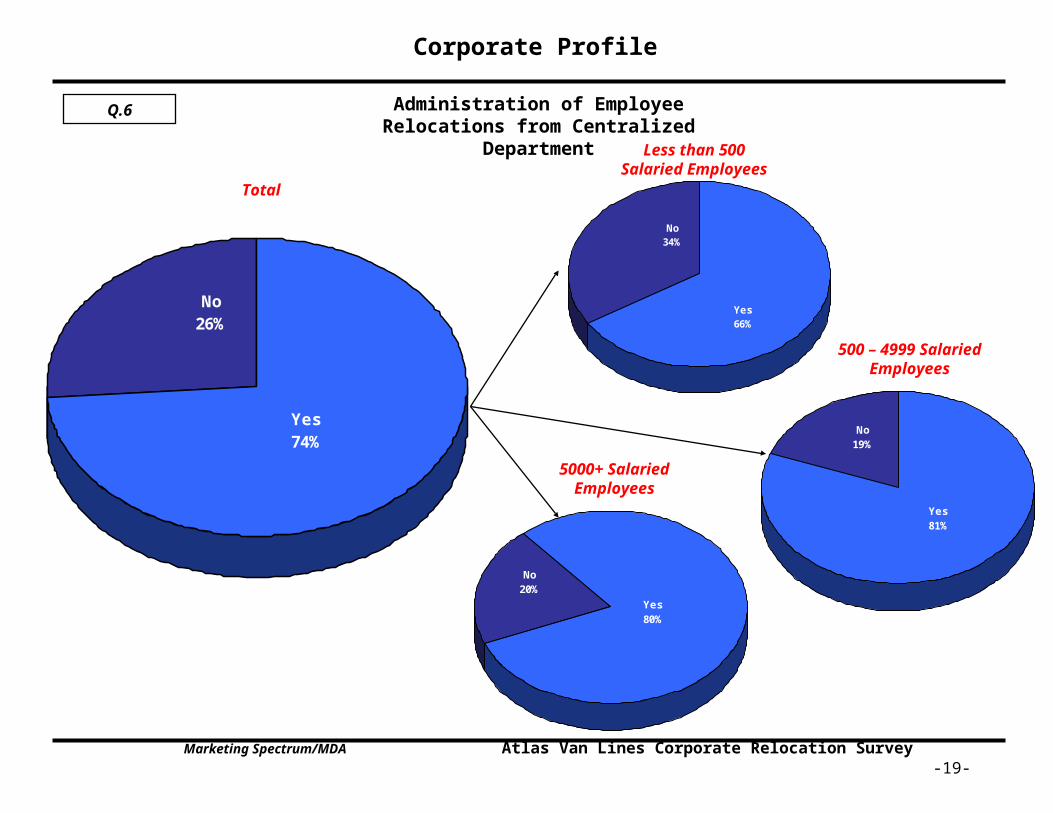
The same is true for centralized relocation departments. Around 80% of medium/large companies feel that a centralized relocation is a necessity while only 66% of small companies have a department entirely devoted to the administration of employee relocations. These centralized relocation departments are responsible for the following:
- Controlling Household Goods Carrier Selection (77%)- Controlling Freight Carrier Selection (74%)
Carrier selection is mainly the responsibility of the company (40%). The other 60% of companies decide on a carrier via the following methods:
The average number of employees relocated in 1999 moved:
Total (Base) (284)
Carrier Selection The company and employee together 24% The employee 17 A relocation firm 13 Other 5
Average Relocation Destination Within the United States 156 employees To the United States 24 employees Within Canada 1 employee To Canada 1 employee
As expected, large companies account for more relocations.
Relocations between foreign countries and those from the U.S. to foreign countries are not included.

Marketing Spectrum/MDA Atlas Van Lines Corporate Relocation Survey-4-
Management Summary
Decision Maker (Respondent) Profile
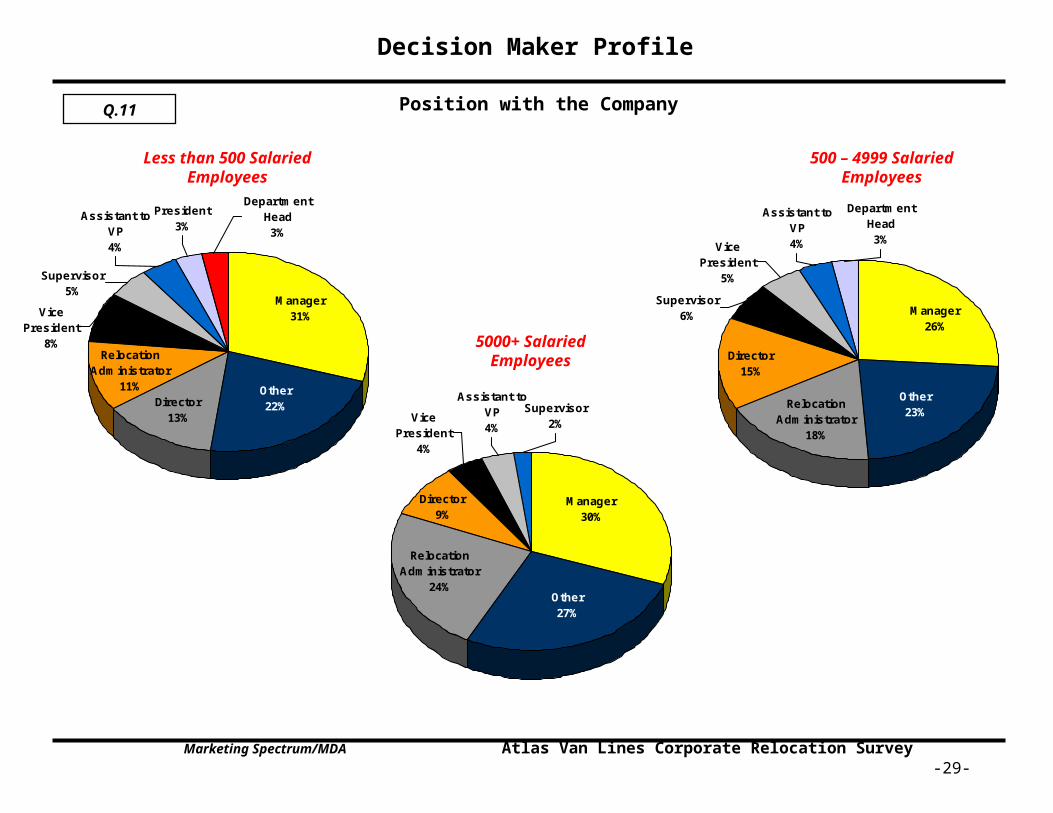
The majority of respondents (78%) work in Human Resources/Personnel. A variety of respondents completed this survey – from managers (26%) to relocation administrators (27%) to other unspecified positions (24%).
A little over half (57%) of decision makers read trade publications:- HR Magazine (37%)- Mobility (28%)
Almost eight in ten (79%) employees do not belong to any relocation-related associations. As with many other measures in this study, employees in larger companies are more likely to belong to a relocation-related association.
In comparison to 1998, companies allocated more money for relocations in 1999. A little more than eight in ten (83%) relocation decision makers say that their 1999 relocation budget either increased or stayed the same:
- 44% increased from 1998 budget- 39% stayed the same as 1998 budget- 17% decreased from 1998 relocation budget
Total (Base) (302)
Employees who Belong to Relocation-Related Associations Large companies 44% Medium companies 27 Small companies 9

Marketing Spectrum/MDA Atlas Van Lines Corporate Relocation Survey-5-
Management Summary
Transferee Profile
The most frequently transferred employee is in his thirties with the average age being 36 years.
An average of 101 employees were transferred in 1999. Larger companies drive this number with an average of 306 employees being transferred in 1999. The following is the makeup of those employees transferred in 1999:
- 20% women (Despite societal advances, husbands are less likely to follow wives, hence fewer relocations among women)- 60% had trailing spouses
While a little more than half of respondents (52%) feel that relocation will stay the same in 2000, 29% anticipate an increase and 19% feel that there will be a decrease in the number of relocations in 2000.
Only 29% of respondents feel that external factors had a significant impact on the number of employee transfers in 1999. These people feel that the following external factors had an impact:
- Economic Conditions (59%)- Lack of Qualified People (52%)
Total (Base) (239)
Age Less than 25 years 3% 25 – 30 years 20 31 – 35 years 27 36 – 40 years 31 41 – 45 years 15 More than 45 years 4

Marketing Spectrum/MDA Atlas Van Lines Corporate Relocation Survey-6-
Management Summary
Transferee Profile cont’d
In contrast to external factors, more than half (54%) of respondents feel that internal factors had a significant impact on the number of employee transfers in 1999. Internal factors were especially likely to impact larger companies. The following internal conditions are significant:
- Growth of Company (76%)- Promotions/Resignations (74%)- Expansion into New Territories (64%)
Companies vary on the amount of time they allow employees to decide on whether to accept a relocation offer. Some employees (39%) have up to two weeks to accept an offer, others (27%) have up to one month to decide, while some have only one week or less to accept (14%). Larger companies usually allow the employee more time to accept a relocation offer.
The majority of companies allow the hiring of spouses of employees (79%). The smaller the company the less likely it is to allow spouses to join the workforce.

Marketing Spectrum/MDA Atlas Van Lines Corporate Relocation Survey-7-
Management Summary
Policy Administration
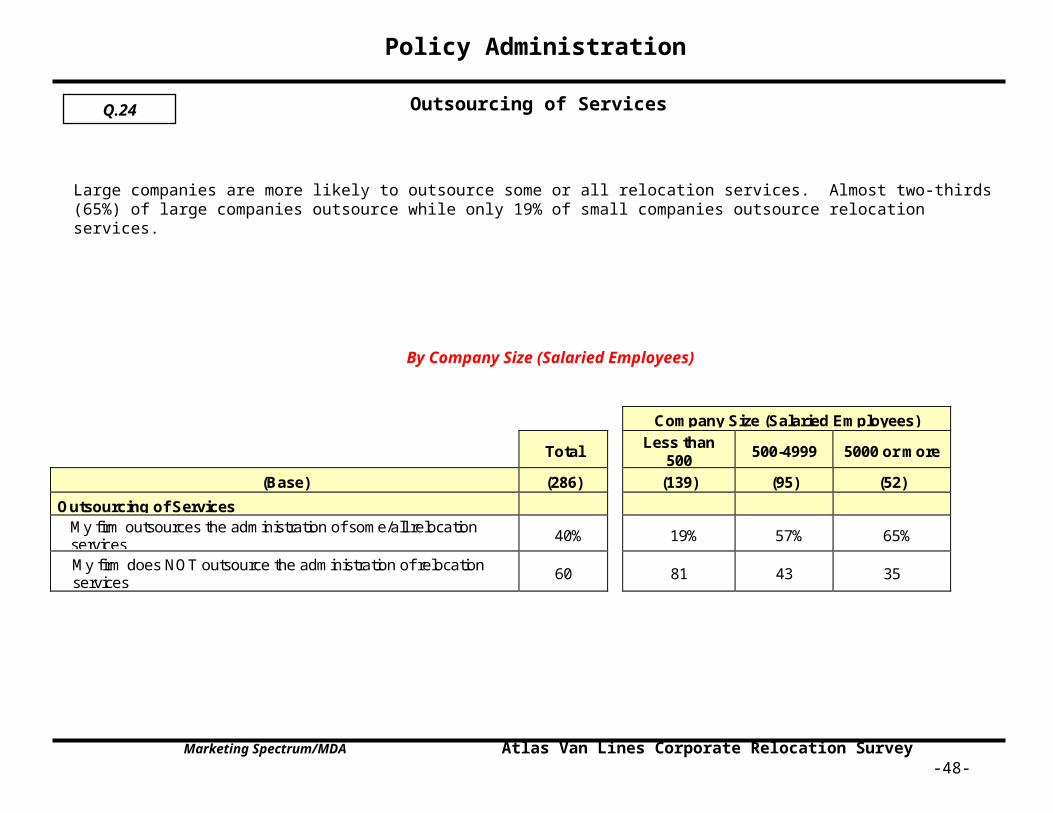
In total, only 40% of companies outsource relocation services. However, this low number appears to be driven by companies of less than 500 employees. Almost two-thirds (65%) of large companies outsource some or all relocation services.
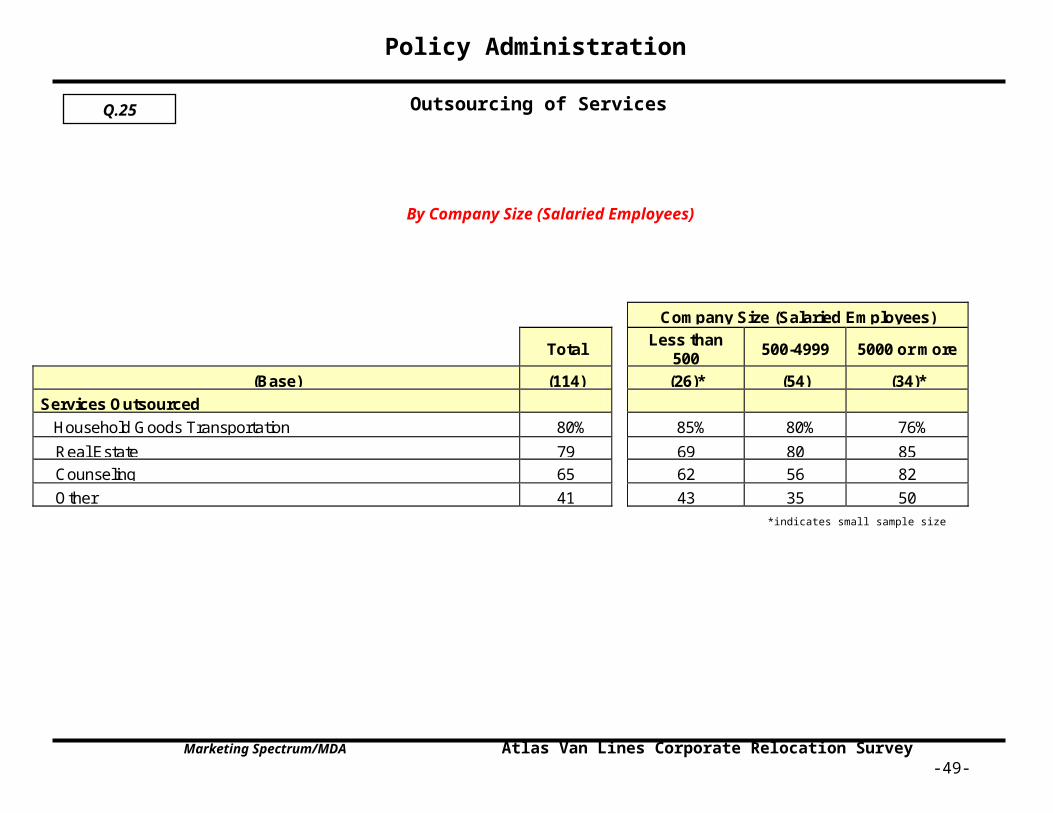
Of those companies who do outsource, the services that are most likely to be outsourced are:- Household goods transportation (80%)- Real estate (79%)
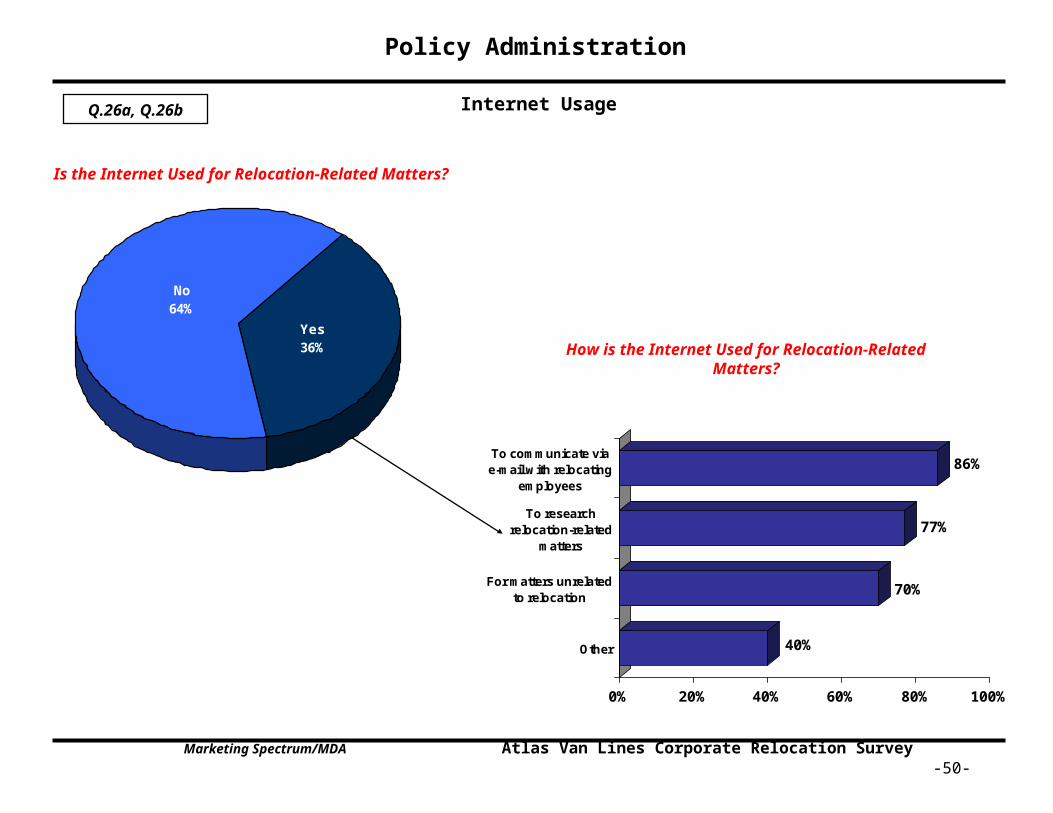
Only 36% of decision makers say that the internet is used for relocation-related matters. Those who do use the internet use it for a variety of purposes:
- To communicate via e-mail with relocating employees (86%)- To research relocation-related matters (77%) - For matters unrelated to relocation (70%)
On average, employees are allowed 4.6 expense-paid house-hunting days; spouses are allowed to accompany the employee on 1.7 expense-paid house-hunting trips.
Company Size (Salaried Employees)
Total
Less than 500
500-4999 5000 or more
(Base) (286) (139) (95) (52)
Outsourcing of Services My firm outsources the administration of some/all relocation services
40% 19% 57% 65%
My firm does NOT outsource the administration of relocation services
60 81 43 35

Marketing Spectrum/MDA Atlas Van Lines Corporate Relocation Survey-8-
Management Summary
Relocation Costs
The following are companies’ methods of reimbursement of moving expenses:
If an employee decides to buy a home in the new location, companies will cover a variety of moving expenses. - 78% pay to pack all items - 74% pay to move exercise equipment- 73% pay to move an automobile
- 63% pay to move recreation and lawn equipment- 62% pay to carry items down from the attic
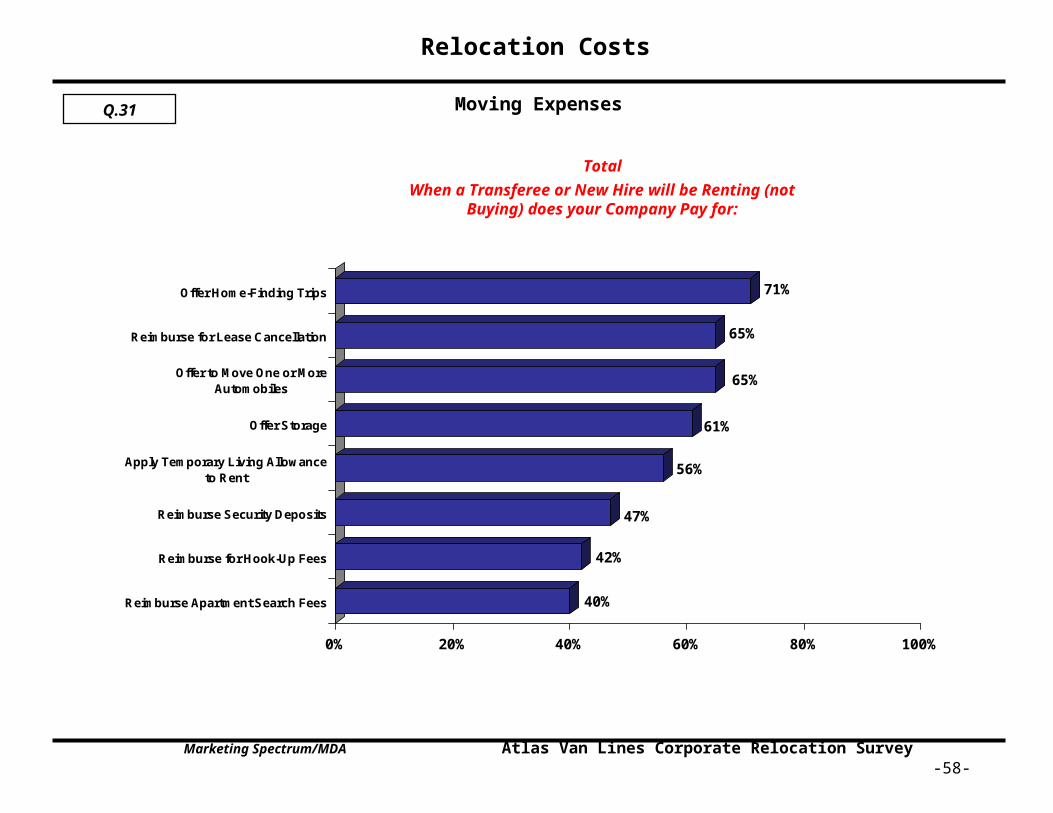
If an employee decides to rent, companies cover the following:- 71% offer home finding trips- 65% reimburse for lease cancellation - 65% offer to move one or more automobiles- 61% offer storage
Total (Base) (276)
A combination of all methods (dependent on the situation and employee) 50% Full reimbursement 29 Partial reimbursement 10 Lump sum 8 No reimbursement 4

Marketing Spectrum/MDA Atlas Van Lines Corporate Relocation Survey-9-
Management Summary
Relocation Services
Only 38% of companies assist an employee’s spouse/partner in finding employment in the new location. These companies help in the following ways:
- 43% assist the spouse/partner in finding a job outside of the company- 30% pay job finder’s fees- 23% assist the spouse/partner in finding a job within the company- 4% pay the spouse/partner's salary until hired
On average, only 13% of employees employed by companies who offer spouse/parner employment assistance, took advantage of it in 1999.
Only 8% of companies provide elder care assistance to the transferee. Assistance provided by these companies includes:
- Provides a list of nursing homes (68%)- Moves the elderly relative (26%)- Reimburses for outside care (10%)- Allows the transferee to use pre-tax dollars for outside care (10%)- Moves the elderly relative that does not live with the transferee (5%)
Approximately one in five (22%) respondents believe that an employee’s willingness to relocate is never affected by his/her spouse’s employment status. Half (50%) believe that employees’ willingness to relocate is seldom affected. 18% say an employee’s spouse’s employment status frequently affects his/her relocation decision, 10% say it almost always does.

Marketing Spectrum/MDA Atlas Van Lines Corporate Relocation Survey-10-
Management Summary
Relocation Services cont’d
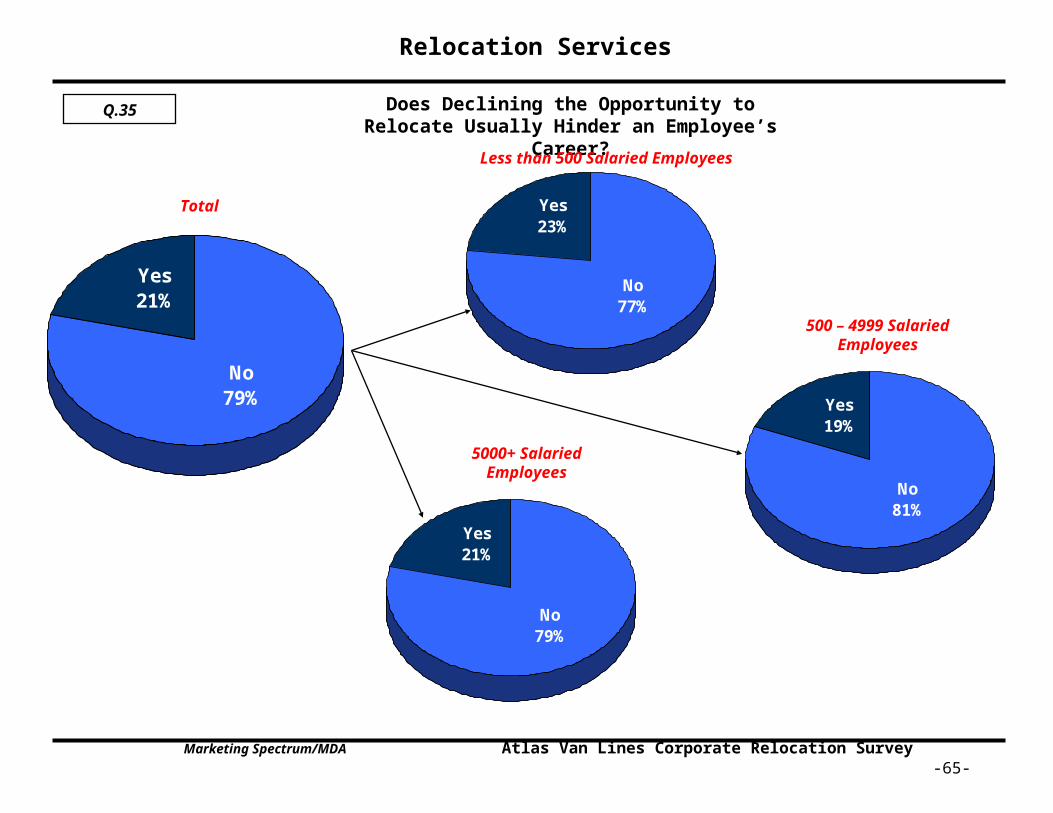
The majority of (79%) respondents say that declining the opportunity to relocate does not hinder an employee’s career.
A little over seven in ten (72%) respondents feel that the number of employees who declined relocation offers did not change between 1998 and 1999. Two in ten (20%) say that the number of employees declining relocation offers in 1999 decreased.
Only 39% of employees who were asked to relocate in 1999, declined the opportunity. Reasons given were:- Family ties (87%) - Personal reasons (77%)- No desire to move (77%)- Spouse’s employment (65%)
The average number of relocation carriers companies have contractual agreements with is 2.4.

Marketing Spectrum/MDA Atlas Van Lines Corporate Relocation Survey-11-
Management Summary
Transportation
A little more than six in ten (63%) of respondents say that their company does have preferred contract carriers.
Only 30% of companies included in the survey outsourced services to a relocation service or brokerage firm in 1999. The services provided to these firms are:
- Real estate sale/purchase (89%)- Contract of household goods moving company (74%)- Orientation tours in the new location (72%).
The most important attributes when selecting a contract carrier are:- Service (94%)- Price (76%)- Reputation (72%)- Claims processing (70%)
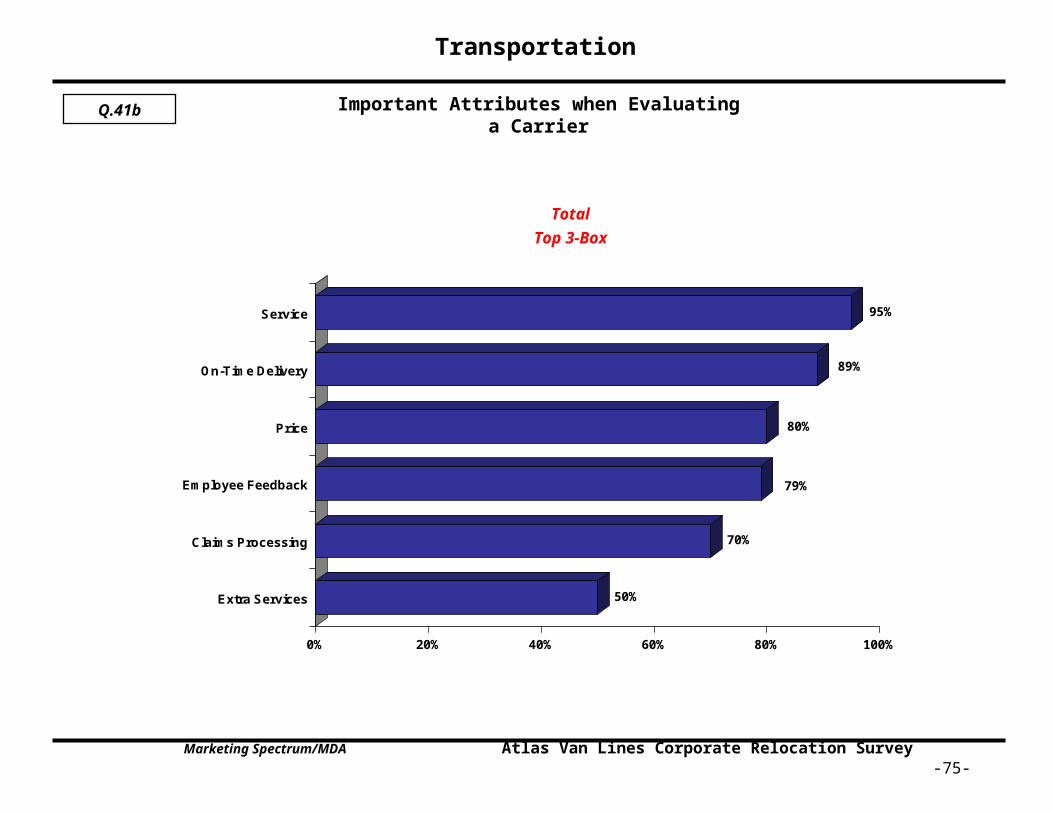
When evaluating a carrier, 95% say that the most important attribute is service, 89% say on-time delivery, 80% say price, 79% say employee feedback, and 70% say claims processing.
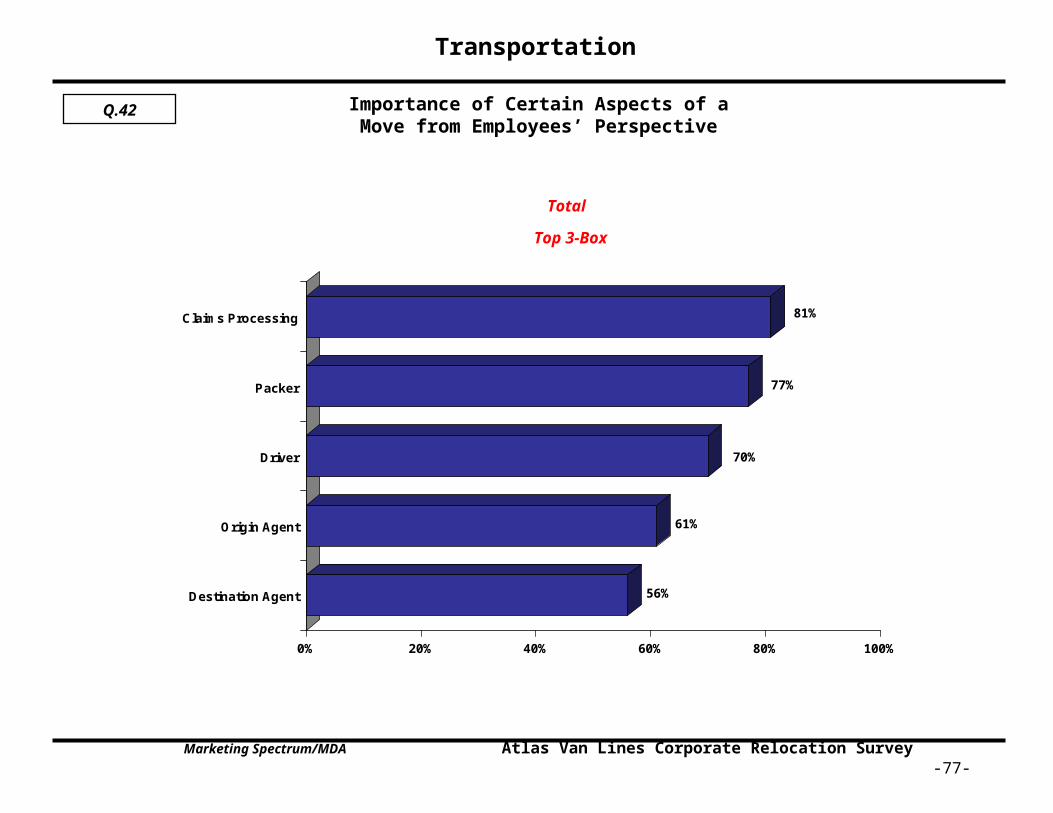
From the employee’s perspective, the most important aspects of a move are:- Claims processing (81%)- Packer (77%) - Driver (70%)
A little more than two in ten (22%) companies use electronic transfer of funds to their contract carrier; 15% use on-line access with their carrier for shipment records/history, and 14% use on-line registration access with their carrier.

Marketing Spectrum/MDA Atlas Van Lines Corporate Relocation Survey-12-
Management Summary
Geography
A little more than eight in ten (83%) companies relocated employees to the United States in 1999, while only 15% of employees were relocated to Canada, and 8% to Mexico.
When choosing a cross-border carrier, a majority of respondents (98%) say that service is most important, followed by price (84%), scheduling (82%), and reputation (77%).
International
Among companies that did relocate employees internationally, relocations to and from the United States dominated international relocations, with foreign relocations from the U.S. being slightly more common than U.S. relocations from abroad. Relocations between two foreign countries were the least common and represented less than half of those either to or from the U.S. to a foreign country.
Almost nine in ten (88%) companies offer additional leave time to internationally relocated employees, 80% offer additional leave time that includes travel and at least one visit to the United States or Canada, 69% offer additional tax considerations, 67% offer extended per diem charges for a hotel, and 67% offer increased allowances for permanent storage.
More than half (53%) of companies have never used the electronic data interchange (EDI) interface capabilities on international shipments. A little over two in ten (23%) seldom use EDI.
A little over three-fourths of companies (77%) offer no assistance to internationally transferred employees’ spouses/partners in finding employment in the new location. Of those companies who do offer this assistance, an average of 35% of internationally relocated employees in 1999 took advantage of this.

Marketing Spectrum/MDA Atlas Van Lines Corporate Relocation Survey-13-
Management Summary
International cont’d
Only 24% of international relocations were declined or failures for lack of adaptability by the spouse/partner (36%), other reason unspecified (36%), lack of adaptability by the employee (29%), or lack of spouse/partner assistance (21%).

Marketing Spectrum/MDA Atlas Van Lines Corporate Relocation Survey-14-
Corporate Profile
Business Classification
Other10%
Government/military
7%
Manufacturing/processing
54%
Service20%
Financial9%
Total Other10%
Government/military
5%
Manufacturing/processing
59%Service21%
Financial5%
Other11%
Government/military
10%
Manufacturing/processing
51%
Service18%
Financial10%
Other9%
Government/military
7%
Manufacturing/processing
44%
Service24%
Financial16%
Less than 500 Salaried Employees
500 – 4999 Salaried Employees
5000+ Salaried Employees
Q.1

Marketing Spectrum/MDA Atlas Van Lines Corporate Relocation Survey-15-
Corporate Profile
Company Type
International54%
Regional26%
National20%
Total
International40%
Regional40%
National21%
International65%
Regional17%
National18%
International76%National
18%
Regional6%
Less than 500 Salaried Employees
500 – 4999 Salaried Employees
5000+ Salaried Employees
Q.2

Marketing Spectrum/MDA Atlas Van Lines Corporate Relocation Survey-16-
Corporate Profile
Company’s Average 1999 Annual Sales
65.2
50.6
72.7
89.5
Total Less than 500Salaried
Employees
500 - 4999Salaried
Employees
5000+Salaried
Employees
In Millions
Q.3

Marketing Spectrum/MDA Atlas Van Lines Corporate Relocation Survey-17-
Corporate Profile
Salaried Employees
5000+ Salaried
Employees18%
500 - 4999 Salaried
Employees33%
Less than 500 Salaried
Employees49%
MEAN: 2064 Salaried Employees
Q.4

Marketing Spectrum/MDA Atlas Van Lines Corporate Relocation Survey-18-
Corporate Profile
Formal Relocation Policy
71%
54%
85% 91%
0%
20%
40%
60%
80%
100%
Total Less than 500Salaried
Employees
500 - 4999Salaried
Employees
5000+Salaried
Employees
Q.5
Marketing Spectrum/MDA Atlas Van Lines Corporate Relocation Survey-19-
Corporate Profile
Administration of Employee Relocations from Centralized Department
No26%
Yes74%
Total
Yes66%
No34%
Yes81%
No19%
No20%
Yes80%
Less than 500 Salaried Employees
500 – 4999 Salaried Employees
5000+ Salaried Employees
Q.6

Marketing Spectrum/MDA Atlas Van Lines Corporate Relocation Survey-20-
Corporate Profile
Centralized Relocation Department Duties
37%
46%
60%
60%
74%
77%
0% 20% 40% 60% 80% 100%
Recommends Site and Space Selection for OfficeRelocations
Handles Office Relocations
Handles Air Travel via Commercial Airlines
Controls Air Carrier Selection
Controls Freight Carrier Selection
Controls Houshold Goods Carrier Selection
Total
Q.7

Marketing Spectrum/MDA Atlas Van Lines Corporate Relocation Survey-21-
Corporate Profile
Centralized Relocation Department DutiesQ.7
Company Size (Salaried Employees)
Total Less than
500 500-4999
5000 or more
(Base) (177)~ (73)~ (66)~ *(38)~
Centralized Relocation Department’s Duties
Controls Household Goods Carrier Selection 77% 72% 78% 85%
Controls Freight Carrier Selection 74 70 73 82
Handles Air Travel Via Commercial Airlines 60 64 54 59
Controls Air Carrier Selection 60 62 59 57
Handles Office Relocations 46 56 39 39
Recommends Site and Space Selection for Office Relocations
37 43 33 32
*indicates small sample size
~indicates approximation

Marketing Spectrum/MDA Atlas Van Lines Corporate Relocation Survey-22-
Corporate Profile
Carrier SelectionQ.8
The Employee17%
The Company & Employee
Together24%
The Company40%
A Relocation Firm13%
Other5%
Total

Marketing Spectrum/MDA Atlas Van Lines Corporate Relocation Survey-23-
Corporate Profile
Carrier SelectionQ.8
Company Size (Salaried Employees)
Total Less than
500 500-4999
5000 or more
(Base) (284) (133) (100) (55)
Selector of Carrier for Employee’s Move
The Company 40% 37% 42% 40%
The Company and Employee Together 24 26 25 16
The Employee 17 25 11 9
A Relocation Firm 13 8 16 20
Other 5 4 3 13

Marketing Spectrum/MDA Atlas Van Lines Corporate Relocation Survey-24-
Corporate Profile
Relocation Destination
Average # of Employees Relocated to Each Location
in Total
156
24 1 1
Within the U.S. To the U.S. Within Canada To Canada
Q.9

Marketing Spectrum/MDA Atlas Van Lines Corporate Relocation Survey-25-
Corporate Profile
Relocation Destination
By Company Size
Q.9
Company Size (Salaried Employees)
Total Less than
500 500-4999
5000 or more
(Base) (302) (147) (100) (55)
Mean Number of Employees Relocated:
Within the U.S. 156 12 62 711
To the U.S. 24 1 17 100
Within Canada 1 * 1 4
To Canada 1 * * 3 *indicates less than 0.5

Marketing Spectrum/MDA Atlas Van Lines Corporate Relocation Survey-26-
Decision Maker Profile
Department Function
Total
Traffic/Transportation
1%
Compensation/Benefits
3%Relocation Services
4%
Human Resources
78%
Other
8%
Administration
6%
Q.10

Marketing Spectrum/MDA Atlas Van Lines Corporate Relocation Survey-27-
Decision Maker Profile
Department Function
By Company Size (Salaried Employees)
11%
9% 13%
77% 85% 74%
7%
5%4%
4%1% 3%3% 4%
2%1% 2%
0%
20%
40%
60%
80%
100%
Less than500
500 - 4999 5000 or moreHuman Resources
Compensation/Benefits
Relocation Services
Administration
Other
Traffic/Transportation
Q.10

Marketing Spectrum/MDA Atlas Van Lines Corporate Relocation Survey-28-
Decision Maker Profile
Position with the Company
President2%
Department Head3%
Assistant to VP4%
Supervisor5%
Vice President
6%
Director13%
Manager27%
Other24%
Relocation Administrator
16%
Q.11
Marketing Spectrum/MDA Atlas Van Lines Corporate Relocation Survey-29-
Decision Maker Profile
Position with the Company
Department Head3%
President3%
Assistant to VP4%
Supervisor5%
Vice President
8%Relocation
Administrator11%
Manager31%
Other22%Director
13%
Q.11
Supervisor2%
Assistant to VP4%
Vice President
4%
Director9%
Manager30%
Other27%
Relocation Administrator
24%
Department Head3%
Assistant to VP4%Vice
President5%
Supervisor6%
Director15%
Manager26%
Other23%
Relocation Administrator
18%
Less than 500 Salaried Employees
500 – 4999 Salaried Employees
5000+ Salaried Employees

Marketing Spectrum/MDA Atlas Van Lines Corporate Relocation Survey-30-
Decision Maker Profile
1999 Relocation Budget in Comparison to 1998
Decrease17%
Stay the Same39%
Increase44%
Q.12
Total
Less than 500 Salaried Employees
500 – 4999 Salaried Employees
5000+ Salaried Employees
Decrease23%
Stay the Same37%
Increase40%
Decrease12%
Stay the Same45%
Increase43%
Decrease9%
Stay the Same37% Increase
54%

Marketing Spectrum/MDA Atlas Van Lines Corporate Relocation Survey-31-
Decision Maker Profile
Trade Publications
No44% Yes
56%
Do you read trade publications?
37%
28%18%
14%10% 7% 5%
3% 2%
0%
20%
40%
60%
80%
100%
HR Magazi
ne
Mobili
ty
Other
Human R
esourc
e Execu
tive
HR New
s
HR Focu
s
Work
forc
e
Human R
esourc
e Pro
fess
ional
None
Reloca
tion R
eport
Corpora
te R
eloca
tion N
ews
Distrib
ution
Trade Publications Respondents Read
Trade Publications with less than 2% Readership are not shown
Q.13a & Q.13b

Marketing Spectrum/MDA Atlas Van Lines Corporate Relocation Survey-32-
Decision Maker Profile
Trade PublicationsQ.13a & Q.13b
Company Size (Salaried Employees)
Total Less than
500 500-4999
5000 or more
(Base) (302) (147) (100) (55)
Regularly Read Trade Publications
Yes 56% 50% 60% 67%
No 44 50 40 33
(Base) (147) (59) (53) (35)*
Trade Publications Read
HR Magazine 37% 46% 38% 20%
Mobility 28 7 30 60
Other 18 24 17 11
Human Resource Executive 14 17 15 6
HR News 10 12 9 6
HR Focus 7 3 11 9
Workforce 5 10 4 -
Human Resource Professional 3 2 4 6
None 3 5 4 -
Relocation Report 3 - - 11
Corporate Relocation News 2 3 - 3
Distribution 2 2 2 3
*indicates small sample size
Trade Publications in Total with less than 2% Readership are not shown

Marketing Spectrum/MDA Atlas Van Lines Corporate Relocation Survey-33-
Decision Maker Profile
Relocation-Related Association Membership
No79%
Yes21%
500 – 4999 Salaried Employees
Q.14
No91%
Yes9%
No73%
Yes27%
No56%
Yes44%
Total
Less than 500 Salaried Employees
5000+ Salaried Employees

Marketing Spectrum/MDA Atlas Van Lines Corporate Relocation Survey-34-
Transferee Profile
Age Range of Frequently Transferred Employees
Less than 25 years
3%
More than 45 years
4%
41 - 45 years15%
36 - 40 years31%
31 - 35 years27%
25 - 30 years20%
Q.15
Total
Average Age = 36 years

Marketing Spectrum/MDA Atlas Van Lines Corporate Relocation Survey-35-
Transferee Profile
Age Range of Frequently Transferred Employees
Q.15
By Company Size (Salaried Employees)
Company Size (Salaried Employees)
Total Less than
500 500-4999
5000 or more
(Base) (239) (119) (80) (40)
Age Range of Most Frequently Transferred Employee
Less than 25 years 3% 5% -% 5%
25 – 30 years 20 25 18 12
31 – 35 years 27 24 34 22
36 – 40 years 31 26 36 35
41 – 45 years 15 16 9 22
More than 45 years 4 4 4 2
Average Age 36 yrs 35 yrs 36 yrs 36 yrs

Marketing Spectrum/MDA Atlas Van Lines Corporate Relocation Survey-36-
Transferee Profile
Number of Employee Transfers in 1999
101
28100
306
Total Less than 500Salaried
Employees
500 - 4999Salaried
Employees
5000+Salaried
Employees
Q.16
Average

Marketing Spectrum/MDA Atlas Van Lines Corporate Relocation Survey-37-
Transferee Profile
Percentage of Employees Transferred in 1999 who are Women
20% 18% 23% 22%
0%
20%
40%
60%
80%
100%
Total Less than 500Salaried
Employees
500 - 4999Salaried
Employees
5000+Salaried
Employees
Q.17
Average

Marketing Spectrum/MDA Atlas Van Lines Corporate Relocation Survey-38-
Transferee Profile
Percentage of Transfers Involving a Trailing Spouse in 1999
60%55%
63%70%
0%
20%
40%
60%
80%
100%
Total Less than 500Salaried
Employees
500 - 4999Salaried
Employees
5000+Salaried
Employees
Q.18/Q.19
Average

Marketing Spectrum/MDA Atlas Van Lines Corporate Relocation Survey-39-
Transferee Profile
2000 Relocation Anticipation
Decrease19%
Increase29%
Stay the Same52%
Q.20
500 – 4999 Salaried Employees
Total
Less than 500 Salaried Employees
5000+ Salaried Employees
Decrease22%
Increase24%
Stay the Same54%
Decrease14%
Increase33%
Stay the Same53%
Decrease22%
Increase32%
Stay the Same46%

Marketing Spectrum/MDA Atlas Van Lines Corporate Relocation Survey-40-
Transferee Profile
External Factors
29% of Respondents (Base = 66) felt that external factors had an impact on the number of employee transfers in 1999
28%
29%
38%
52%
59%
0% 20% 40% 60% 80% 100%
Other
Growth of InternationalCompetition
Growth of DomesticCompetition
Lack of Qualified PeopleLocally
Economic Conditions
Q.21
Total

Marketing Spectrum/MDA Atlas Van Lines Corporate Relocation Survey-41-
Transferee Profile
External Factors
Company Size (Salaried Employees)
Total Less than
500 500-4999
5000 or more
(Base) (230) (106) (83) (41)
External Conditions External conditions had an impact on the number of employee relocations in 1999
29% 22% 29% 46%
External conditions did NOT have an impact on the number of employee relocations in 1999
71 78 71 54
(Base) (59)~ *(20)~ *(23)~ *(16)~
External Conditions that had an Impact
Economic Conditions 59% 50% 52% 76%
Lack of Qualified People 52 62 50 44
Growth of Domestic Competition 38 30 39 47
Growth of International Competition 29 30 30 25
Other 28 30 23 31 *indicates small sample size
~indicates approximation
Q.21
By Company Size (Salaried Employees)

Marketing Spectrum/MDA Atlas Van Lines Corporate Relocation Survey-42-
Transferee Profile
Internal Factors
54% of Respondents (Base = 129) felt that internal factors had an impact on the number of employee transfers in 1999
11%18%
28%29%
37%47%
51%55%56%
64%74%76%
0% 20% 40% 60% 80% 100%
Other
Decreased Production
International Expansion
Closing of Facility
Budget Constraints
Corporate Reorganization
Acquisitions/Mergers
Increased Production
Expansion of Facility
Expansion into New Territories
Promotions/Resignations
Growth of Company
Q.22
Total

Marketing Spectrum/MDA Atlas Van Lines Corporate Relocation Survey-43-
Transferee Profile
Internal FactorsQ.22
Company Size (Salaried Employees)
Total
Less than 500
500-4999 5000 or more
(Base) (238) (108) (86) (44)
Internal Conditions
Internal conditions had an impact on the number of employee relocations in 1999
54% 44% 57% 73%
Internal conditions did NOT have an impact on the number of employee relocations in 1999
46 56 43 27
(Base) (122)~ (46)~ (48)~ *(29)~
Internal Conditions that had an Impact
Growth of Company 76% 69% 81% 79%
Promotions/Resignations 74 69 71 83
Expansion into New Territories 64 61 65 66
Expansion of Facility 56 52 60 57
Increased Production 55 52 52 63
Acquisitions/Mergers 51 42 51 66
Corporate Reorganization 47 35 47 62
Budget Constraints 37 42 27 46
Closing of Facility 29 15 23 59
International Expansion 28 16 35 36
Decreased Production 18 16 24 13
Other 11 17 10 3
By Company Size (Salaried Employees)
~indicates approximation
*indicates small sample size

Marketing Spectrum/MDA Atlas Van Lines Corporate Relocation Survey-44-
Transferee Profile
Length of Transfer Offer
1 week or less14%
Up to 1 month27%
Up to 2 weeks39%
Up to 3 weeks8%
Up to 3 months
6%
More than 3 months
5%
Up to 2 months
1%
Q.22b
Total

Marketing Spectrum/MDA Atlas Van Lines Corporate Relocation Survey-45-
Transferee Profile
Length of Transfer OfferQ.22b
By Company Size (Salaried Employees)
Company Size (Salaried Employees)
Total
Less than 500
500-4999 5000 or more
(Base) (93) (35)* (34)* (24)*
Length of Transfer Offer
1 week or less 14% 6% 26% 8% Up to 2 weeks 39 49 32 33
Up to 3 weeks 8 6 12 4
Up to 1 month 27 29 15 42
Up to 2 months 1 3 - -
Up to 3 months 6 6 9 4
More than 3 months 5 3 6 8
*indicates small sample size

Marketing Spectrum/MDA Atlas Van Lines Corporate Relocation Survey-46-
Transferee Profile
Allowance of Hiring of Spouses of Employees
Not Permitted21%
Permitted79%
Q.23
Not Permitted25%
Permitted75%
Not Permitted16%
Permitted84%
Not Permitted14%
Permitted86%
Less than 500 Salaried Employees
500-4999 Salaried Employees
5000+ Salaried Employees

Marketing Spectrum/MDA Atlas Van Lines Corporate Relocation Survey-47-
Policy Administration
Outsourcing of Services
Outsourced40%
Not Outsourced
60%
80% 79%
65%
41%
0%
20%
40%
60%
80%
100%
HouseholdGoods
Transportation
Real Estate Counseling Other Services
Q.24, Q.25
Marketing Spectrum/MDA Atlas Van Lines Corporate Relocation Survey-48-
Policy Administration
Outsourcing of ServicesQ.24
Company Size (Salaried Employees)
Total
Less than 500
500-4999 5000 or more
(Base) (286) (139) (95) (52)
Outsourcing of Services My firm outsources the administration of some/all relocation services
40% 19% 57% 65%
My firm does NOT outsource the administration of relocation services
60 81 43 35
By Company Size (Salaried Employees)
Large companies are more likely to outsource some or all relocation services. Almost two-thirds (65%) of large companies outsource while only 19% of small companies outsource relocation services.
Marketing Spectrum/MDA Atlas Van Lines Corporate Relocation Survey-49-
Policy Administration
Outsourcing of ServicesQ.25
Company Size (Salaried Employees)
Total
Less than 500
500-4999 5000 or more
(Base) (114) (26)* (54) (34)*
Services Outsourced
Household Goods Transportation 80% 85% 80% 76%
Real Estate 79 69 80 85
Counseling 65 62 56 82
Other 41 43 35 50
By Company Size (Salaried Employees)
*indicates small sample size
Marketing Spectrum/MDA Atlas Van Lines Corporate Relocation Survey-50-
Policy Administration
Internet Usage
Yes36%
No64%
40%
70%
77%
86%
0% 20% 40% 60% 80% 100%
Other
For matters unrelatedto relocation
To researchrelocation-related
matters
To communicate viae-mail with relocating
employees
Is the Internet Used for Relocation-Related Matters?
How is the Internet Used for Relocation-Related Matters?
Q.26a, Q.26b

Marketing Spectrum/MDA Atlas Van Lines Corporate Relocation Survey-51-
Policy Administration
Internet Usage
By Company Size (Salaried Employees)
Q.26a, Q.26b
Company Size (Salaried Employees)
Total
Less than 500
500-4999 5000 or more
(Base) (302) (147) (100) (55)
Internet Usage
The Internet is used for relocation-related matters 36% 35% 28% 54% The Internet is NOT used for relocation-related matters 64 65 72 46
(Base) (104)~ (47)~ (26)~ (30)~
How the Internet is Used
To communicate via e-mail with relocating employees 86% 78% 89% 97%
To research relocation-related matters 77 72 75 83
For matters unrelated to relocation 70 75 64 73
Other 40 30 45 50
~indicates approximation

Marketing Spectrum/MDA Atlas Van Lines Corporate Relocation Survey-52-
Policy Administration
Number of Expense-Paid Relocation Trips
10%
21%
33%
7%4%
10%
15%
7%
2%10%
7%
34%
18%
20%
0%
20%
40%
60%
80%
100%
Spouse Employee
Total
4.6 days1.7 tripsAverage Number of Expense-Paid Trips/Days
Allowed for House-Hunting
Trips Days
Don’t know
Varies
Three
Four or more
Two
One
None
Q.27, Q.28

Marketing Spectrum/MDA Atlas Van Lines Corporate Relocation Survey-53-
Policy Administration
Number of Expense-Paid Relocation Trips
Average By Company Size (Salaried Employees)
Q.27, Q.28
Company Size (Salaried Employees)
Total
Less than 500
500-4999 5000 or more
Average Number of House-Hunting Trips/Days Allowed for:
Spouse (Trips) 1.7 1.6 1.6 2.2 Employee (Days) 4.6 3.9 4.9 5.7

Marketing Spectrum/MDA Atlas Van Lines Corporate Relocation Survey-54-
Relocation Costs
Reimbursement of Moving Expenses
No Reimbursement
4%
Partial Reimbursement
10%
Lump Sum8%
Full Reimbursement
29%
A Combination of All Four Methods
50%
Q.29
Total

Marketing Spectrum/MDA Atlas Van Lines Corporate Relocation Survey-55-
Relocation Costs
Reimbursement of Moving Expenses
By Company Size (Salaried Employees)
Q.29
Company Size (Salaried Employees)
Total
Less than 500
500-4999 5000 or more
(Base) (276) (125) (100) (55)
Reimbursement of Moving Expenses
A combination of all four methods of reimbursement 50% 45% 52% 53% Full reimbursement 29 26 29 33 Partial reimbursement 10 16 7 2 Lump sum 8 7 8 7 No reimbursement 4 6 2 2

Marketing Spectrum/MDA Atlas Van Lines Corporate Relocation Survey-56-
Relocation Costs
Moving Expenses the Company Covers
Total
10%
24%
38%
38%
42%
46%
47%
54%
58%
62%
63%
73%
74%
78%
0% 20% 40% 60% 80% 100%
Temporary Maid Service
To Move a Boat
To Move a Second Automobile
To have Belongings Picked up from a Second Residence
To Move Satellite TV Dishes
To Move Collections of Highly Valuable Objects
Storage
To Move Pets
Move Unlimited Weight
To Carry Items Down from the Attic
To Move Recreation and Lawn Equipment
To Move an Automobile
To Move Exercise Equipment
To Pack all Items
Q.30

Marketing Spectrum/MDA Atlas Van Lines Corporate Relocation Survey-57-
Relocation Costs
Moving Expenses the Company Covers
By Company Size (Salaried Employees)
Q.30
Company Size (Salaried Employees)
Total
Less than 500
500-4999 5000 or more
(Base) (263)~ (125)~ (90)~ (49)~
Covered Moving Expenses
To Pack all Items 78% 71% 82% 84% To Move Exercise Equipment 74 69 71 92 To Move an Automobile 73 63 78 90 To Move Recreation and Lawn Equipment 63 61 62 69 To Carry Items Down from the Attic 62 59 63 71 Move Unlimited Weight 58 53 60 64 To Move Pets 54 46 60 60 Storage 47 42 53 49 To Move Collections of Highly Valuable Objects 46 42 46 57 To Move Satellite TV Dishes 42 44 38 42 To have Belongings Picked up from a Second Residence 38 29 43 52 To Move a Second Automobile 38 23 44 64 To Move a Boat 24 17 26 37 Temporary Maid Service 10 6 14 14
~indicates approximation
Marketing Spectrum/MDA Atlas Van Lines Corporate Relocation Survey-58-
Relocation Costs
Moving Expenses
When a Transferee or New Hire will be Renting (not Buying) does your Company Pay for:
40%
42%
47%
56%
61%
65%
65%
71%
0% 20% 40% 60% 80% 100%
Reimburse Apartment Search Fees
Reimburse for Hook-Up Fees
Reimburse Security Deposits
Apply Temporary Living Allowanceto Rent
Offer Storage
Offer to Move One or MoreAutomobiles
Reimburse for Lease Cancellation
Offer Home-Finding Trips
Q.31
Total

Marketing Spectrum/MDA Atlas Van Lines Corporate Relocation Survey-59-
Relocation Costs
Moving Expenses
When a Transferee or New Hire will be Renting (not Buying) does your Company Pay for:
Q.31
By Company Size (Salaried Employees)
Company Size (Salaried Employees)
Total
Less than 500
500-4999 5000 or more
(Base) (271)~ (126)~ (93)~ (52)~
Covered Moving Expenses when Renting
Offer Home-Finding Trips 71% 62% 73% 88% Reimburse for Lease Cancellation 65 52 71 82 Offer to Move One or More Automobiles 65 54 69 83 Offer Storage 61 50 70 75 Apply Temporary Living Allowance Toward Rent 56 54 53 68 Reimburse Security Deposits 47 39 59 42 Reimburse for Hook-Up Fees 42 34 53 44 Reimburse Apartment Search Fees 40 26 49 62
*indicates approximation

Marketing Spectrum/MDA Atlas Van Lines Corporate Relocation Survey-60-
Relocation Services
Spouse/Partner Assistance
Does your Company Assist an Employee’s Spouse/Partner in Finding Employment in the New
Location?
Yes38%
No62%
How does your Company Assist an Employee’s Spouse/Partner in Finding Employment in the New
Location?Pay Spouse's Full/Partial Salary Until
Hired4%
Find Employment Outside the Company
43%
Pay Job-Finder's Fee
30%
Find Employment
Within the Company
23%
An Average of 13% of Employees in 1999 used Spouse/Partner Employment Assistance
Q.32a, Q.32b, Q.32c

Marketing Spectrum/MDA Atlas Van Lines Corporate Relocation Survey-61-
Relocation Services
Spouse/Partner Assistance
By Company Size (Salaried Employees)
Q.32a, Q.32b, Q.32c
Company Size (Salaried Employees)
Total
Less than 500
500-4999 5000 or more
(Base) (279) (132) (95) (52)
Spouse/Partner Employment Assistance My company assists an employee’s spouse/partner in finding employment in the new location
38% 28% 43% 52%
My company does NOT assist an employee’s spouse/partner in finding employment in the new location
62 72 57 48
(Base) (105) (37)* (41)* (27)* Type of Spouse/Partner Employment Assistance
Find employment outside the company 43% 49% 42% 37% Pay job-finder’s fee 30 27 27 41 Find employment within the company 23 24 24 18 Pay spouse’s full or partial salary until hired 4 - 7 4
Average Percentage of Employees in 1999 who used Spousal/Partner Employment Assistance
13% 12% 11% 16%
*indicates small sample size

Marketing Spectrum/MDA Atlas Van Lines Corporate Relocation Survey-62-
Relocation Services
Elder Care
Does your Company Assist the Transferee for Elder Care?
Yes8%
No92%
What Assistance does your Company Provide to the Transferee for Elder Care?
68%
26%
10% 10%5%
0%
20%
40%
60%
80%
100%
ProvideList of
NursingHomes
MoveElderly
Relative
Reimbursefor Outside
Care
AllowTransfereeto use Pre-Tax Dollarsfor Outside
Care
Move theElderlyRelative
that doesnot Livewith the
Transferee
Q.33a, Q.33b

Marketing Spectrum/MDA Atlas Van Lines Corporate Relocation Survey-63-
Relocation Services
Elder Care
By Company Size (Salaried Employees)
Q.33a, Q.33b
Company Size (Salaried Employees)
Total
Less than 500
500-4999 5000 or more
(Base) (261) (124) (85) (52)
Elder Care Assistance My company provides assistance to the transferee for elder care
8% 3% 8% 19%
My company does NOT provide assistance to transferees for elder care
92 97 92 81
(Base) (19)* (4)* (7)* (8)* Type of Elder Care Assistance
Provide list of nursing homes 68% 75% 43% 88% Move elderly relative who will live with transferee in new location 26 25 57 - Reimburse for outside care 10 - 29 - Allow transferee to use pre-tax dollars for outside care 10 - 29 - Move elderly relative who does not live with the transferee 5 - - 12
*indicates small sample size

Marketing Spectrum/MDA Atlas Van Lines Corporate Relocation Survey-64-
Relocation Services
Frequency of Relocation Affected by Spouse’s Employment
Frequently18% Seldom
50%
Never22%
Almost Always
10%
Q.34
Frequently13%
Seldom47%
Never29%
Almost Always
11%
Frequently18%
Seldom53%
Never20%
Almost Always
9%
Frequently31%
Seldom51%
Never9%
Almost Always
9%
Total
Less than 500 Salaried Employees
500 – 4999 Salaried Employees
5000+ Salaried Employees
Marketing Spectrum/MDA Atlas Van Lines Corporate Relocation Survey-65-
Relocation Services
Does Declining the Opportunity to Relocate Usually Hinder an Employee’s Career?
Yes21%
No79%
Q.35
Total Yes23%
No77%
Yes19%
No81%
Yes21%
No79%
Less than 500 Salaried Employees
500 – 4999 Salaried Employees
5000+ Salaried Employees

Marketing Spectrum/MDA Atlas Van Lines Corporate Relocation Survey-66-
Relocation Services
Change in the Number of Relocation Declination in 1999 from 1998
Increase from the
1998 Level8%
Decrease from the
1998 Level20%
Remain About the
Same as the 1998 Level
72%
Q.36
Total
Increase from the
1998 Level8%
Decrease from the
1998 Level23%
Remain About the
Same as the 1998 Level
69%
Increase from the
1998 Level9%
Decrease from the
1998 Level18%
Remain About the
Same as the 1998 Level
73%
Increase from the
1998 Level8%
Decrease from the
1998 Level18%
Remain About the
Same as the 1998 Level
74%
Less than 500 Salaried Employees
500 – 4999 Salaried Employees
5000+ Salaried Employees

Marketing Spectrum/MDA Atlas Van Lines Corporate Relocation Survey-67-
Relocation Services
Relocation Declination in 1999
Did any Employees Decline the Opportunity to Relocate in 1999?
Yes39%
No60%
What Reasons did the Employees give for Declining Relocation?
19%
22%
39%
40%
65%
77%
77%
87%
0% 20% 40% 60% 80% 100%
Other
Could Hurt Career
Housing/MortgageConcerns
Cost of Living
Spouse's Employment
No Desire to Move
Personal
Family Ties
Q.37a, Q.37b

Marketing Spectrum/MDA Atlas Van Lines Corporate Relocation Survey-68-
Relocation Services
Relocation Declination in 1999
By Company Size (Salaried Employees)
Q.37a, Q.37b
Company Size (Salaried Employees)
Total
Less than 500
500-4999 5000 or more
(Base) (238) (120) (81) (37)*
Employee Declination Some employees declined the opportunity to relocate
39% 27% 42% 76%
No employees declined the opportunity to relocate 60 73 58 24
(Base) (80)~ *(28)~ *(28)~ *(24)~ Reasons for Declining Relocation
Family Ties 87% 87% 80% 96% Personal 77 64 90 75 No Desire to Move 77 83 79 68 Spouse’s Employment 65 67 57 75 Cost of Living 40 34 28 61 Housing/Mortgage Concerns 39 28 38 52 Could Hurt Career 22 21 20 25 Other 19 22 18 18
~indicates approximation
*indicates small sample size

Marketing Spectrum/MDA Atlas Van Lines Corporate Relocation Survey-69-
Relocation Services
Average Number of Carriers your Company has Contractual Agreements with for Transportation of Household Goods
Q.38
2.42.5
2.0
3.3
Total Less than 500Salaried
Employees
500 - 4999Salaried
Employees
5000+Salaried
Employees

Marketing Spectrum/MDA Atlas Van Lines Corporate Relocation Survey-70-
Transportation
Are there Preferred Contract Carriers
Yes63%
No37%
Q.39
Yes65%
No35%
Yes63%
No37%
Yes59%
No41%
Total
Less than 500 Salaried Employees
500 – 4999 Salaried Employees
5000+ Salaried Employees

Marketing Spectrum/MDA Atlas Van Lines Corporate Relocation Survey-71-
Transportation
Contract Carriers
Did your Company Outsource any Services to a Relocation Service or a Brokerage Firm in 1999?
Yes30%
No70%
49%
56%
60%
62%
65%
65%
70%
72%
74%
89%
0% 20% 40% 60% 80% 100%
Supplementary Services
Counseling about Company Policy
Arrangement of Family's Transportation & Accommodations
Monitoring of Shipment
Assistance with Employee Claims Preparation/Submission
Audit/Payment of Invoice
Counseling about the Planning/Details of Moving
Orientation Tours in the New Location
Contract of Household Goods Moving Company
Real Estate Sale/Purchase
Which Services did it Provide?
Q.40a, Q.40b

Marketing Spectrum/MDA Atlas Van Lines Corporate Relocation Survey-72-
Transportation
Contract Carriers
By Company Size (Salaried Employees)
Q.40a, Q.40b
Company Size (Salaried Employees)
Total
Less than 500
500-4999 5000 or more
(Base) (302) (147) (100) (55)
Outsource in 1999 My company outsourced some/all services to a relocation service/brokerage firm in 1999
30% 16% 42% 44%
My company did NOT outsource some/all services to a relocation service/brokerage firm in 1999
70 84 58 56
(Base) (83)~ *(20)~ (40)~ *(21)~ Services the Firm Provided
Real Estate Sale/Purchase 89% 82% 88% 100% Contract of Household Goods Moving Company 74 77 71 71 Orientation Tours in New Location 72 70 64 86 Counseling about the Planning/Details of Moving 70 77 59 81 Audit/Payment of Invoice 65 70 62 67 Assistance with Employee Claims Preparation/Submission 65 52 65 67 Monitoring of Shipment 62 70 62 65 Arrangement of Family’s Transportation/Accommodations 60 64 52 67 Counseling about Company Policy 56 61 48 67 Supplementary Services 49 43 45 65
~indicates approximation

Marketing Spectrum/MDA Atlas Van Lines Corporate Relocation Survey-73-
Transportation
Important Attributes when Selecting a Contract Carriers
53%
70%
72%
76%
94%
0% 20% 40% 60% 80% 100%
Local Agents
Claims Processing
Reputation
Price
Service
Total
Top 3-Box
Q.41a

Marketing Spectrum/MDA Atlas Van Lines Corporate Relocation Survey-74-
Transportation
Important Attributes when Selecting a Contract Carriers
By Company Size (Salaried Employees)
Top 3-Box
Company Size (Salaried Employees)
Total
Less than 500
500-4999 5000 or more
(Base) (254)~ (117)~ (91)~ (47)~
Important Attributes when Selecting a Carrier (Top 3-Box) Service
94% 92% 96% 96% Price 76 79 76 70 Reputation 72 70 74 72
Claims Processing 70 67 77 62 Local Agents 53 50 61 48
~indicates approximation
Q.41a
Marketing Spectrum/MDA Atlas Van Lines Corporate Relocation Survey-75-
Transportation
Important Attributes when Evaluating a Carrier
50%
70%
79%
80%
89%
95%
0% 20% 40% 60% 80% 100%
Extra Services
Claims Processing
Employee Feedback
Price
On-Time Delivery
Service
Total
Top 3-Box
Q.41b

Marketing Spectrum/MDA Atlas Van Lines Corporate Relocation Survey-76-
Transportation
Important Attributes when Evaluating a Carrier
By Company Size (Salaried Employees)
Top 3-Box
Q.41b
Company Size (Salaried Employees)
Total
Less than 500
500-4999 5000 or more
(Base) (254) (116) (91) (47)
Important Attributes when Evaluating a Carrier (Top 3-Box) Service
95% 95% 94% 98%
On-Time Delivery 89 88 89 94 Price 80 81 78 81
Employee Feedback 79 75 80 85 Claims Processing 70 69 75 64 Extra Services 50 47 52 55
Marketing Spectrum/MDA Atlas Van Lines Corporate Relocation Survey-77-
Transportation
Importance of Certain Aspects of a Move from Employees’ Perspective
56%
61%
70%
77%
81%
0% 20% 40% 60% 80% 100%
Destination Agent
Origin Agent
Driver
Packer
Claims Processing
Total
Top 3-Box
Q.42

Marketing Spectrum/MDA Atlas Van Lines Corporate Relocation Survey-78-
Transportation
Importance of Certain Aspects of a Move
By Company Size (Salaried Employees)
Top 3-Box
Q.42
Company Size (Salaried Employees)
Total
Less than 500
500-4999 5000 or more
(Base) (251)~ (115)~ (90)~ (46)~
Important Aspects of a Move (Top 3-Box)
Claims Processing 81% 77% 86% 83%
Packer 77 70 88 73 Driver 70 66 76 73
Origin Agent 61 55 67 64 Destination Agent 56 49 64 59
~indicates approximation

Marketing Spectrum/MDA Atlas Van Lines Corporate Relocation Survey-79-
Transportation
Contract Carriers
22%
15% 14%
0%
20%
40%
60%
80%
100%
Electronic Transfer of Funds toyour Carrier
On-Line Access with yourCarrier for Shipment
Records/History
On-Line Registration Accesswith your Carrier
Which of the Following does your Company Use?
Q.43

Marketing Spectrum/MDA Atlas Van Lines Corporate Relocation Survey-80-
Geography
Relocation Destinations
83%
15%
8%0%
20%
40%
60%
80%
100%
United States Canada Mexico
Where did your Company Relocate Employees to in 1999?
Q.44

Marketing Spectrum/MDA Atlas Van Lines Corporate Relocation Survey-81-
Geography
Cross-Border Carrier Selection
How Important are the Following Attributes when Choosing a Cross-Border Carrier?
68%
77%
82%
84%
98%
0% 20% 40% 60% 80% 100%
Third Party
Reputation
Scheduling
Price
Service
Top 3-Box
Q.45

Marketing Spectrum/MDA Atlas Van Lines Corporate Relocation Survey-82-
Geography
International Employee Relocations
Average
Q.46
15.71.3 6.8
85.7
0
20
40
60
80
100
Total Less than 500Salaried
Employees
500 - 4999Salaried
Employees
5000+Salaried
Employees

Marketing Spectrum/MDA Atlas Van Lines Corporate Relocation Survey-83-
International
Relative Index of International Employee Relocations
Average Number of International Employee Relocations in 1999: 15.7
Q.47
45
40
15
U.S. to a ForeignCountry
Foreign Country tothe U.S.
Foreign Country toa Foreign Country

Marketing Spectrum/MDA Atlas Van Lines Corporate Relocation Survey-84-
International
International Employee Relocations
Which of the following Services do you Offer to your Employees for International Relocations?
23%
26%
55%
67%
67%
69%
80%
88%
0% 20% 40% 60% 80% 100%
More Leniency on who Insurance Covers
Other
Allowances for Children to Attend CertainSchools
Increased Allowances for Permanent Storage
Extended Per Diem Charges for Hotel
Additional Tax Considerations
Additional Leave Time that Includes Traveland at Least one Visit back to the U.S./Canada
Additional Leave Time
Q.48

Marketing Spectrum/MDA Atlas Van Lines Corporate Relocation Survey-85-
International
International Employee Relocations
Does your Company use Electronic Data Interchange (EDI) Interface Capabilities on International Shipments?
Frequently12%
Seldom23%
Never53%
Always12%
Q.49

Marketing Spectrum/MDA Atlas Van Lines Corporate Relocation Survey-86-
International
International Employee Relocations
How does your Company Assist an Internationally Relocated Employee’s Spouse/Partner in Finding
Employment in the New Location?
Find Employment
Within the Company
6%
Pay Job-Finder's Fee
12%
No Assistance77%
Find Employment Outside the Company
4%
Pay Spouse's Full/Partial Salary until
Hired1% An Average of 35% of
Internationally Relocated Employees in 1999 Used the Company’s Spousal/Partner
Employment Assistance
Q.50

Marketing Spectrum/MDA Atlas Van Lines Corporate Relocation Survey-87-
International
International Transferees who Used Spousal/Partner Employment Assistance
Average
Q.51
35%
47%
23%
41%
0%
20%
40%
60%
80%
100%
Total Less than 500Salaried
Employees
500 - 4999Salaried
Employees
5000+Salaried
Employees

Marketing Spectrum/MDA Atlas Van Lines Corporate Relocation Survey-88-
International
International Employee Relocations
In 1999, were any International Relocations Declined or Failures?
Yes24%
No76%
21%
29%
36%
36%
0% 20% 40% 60% 80% 100%
Lack of spousal/partnerassistance
Lack of adaptability by theemployee
Lack of adaptability by thespouse/partner
Other
The Reasons Cited for International Relocation Failures or Declinations were…
(Base = 14 )
Q.52a, Q.53b