- 1 - © 1999 Boston Millennia Partners Millennia Boston Millennia Partners 30 Rowes Wharf Boston,...
22
- 1 - 1999 Boston Millennia Partners Millennia Boston Millennia Partners 30 Rowes Wharf Boston, MA 02110 Tel. 617 428-5150 Fax 617 428-5160 www.millenniapartners.com Introduction to Venture Capital Tufts University A. Dana Callow, Jr. Managing Partner Boston Millennia Partners November 3, 2005
Transcript of - 1 - © 1999 Boston Millennia Partners Millennia Boston Millennia Partners 30 Rowes Wharf Boston,...

- 1 -© 1999 Boston Millennia Partners
Millennia
Boston Millennia Partners30 Rowes WharfBoston, MA 02110Tel. 617 428-5150Fax 617 428-5160
www.millenniapartners.com
Introduction to Venture Capital
Tufts University
A. Dana Callow, Jr.Managing Partner
Boston Millennia Partners
November 3, 2005

- 2 -© 2004 Boston Millennia Partners
Millennia Partners
Agenda
Background
What does a VC do?
What is the Millennia Investment Strategy?
Current Venture Statistics

- 3 -© 2004 Boston Millennia Partners
Millennia Partners
A. Dana Callow, Jr. Background/Timeline
Director of Jobs for Massachusetts
Board of Trustees at Tufts University
Board of Overseers at Tufts University Medical School
Board of The Center for Private Equity and Entrepreneurship at the Amos Tuck School of Business at Dartmouth College
Founded Boston Millennia Partners (1996)
Co-founded Boston Capital Ventures (1982)
Senior Consultant at Braxton Associates (Deloitte Touche) - (1979-1983)
Application Engineer for Tymshare (acquired by McDonnell-Douglas)- (1974-1977)
Graduated from Tufts University
Graduated with MBA from Tuck School at Dartmouth College
1973 200319981993198819831978

- 4 -© 2004 Boston Millennia Partners
Millennia Partners
Boston Millennia Partners Overview Background
A U.S. private equity partnership specializing in healthcare and life sciences, telecommunications, and information technology investments
100+ years of collective experience blending venture capital, operational and strategic consulting experience
Lead 80% of investment opportunities with an emphasis on business building Investment size: $1-15M
Millennia Management Team 15 private equity investment professionals Dedicated executive search partner $700+ million in capital managed 100+ direct private equity transactions completed 170+ acquisitions completed by portfolio company managements
Core Company Strategy and Active Value-Added Style Focus on early-stage companies applying proven technology Identify companies targeting large, fast growing market segments Invest in strong management teams with outstanding track records Support portfolio company growth with strategic merger and acquisition activity Strategic planning and research support

- 5 -© 2004 Boston Millennia Partners
Millennia Partners
MillenniaPartners’
(Sold to Incyte Genomics, 12/00)
(IPO: 1/97)
Healthcare Information Technology Business Services
Portfolio of Investments
(Sold to Oxford Health Plans, 3/02)
(Sold to Cedara Software, 10/04)
(IPO: 2/00)
(IPO: 8/99)
(IPO: 12/99; Sold to GSI Commerce)
(IPO: 5/98)
(PowerFone)
(Brooks Fiber Properties)
Neoworld(Sold to Nextel Communications, 8/02)
(IPO: 2/00; Sold to SPSS)
(IPO: 3/99)

- 6 -© 2004 Boston Millennia Partners
Millennia Partners
Agenda
Background
What does a VC do?
What is the Millennia Investment Strategy?
Current Venture Statistics

- 7 -© 2004 Boston Millennia Partners
Millennia Partners
What is Venture Capital?
… Investing in high potential, high growth private companies
… Identifying and assisting talented entrepreneurs as they build successful companies
… Helping to drive growth, productivity, and technological innovation
Venture Capital Is...

- 8 -© 2004 Boston Millennia Partners
Millennia Partners
VC Value Chain
(1) Raise Capital
(2) Evaluate Market Segments
(3) Generate Deal Flow
(4) Select Investment Candidates
(5) Negotiate and Structure Investments
(6) Nurture Portfolio Companies
(7) Liquidate / SellPortfolio Companies

- 9 -© 2004 Boston Millennia Partners
Millennia Partners
Venture Capital Investment Path
Boston Millennia Partners Proprietary Research Identification of attractive sectors and investment opportunities
Source deals and initially screen opportunities Meet with management team of potential investment Partner meeting and further screening Due diligence begins Prepare formal Investment Opportunity Summary (IOS) memorandum IOS partners meeting and investment decision Term Sheet submission Legal negotiations Co-investor syndicate selection Due diligence checklist completed Investment closing Active investment management
Ongoing
Week 1
Months 2-4
- 10 -© 2004 Boston Millennia Partners
Millennia Partners
Agenda
Background
What does a VC do?
What is the Millennia Investment Strategy?
Current Venture Statistics
- 11 -© 2004 Boston Millennia Partners
Millennia Partners
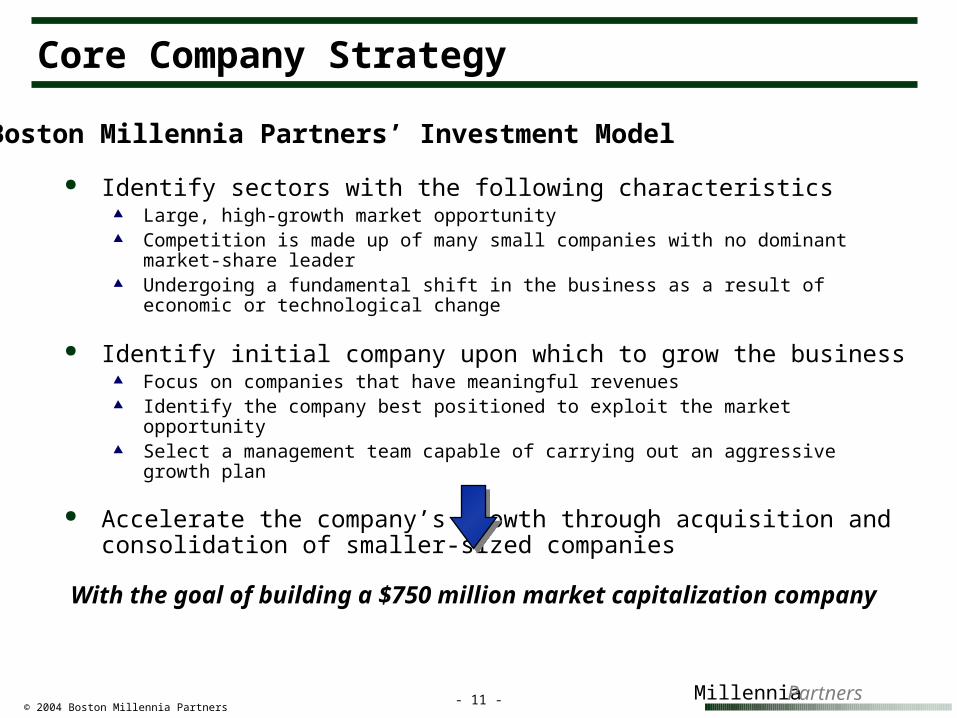
Identify sectors with the following characteristics Large, high-growth market opportunity Competition is made up of many small companies with no dominant market-share leader Undergoing a fundamental shift in the business as a result of economic or technological
change
Identify initial company upon which to grow the business Focus on companies that have meaningful revenues Identify the company best positioned to exploit the market opportunity Select a management team capable of carrying out an aggressive growth plan
Accelerate the company’s growth through acquisition and consolidation of smaller-sized companies
Boston Millennia Partners’ Investment Model
With the goal of building a $750 million market capitalization company
Core Company Strategy

- 12 -© 2004 Boston Millennia Partners
Millennia Partners
Clinical Research Organizations: Growth Rate versus Relative Market Share: 1985-1986
= $10 M in 1986 projected revenue Relative Market Share
Re
ve
nu
e G
row
th R
ate
0%
5%
20%
25%
30%
50%
0.01x0.1x1x2x
Oxford Research International
10%
15%
35%
40%
45%
IBRD
G.H. Besselaar Associates (Covance)
Medical & Technical Research Associates
Pharmakinetics Labs
Harris Labs
Biometric Research Institute
PAREXEL
PACT
CLINDAR
OTHERS(In-house, Universities,
Hospitals, Mom-and-Pops)
Sector Growth = 15%
Portfolio Company Development: Completed Case
Emerging Industry Stage

- 13 -© 2004 Boston Millennia Partners
Millennia Partners
Portfolio Company Development: Completed Case
Millennia managers developed a Core Company through internal growth and strategic acquisition and consolidation:
Expanded product and service offerings Leveraged value through efficiency gains Built market share and profitability Broadened geographic presence Entered new market segments
PAREXEL International CorporationPAREXEL is a leading contract research organization serving pharmaceutical and drug development companies worldwide.
Research
Publishing
Regulatory
Biostatistics(CSI, Inc.)
Medical Affairs
InformationTechnology
Marketing
Boston
United Kingdom
Germany
France
Italy
California
North Carolina
Objective: FDA Approved Drug
AcquisitionsOriginal Investment Related Functions
Key:
Business Segment
Location
Revenues: Market Capitalization: Employees Worldwide: Number of Acquisitions:
$ 658 M
$ 508 M
5,000
29
$ 0.1 M
$ 1 M
5
0
At Investment Current
Role: Originator & Lead Investment Amount: Realized Value:
$ 2.8 M
$ 38.6 M

- 14 -© 2004 Boston Millennia Partners
Millennia Partners
Agenda
Background
What does a VC do?
What is the Millennia Investment Strategy?
Current Venture Statistics

- 15 -© 2004 Boston Millennia Partners
Millennia Partners
VC Industry: Where were we in 2002?

- 16 -© 2004 Boston Millennia Partners
Millennia Partners
Venture Capital Activities: 5 Year Summary 1999-2000 investment frenzy in all market segments
IPO expectations and new business models based on internet and Y2K impact
2001-2003 The “hangover” and clean-up/downsizing of many portfolio company investments Negative 1st quartile returns
Late 2003-4 Continued clean-up: The “walking wounded” survive The beginning of new company investing Fresh fundraising attempted on a broader scale
2005 Increasing liquidity with selected IPOs and M&A activity Stable investment activity Capital “overhang” period ended
2006 – Forward Venture returns regain top place in IRRs but with significant variability among managers 1st quartile returns significantly positive and less correlated with public markets Reduced start-up and early stage investment capital

- 17 -© 2004 Boston Millennia Partners
Millennia Partners
VC Industry: Where are we in 2005?VC Industry: Where are we in 2005?

- 18 -© 2004 Boston Millennia Partners
Millennia Partners
Historical “Take-off Periods” For Value CreationAfter initial investment in early stage venture investing
1x
5x
10x
1 2 3 4 5 6 7 8 9 10 11 12
1997-2003
1985-1997 2003-2010
Years
Co
mp
any
“Val
ue”

- 19 -© 2004 Boston Millennia Partners
Millennia Partners
Commitments to U.S. VC funds
$18.8$17.8
$9.2$13.1
$50.5
$82.8
$58.8
$26.9
$17.1$12.7
$7.0$5.4$6.7$2.8
$0
$20
$40
$60
$80
$100
1992 1993 1994 1995 1996 1997 1998 1999 2000 2001 2002 2003 2004 2005
To
tal C
om
mit
me
nts
to
VC
Fu
nd
s (
$ B
illio
ns
)
Fundraising is stabilizing
Source: VentureSource/Venture One
* Annualized 3Q 2005
*

- 20 -© 2004 Boston Millennia Partners
Millennia Partners
$4.2$6.4
$9.2$13.1
$17.9
$49.5
$94.6
$36.2
$22.0$19.1
$21.3 $20.2
$0
$20
$40
$60
$80
$100
1994 1995 1996 1997 1998 1999 2000 2001 2002 2003 2004 2005*
Ven
ture
Cap
ital
In
vest
ed (
$ B
illi
on
s)
U.S. Venture Capital Investment Activity
Source: NVCA / Venture Economics
* Annualized 3Q 2005
Investment is stabilizing

IPO Exits as a Percentage of Total Financings are Decreasing
969
1,315
1,912
2,211
2,547
4,586
2,3652,131 2,199
2,024
6,303
3,253
3967222022202250
68120216144115500
1,000
1,500
2,000
2,500
3,000
3,500
4,000
4,500
5,000
1994 1995 1996 1997 1998 1999 2000 2001 2002 2003 2004 2005
Venture Capital Financings
Venture-backed IPOs
372 Venture-backed IPO's between 2000 and 2005 – but only 128 during last 3 years
* (%) is defined as # of IPOs in Year x+4 / No. of Investments in Year x (A rough gauge for how many of Year x’s Venture Capital Financings go on to an IPO in four years.)** Annualized Q3 2004Source: VentureSource/VentureOne, PWC/Venture Economics
**
Nu
mb
er o
f D
eals
(7.0%)*
(19.0%)
(10.6%)
(1.0%)
(0.8%)
(0.5%)(1.1%)
- 21 -Millennia Partners
Confidential
(1.2%)

- 22 -© 2004 Boston Millennia Partners
Millennia Partners
IPO Companies Older in 2003
3.53.2
2.8 2.83.1
4.5
3.6
5.7 5.7 5.7
0
1
2
3
4
5
6
1996 1997 1998 1999 2000 2001 2002 2003 2004 2005
Yea
rs
Time from Initial Equity Funding to IPO
Older Companies Going Public - Years to IPO Increases
Source: VentureOne
In 2005, the average IPO is for a five and a half-year-old company